The Grism Lens-Amplified Survey from Space (GLASS). VI. Comparing the Mass and Light in MACSJ0416.1-2403 using Frontier Field imaging and GLASS spectroscopy
Abstract
We present a strong and weak gravitational lens model of the galaxy cluster MACSJ0416.1-2403, constrained using spectroscopy from the Grism Lens-Amplified Survey from Space (GLASS) and Hubble Frontier Fields (HFF) imaging data. We search for emission lines in known multiply imaged sources in the GLASS spectra, obtaining secure spectroscopic redshifts of 31 multiple images belonging to 16 distinct source galaxies. The GLASS spectra provide the first spectroscopic measurements for 6 of the source galaxies. The weak lensing signal is acquired from 884 galaxies in the F606W HFF image. By combining the weak lensing constraints with 15 multiple image systems with spectroscopic redshifts and 9 multiple image systems with photometric redshifts, we reconstruct the gravitational potential of the cluster on an adaptive grid. The resulting total mass density map is compared with a stellar mass density map obtained from the deep Spitzer Frontier Fields imaging data to study the relative distribution of stellar and total mass in the cluster. We find that the projected stellar mass to total mass ratio, , varies considerably with the stellar surface mass density. The mean projected stellar mass to total mass ratio is (stat.), but with a systematic error as large as , dominated by the choice of the IMF. We find agreement with several recent measurements of in massive cluster environments. The lensing maps of convergence, shear, and magnification are made available to the broader community in the standard HFF format.
Subject headings:
galaxies: clusters: individual (MACS J0416.1-2403)1. Introduction
Gravitational lensing by clusters of galaxies is now a commonplace tool in astrophysics and cosmology (see Treu & Ellis, 2014 for a recent review). The magnification of background objects produced by cluster lenses has been used to find extremely distant and faint galaxies (e.g. Zheng et al., 2012; Coe et al., 2013; Zitrin et al., 2014). As a result, clusters of galaxies are becoming increasingly popular tools for studying the epoch of reionization. Cluster-scale lensing has also been used to determine the spatial distribution of the total cluster mass, revealing insights into physics of dark matter and structure formation (e.g. Clowe et al., 2006; Bradač et al., 2006; Sand et al., 2008; Newman et al., 2013; Sharon et al., 2014; Merten et al., 2015).
The Hubble Frontier Fields (HFF) program (PI Lotz; Lotz et al. in prep.) is imaging six clusters of galaxies and six parallel fields to extreme depths in seven optical and near-infrared (NIR) bands, using the Advanced Camera for Surveys (ACS) and the Wide Field Camera 3 (WFC3). A principal objective of the HFF initiative is to search for magnified objects behind the six clusters. Lens models providing accurate magnification maps are needed to determine the unlensed (intrinsic) properties of the background objects. Lens models are primarily constrained by multiply imaged galaxies and weakly sheared sources. The added depth of the HFF images allows one to identify more multiply imaged galaxies, thus increasing the number of constraints and therefore the quality of the lens models. The CLASH111The Cluster Lensing And Supernova Survey with Hubble (CLASH); http://www.stsci.edu/~postman/CLASH/Home.html images (limiting magnitude 27 AB mag for a 5 point source Postman et al., 2012) revealed candidate multiple image systems per cluster (e.g. Zitrin et al., 2015). The release of the HFF images (limiting magnitude 29 AB mag for a 5 point source) has approximately tripled the number of known multiply imaged galaxies for the four clusters analyzed so far (e.g. Jauzac et al., 2015a, 2014; Diego et al., 2015b; Wang et al., 2015; Treu et al., 2016).
While the added depth of the HFF imaging has enabled the photometric identification of a greater number of multiply imaged systems, the redshifts of the new systems remain uncertain without spectroscopic follow up. The redshifts must be well-constrained in order to be useful for the lens models. It has recently been shown that the number of spectroscopic systems has a strong influence on the quality of the lens model Rodney et al. (2015a, b). Photometric redshifts are useful when spectroscopy is lacking, but they can be prone to catastrophic errors, especially for sources at or near the limiting magnitude of the image. An alternative approach to photometric redshifts is to estimate the redshift of new multiply imaged systems using an existing model (e.g. Jauzac et al., 2014). This method can potentially introduce confirmation bias in the modeling process. That is, unless a correct lens model has already been obtained, the predicted redshifts of the multiply imaged galaxies may be incorrect, and the uncertainties may be underestimated. Unless decided upon in advance, different approaches to determining redshifts in the absence of spectroscopic data can lead to different constraints among teams modeling the same cluster.
It is therefore paramount to obtain spectroscopic redshifts for the multiply imaged systems in the HFF. The Grism Lens-Amplified Survey from Space (GLASS) data for MACSJ0416.1-2403 (MACSJ0416 hereafter) is one such effort. GLASS222http://glass.astro.ucla.edu,333https://archive.stsci.edu/prepds/glass/ is a large HST program that has obtained deep NIR grism spectroscopy in the fields of ten clusters, including all six HFF clusters. For details on the observation strategy and data products of GLASS, see Schmidt et al. (2014) and Treu et al. (2015).
In this paper, we present new spectroscopic redshifts from GLASS and combine them with redshifts from the literature to model the HFF images of MACSJ0416. When spectroscopy is not available, we use photometric redshifts tested against GLASS spectra of singly-imaged objects. The paper is organized as follows. In Section 2 we give an overview of the optical and NIR HFF and mid-IR Spitzer Frontier Fields imaging data, as well as the GLASS NIR spectroscopic data. In Section 3 we briefly cover the reduction and analysis of the GLASS data. In Section 4 we describe the process of selecting the set of multiple images used to constrain the lens model and discuss the GLASS spectroscopic measurements. In Section 5 we present our lens model and compare it to other lens models of the cluster using similar constraints. In Section 6, we study the relative distribution of stellar and total mass. Finally, we summarize our results in Section 7. We adopt a standard concordance cosmology with , and . All magnitudes are given in the AB system (Oke, 1974).
2. Data
Discovered by the MACS survey (Ebeling et al., 2001) as a result of its large X-ray luminosity ( erg ; Mann & Ebeling, 2012), MACSJ0416 was found to likely be a binary head-on merging cluster system. The first optical and NIR HST imaging data of MACSJ0416 were obtained by the CLASH survey. The ESO VIMOS large program CLASH-VLT (186.A-0798; PI: P. Rosati), a spectroscopic campaign designed to obtain thousands of optical spectra in the CLASH cluster fields with VIMOS on the Very Large Telescope (VLT), recently found further evidence for the merging state of the cluster (Balestra et al., 2015).
Here, we present lens modeling and spectroscopy results using the deepest optical and NIR imaging and spectroscopy data newly acquired with Hubble, as part of the HFF initiative (2.1) and the GLASS program (3), following our study of Abell 2744 in Wang et al. (2015). We also use mid-IR imaging data acquired with the Spitzer Space Telescope (2.2; Werner et al., 2004) obtained by the DDT program #90258 (Capak et al. in prep).
2.1. Hubble Frontier Fields Imaging
Ultra deep HST images of six clusters (Abell 370, Abell 2744, MACSJ2129, MACSJ0416, MACSJ0717, and MACSJ1149) are being obtained as part of the HFF 444http://www.stsci.edu/hst/campaigns/frontier-fields. The 5 point source limiting magnitudes are roughly 29 ABmag in both the ACS/optical (F435W, F606W, F814W) and WFC3/IR filters (F105W, F125W, F140W, F160W). Observations of MACSJ0416 were completed in September, 2014.
2.2. Spitzer Frontier Fields
As a part of the HFF campaign, deep Spitzer/IRAC images in channels 1 and 2 (at m and m, respectively) were taken through the Spitzer Frontier Fields program555http://ssc.spitzer.caltech.edu/warmmission/scheduling/approvedprograms/ddt/frontier/. In this work, we use the full-depth Spitzer/IRAC mosaics for MACS0416 released by Capak et al. (in prep). The IRAC mosaics reach hr depth per channel in the HFF primary field and the parallel field ( to the west of the primary field). Due to Spitzer roll angle constraints and low-background requirements, six additional flanking fields exist around the HFF primary and parallel fields with uneven coverage in channels 1 and 2. The exposures were drizzled onto a pix-1 grid, and within the HST primary field footprint there are frames (with FRAMETIME s) per output pixel. In the primary and parallel fields, the nominal 5 depth of a point source reaches 26.6 mag at 3.6 m and 26.0 mag at 4.5 m. However, this sensitivity might not be reached near the cluster center due to blending with cluster members and the diffuse intra-cluster light (ICL).
3. GLASS Observation and Data Reduction
GLASS (GO-13459; PI: Treu; Schmidt et al., 2014; Treu et al., 2015) observed 10 massive galaxy clusters with the HST WFC3-IR G102 and G141 grisms between December 2013 and January 2015. Each of the clusters targeted by GLASS has deep multi-band HST imaging from the HFF (2.1) and/or from CLASH. Each cluster is observed at two position angles (P.A.s) approximately 90 degrees apart to facilitate deblending and extraction of the spectra. Short exposures are taken through filters F105W or F140W during every visit to help calibrate the spectra, model the background, model the contaminating objects, and identify supernovae by difference imaging. The total exposure time per cluster is 14 orbits, distributed as to provide approximately uniform sensitivity across the entire wavelength coverage 0.8m to 1.7m. Parallel observations are taken with the ACS F814W direct image and G800L grism to map the cluster infall regions. Here we focus on the NIR data on the MACSJ0416 cluster core.
The two P.A.s of GLASS data analyzed here were taken on November 23 and 30, 2014 (P.A. = 164∘) and January 13 and 18, 2015 (P.A. = 247∘), respectively. The resulting total exposure times for the individual grism observations are shown in Table 1. Prior to reducing the complete GLASS data, He Earth-glow is removed from individual exposures (Brammer et al., 2014).
| Filter | P.A./(deg.) | /(s) |
|---|---|---|
| G102 | 164 | 10929 |
| G102 | 247 | 10929 |
| G141 | 164 | 4312 |
| G141 | 247 | 4312 |
| F105W | 164 | 1068 |
| F105W | 247 | 1068 |
| F140W | 164 | 1573 |
| F140W | 247 | 1423 |
Note. — Exposure times are for the cluster core of MACSJ0416 only.
The GLASS observations are designed to follow the 3D-HST observing strategy (Brammer et al., 2012) and were processed with an updated version of the 3D-HST reduction pipeline666http://code.google.com/p/threedhst/ (Momcheva et al., 2015). Below we summarize the main steps in the reduction process of the GLASS data but refer to Brammer et al. (2012) and Momcheva et al. (2015) and the GLASS survey paper (Treu et al., 2015) for further details. The GLASS data were taken in a 4-point dither pattern identical to the one shown in Figure 3 of Brammer et al. (2012) to reduce susceptibility to bad pixels and cosmic rays and to improve sub-pixel sampling of the WFC3 point spread function. At each dither position, a direct and a grism exposure were taken. The direct images are commonly taken in the filter with passband overlapping in wavelength with the grism, i.e., F105W for G102 and F140W for G141. However, to accommodate searches for supernovae and the characterization of their light curves in GLASS clusters, each individual visit is designed to have imaging in both filters. Hence several pairs of F140W+G102 observations exist in the GLASS data. This does not affect the reduction or the extraction of the individual GLASS spectra.
The individual exposures were combined into mosaics using AstroDrizzle from the DrizzlePac software package (Gonzaga, 2012). All
direct image exposures were aligned using tweakreg, with background subtracted from the exposures by fitting a second
order polynomial to each of the source-subtracted exposures. We subtracted the background of the grism exposures using the master sky images and algorithm presented by Brammer et al. (2015). The individual sky-subtracted exposures were combined using a pixel scale of per
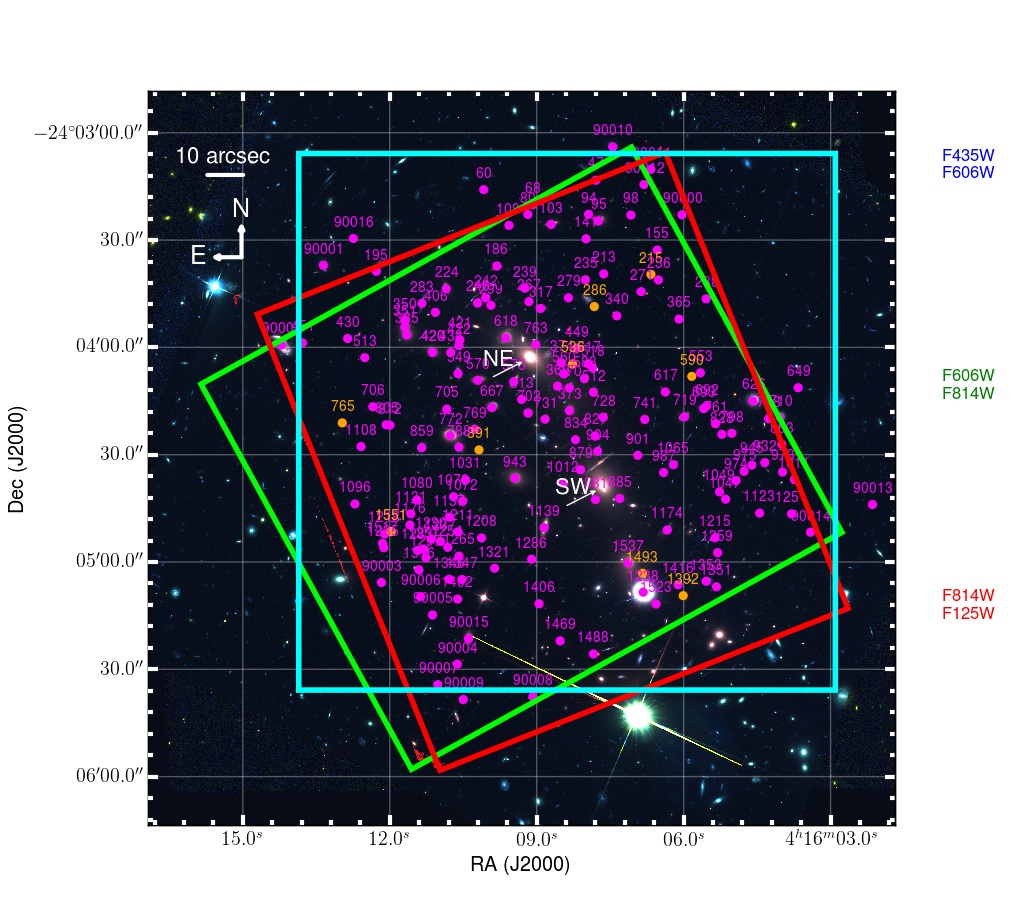
pixel (half a native WFC3 pixel). In Figure 1 we show a color composite image of MACSJ0416,
using the optical and NIR coadded imaging from HFF and CLASH combined with the NIR imaging from GLASS.
The green (red) square shows the GLASS footprint for P.A. = 164∘ (P.A. = 247∘).
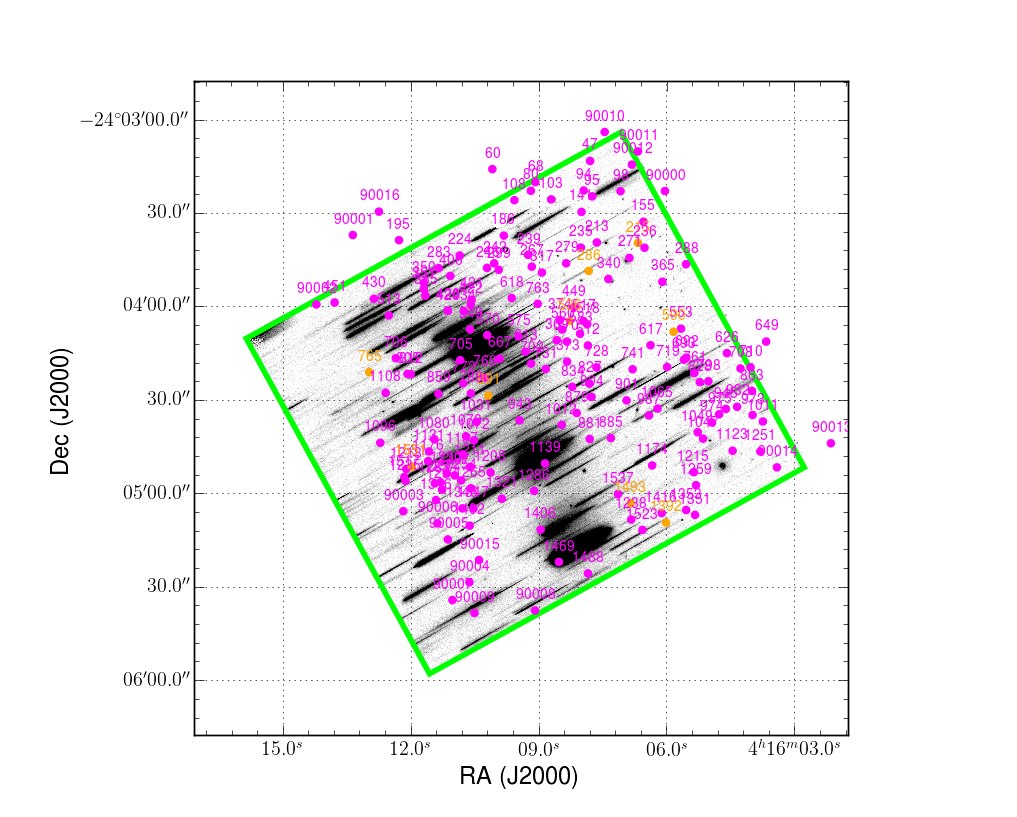
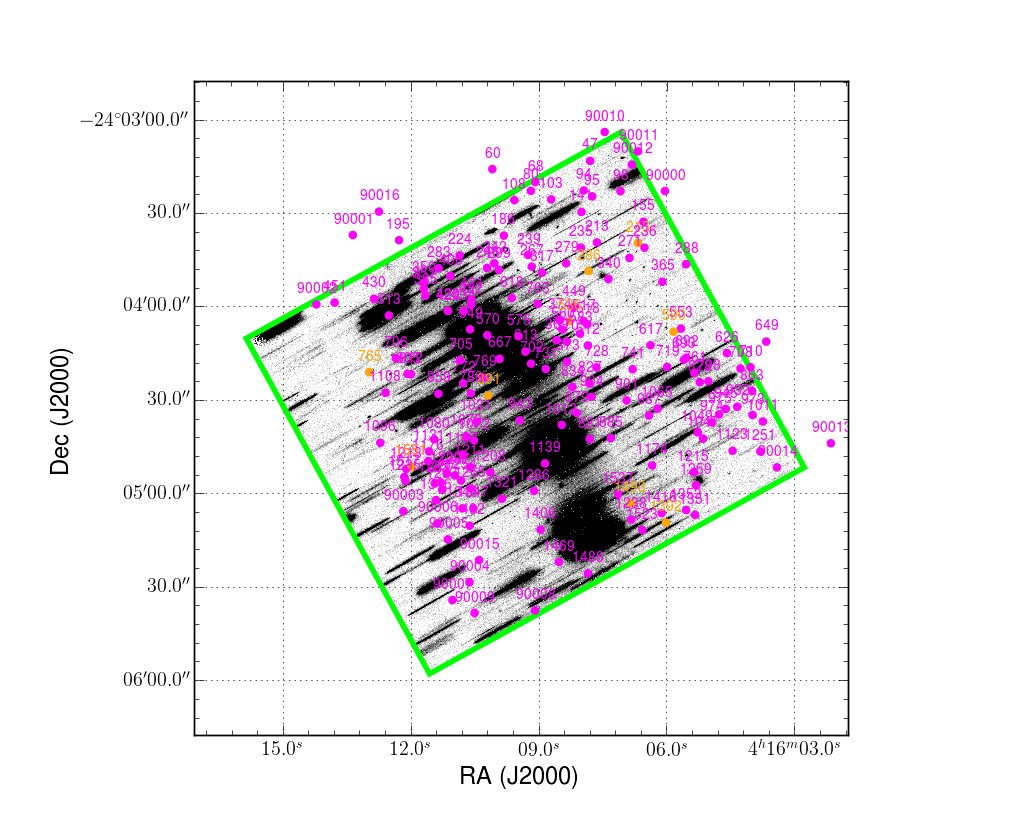
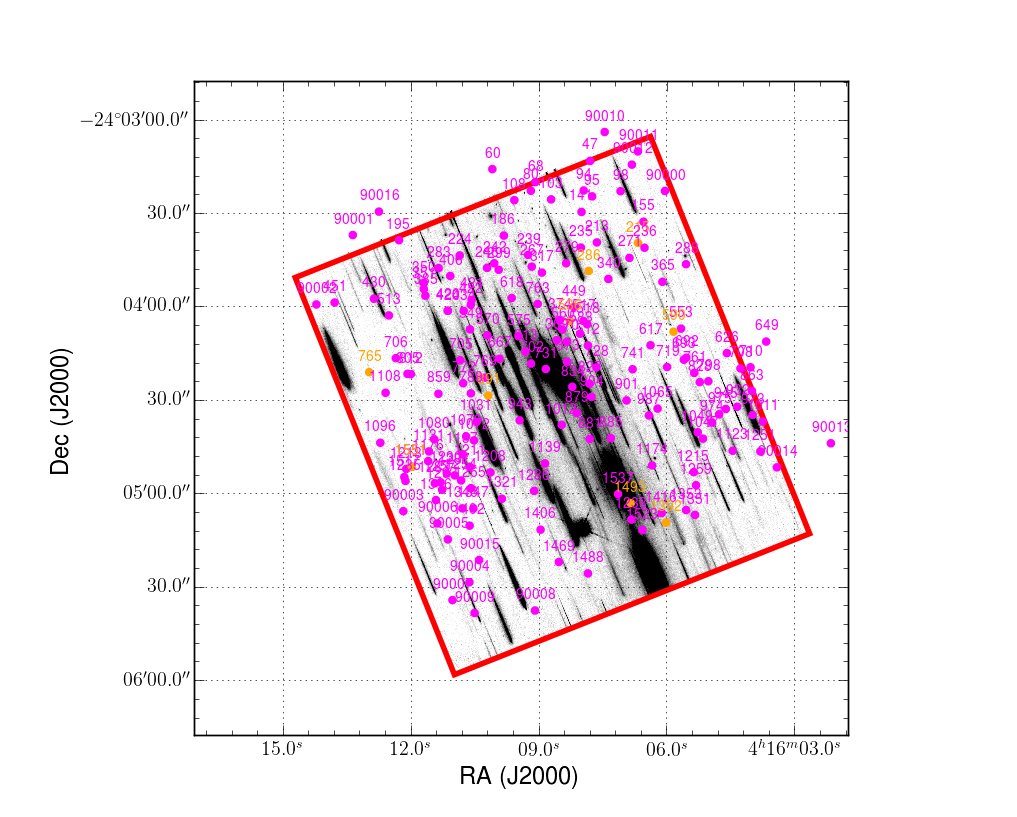
The fiducial cluster redshift used by the HFF lens modeling team and adopted throughout the paper is . The two brightest cluster galaxies (BCGs) (NE and SW) are labeled in the figure. The NE BCG and the SW BCG are at redshifts and , respectively (Balestra et al., 2015). Figure 2 shows the full field-of-view
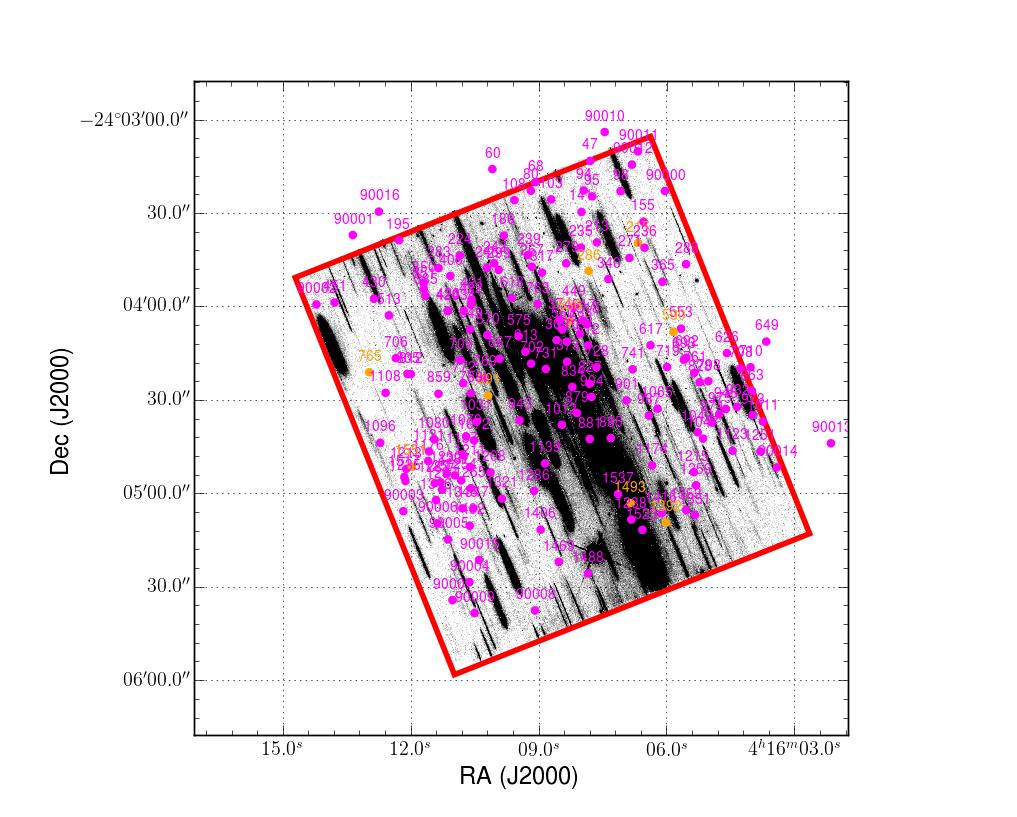
mosaics of the two NIR grisms (G102 on the left and G141 on the right) at the two GLASS position angles for MACSJ0416. The contamination model was computed and one- and two-dimensional spectra were extracted from 22 “interlaced” versions of the grism mosaics following the procedure outlined in detail by Momcheva et al. (2015), where the source positions and extent were determined with the SExtractor (Bertin & Arnouts, 1996) software run on the corresponding direct image mosaics.
4. Identification of multiple images
In this section we describe how we identify and vet multiple image candidates using the HFF imaging (4.1) and GLASS spectroscopic (4.2 and 4.3) data.
4.1. Imaging data: identification and photometric redshifts
Zitrin et al. (2013) published the first detailed strong lensing analysis of MACSJ0416. They identified over 70 multiple images (23 source galaxies) in the CLASH imaging data, making MACSJ0416 the most prolific CLASH cluster in terms of multiply imaged galaxies (Zitrin et al., 2015). With the addition of the much deeper HFF data, 272 multiple images (92 source galaxies) have been identified in MACSJ0416 (Jauzac et al., 2014; Diego et al., 2015a; Kawamata et al., 2015). We list all of the multiple images in Table 2 and show their positions behind the cluster in Figure 3.
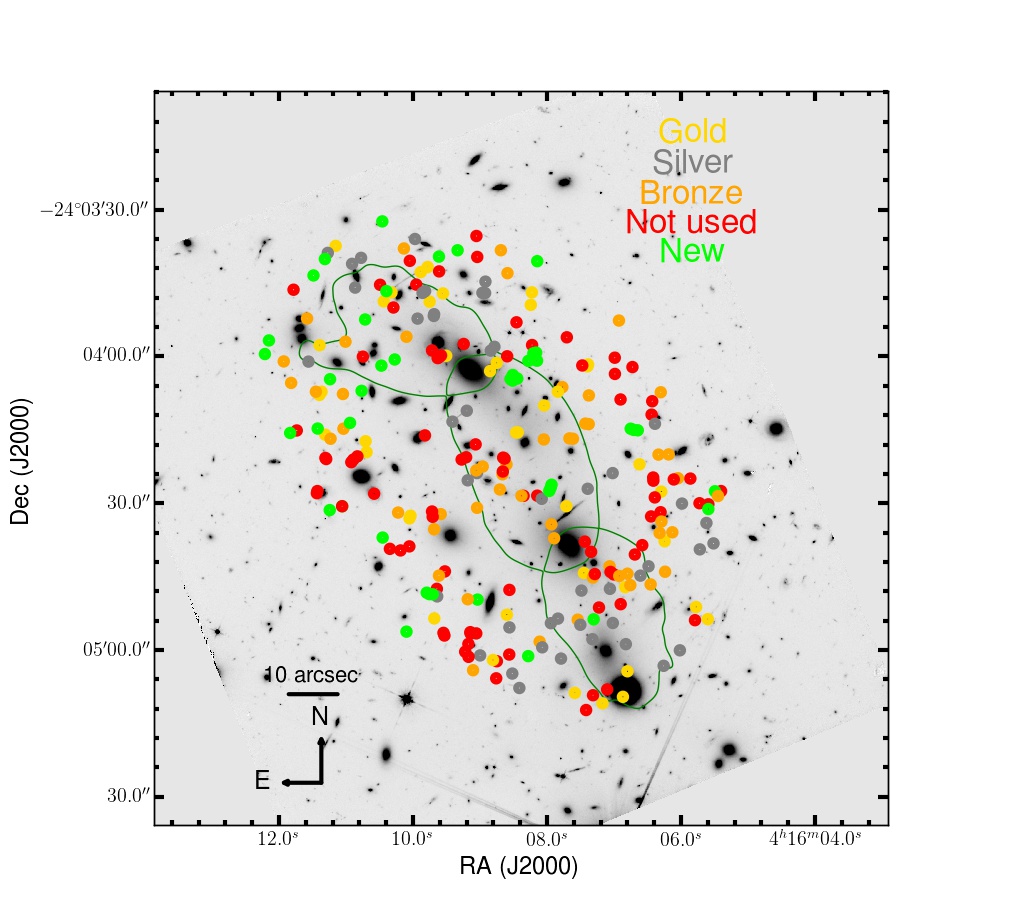
Several efforts have been made to spectroscopically confirm the redshifts of the strongly-lensed galaxy candidates in MACSJ0416 (Zitrin et al., 2013; Jauzac et al., 2014; Richard et al., 2014; Johnson et al., 2014; Grillo et al., 2015; Balestra et al., 2015, Rodney et al. in prep.). Images belonging to systems 1, 2, 3, 4, 5, 7, 10, 13, 14, 16, 17, 23, 26, and 28 have been targeted by multiple authors, leading to agreement in the spectroscopic redshift within the uncertainties, with the exception of system 14. This system will be discussed in more detail in Section 4.2. When spectroscopy is lacking, confirming that images belong to the same source is more difficult. Inspired by a previous collaborative effort to model the HFF clusters as well as the recent rigorous vetting procedure developed by Wang et al. (2015), a new collaborative effort was undertaken by seven teams simultaneously modeling the HFF galaxy clusters to assign quality grades to the multiple image candidates. The grading was done independently by each of the seven teams and focused on ensuring consistency of the morphologies and colors of multiple images of the same source galaxy. Each team assigned each multiple image candidate a grade on a scale from 1-4, where 1 meant secure and 4 meant untrustworthy. The results from the grading process were divided into the categories: “Gold,” “Silver,” and “Bronze.” The Gold category was reserved for spectroscopically confirmed multiple images that also received an average grade of . The multiple images confirmed using GLASS spectroscopy that are presented in this work were included in the Gold sample. The Silver category corresponded to images lacking spectra but receiving a unanimous vote of 1. Bronze was assigned to images lacking spectra and received an average grade of but . Images lacking spectra and receiving an average grade of were not used by the modeling teams.
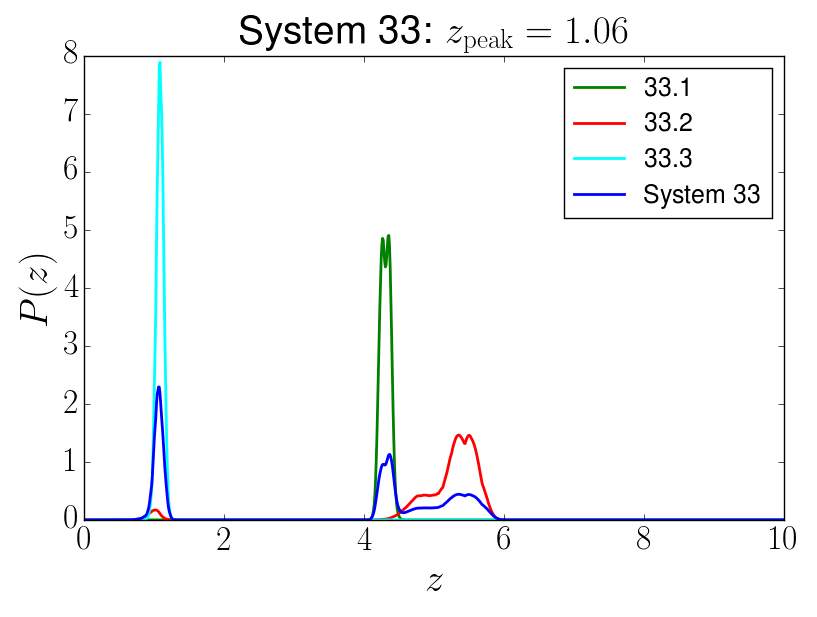
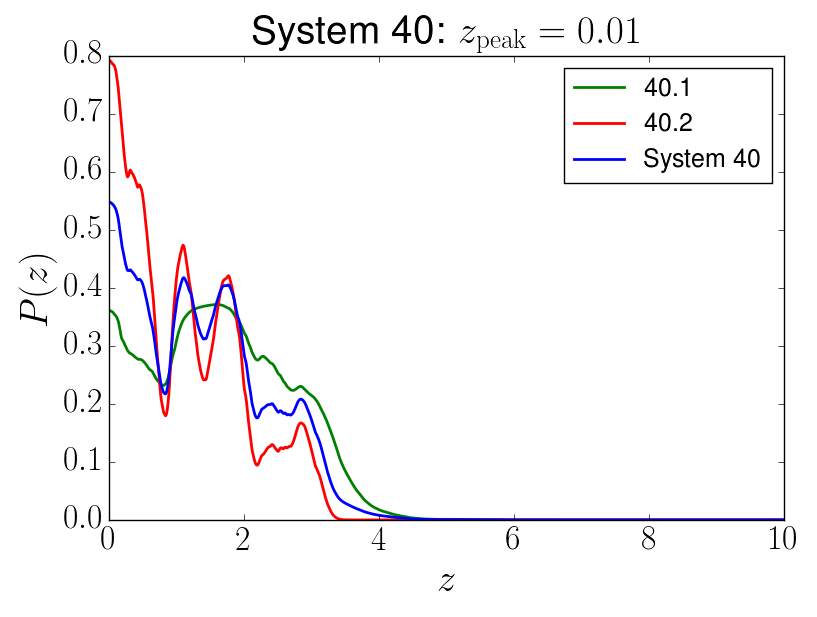
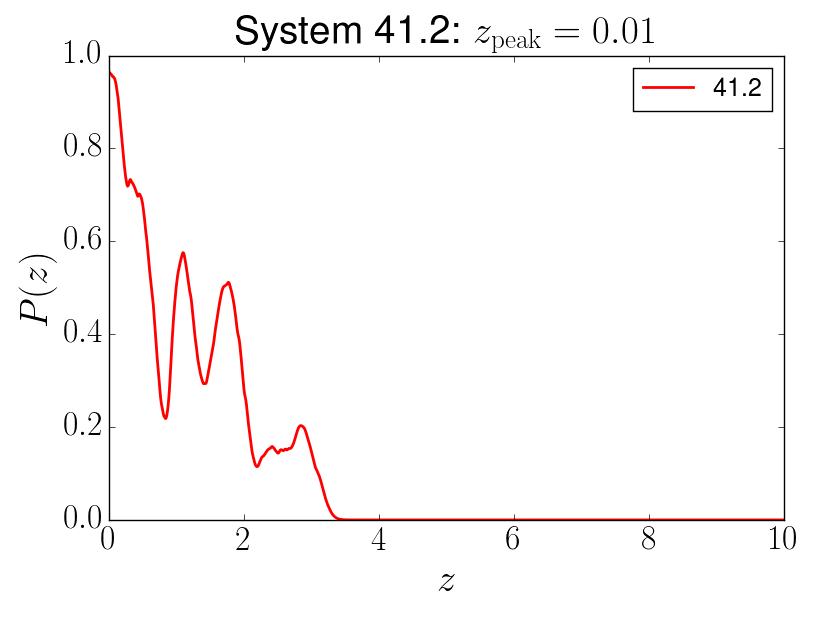
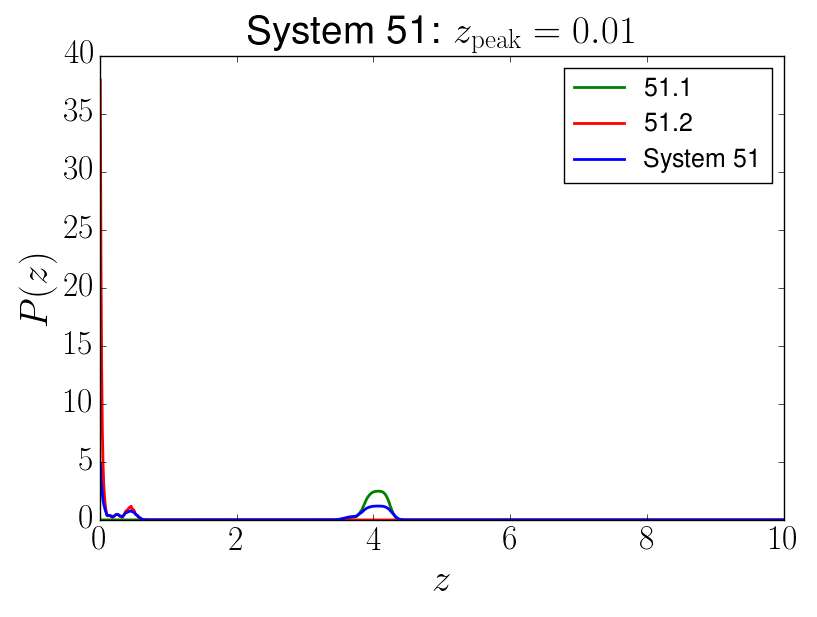
For our lens model, we decided to only consider multiple images in the Gold and Silver categories, which included 80/31 total multiple images/systems. In order to use a Silver multiple image in the lens model, it was necessary to estimate its redshift. Because the grading was done via visual inspection, it was not guaranteed that every multiple image would be detected in our photometric catalog. Of the 31 systems comprising Gold and/or Silver images, only 26 were included in our lens model. Five systems (systems 8, 33, 40, 41, and 51, all are graded Silver) are not included in our model due to problems with photometry and redshift. Neither of the two Silver images in system 8 was detected in the photometric catalog, most likely due to their faintness and proximity to bright cluster members. Systems 33, 40, and 51 had poorly constrained photometric redshift PDFs. Only a single image in system 41 was detected in the photometric catalog, and its redshift was too poorly constrained to use in the lens model. The redshift PDFs for the multiple images in systems 33, 40, 41, and 51 are shown in Appendix A. For the remaining Silver images, it was necessary to compute photometric redshifts to include them in the lens model. For these systems we used photometric redshifts obtained by the ASTRODEEP team (Castellano et al., 2015, submitted; Merlin et al. 2015, submitted). The ASTRODEEP photometric redshifts were obtained through minimization over the observed HST+IR HFF bands using PEGASE 2.0 (Fioc & Rocca-Volmerange, 1997). For more details see Castellano et al., (2015, submitted) and Merlin et al. (2015, submitted). The ASTRODEEP catalogs were built after subtracting ICL emission and the brightest foreground galaxies from the images in order to maximize the efficiency of high-redshift source detection and to obtain unbiased photometry. The catalogs employed the seven HFF filters: F435W, F606W, F814W, F105W, F125W, F140W, and F160W, a HAWK-I -band image (G. Brammer, in prep), and Spitzer IRAC [3.6] and [4.5] channels. The ASTRODEEP catalogs used two different detection images to create separate photometric catalogs. One catalog used F160W as the detection image, whereas the other used a stacked NIR image. To maximize the number of multiply imaged galaxies that we could detect, we merged the two catalogs into a single photometric catalog for this work.
Combining the photometric redshift information for multiple images of the same source provides a tighter constraint than a single measurement. We used a hierarchical Bayesian method similar to that used in Wang et al. (2015) (see also Press 1997 and Dahlen et al. 2013) to combine the multiple photometric redshift probability density functions for each image of a source into one for each source. We used the peak of the combined (hereafter referred to as ) as input to the lens model. In summary, the hierarchical Bayesian method considers the concept of the probability that each input is unreliable (). It uses an input in the calculation of the combined for the system if it is reliable, otherwise it uses a flat (noninformative) . The method then marginalizes over all values of using an assumed prior on to calculate the posterior for the entire system. We assume a flat prior in for , i.e., that each has at least 50% chance of being informative. This has the effect that for some systems with two images, the posterior of the system has a small but non-zero floor due to the contribution from a noninformative . Because the floor inflates the photometric redshift uncertainty, we subtract the floor from all posterior ’s before calculating confidence intervals. Subtracting the floor does not change the peak redshift of the posterior .
4.2. GLASS spectroscopy
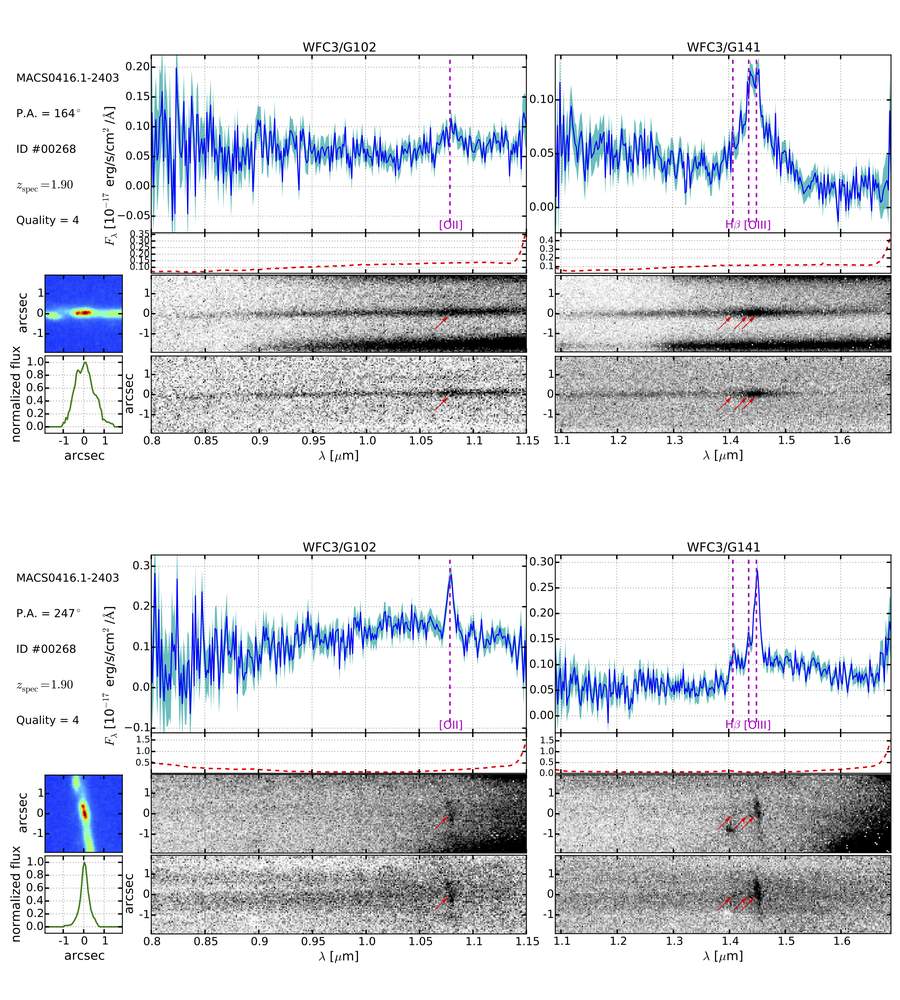
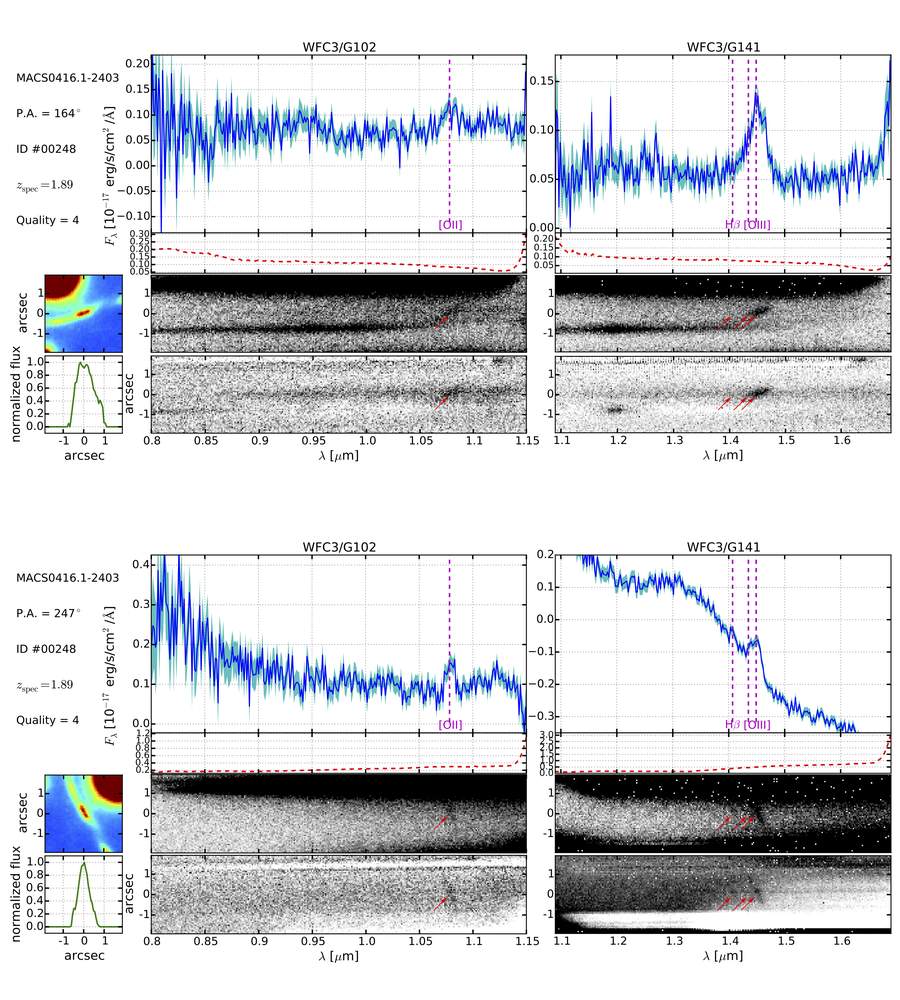
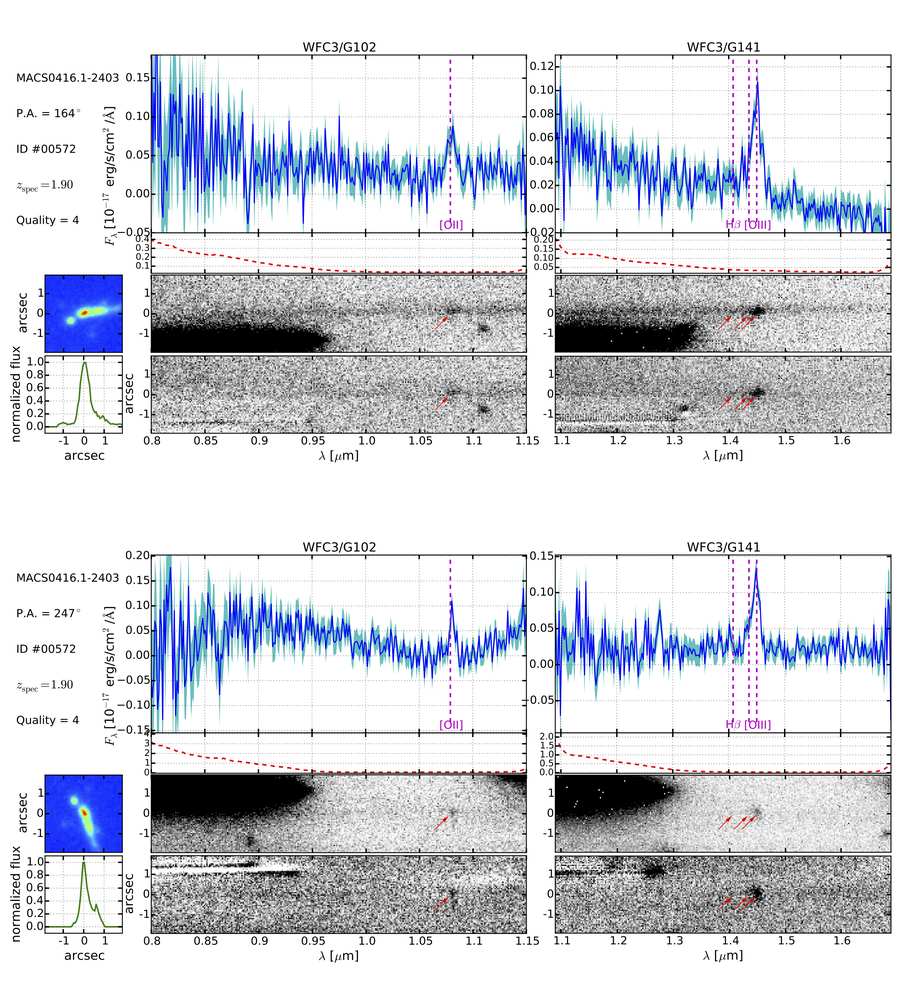
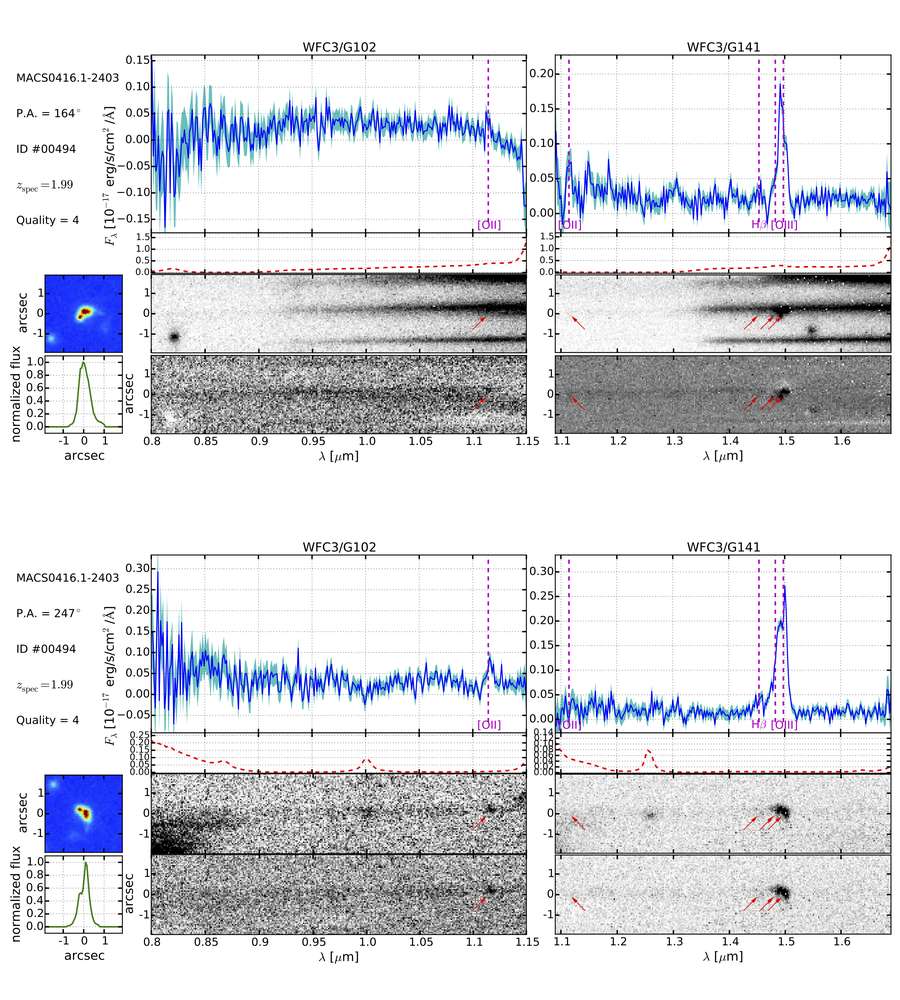
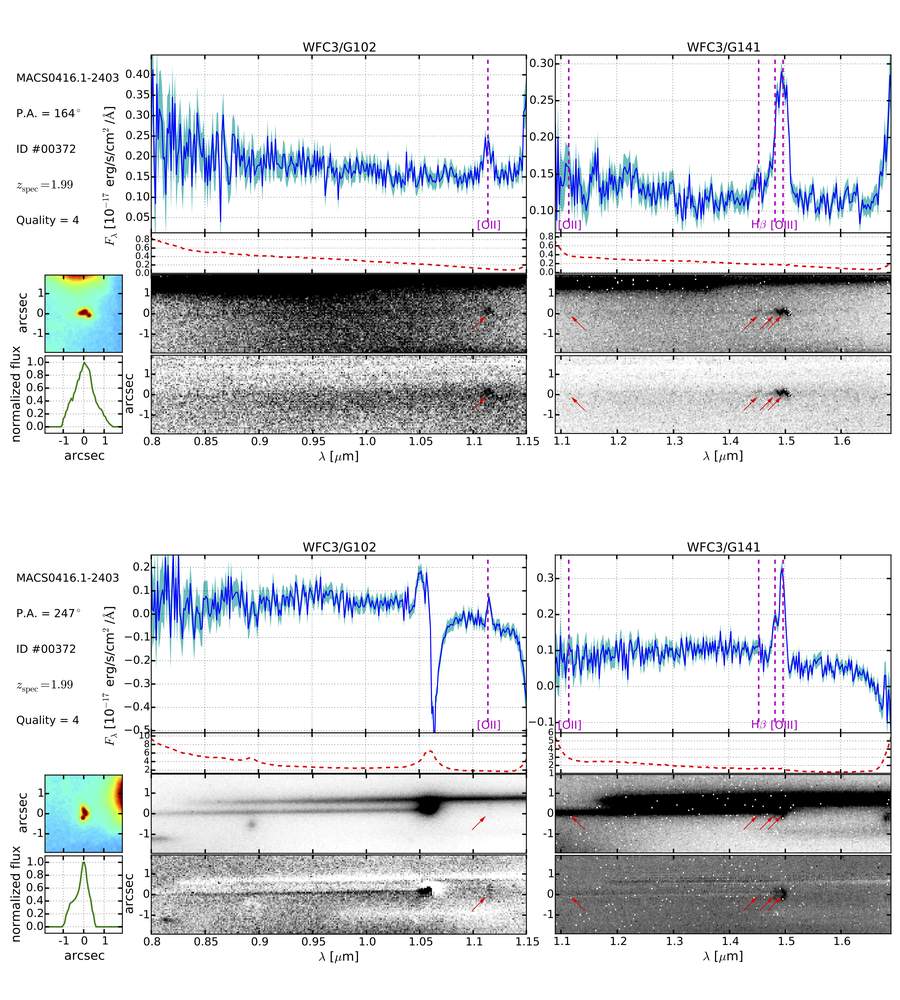
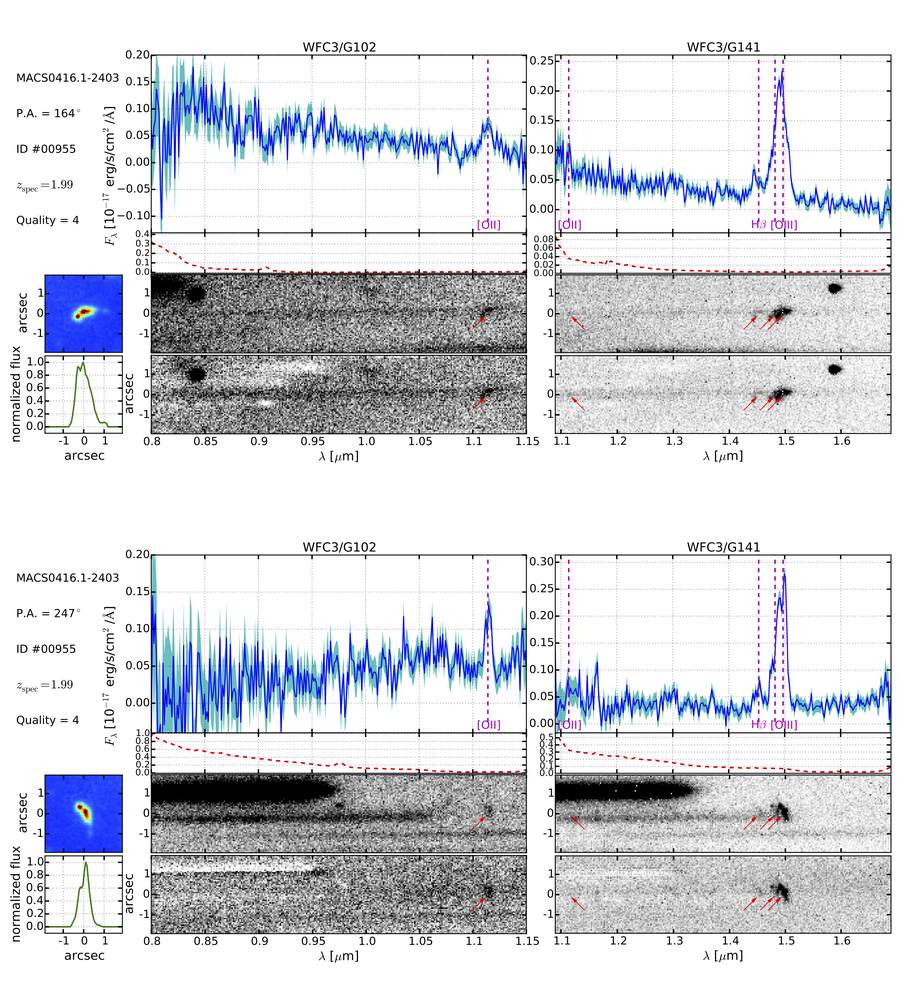
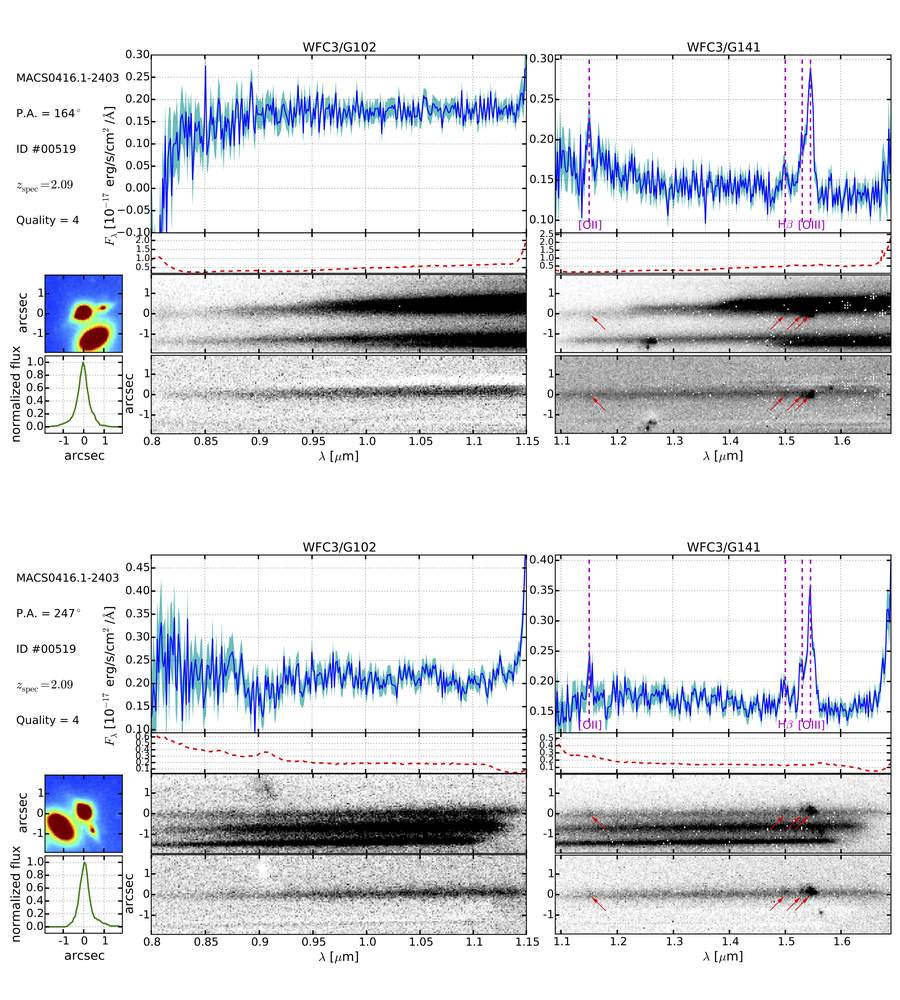
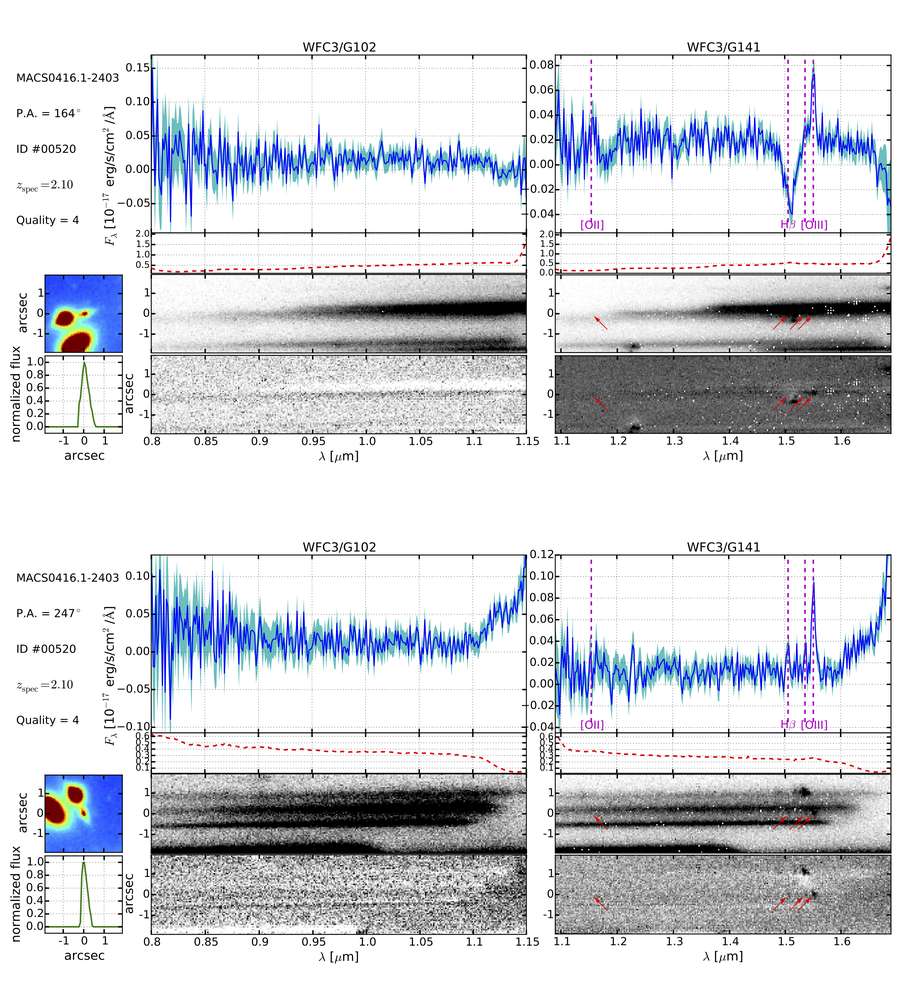
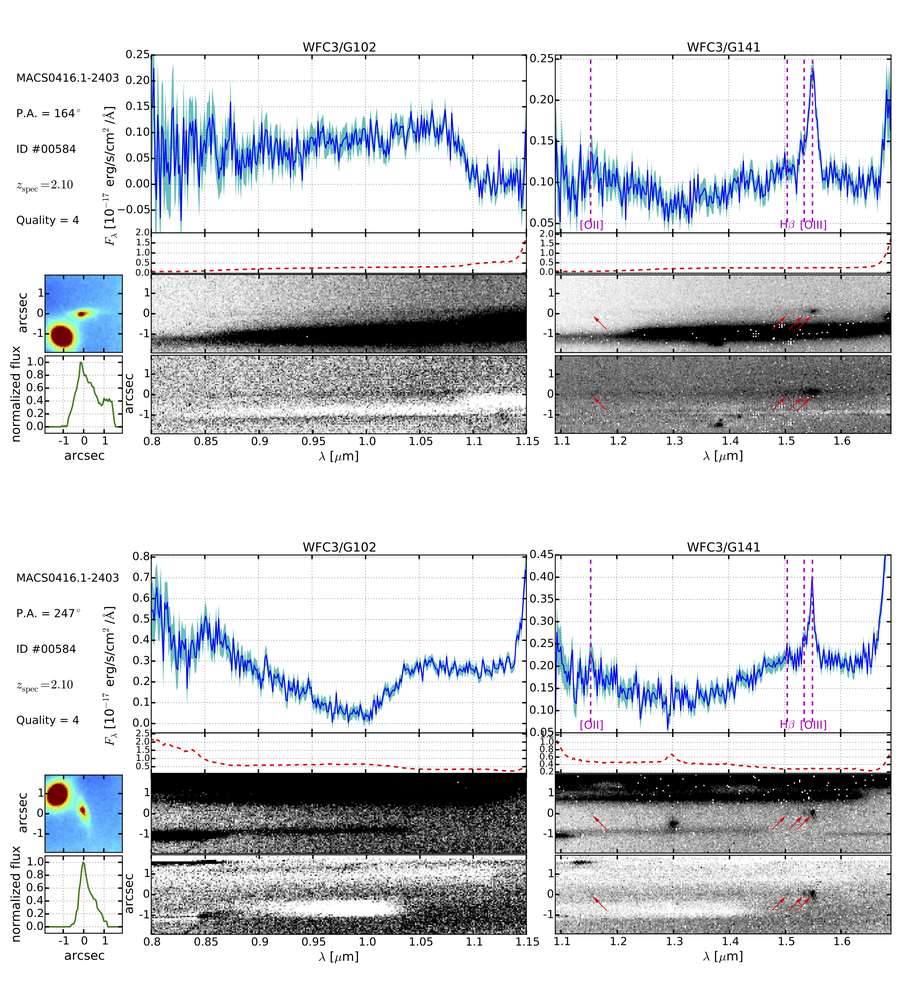
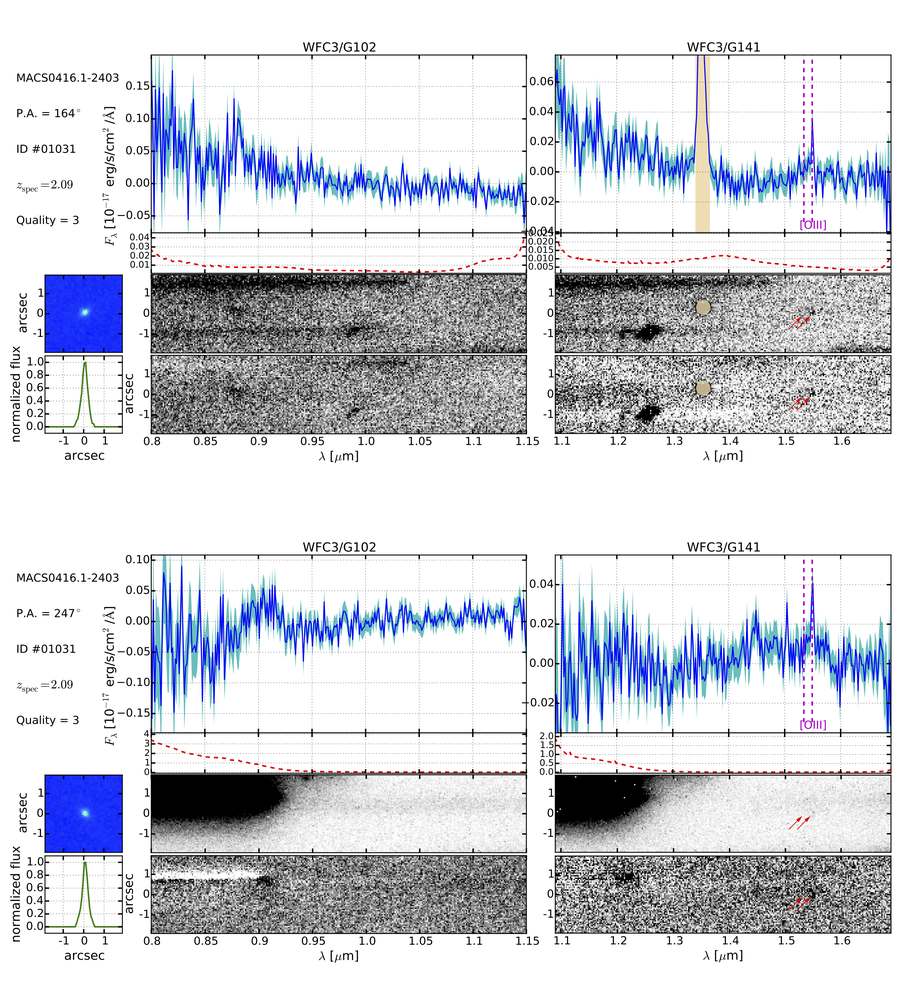
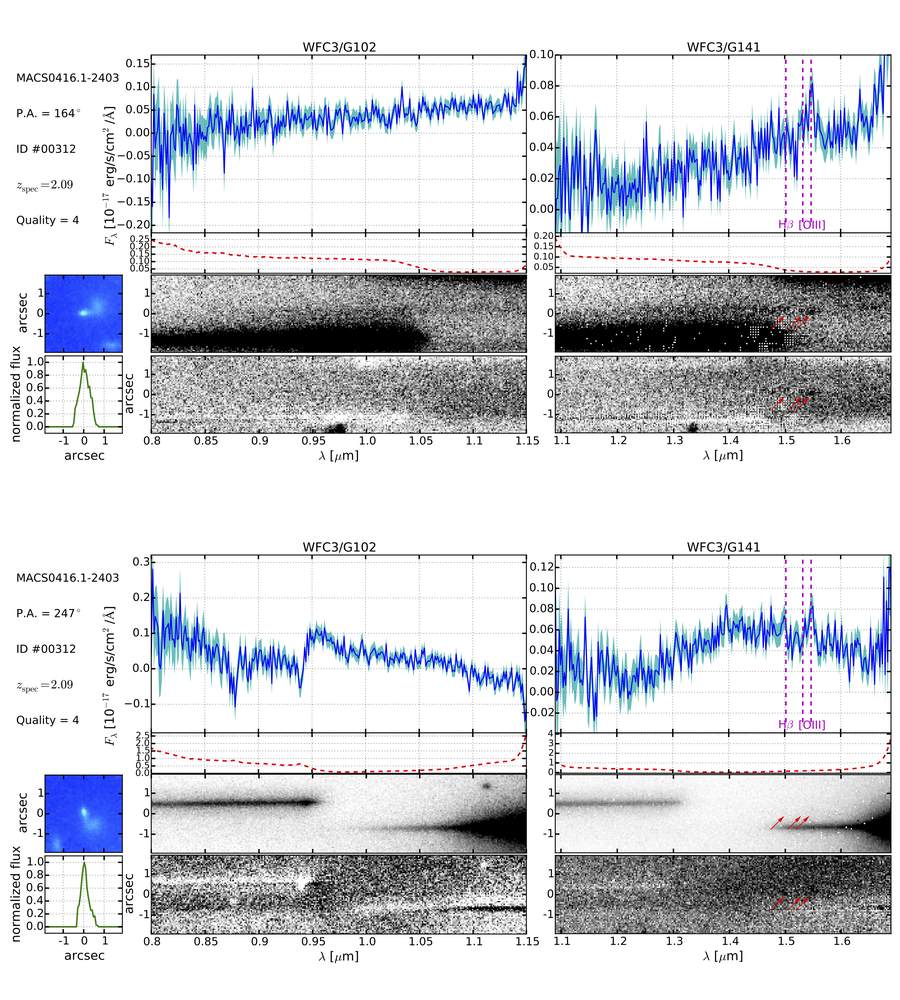
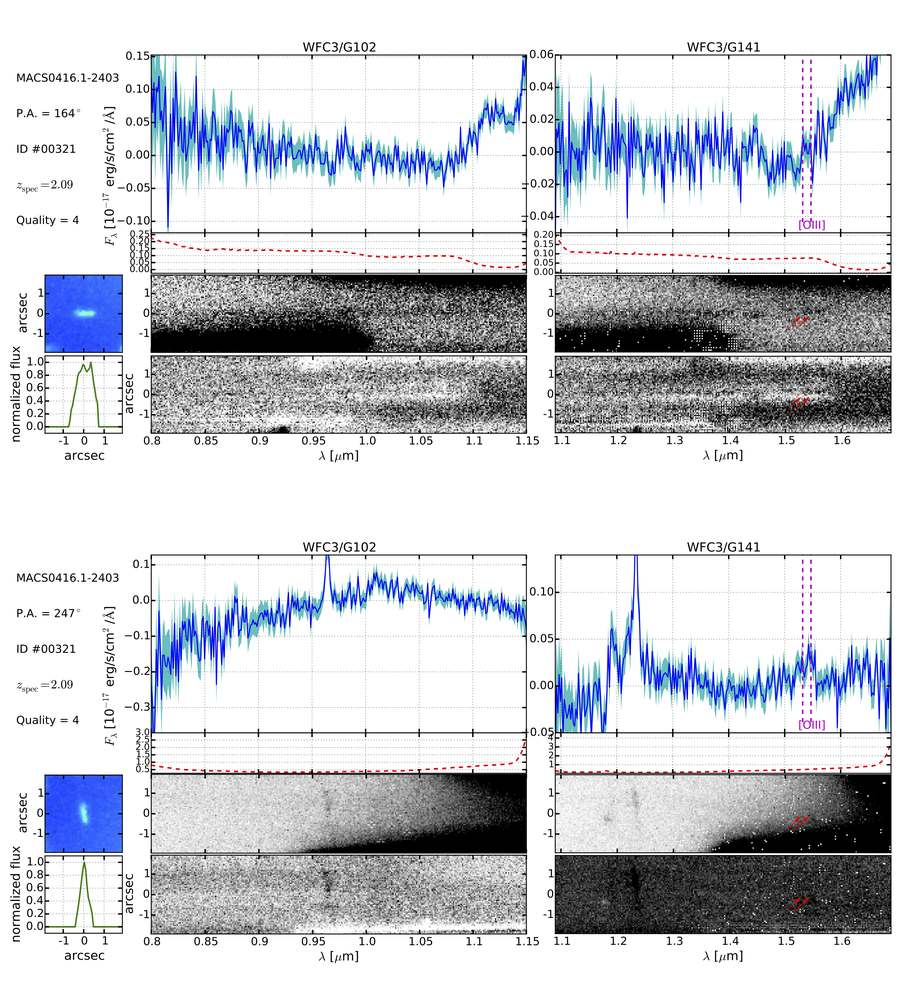
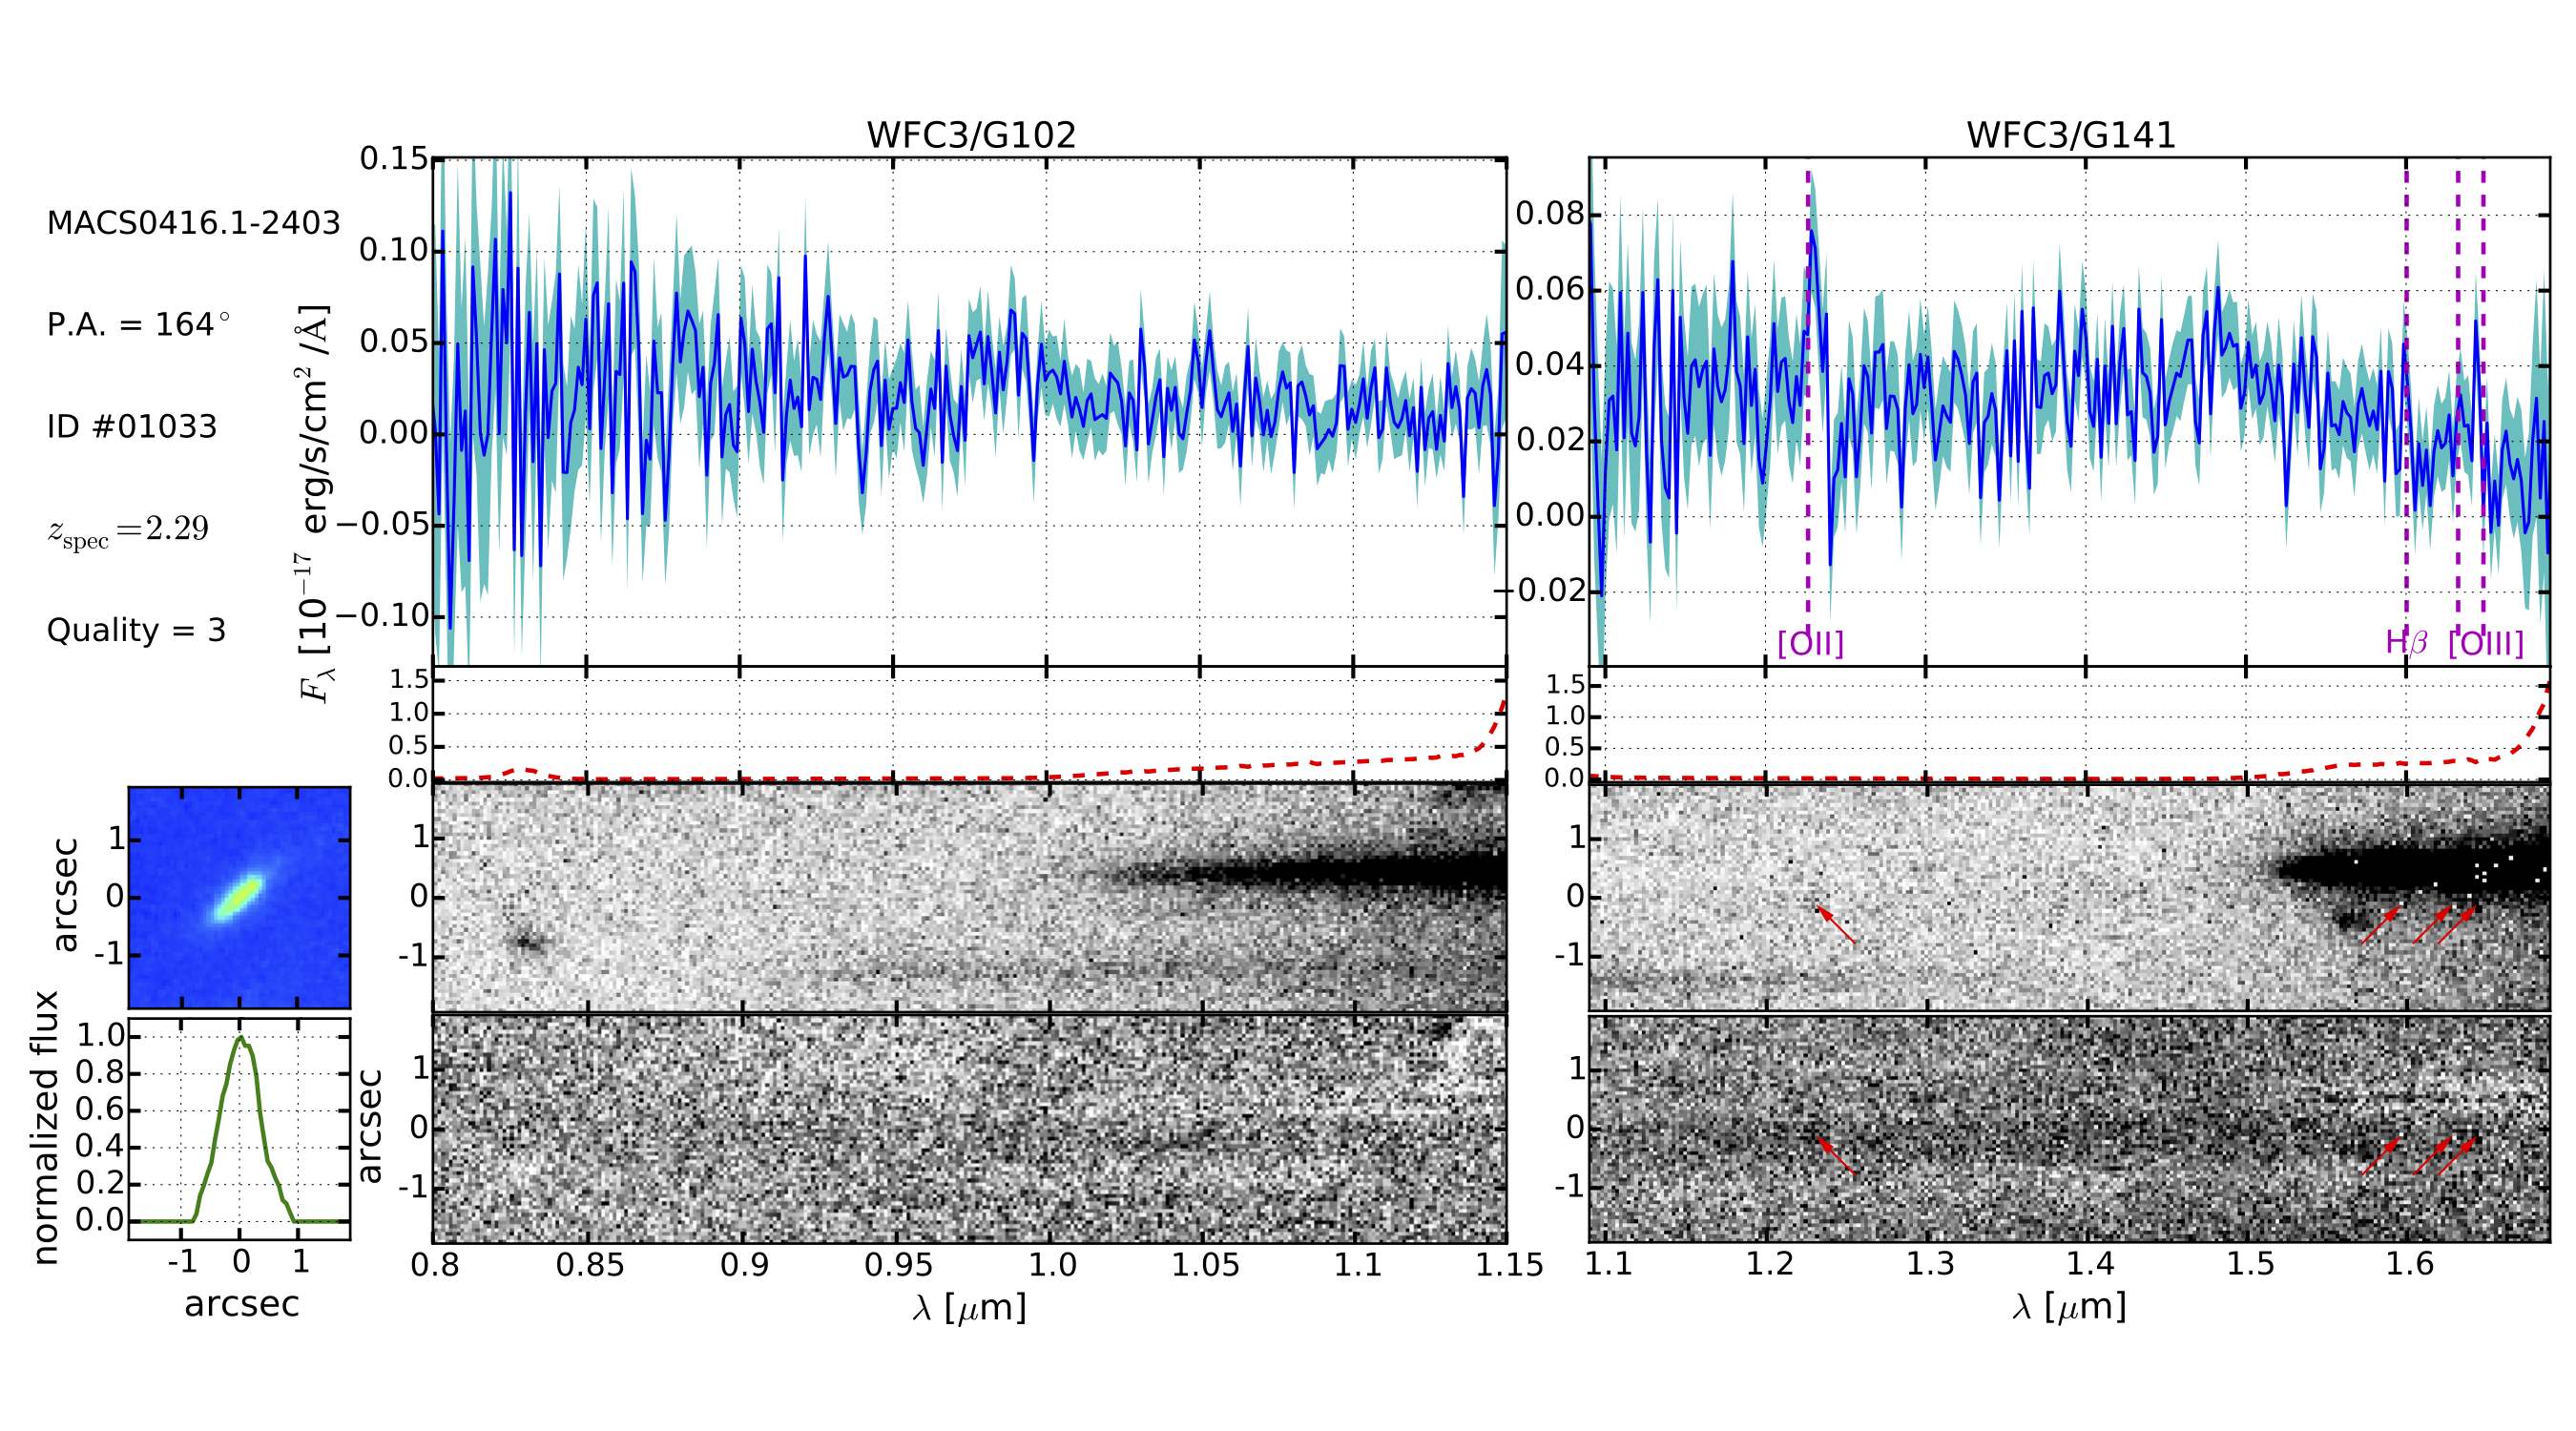
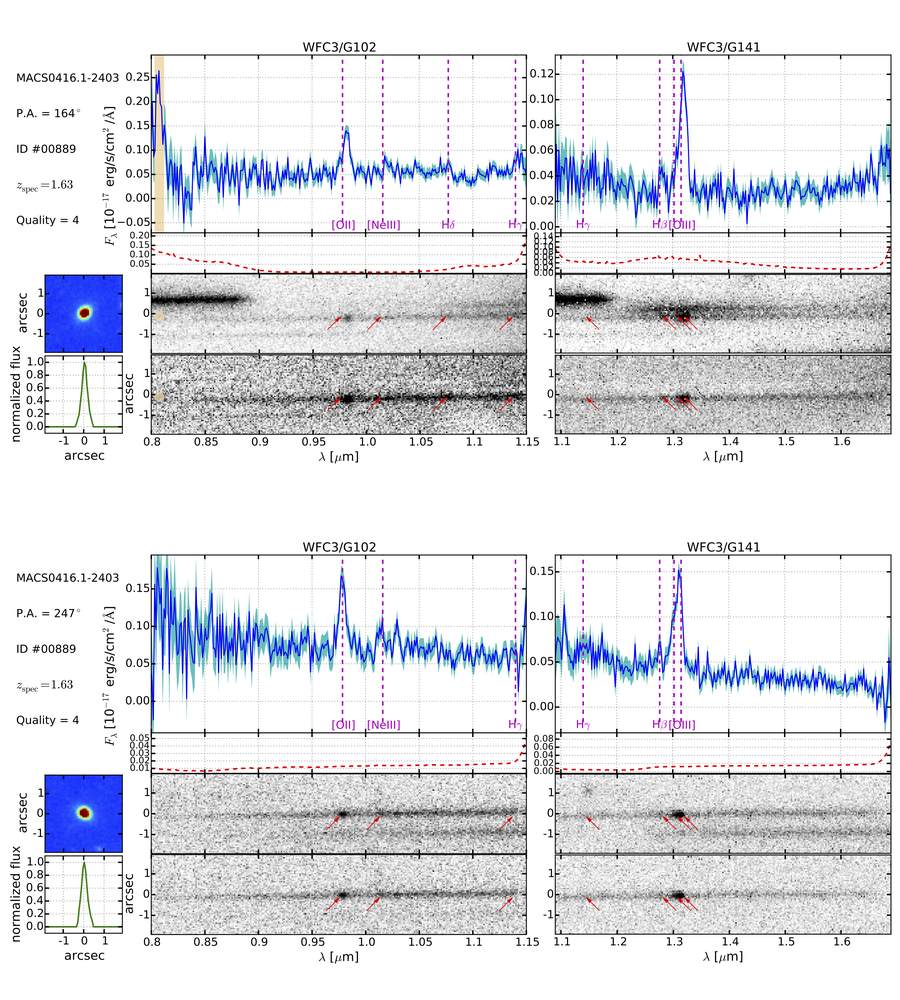
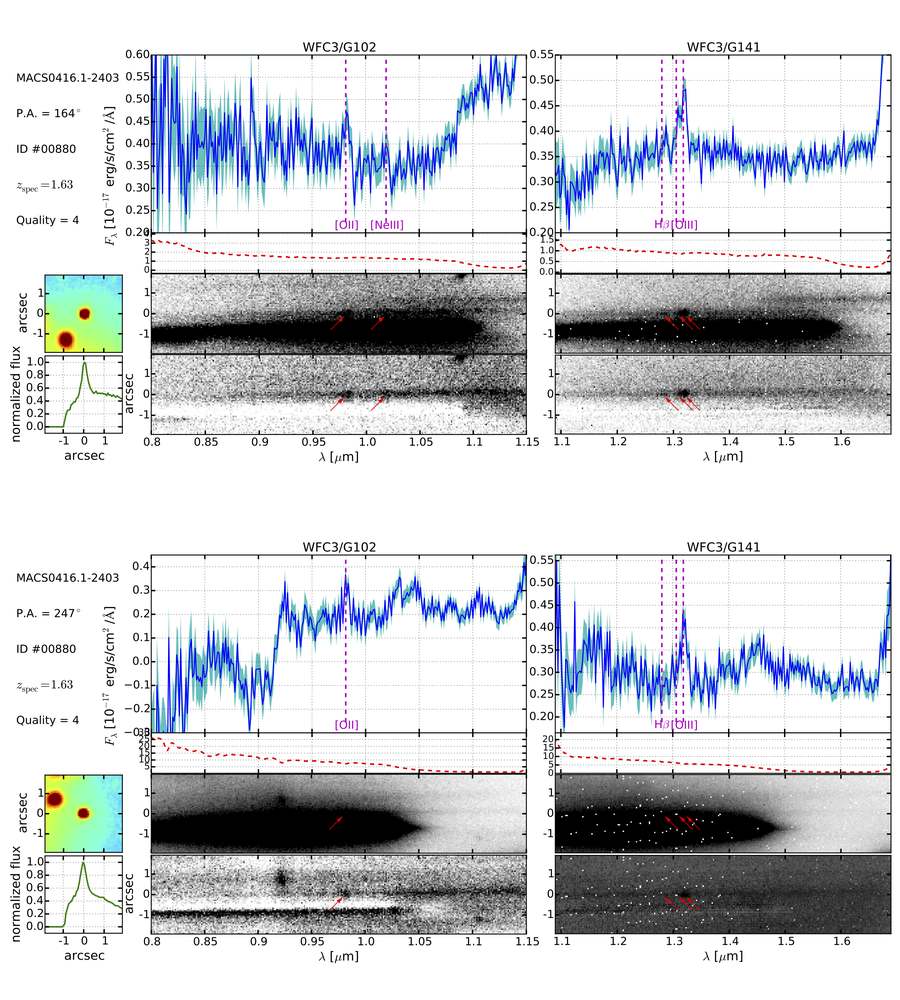
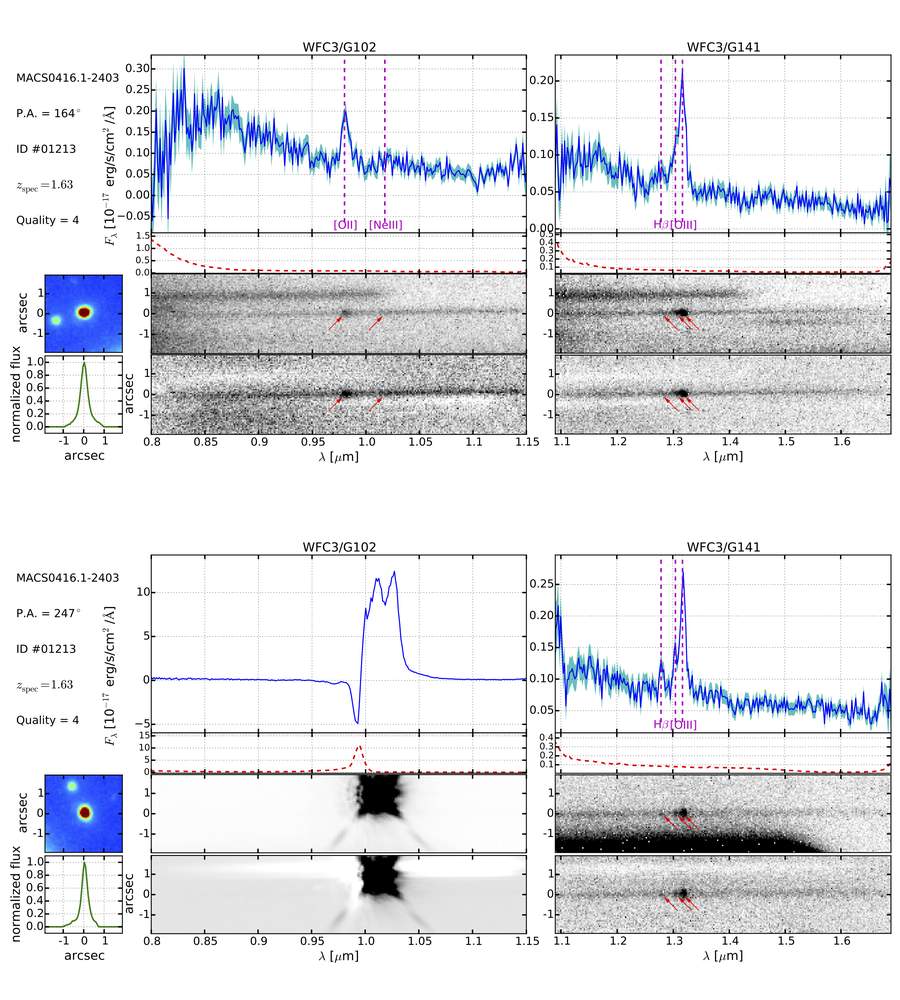
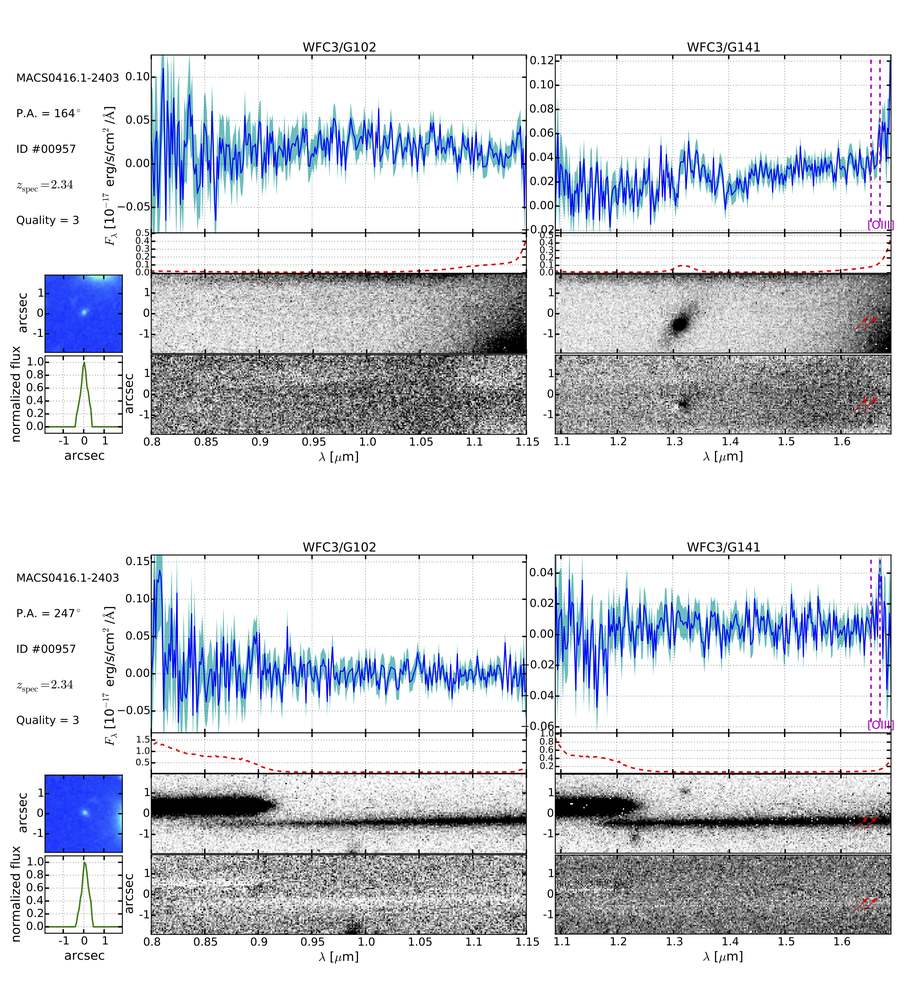
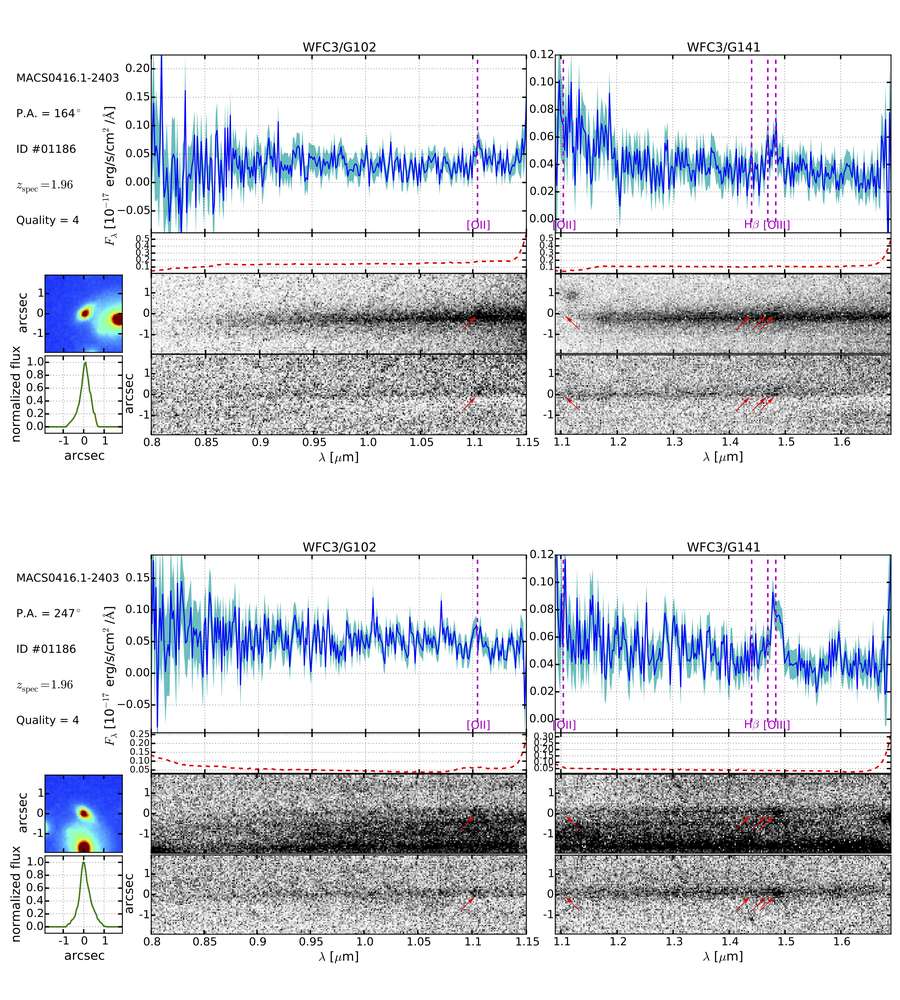
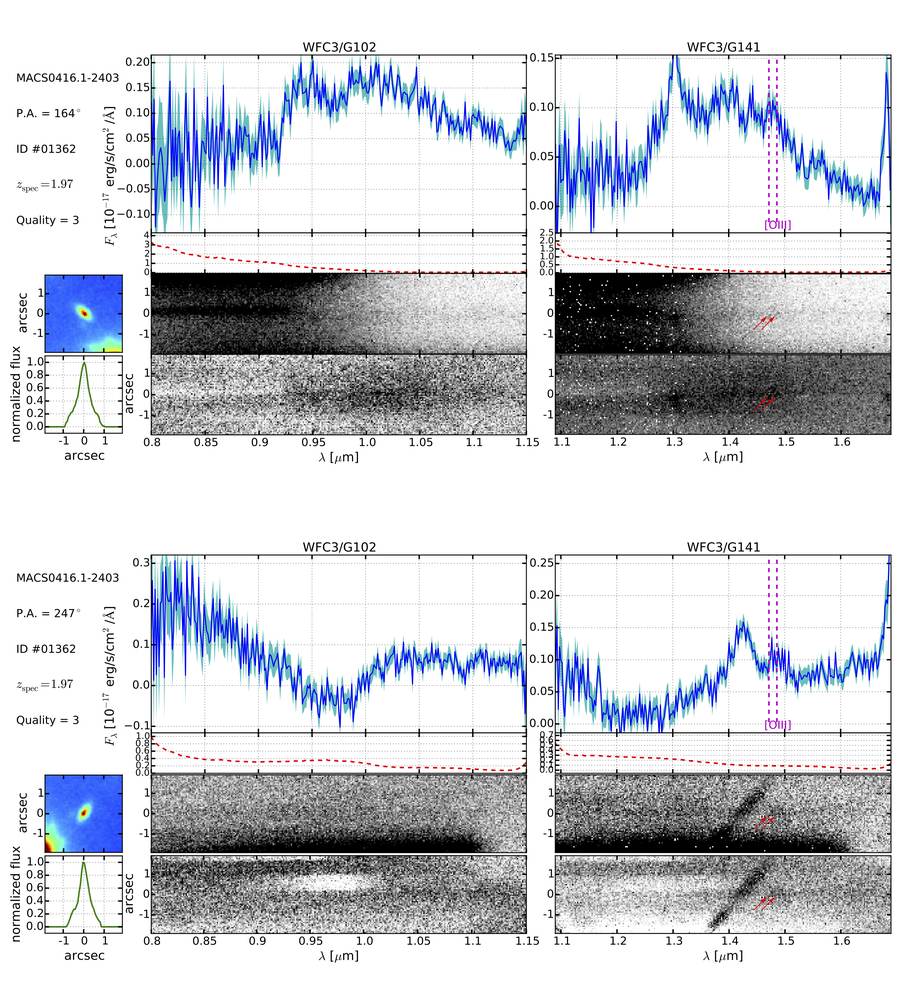
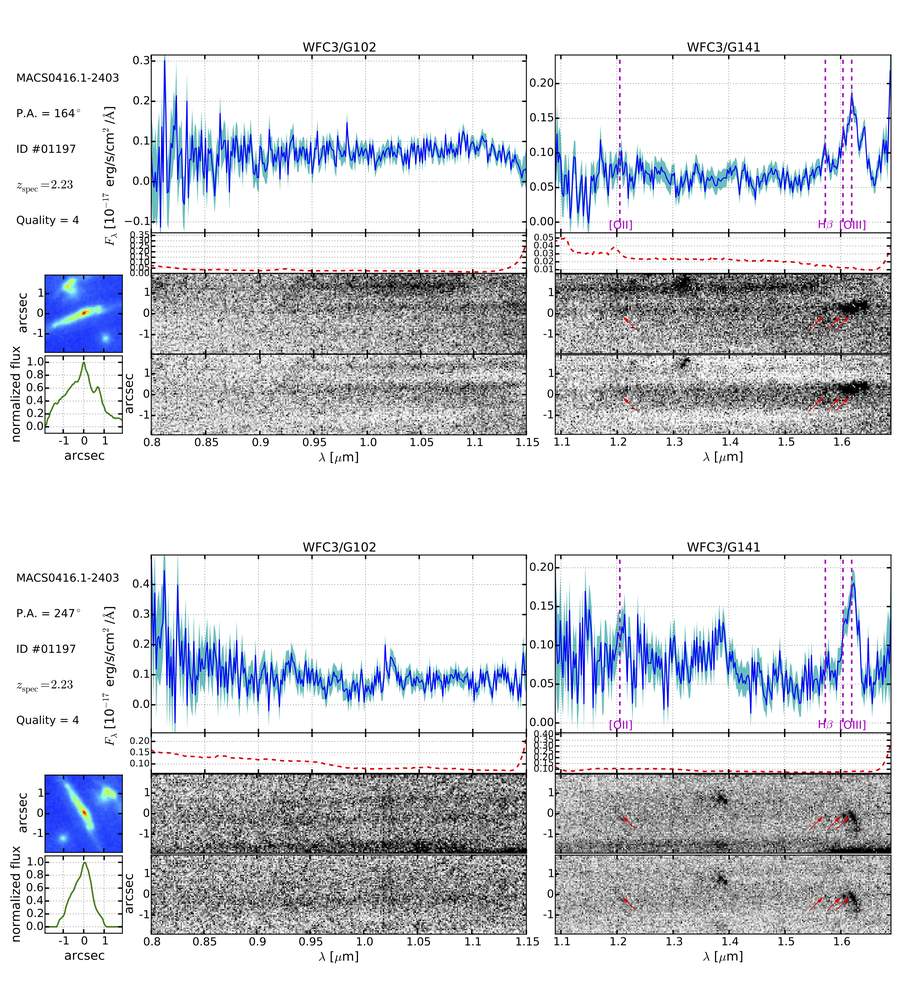
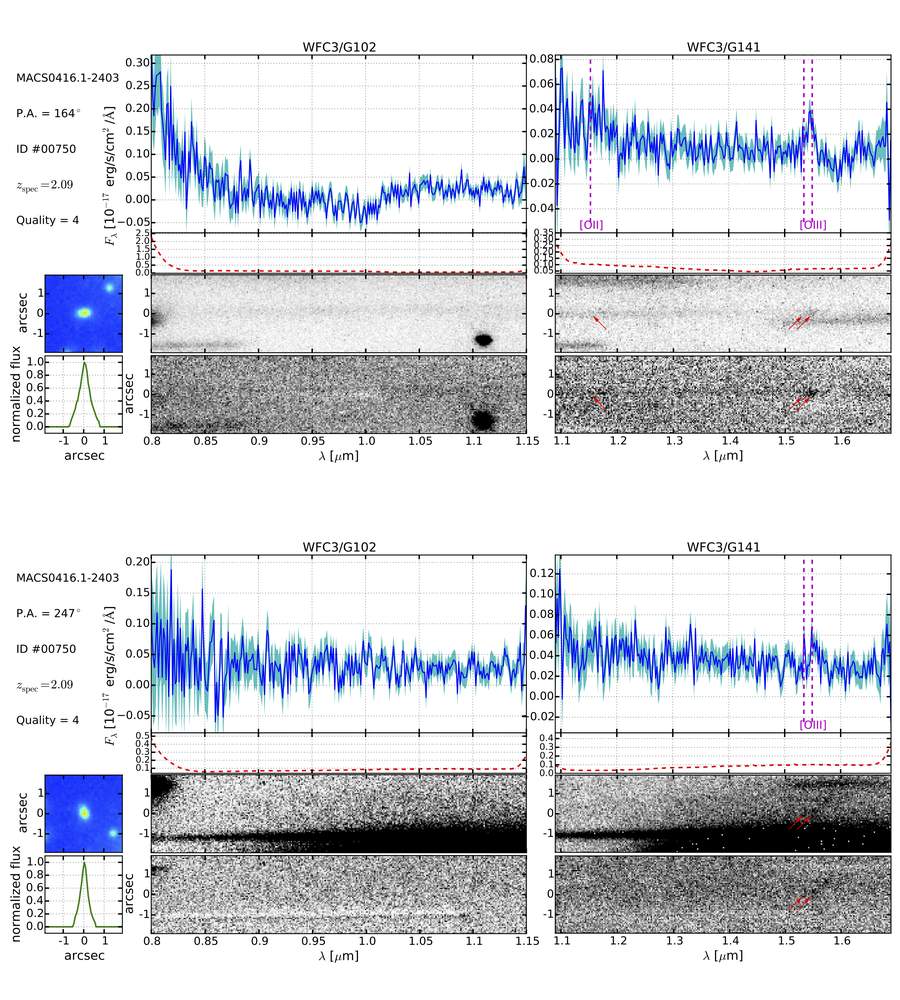
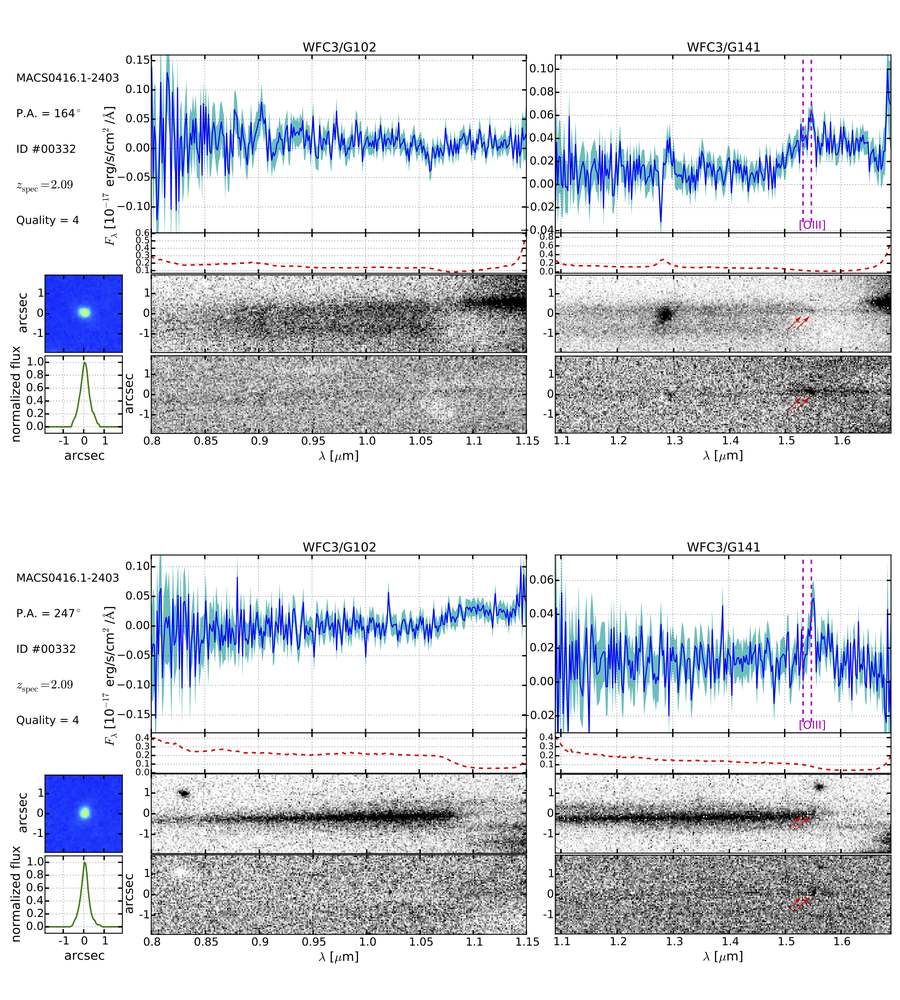
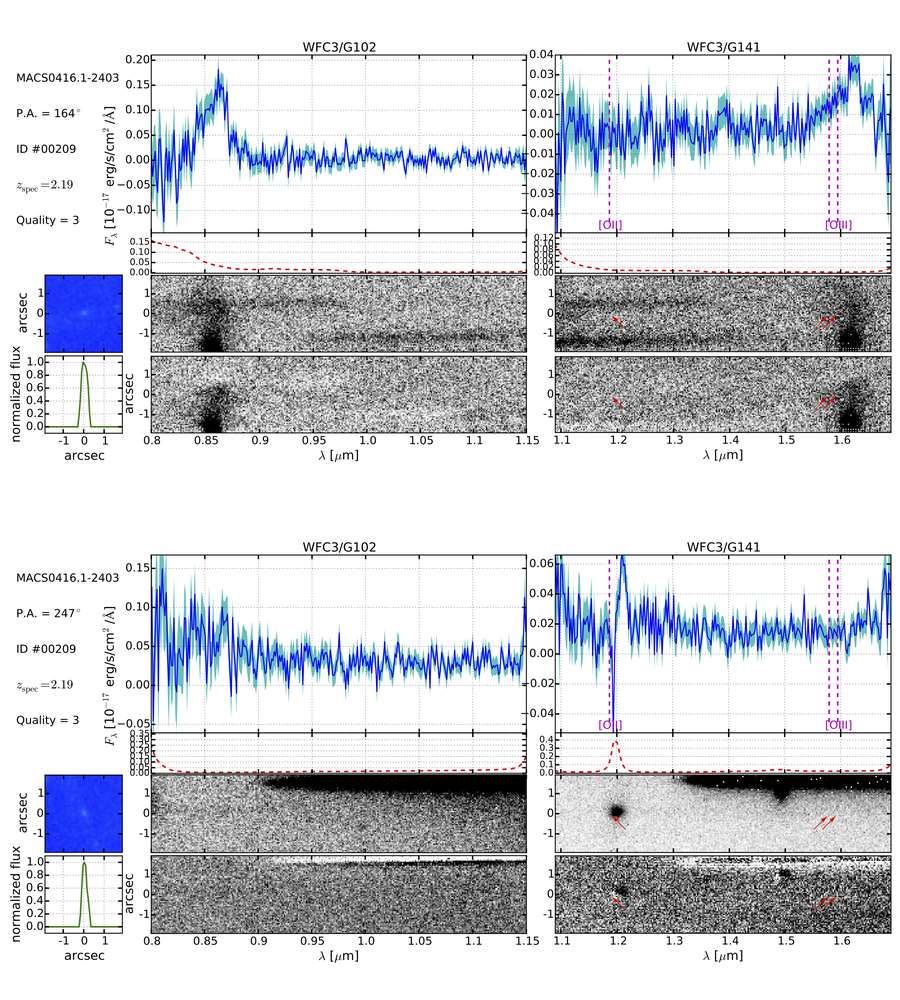
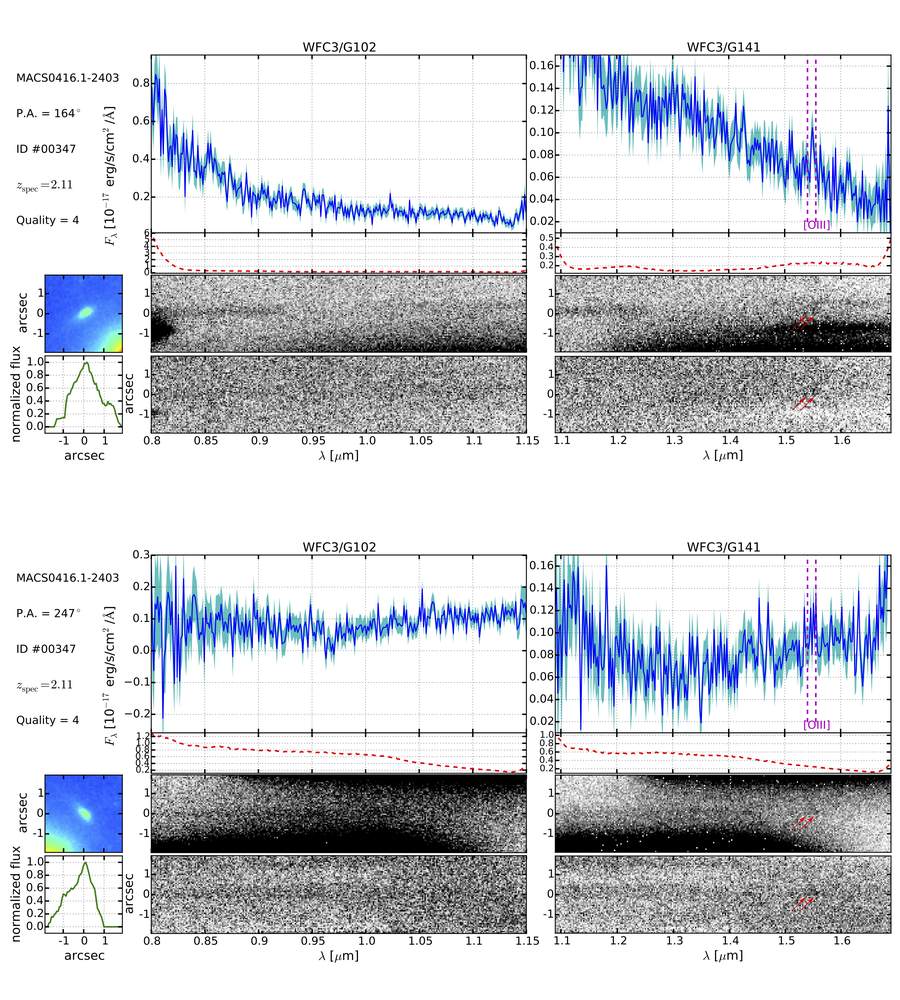
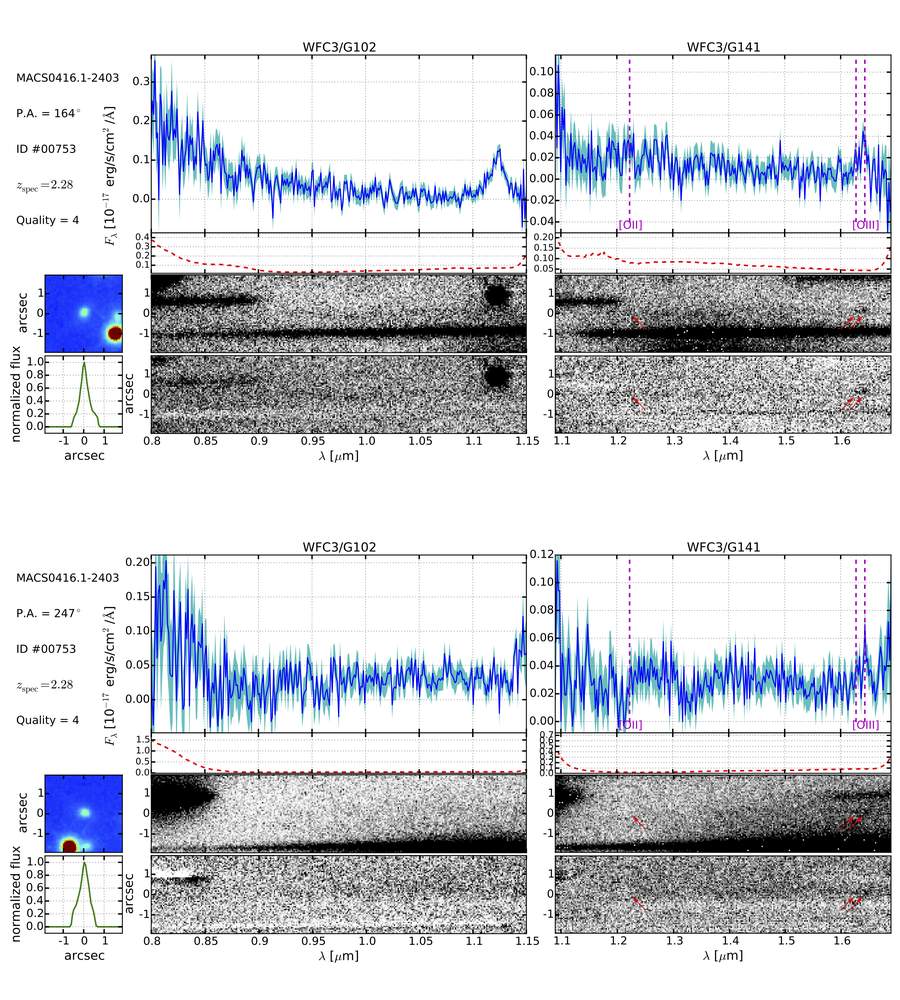
The GLASS spectroscopic data were carefully examined for a total of 272 multiple image candidates in the attempt to measure spectroscopic redshifts. Each spectrum was visually inspected by multiple investigators (A.H., T.T., and A.B.) using the GLASS Graphical User Interfaces (GUIs) dubbed the GLASS Inspection GUI (GiG) and GLASS Inspection GUI for redshifts (GiGz777Available at https://github.com/kasperschmidt/GLASSinspectionGUIs; Treu et al., 2015). Both P.A.s were inspected individually and then again once stacked together. The results were then combined to form a list of multiple images with identified emission lines. Following GLASS procedure (Schmidt et al., 2015; Treu et al., 2015), a quality flag was given to the redshift measurement: Q=4 is secure; Q=3 is probable; Q=2 is possible; Q=1 is likely an artifact. As described in Treu et al. (2015), these quality criteria take into account the signal to noise ratio of the detection, the probability that the line is a contaminant, and the identification of the feature with a specific emission line. For example, Q=4 is given for spectra where multiple emission lines are robustly detected; Q=3 is given for spectra where either a single strong emission line is robustly detected and the redshift identification is supported by the photometric redshift, or when more than one feature is marginally detected; Q=2 is given for a single line detection of marginal quality. As shown in Table B, new spectroscopic redshifts were obtained for Quality 4 and 3 measurements only, consisting of 31 images in total, corresponding to 16 systems. The spectra of these objects are shown in Figs. 11–34.
The uncertainty in our spectroscopic redshift measurements is limited by the grism wavelength resolution of approximately 50Å and by uncertainties in the zero point of the wavelength calibration. By comparing multiple observations of the same object we estimate the uncertainty of our measurements to be in the order of , similar to what was reported by Wang et al. (2015).
Some multiple images that we confirm with GLASS spectroscopy were previously spectroscopically confirmed by other authors. We compare the redshifts obtained in this work to those previously obtained, seeing agreement within the uncertainties for all multiple images except system 14. Images 14.1, 14.2, and 14.3 were originally reported to be spectroscopically confirmed at by Richard et al. (2014), using incomplete CLASH-VLT data. Grillo et al. (2015), using the complete CLASH-VLT data set for MACSJ0416, recently reported redshifts of for images 14.1 and 14.2. We confirm the updated redshift measurements of 14.1 and 14.2 by Grillo et al. (2015) by identifying strong [O ii]3727,3729 and [O iii]4959,5007+H emission at in the GLASS spectra of both images. In addition, we confirm 14.3 at by identifying the same lines observed in the grism spectra of 14.1 and 14.2 (see Figures 24–26). We note that all v1 lens models of the cluster that used system 14 used the incorrect spectroscopic redshift of .
Using the GLASS spectroscopy, we confirm the redshifts of 13 multiple images for the first time. These are multiple images 5.1, 5.2, 5.3, 5.4, 12.3, 15.1, 23.1, 23.3, 26.1, 27.2, 28.1, 28.2, and 29.3 in Table 2. We show the GLASS spectra for these objects in Appendix B, with the exception of 12.3, 28.1 and 28.2 which are available in an online grism catalog888Available at http://www.stsci.edu/~brammer/GLASS_zcat/. All spectra are also available in an online catalog88footnotemark: 8. Before the GLASS data were analyzed, none of the images in system 5 had published spectroscopic redshifts. We confirm all four images in the system as belonging to the same source galaxy to based on the detection of [O iii]4959,5007 in both P.A.s of the G141 spectra of all four images. H and [O ii]3727,3729 were also detected in 5.1, 5.2, and 5.3, consistent with . The CLASH-VLT team published a consistent redshift of (Balestra et al., 2015) for image 5.2 after the HFF modeling team determined its samples using the GLASS spectra. 12.3 was the only multiple image candidate inspected with significant continuum emission in the GLASS spectra, but no emission lines were apparent. It was confirmed to by fitting its bright continuum emission in the GLASS spectra to template SEDs using the method described by G. Brammer, (in prep.). 15.1 was confirmed to by the detection of [O iii]4959,5007 in both P.A.s of the G141 spectra. 23.1 and 23.3 were confirmed to by the detection of strong [O iii]4959,5007 in both P.A.s of the G141 spectra. We confirmed 26.1 to by the detection of [O ii]3727,3729 and [O iii]4959,5007 in both P.A.s of the G141 spectra. We detected [O iii]4959,5007 at in both P.A.s of the G141 spectra of image 27.2. 28.1 and 28.2 were blended in the segmentation map used to extract grism objects. Like multiple image 12.3, 28.1 and 28.2 were confirmed by fitting the bright continuum emission in the GLASS spectra to template SEDs, finding a best-fit redshift of . 29.3 was confirmed by detecting [O iii]4959,5007 at in both G141 P.A.s. The catalog of multiply imaged objects with GLASS redshifts is publicly available333The GLASS spectroscopic redshifts of 5.1 and 5.4 were determined after the HFF modeling procedure took place. Therefore, neither image was included in the Gold sample. ,88footnotemark: 8
4.3. Visual search in GLASS data
We also conducted a search for line emitters among known sources within the entire grism field-of-view. Two co-authors (A.B. and T.T.) visually inspected all of the 2D grism spectroscopic data products, the contamination models, and residuals after contamination subtraction. The grism spectra extraction is based on a public HFF photometric catalog available on the STScI MAST archive999https://archive.stsci.edu/prepds/frontier/, supplemented by our own photometric catalogs based on CLASH images and GLASS direct images. We attempted to identify new multiple systems among the galaxies with the same grism spectroscopic redshifts but did not find any. Some of them are ruled out because of the relative positions of the multiple images in the cluster, while others are ruled out because their distinct colors and morphologies are inconsistent with being the same source.
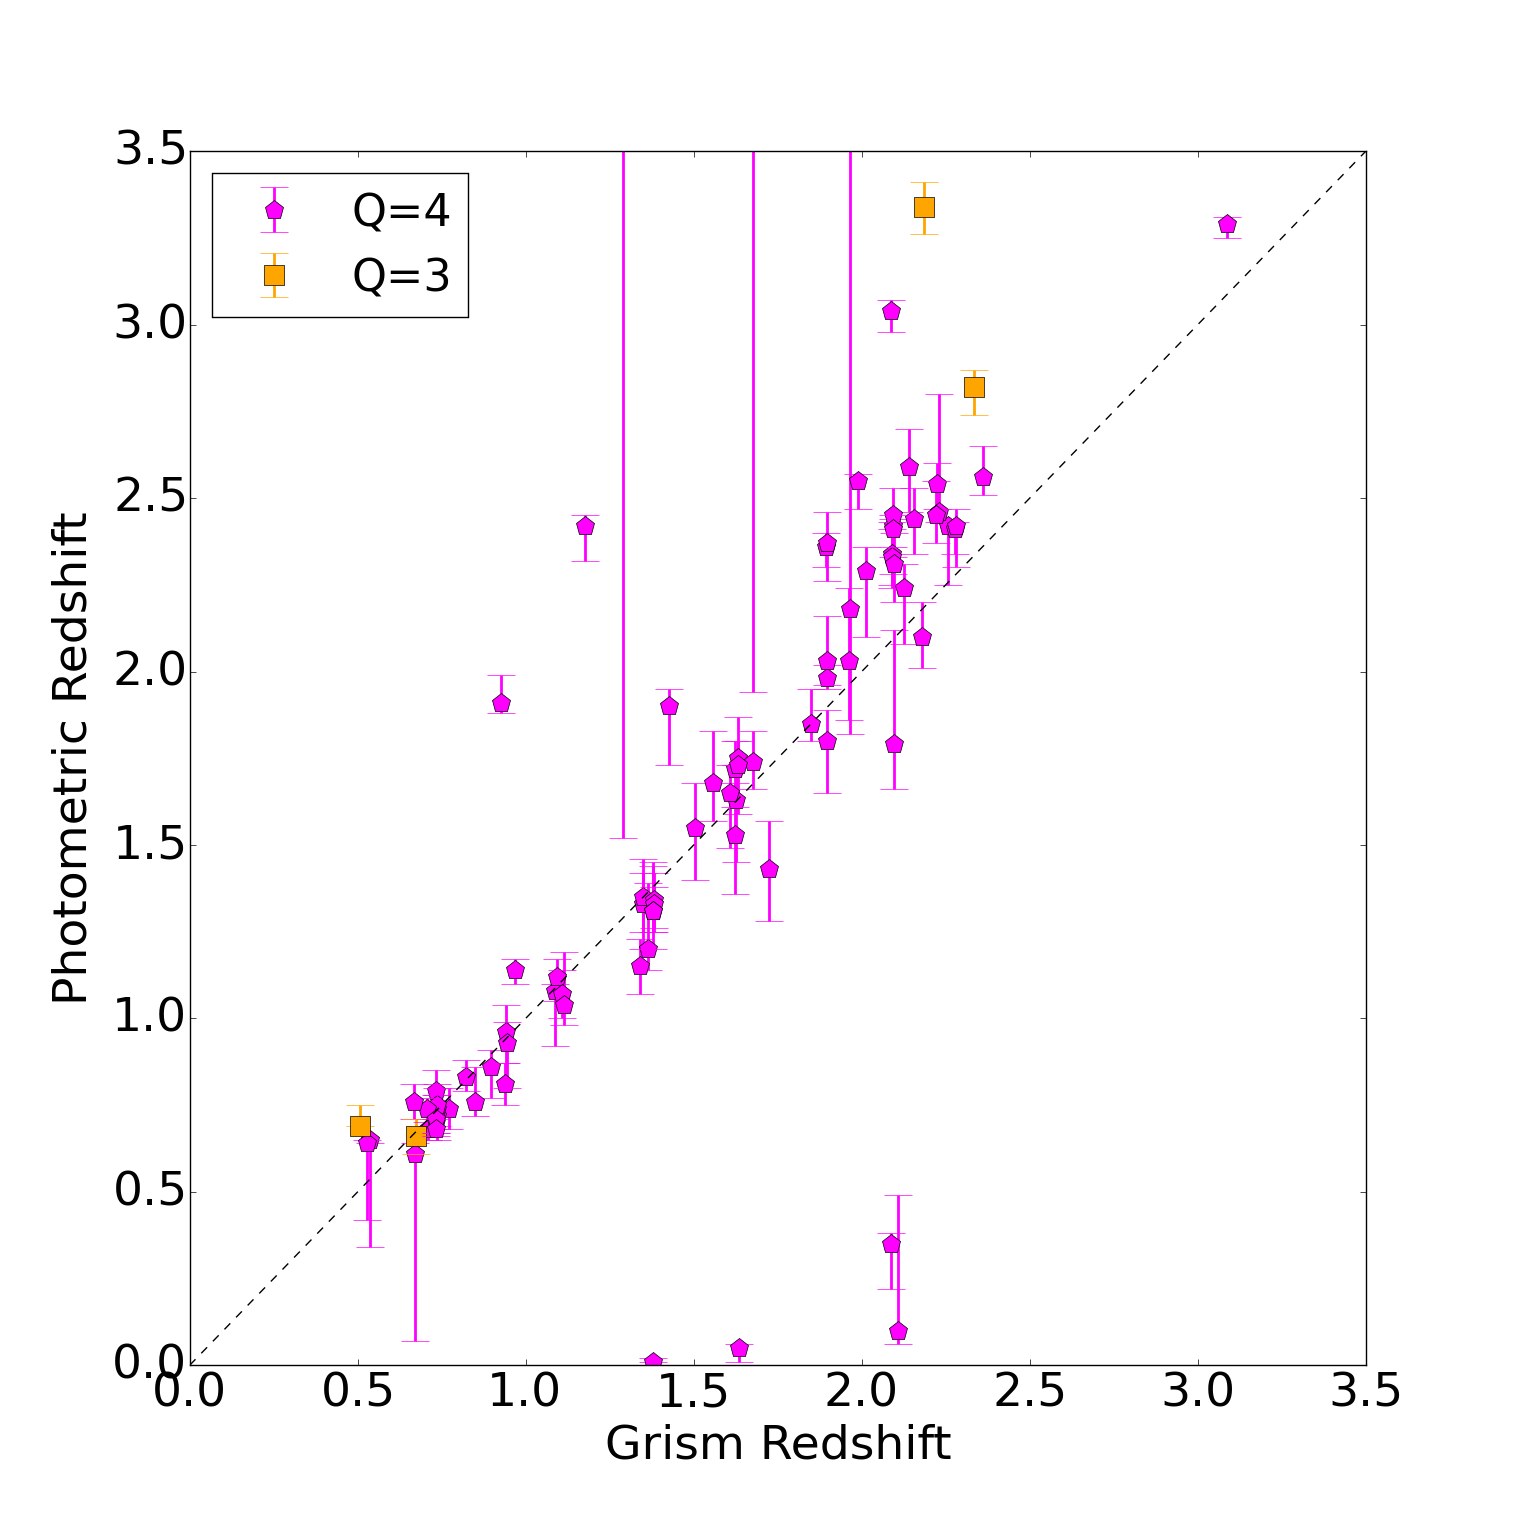
We compiled a list of singly-imaged galaxies with redshifts determined from both emission-line and absorption features, consisting of 4, and 166, quality 3 and 4 spectroscopic redshift measurements respectively, which are color coded in Figure 1 and Figure 2 and listed in Table B. Using the photometric catalog described above, we measure the photometric redshifts of these objects and compare them with the spectroscopic redshifts. A comparison is displayed in Figure 4. Of the objects for which photometric redshifts could be measured, we find that approximately 66% (57/86) of the photometric redshifts agree within their confidence limits uncertainties with the corresponding spectroscopic redshifts. This suggests that the photometric redshift errors are reliably estimated.
5. Gravitational Lens Model
Our lens modeling method, SWUnited (Bradač et al., 2005, 2009a), constrains the gravitational potential of a galaxy cluster via an iterative minimization algorithm. It takes as input a simple initial model for the potential. After each iteration, a is calculated from strong and weak gravitational lensing data on an adaptive, pixelated grid. The number of grid points is increased at each iteration, and the is recalculated. Once the minimum is found, and convergence is achieved, derivative lensing quantity maps, such as convergence (), shear () and magnification (), are produced from the best-fit potential map.
The strong lensing constraints on the lens model are described in (4). Our weak lensing catalog is based on the ACS/WFC F606W observations () of the cluster from the HFF program. Using the HFF image results in a factor of two increase in the source density of weak lensing galaxies compared to the CLASH imaging. For the reduction and weak lensing catalog generation we make use of the pipeline described by Schrabback et al. (2010), which employs the KSB+ formalism (Kaiser et al., 1995; Luppino & Kaiser, 1997; Hoekstra et al., 1998) for galaxy shape measurements as detailed by Erben et al. (2001) and Schrabback et al. (2007). A major difference compared to Schrabback et al. (2010) is the application of the pixel-based correction for charge-transfer inefficiency (CTI) developed by Massey et al. (2014). Our modeling of the temporally and spatially variable ACS point-spread function is based on the principal component analysis developed by Schrabback et al. (2010), which we recalibrate using F606W stellar field observations taken after Servicing Mission 4. Further details on the recent pipeline modifications are provided by Schrabback et al. (in prep.), including a new verification test for the CTI correction in the context of cluster weak lensing studies and updates for the employed weak lensing weighting scheme. Weak lensing galaxies were individually assigned a redshift using the ‘ZBEST’ keyword in the ASTRODEEP photometric catalog (see section 4.1), or the CLASH photometric catalogs for galaxies outside of the HFF HST+IR bands. The CLASH photometric catalogs use the Bayesian Photometric Redshifts (BPZ) code (Benítez, 2000). We use the ‘,’ the most likely redshift given by BPZ, to estimate the redshifts of the weak lensing galaxies. We only use galaxies with to ensure that the majority of the catalog contains background galaxies.
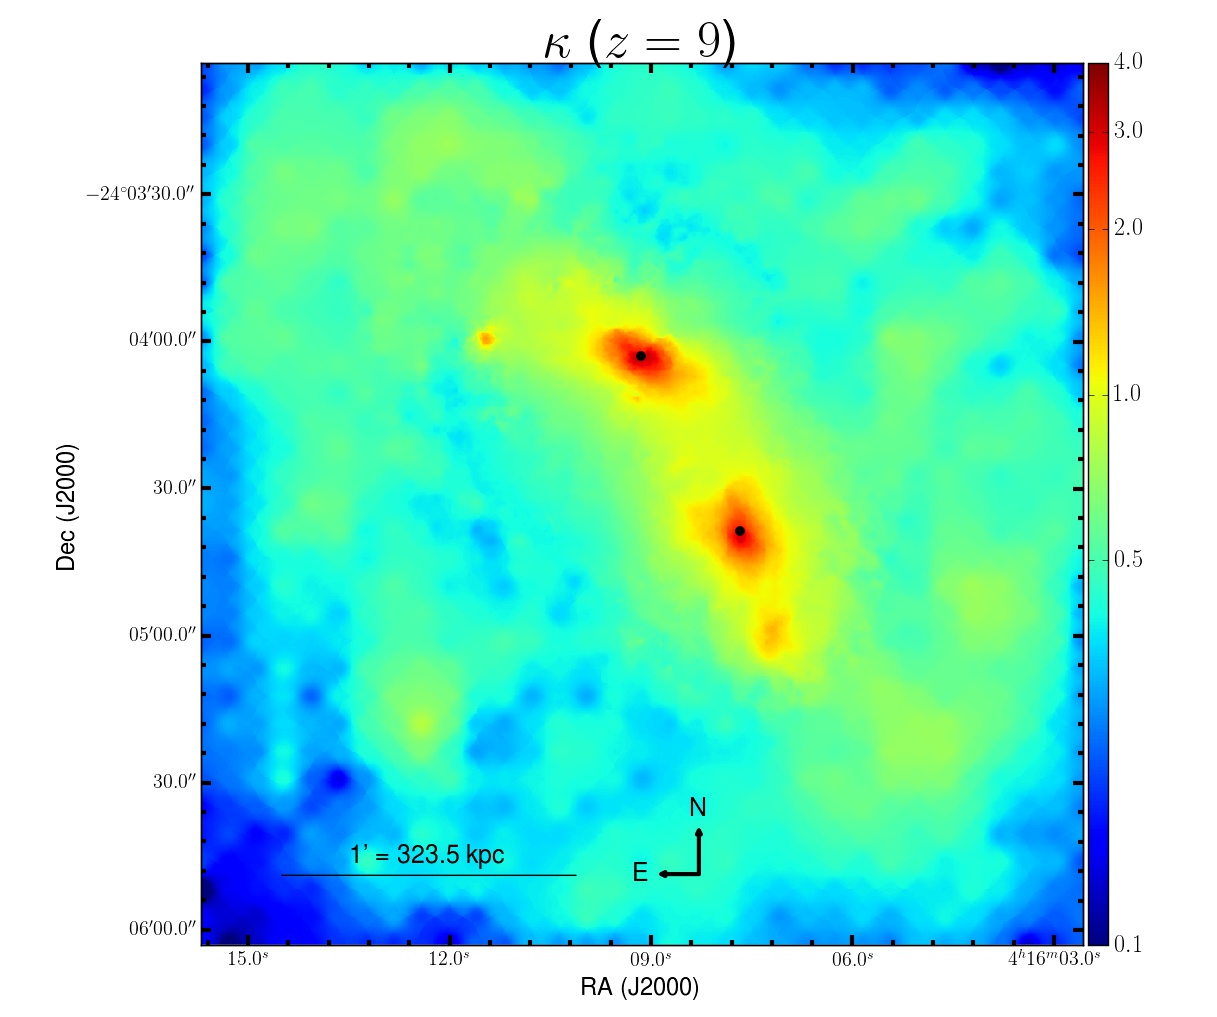
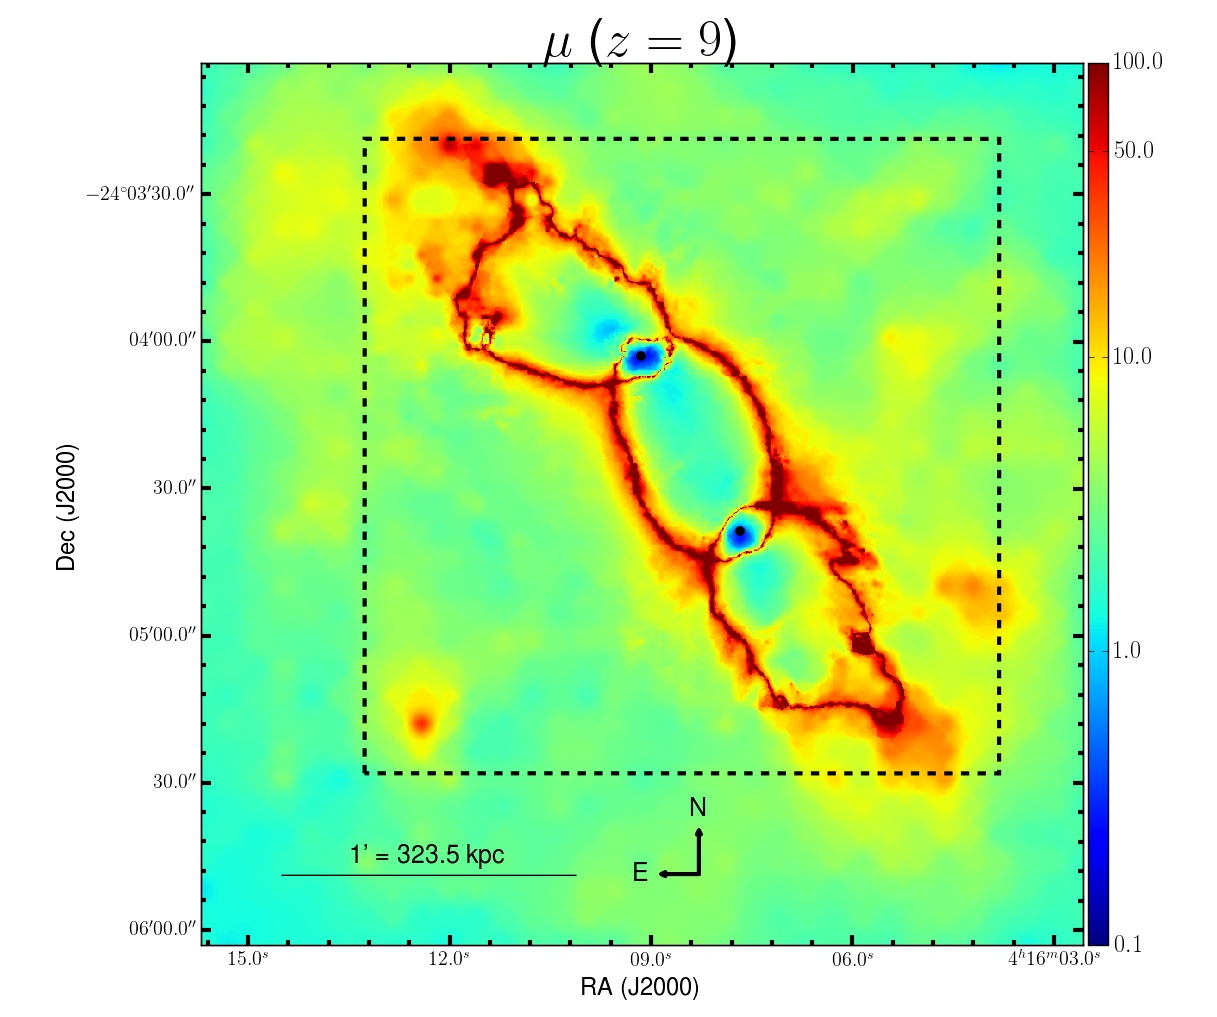
Maps of the convergence and magnification for a source at are shown in Figure 5. The convergence map exhibits two peaks, roughly centered at the positions of the two brightest cluster galaxies (BCGs). Smaller substructures can be seen to the northeast of the NE BCG and to the south of the SW BCG. The magnification map shows that the critical curve, the curve along which the magnification is maximized is very elliptical. The magnification reaches values up to within a few arcseconds from the critical curve and values of near the edge of the HFF footprint. Typical values of the magnification are throughout the HFF footprint.
5.1. Comparison with previous work
A previous model of MACSJ0416 using pre-HFF data was created using the same lens modeling code used in this work. The previous model was created in response to a call by STScI to model the HFF clusters before the HFF images were taken. The previous model appears on the publicly accessible HFF lens modeling website as the Bradac̆ v1 model101010http://www.stsci.edu/hst/campaigns/frontier-fields/Lensing-Models. Our previous model was constrained using 46 total multiple images belonging to 12 distinct systems, as opposed to the 72 images and 26 systems used in the model presented here, which is also made available to the public on the HFF lens modeling website as the Bradac̆ v3 model. Only a few modeling teams produced v2 lens models of MACSJ0416. The v2 HFF models were submitted to STScI during the time between the two official calls for lens models. Because our team submitted lens models exclusively during the official lens modeling calls, only Bradac̆ v1 and v3 models exist of MACSJ0416. In the v1 model, magnification uncertainties were estimated by bootstrap-resampling the weak lensing galaxies. In this work, however, we took a different approach to estimate uncertainties, one that we expect more accurately represents the statistical uncertainties. Because the number of multiple image systems used in this model is a factor of two larger than in the v1 model, we bootstrap-resampled all of the multiple image systems used in the model that were not spectroscopically confirmed. These are the systems for which we use in the lens model. We assessed the impact of photometric redshift uncertainty on the derived lensing quantities by resampling the redshift of each system lacking spectroscopic confirmation from their full posteriors. We exclude values of the redshift when resampling from the posteriors. We compare the variance in magnification due to redshift uncertainty with the variance in magnification due to bootstrap-resampling the multiple image systems, finding that the latter is dominant. We nonetheless propagate both sources of error when reporting the errors on all derived lensing quantities in this work. Systematic uncertainties are not accounted for in our error analysis.
Six other teams (CATS, Sharon, Zitrin, Williams, GLAFIC, and Diego, as they appear on the HFF lens modeling page) created new lens models of the HFF clusters, which have also been made available to the public on the HFF lens modeling website1010footnotemark: 10. The lens models were released to the public on Dec 4, 2015 while we were preparing this manuscript, but after we had completed the lens model of the cluster. All teams had access to the same multiple image constraints, including the spectroscopic constraints from GLASS described herein. The CATS (v3), Diego, Zitrin (nfw and ltm-gauss), and Williams (v3) models use the same Gold and Silver multiple images that we used to constrain our model. The CATS (v3.1), Williams (v3.1) and GLAFIC models use Gold, Silver and Bronze images, and the Sharon model uses only the Gold images. We expect that the four models that used Gold and Silver images are the most directly comparable to our lens model.
While the determination of the Gold, Silver and Bronze samples was coordinated among the modeling teams, the determination of the redshifts of the images lacking spectroscopic confirmation, i.e., the Silver and Bronze images, was not. Each team independently determined the redshifts of the Silver images. As a result, no two models, with the exception of the Zitrin nfw and ltm-gauss models, share the exact same multiple image constraints. This should be kept in mind when comparing the models.
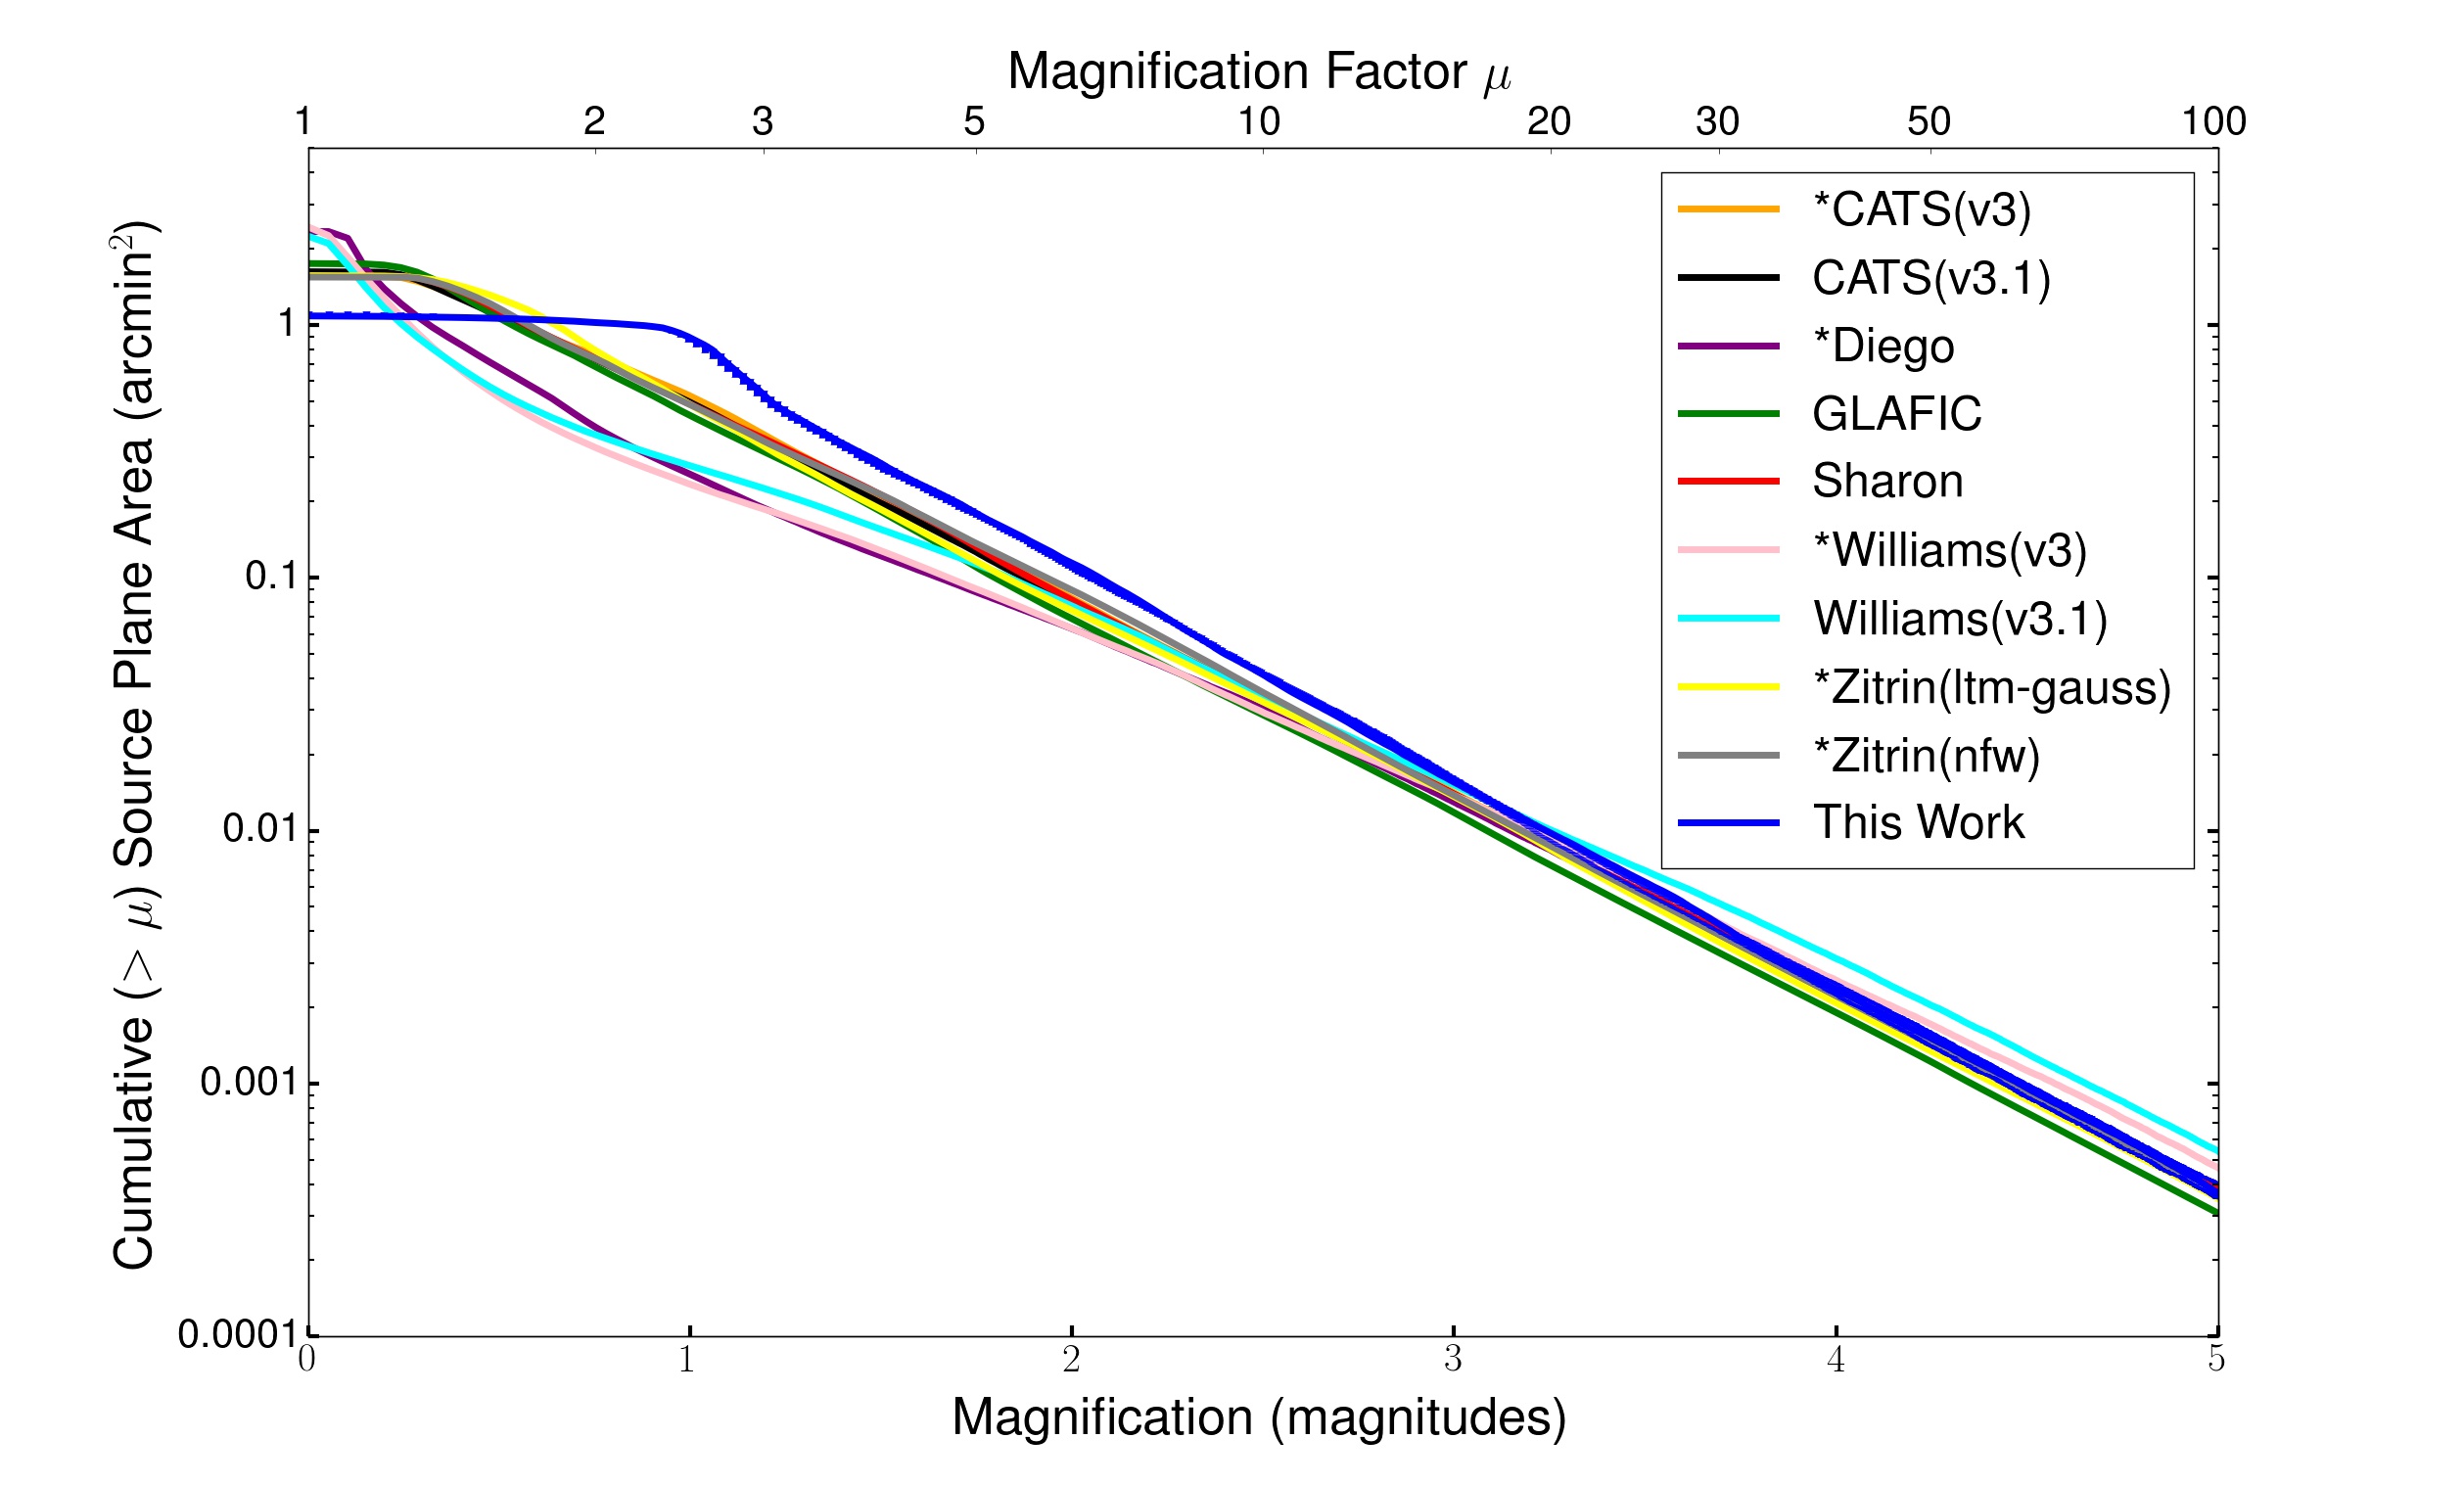
We first compare the cumulative magnified source plane area (cumulative area, hereafter) predicted by all models in Fig. 6. The cumulative area predictions among the nine models are significantly different for magnifications in the range . As shown in Figure 5, the region with is primarily in the outskirts of the field, several hundred from the critical curve. At this distance from the critical curve, weak lensing galaxies provide the only constraints to our model, as the strength of the lens is not sufficient to mutliply-image background galaxies. None of the other nine models use weak lensing constraints, but instead rely on an extrapolation of the core region to predict the magnification in the outskirts, therefore the disagreement with our model is not surprising in this regime. We assess whether the use of different sets of images could be responsible for the difference, but find that it is likely not the case. The models that similarly used the Gold and Silver samples of multiple images are still in disagreement in this regime. Further, the CATS and Williams teams constructed two models of the cluster. The v3 models of both teams use the Gold and Silver images only, whereas the v3.1 models use the Gold, Silver and Bronze samples. For each of these teams, the cumulative area predicted by the v3 and v3.1 models are very similar over a large range of magnifications (), despite the v3.1 models using an additional 58 Bronze images. We also test whether the choice of our initial model could bias our model predictions. The prediction from our initial model is significantly different from the prediction from our reconstructed model. In fact, the initial model is more similar to the CATS, GLAFIC and Zitrin models for magnifications in the range , and it is driven away from these models during the minimization. There is general agreement among the models for cumulative areas at . This is reassuring because the region of the cluster for which is near the critical curve, which is primarily constrained by the multiply imaged galaxies, which are numerous for this cluster and similar among the modeling teams. The image plane area used to make the cumulative area plots was the common area shared by all nine magnification maps, and is shown as the dashed box in the right panel of Figure 5. This area was set by the Williams magnification maps, which are approximately arcmin2.
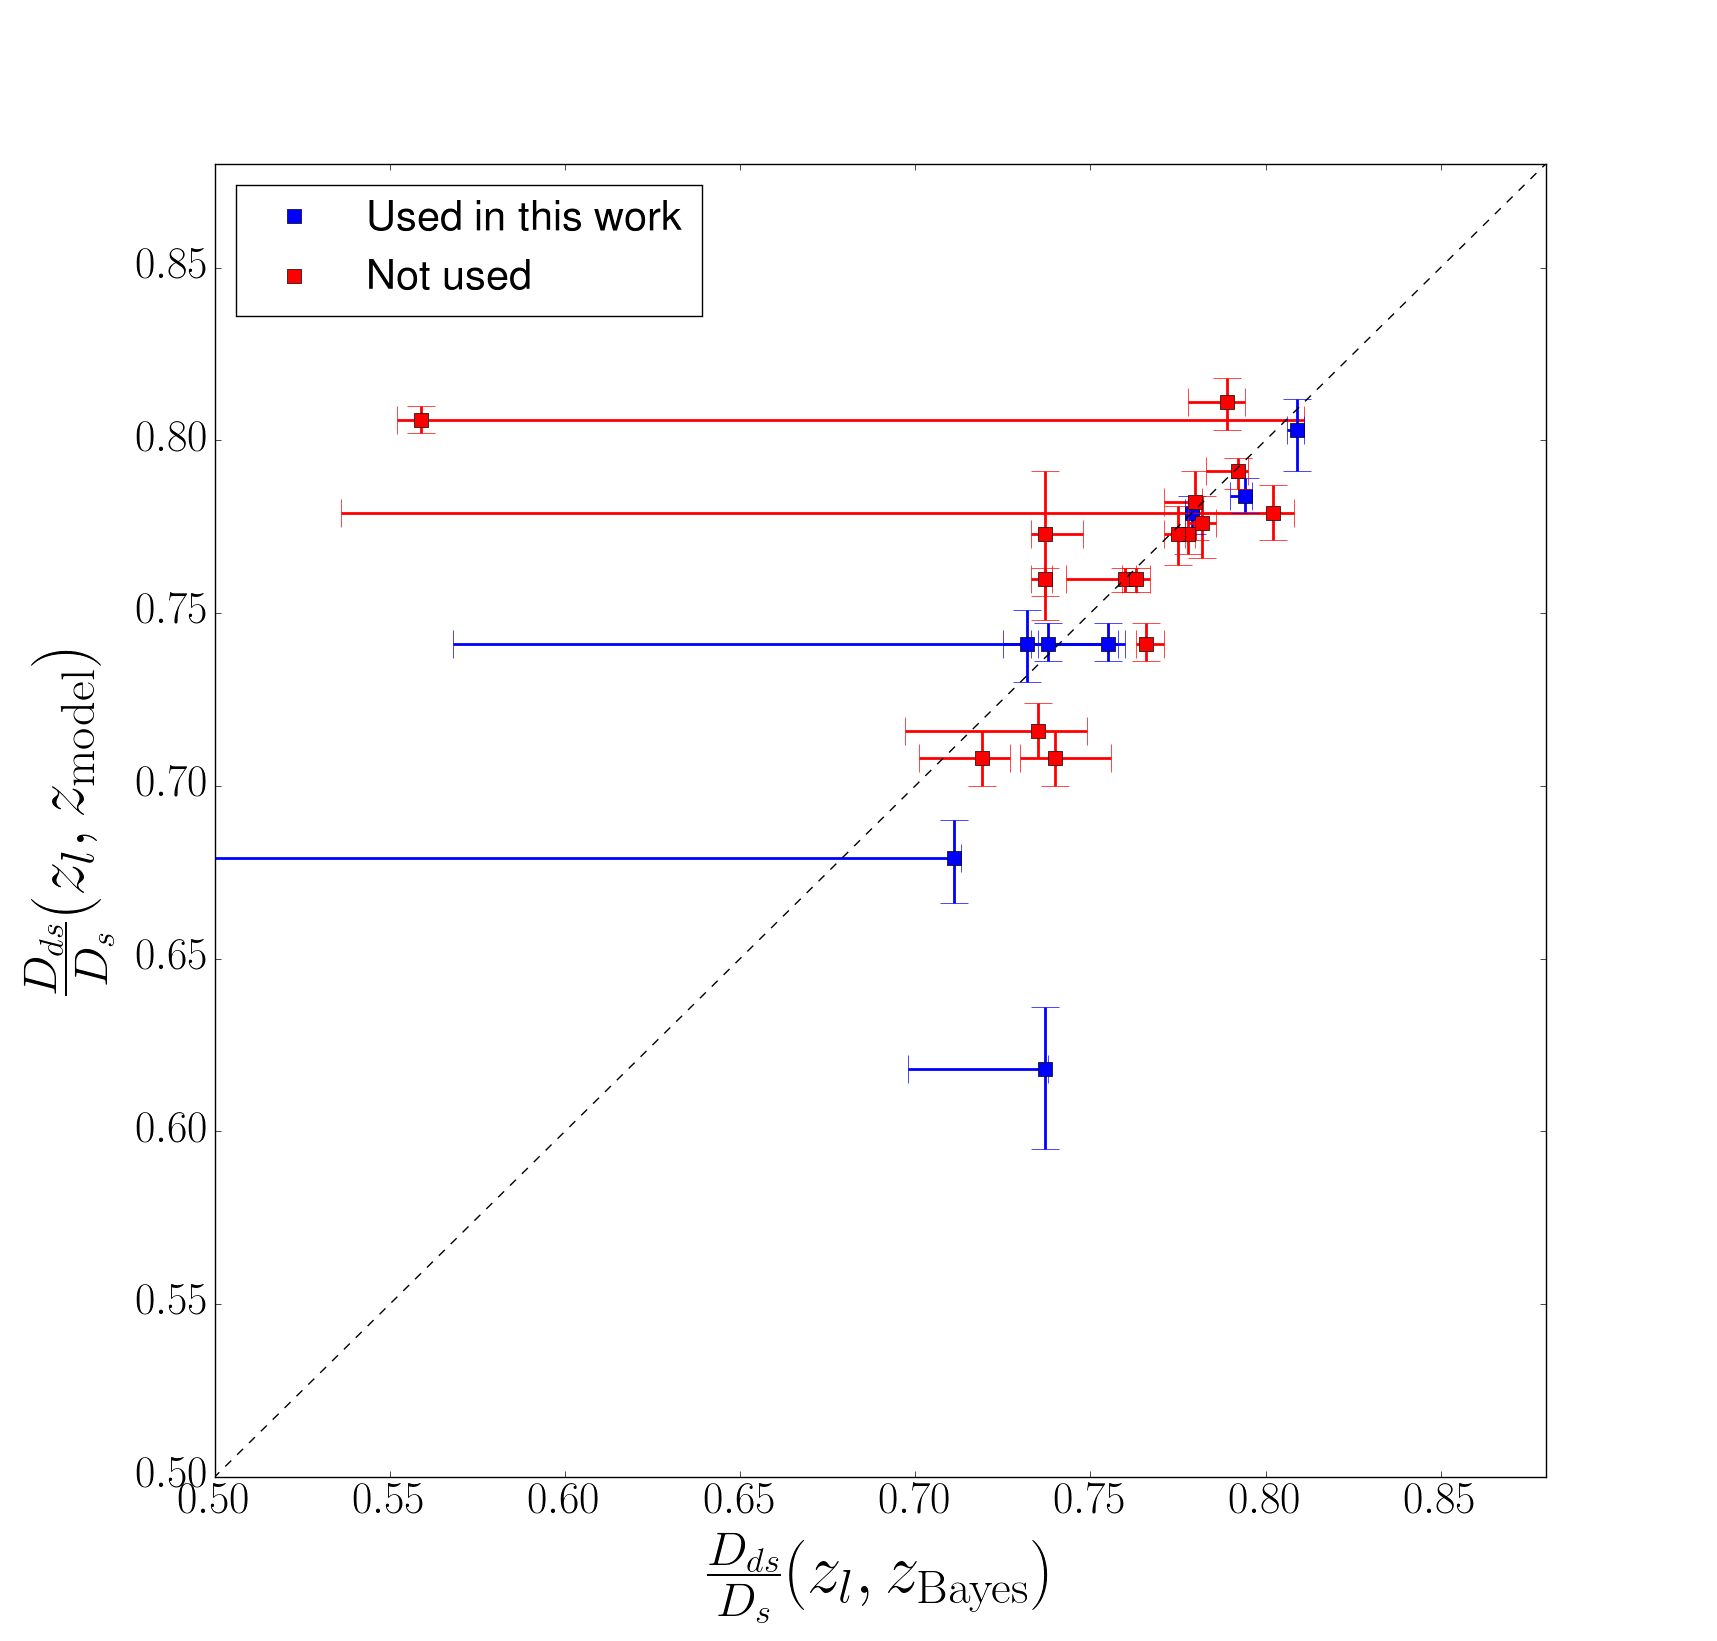
Although different modeling teams used different sets of multiply imaged galaxies, it is difficult to see how this directly affects the models using the cumulative area plot. The factor with which the deflection angle scales for a source at is the ratio of the angular diameter distances, , where is the angular diameter distance between the lens at and the source at , and is the angular diameter distance between and . It is therefore the factor in which the source redshift for a multiple image system directly enters the lens model. In Figure 7, we compare this ratio for redshifts estimated in this work to those predicted by the CATS v3.1 lens model. We choose to compare to the CATS v3.1 model because it uses Gold, Silver and Bronze images and therefore provides the largest number of redshifts with which we can compare our photometric redshifts. The comparison is done for multiple image systems for which no spectroscopic redshift has been measured, whether in this work or previously. In this way, no spectroscopic redshift could be used as a prior for predicting the redshift. In the figure, is the redshift the CATS team obtained by optimizing their lens model while leaving the redshift as a free parameter. Overall, and agree within the uncertainties. Wang et al. (2015) reached a similar conclusion by comparing and for the multiple images predicted by the CATS v2 lens model of the HFF cluster Abell 2744. This is encouraging because similar inputs to the models allow a more direction comparison of the results.
6. Stellar Mass Fraction
6.1. Stellar mass density map
The lens model provides an estimate for the total mass density of the cluster, composed of mostly invisible dark matter. A fractional component of the total mass density comes from stars and can be inferred from the observed stellar light, independently from the lens model. The Spitzer IRAC m image samples close to rest-frame -band for the cluster, so we use the m fluxes from cluster members to estimate the cluster stellar mass distribution. The cluster members come from the selection by Grillo et al. (2015), consisting of 109 spectroscopically confirmed and 66 photometrically selected cluster members.
To create an image with m flux from cluster members only, we first create a mask with value 1 for pixels that belong to cluster members in the F160W image and 0 otherwise. We then convolve the mask with the m PSF to match the IRAC angular resolution, set the pixels below 10% of the peak value to zero, and resample the mask onto the IRAC pixel grid. We obtain the m map of cluster members by setting all IRAC pixels not belonging to cluster members to zero and smoothing the final surface brightness map with a two-pixel wide Gaussian kernel.
The IRAC surface brightness map is transformed into a stellar surface mass density map (stellar mass density map, hereafter) by first converting the 3.6m flux into a -band luminosity map. The luminosity map is then multiplied by the stellar mass to light ratio derived by Bell et al. (2003) using the so-called “diet” Salpeter stellar initial mass function (IMF), which has 70% of the mass of the Salpeter (1955) IMF due to fewer stars at low masses. Bell et al. (2003) obtained a stellar mass to light ratio of in the stellar mass bin . Their values are insensitive to the chosen stellar mass bin. The error on is the largest source of statistical uncertainty in the stellar mass density map.
The main source of systematic uncertainty in the stellar mass density map is the unknown initial mass function (IMF). For example, if we adopt a Salpeter (1955) IMF, as suggested by studies of massive early-type galaxies, the stellar mass density increases by a factor of 1.55 everywhere. We also assess the cluster member selection as a source of systematic uncertainty. Grillo et al. (2015) estimate that their cluster member catalog is complete down to a stellar mass of within the CLASH F160W footprint. We estimate the fraction of stellar mass density not included in our analysis due to the incomplete cluster member selection at lower stellar masses. We compare the integral of the stellar mass function obtained by Annunziatella et al. (2014) for MACS J1206.2-0847, another CLASH cluster at similar redshift (), over the range of complete stellar masses from the Grillo et al. (2015) selection to the integral over all stellar masses. We find that we only exclude of the stellar mass within the F160W footprint from CLASH as a result of the incomplete cluster member selection. Grillo et al. (2015) select cluster members down to , yet with completeness in the stellar mass range . Therefore, the estimated loss in stellar mass is a slight overestimate of the loss due to the incomplete cluster member selection. The presence of the ICL, when not accounted for, can also cause the stellar mass density to be underestimated (e.g. Gonzalez et al., 2013). Burke et al. (2015) recently measured the fraction of total cluster light contained in the ICL for 13/25 CLASH clusters, including MACSJ0416. For MACSJ0416, they found that of the total cluster light is contained in the ICL. Both the stellar mass incompleteness and ICL act to decrease the measured stellar mass density. Both effects, however, are an order or magnitude smaller than the uncertainty due to the IMF and the stellar mass to light ratio obtained by Bell et al. (2003).
6.2. Stellar to total mass ratio
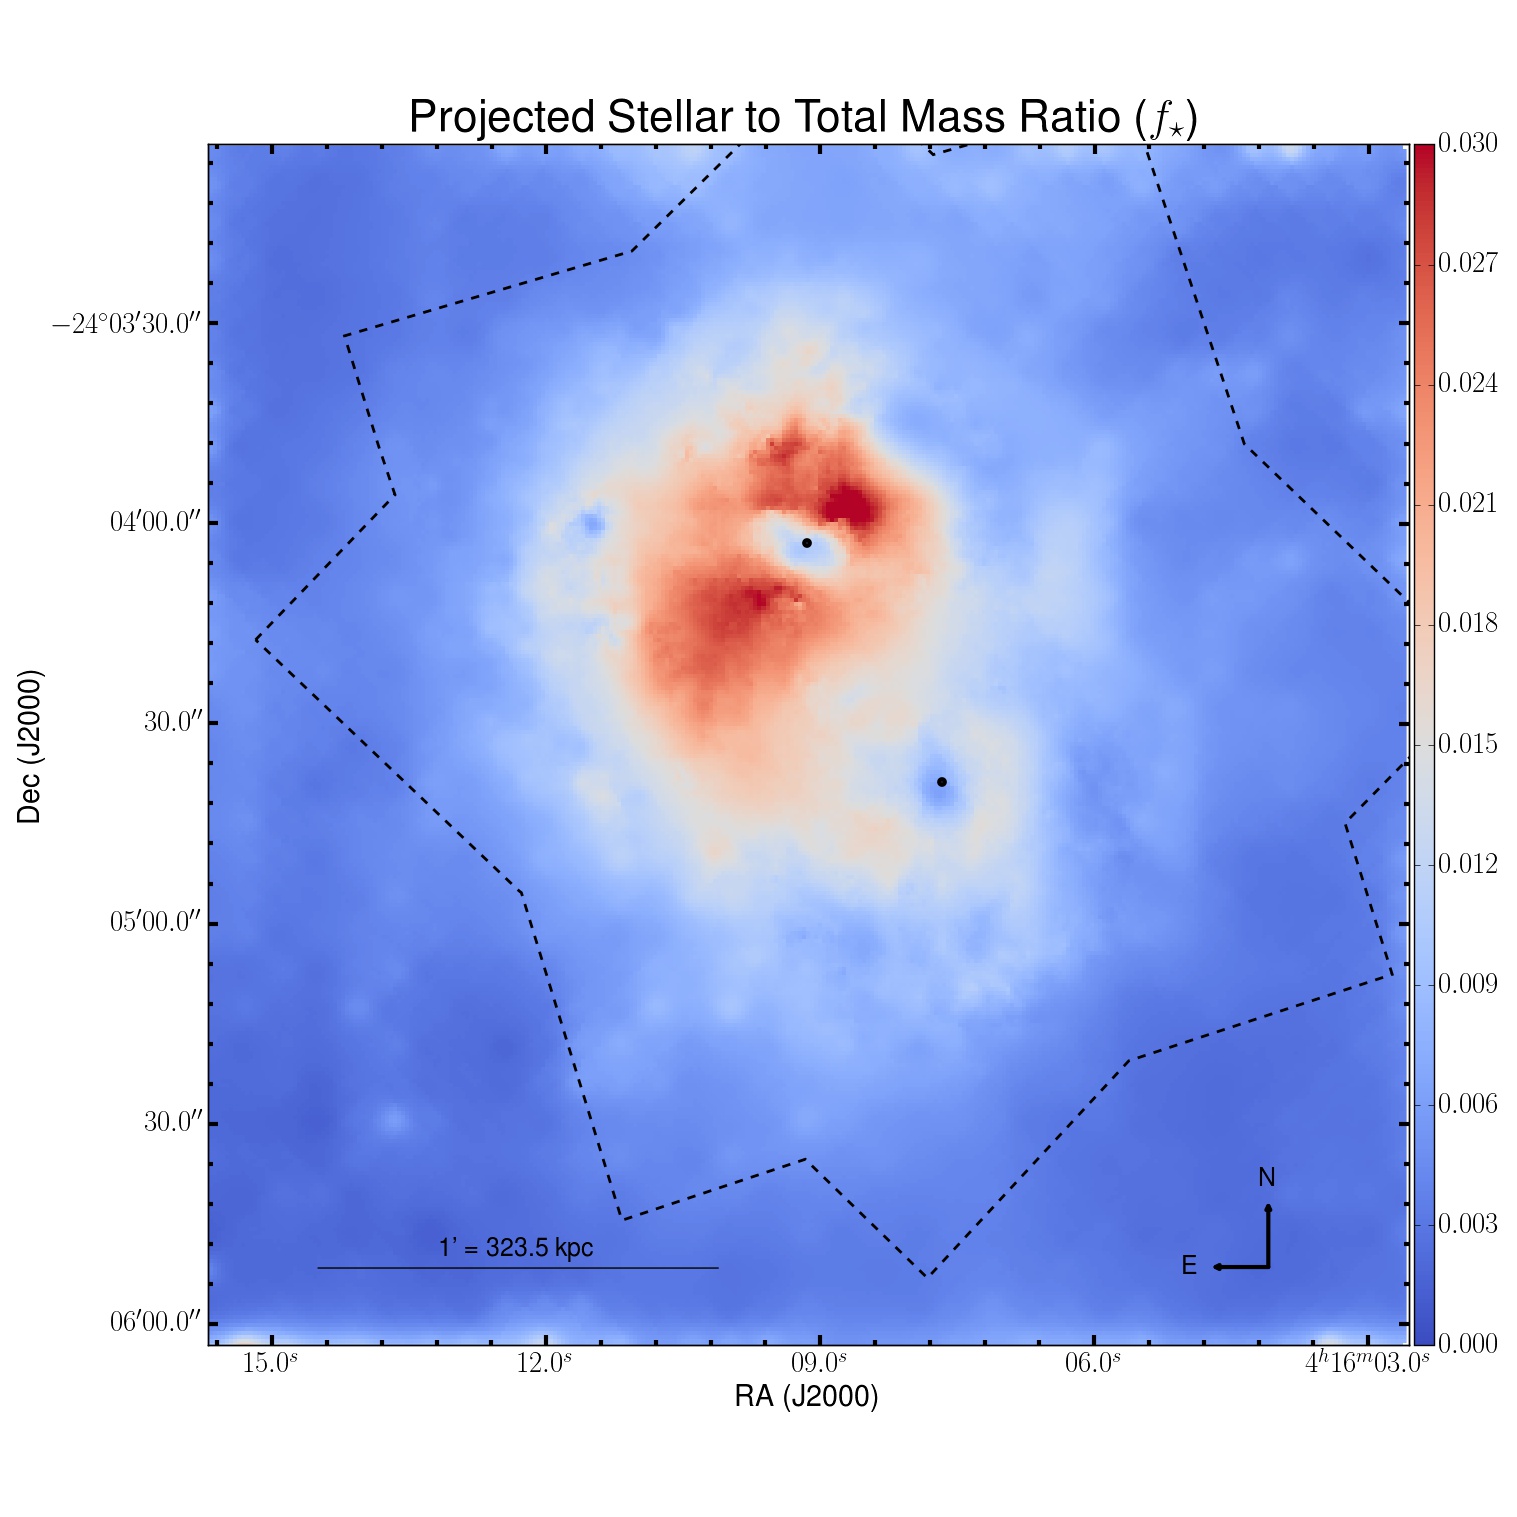
We obtain the projected stellar to total mass ratio (, hereafter) map by dividing the stellar mass density map obtained from photometry by the total surface mass density map (total mass density, hereafter) obtained from our lens model. Before division, we match the resolutions of the two maps. The stellar mass density map resolution is controlled by the Spitzer IRAC m imaging resolution, which is roughly uniform across the field. On the other hand, the resolution of the total mass density varies considerably across the field as a result of two processes that occur during the lens modeling procedure. The first effect is regularization, which globally degrades the resolution of the total mass density map. In order to estimate the decrease in resolution due to regularization, we used a simulated galaxy cluster designed to match the data quality of the HFF, Hera (Meneghetti et al., in preparation). We made our own lens model of Hera that includes the effects of regularization, which we compare to the correct lensing maps from the simulation (M. Meneghetti, private communication). The correct simulated lensing maps are of a uniform resolution that is higher than the resolution of our lensing maps. To determine the global resolution correction, we variably degrade the resolution of the simulated convergence map until we find the best match to our reconstructed convergence map. The second effect is non-uniformity in the grid introduced by the lens modeler to match the of the lensing measurements (Bradač et al., 2009b). The process of increasing the resolution in this manner will be referred to as refinement hereafter. Each pixel in the lensing map has an associated refinement level. The refinement grid for MACSJ0416 has four levels: 1,2,4 and 8. Level 1 refinement represents no refinement and is reserved for the outskirts of the cluster. Level 8 refinement is applied in a circular region centered on the multiple images used in the lens model with radii equal to 2.4 arcseconds. Refinement levels 2 and 4 are used to mitigate discontinuities between level 1 and level 8 refinement. Refinement level 4 is used around the NE and SW BCG in circles of radii 0.6 and 0.45 arcminutes, respectively.
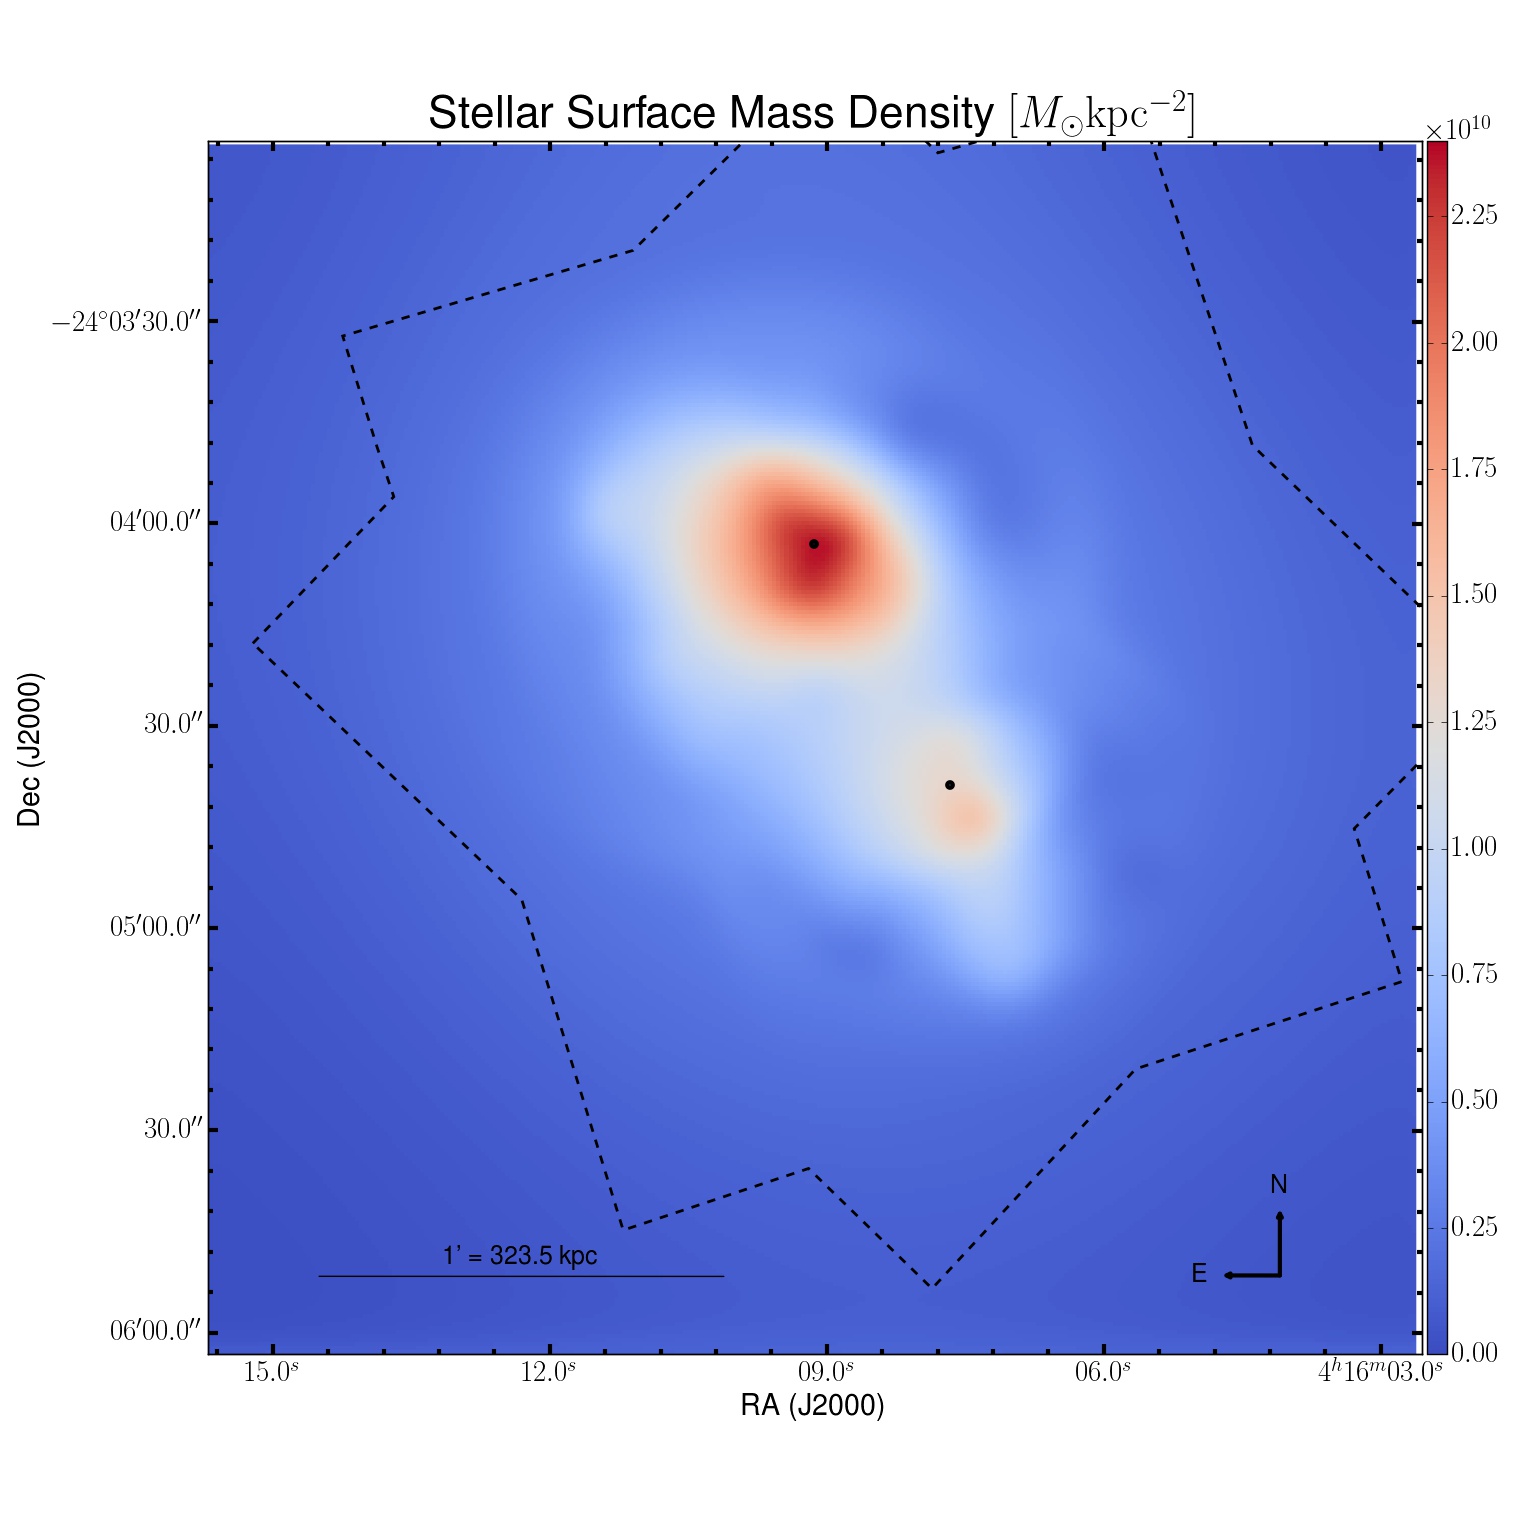
To match the resolution of the stellar mass density map to that of the total mass density map from our lens model, we convolve the stellar mass density map with a Gaussian kernel of spatially varying width. We vary the kernel width according to the level of refinement at each pixel. The kernel width in refinement level 2 regions is always half the width of the kernel used in refinement level 1 regions. Likewise, the kernel width in refinement levels 4 and 8 are always and of the width of the kernel used in refinement level 1 regions, respectively. We vary the refinement level 1 kernel width from 0 to 1 arcminutes and assess the squared difference in the convergence in our reconstruction and the simulated map, finding a best fit kernel width of arcminutes in the refinement level 1 region. The stellar mass density map is convolved with the four different kernels in the four refinement regions determined by this value alone. The resulting resolution-corrected stellar mass density map is shown in the left panel of Figure 8.
The map is shown in the right panel of Figure 8. There is significant variation in throughout the cluster. While reaches as high as in some places, the global mean within the stellar mass-complete region of the map is (stat.; 68% confidence), after adding in a ICL contribution to the stellar mass density determined by Burke et al. (2015).
The IMF is largest source of systematic uncertainty in . The choice of a Salpeter (1955) IMF over the diet-Salpter IMF assumed in this work would lead to an increase in the stellar mass density map, and therefore in , of . Another source of systematic error in is the choice of cosmology, which affects both the stellar mass density and the total mass density. Cosmology impacts the stellar mass density through the distance modulus, which is used to convert the observed surface brightness of cluster members to physical surface brightness. Comparing the distance modulus calculated using our fiducial one-significant-figure concordance cosmology and a two-significant-figure cosmology from (Planck Collaboration, 2015, e.g.), we see a difference of . The choice of cosmology has a much smaller effect on the total mass density. Cosmology impacts the total mass density through the critical surface mass density, . The difference in is . The effect of cosmology on is not as significant as the effect on the distance modulus because it enters in a ratio of angular diameter distances.
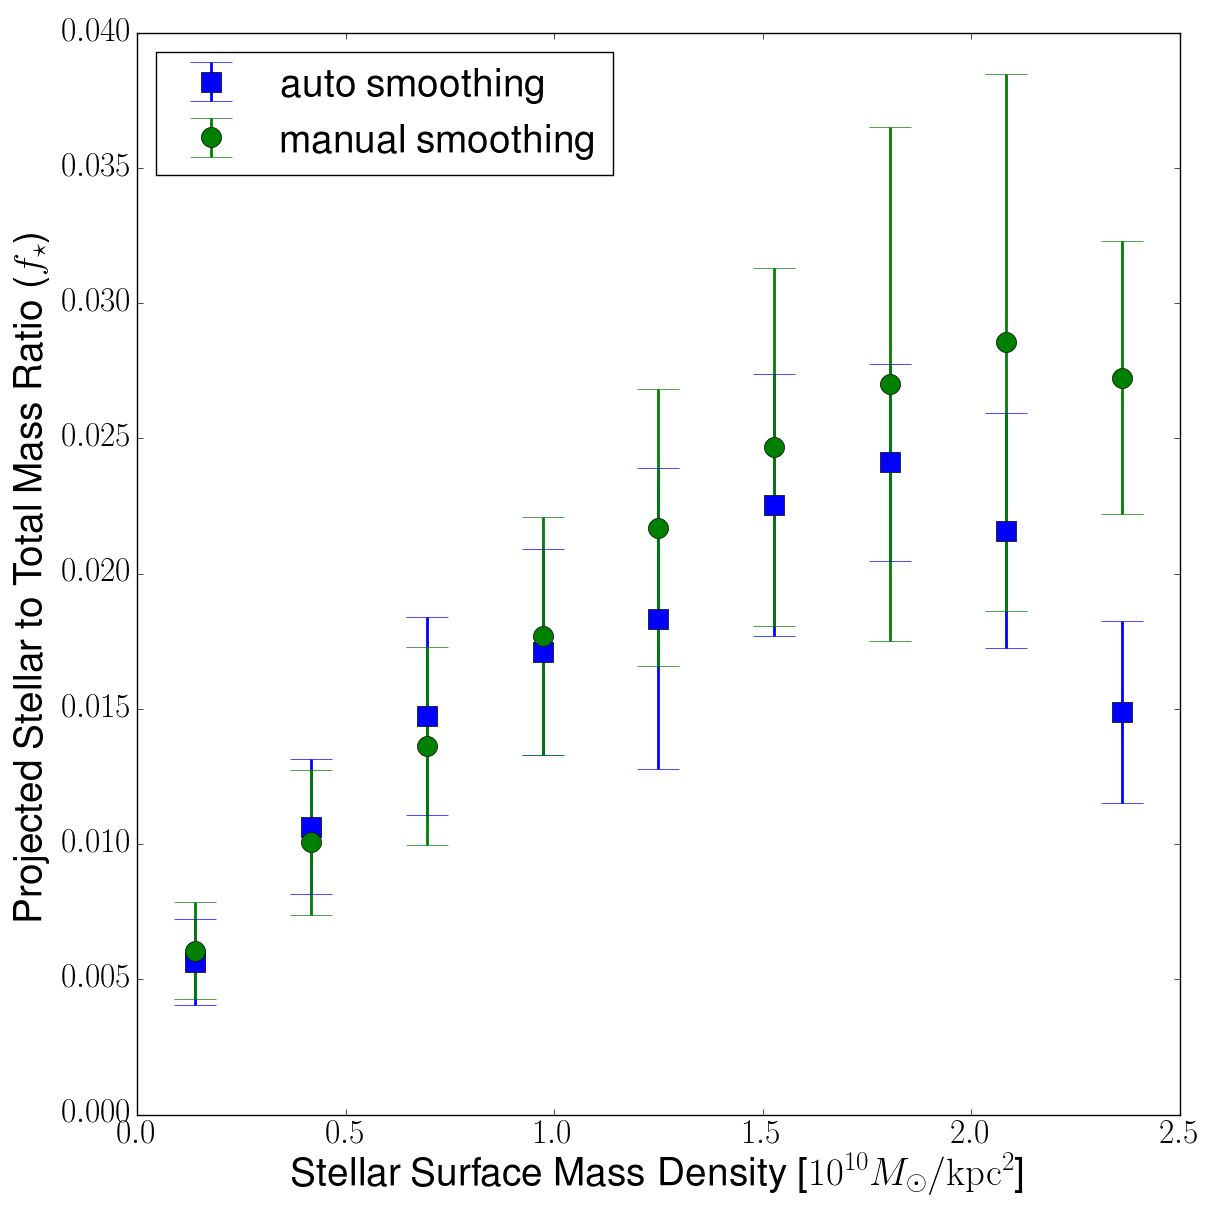
We also assess the potential systematic error resulting from smoothing the stellar mass density map to match the resolution of the total mass density map as described above. We show the dependence of on the stellar surface mass density in Figure 9 for two different smoothing approaches. The “auto smoothing” method is the one described above. The “manual smoothing” approach differs from the previous approach in how we estimate the optimal kernel width at each refinement level. In the auto smoothing method, the kernel width in each refinement region is simply times the kernel width in refinement region 1, where is the refinement level. In the manual smoothing method, however, we determine the optimal kernel width in each refinement region separately. For each refinement level, we mask out the part of the convergence maps not refined at that level before comparing the squared difference in the simulated and reconstructed convergence maps for a range of kernel widths between 0 and 1 arcminutes. In the regions corresponding to refinement levels 1 and 2, we find similar kernel widths using both smoothing methods. However, we find much smaller kernel widths in regions corresponding to refinement levels 4 and 8 when using the manual smoothing method. The stellar mass density map is smoothed significantly less near the BCGs in the manual smoothing approach. This effect is illustrated in Figure 9. In the auto smoothing approach, there is a downturn in for stellar surface mass densities . The downturn is significantly less pronounced in the manual smoothing approach, where the peaks of the stellar mass density are more preserved due to less smoothing. Though a downturn in for stellar surface mass densities associated with the two BCGs could indicate interesting astrophysics, such as decreased star formation efficiency in the BCGs or a varying IMF, it is not robust against the choice of smoothing. The disparity in between the auto and manual smoothing approaches at stellar surface mass densities observed in Figure 9 provides an estimate of the systematic error in as a result of smoothing the stellar mass density map. Overall, however, the choice of smoothing approach only affects by , sub-dominant to the statistical error on . The trend in with stellar surface mass density for stellar surface mass densities is insensitive to the smoothing approach. This trend holds over of the area of the stellar mass complete region of the map because values of the stellar surface mass densities exceeding are rare, only being observed near the peaks of the two BCGs, as can be seen in the left panel of Figure 8. Thus our conclusion that there is considerable variation in throughout the majority of the HST WFC3/IR FOV is also insensitive to the systematics associated with smoothing.
We compare our value of to values obtained in the recent literature. Bahcall & Kulier (2014) measured for groups and clusters in the MaxBCG cluster catalog (Koester et al., 2007). Their cluster sample is taken from a photometric redshift range of . Their measurements cover a large range of scales () and total masses (), where is the total mass within , the radius within which the mean density is 200 times the matter density of the universe. On all scales larger than a few hundred , Bahcall & Kulier (2014) measure a constant value of (68% confidence). For the most massive clusters in their sample, which are most analogous to MACSJ0416, they report a similar value of . Bahcall & Kulier (2014) used stellar mass to light ratios calculated with i-band magnitudes from the Sloan Digital Sky Survey (SDSS; York et al., 2000) while employing a Chabrier IMF. In order to directly compare our results to Bahcall & Kulier (2014), we recalculated using F105W, the band with the smallest K-correction to SDSS i-band at the redshift of MACSJ0416, and then scaled the resulting light map using the same stellar mass to light ratio that they used, . After recalculating, we obtain a value of (stat.; 68% confidence), in agreement with the large scale value obtained by Bahcall & Kulier (2014). Gonzalez et al. (2013) measured for 12 clusters at over the mass range . They measure values of ranging from at the lower mass end of their sample to at the upper mass end. Umetsu et al. (2014) recently measured for MACSJ0416. We recalculated in the same band (WFPC2 F814W) and using the same stellar mass to light ratio as Gonzalez et al. (2013) (), finding a value of (stat.; 68% confidence). While MACSJ0416 is at higher redshift () and has higher mass than the clusters studied by Gonzalez et al. (2013), our measured value of for MACSJ0416 is comparable to the values measured by Gonzalez et al. (2013) at the highest masses. We also note that the area in which we calculate is smaller than , the radius in which Gonzalez et al. (2013) measured for their cluster sample. Balestra et al. (2015) measure =1.82 for MACSJ0416. Adopting this value of , the region in which we measure is . We assumed a 30% error on the values of (cf. Bell et al., 2003) when computing to compare to the values of reported by Bahcall & Kulier (2014) and Gonzalez et al. (2013).
7. Conclusions
The massive galaxy cluster MACSJ0416 is a powerful gravitational lens with excellent constraints for lens modeling. A coordinated search for multiple images of strongly-lensed galaxies performed by several lens modeling teams found candidate multiple images consisting of source galaxies. In order to provide the best constraints to the many lens modeling teams, including our own, we inspected each of these candidate multiple images in the GLASS spectroscopy. Using GLASS spectroscopic measurements together with constraints obtained through the collaborative HFF modeling effort, we produced a gravitational lens model of MACSJ0416. We then compared the projected stellar mass density map derived from IRAC photometry to the total mass density map obtained from our lens model to study the projected stellar to total mass fraction throughout the cluster field. Our main results are summarized here:
-
1.
We have measured spectroscopic redshifts for 31 multiple images (quality flag 3 (probable) and 4 (secure)), confirming 6 multiple image systems for the first time. The spectroscopically confirmed images were used to constrain our gravitational lens models and the nine other lens models discussed in this work. These lens models, including our own, are publicly available1010footnotemark: 10.
-
2.
We performed a visual search for faint emission and absorption lines, establishing a spectroscopic redshift catalog of weakly-lensed galaxies throughout the primary cluster field. We compared our photometric redshifts with grism spectroscopic redshifts and found good agreement, giving us more confidence in the photometric redshifts (and their errors) of the multiple images. We compared our photometric redshifts with redshifts determined from the v3.1 CATS lens model of MACSJ0416 for the multiple images used in their lens model. We find general agreement with their redshifts.
-
3.
The cumulative magnified source plane area (cumulative area) predicted by our lens model was compared with the nine other lens models of MACSJ0416 constrained using products from the same imaging and spectroscopy data. The cumulative area predictions agree among the models for (mostly near the cluster core), but the results diverge among the models for the outlying regions with . We attribute the model differences to the lack of constrains in this region, with the exception of our model which uses weak lensing constraints derived from the HFF imaging data. Despite the conservative approach of including only the Gold (spec-) and Silver (high confidence phot-) multiple image systems identified by the HFF modeling collaboration, systematics from misidentification and redshift estimation of the Silver systems may influence the lens model. However, the inclusion of grism spectroscopic redshifts helps the lens modeling by providing stronger constraints and revising the incorrect redshifts used in the previous models.
-
4.
We obtained a stellar surface mass density map from deep Spitzer/IRAC imaging data, using cluster members selected by Grillo et al. (2015). We compare the stellar surface mass density map to the total surface mass density produced from our lens model, producing a map of the projected stellar mass ratio, . There is significant variation in throughout the cluster. increases with stellar surface mass density up to stellar surface mass density of , above which our results are inconclusive. The global mean projected stellar mass fraction is (stat.; 68% confidence) using a diet-Salpeter IMF. We compare our results with recent measurements of in the literature taken over a wide range of total cluster masses and redshifts. After correcting for different IMFs and filters used to convert stellar light to mass, we find that our measured value of is broadly consistent with the literature values.
References
- Annunziatella et al. (2014) Annunziatella, M., Biviano, A., Mercurio, A., et al. 2014, A&A, 571, A80
- Bahcall & Kulier (2014) Bahcall, N. A., & Kulier, A. 2014, MNRAS, 439, 2505
- Balestra et al. (2015) Balestra, I., Mercurio, A., Sartoris, B., et al. 2015, ArXiv e-prints, arXiv:1511.02522
- Bell et al. (2003) Bell, E. F., McIntosh, D. H., Katz, N., & Weinberg, M. D. 2003, ApJS, 149, 289
- Benítez (2000) Benítez, N. 2000, ApJ, 536, 571
- Bertin & Arnouts (1996) Bertin, E., & Arnouts, S. 1996, Astronomy and Astrophysics Supplement, 117, 393
- Bradač et al. (2005) Bradač, M., Erben, T., Schneider, P., et al. 2005, A&A, 437, 49
- Bradač et al. (2006) Bradač, M., Clowe, D., Gonzalez, A. H., et al. 2006, ApJ, 652, 937
- Bradač et al. (2009a) Bradač, M., Treu, T., Applegate, D., et al. 2009a, ApJ, 706, 1201
- Bradač et al. (2009b) —. 2009b, ApJ, 706, 1201
- Brammer et al. (2014) Brammer, G. B., Pirzkal, N., McCullough, P. R., & MacKenty, J. W. 2014, STScI ISR
- Brammer et al. (2015) Brammer, G. B., Ryan, R., & Pirzkal, N. 2015, STScI ISR 2015-17
- Brammer et al. (2012) Brammer, G. B., van Dokkum, P. G., Franx, M., et al. 2012, The Astrophysical Journal Supplement, 200, 13
- Burke et al. (2015) Burke, C., Hilton, M., & Collins, C. 2015, MNRAS, 449, 2353
- Clowe et al. (2006) Clowe, D., Bradač, M., Gonzalez, A. H., et al. 2006, ApJ, 648, L109
- Coe et al. (2013) Coe, D., Zitrin, A., Carrasco, M., et al. 2013, The Astrophysical Journal, 762, 32
- Dahlen et al. (2013) Dahlen, T., Mobasher, B., Faber, S. M., et al. 2013, The Astrophysical Journal, 775, 93
- Diego et al. (2015a) Diego, J. M., Broadhurst, T., Molnar, S. M., Lam, D., & Lim, J. 2015a, MNRAS, 447, 3130
- Diego et al. (2015b) Diego, J. M., Broadhurst, T., Zitrin, A., et al. 2015b, MNRAS, 451, 3920
- Ebeling et al. (2001) Ebeling, H., Edge, A. C., & Henry, J. P. 2001, ApJ, 553, 668
- Erben et al. (2001) Erben, T., Van Waerbeke, L., Bertin, E., Mellier, Y., & Schneider, P. 2001, A&A, 366, 717
- Fioc & Rocca-Volmerange (1997) Fioc, M., & Rocca-Volmerange, B. 1997, A&A, 326, 950
- Gonzaga (2012) Gonzaga, S. 2012, The DrizzlePac Handbook (STScI)
- Gonzalez et al. (2013) Gonzalez, A. H., Sivanandam, S., Zabludoff, A. I., & Zaritsky, D. 2013, ApJ, 778, 14
- Grillo et al. (2015) Grillo, C., Suyu, S. H., Rosati, P., et al. 2015, ApJ, 800, 38
- Hoekstra et al. (1998) Hoekstra, H., Franx, M., Kuijken, K., & Squires, G. 1998, ApJ, 504, 636
- Jauzac et al. (2014) Jauzac, M., Clément, B., Limousin, M., et al. 2014, MNRAS, 443, 1549
- Jauzac et al. (2015a) Jauzac, M., Richard, J., Jullo, E., et al. 2015a, MNRAS, 452, 1437
- Jauzac et al. (2015b) Jauzac, M., Jullo, E., Eckert, D., et al. 2015b, MNRAS, 446, 4132
- Johnson et al. (2014) Johnson, T. L., Sharon, K., Bayliss, M. B., et al. 2014, ApJ, 797, 48
- Kaiser et al. (1995) Kaiser, N., Squires, G., & Broadhurst, T. 1995, ApJ, 449, 460
- Kawamata et al. (2015) Kawamata, R., Oguri, M., Ishigaki, M., Shimasaku, K., & Ouchi, M. 2015, ArXiv e-prints, arXiv:1510.06400
- Koester et al. (2007) Koester, B. P., McKay, T. A., Annis, J., et al. 2007, ApJ, 660, 239
- Luppino & Kaiser (1997) Luppino, G. A., & Kaiser, N. 1997, ApJ, 475, 20
- Mann & Ebeling (2012) Mann, A. W., & Ebeling, H. 2012, MNRAS, 420, 2120
- Massey et al. (2014) Massey, R., Schrabback, T., Cordes, O., et al. 2014, MNRAS, 439, 887
- Merten et al. (2015) Merten, J., Meneghetti, M., Postman, M., et al. 2015, ApJ, 806, 4
- Momcheva et al. (2015) Momcheva, I. G., Brammer, G. B., van Dokkum, P. G., et al. 2015, ArXiv e-prints, arXiv:1510.02106
- Newman et al. (2013) Newman, A. B., Treu, T., Ellis, R. S., & Sand, D. J. 2013, ApJ, 765, 25
- Ogrean et al. (2015) Ogrean, G. A., van Weeren, R. J., Jones, C., et al. 2015, ApJ, 812, 153
- Oke (1974) Oke, J. B. 1974, ApJS, 27, 21
- Planck Collaboration (2015) Planck Collaboration. 2015, ArXiv e-prints, arXiv:1502.01589
- Postman et al. (2012) Postman, M., Coe, D., Benítez, N., et al. 2012, The Astrophysical Journal Supplement, 199, 25
- Press (1997) Press, W. H. 1997, in Unsolved Problems in Astrophysics, ed. J. N. Bahcall & J. P. Ostriker, 49–60
- Richard et al. (2014) Richard, J., Jauzac, M., Limousin, M., et al. 2014, MNRAS, 444, 268
- Rodney et al. (2015a) Rodney, S. A., Patel, B., Scolnic, D., et al. 2015a, ArXiv e-prints, arXiv:1505.06211
- Rodney et al. (2015b) Rodney, S. A., Strolger, L.-G., Kelly, P. L., et al. 2015b, ArXiv e-prints, arXiv:1512.05734
- Salpeter (1955) Salpeter, E. E. 1955, ApJ, 121, 161
- Sand et al. (2008) Sand, D. J., Treu, T., Ellis, R. S., Smith, G. P., & Kneib, J. 2008, ApJ, 674, 711
- Schmidt et al. (2014) Schmidt, K. B., Treu, T., Brammer, G. B., et al. 2014, The Astrophysical Journal Letters, 782, L36
- Schmidt et al. (2015) Schmidt, K. B., Treu, T., Bradač, M., et al. 2015, ArXiv e-prints, arXiv:1511.04205
- Schrabback et al. (2007) Schrabback, T., Erben, T., Simon, P., et al. 2007, A&A, 468, 823
- Schrabback et al. (2010) Schrabback, T., Hartlap, J., Joachimi, B., et al. 2010, A&A, 516, A63
- Sharon et al. (2014) Sharon, K., Gladders, M. D., Rigby, J. R., et al. 2014, ApJ, 795, 50
- Treu & Ellis (2014) Treu, T., & Ellis, R. S. 2014, ArXiv e-prints, arXiv:1412.6916
- Treu et al. (2015) Treu, T., Schmidt, K. B., Brammer, G. B., et al. 2015, ApJ, 812, 114
- Treu et al. (2016) Treu, T., Brammer, G., Diego, J. M., et al. 2016, ApJ, 817, 60
- Umetsu et al. (2014) Umetsu, K., Medezinski, E., Nonino, M., et al. 2014, ApJ, 795, 163
- Wang et al. (2015) Wang, X., Hoag, A., Huang, K.-H., et al. 2015, ApJ, 811, 29
- Werner et al. (2004) Werner, M. W., Roellig, T. L., Low, F. J., et al. 2004, ApJS, 154, 1
- York et al. (2000) York, D. G., Adelman, J., Anderson, Jr., J. E., et al. 2000, AJ, 120, 1579
- Zheng et al. (2012) Zheng, W., Postman, M., Zitrin, A., et al. 2012, Nature, 489, 406
- Zitrin et al. (2013) Zitrin, A., Meneghetti, M., Umetsu, K., et al. 2013, ApJ, 762, L30
- Zitrin et al. (2014) Zitrin, A., Zheng, W., Broadhurst, T., et al. 2014, ApJ, 793, L12
- Zitrin et al. (2015) Zitrin, A., Fabris, A., Merten, J., et al. 2015, ApJ, 801, 44
Appendix A Redshift PDFs for the Silver sample multiply imaged systems not used in the lens model
In Figure 10 we show the PDFs of the individual and, where available, combined redshifts of the multiply imaged systems in the Silver sample that we were unable to use in our lens model. We believe these systems are real, but we were unable to sufficiently constrain their redshifts to include them in the lens model.
Appendix B GLASS spectra of multiply imaged galaxies
In Figures 11-35 we show the GLASS spectra confirming the redshifts of known multiply imaged galaxies in MACSJ0416.
| ID | ID | R.A. | Dec. | Cref. | ref(1) | ref(2) | F140W | Magnification 11Some multiple images have best-fit magnifications that are outside of the 68% confidence interval due to non-Gaussian errors. | Sample | ||||
|---|---|---|---|---|---|---|---|---|---|---|---|---|---|
| (deg.) | (deg.) | (mag.) | |||||||||||
| 1.1 | 245 | 64.040750 | -24.061592 | MJ14 | 1.896 | MJ14 | 1.89 | AZ13 | Gold | ||||
| 1.2 | 244 | 64.043479 | -24.063542 | MJ14 | 1.896 | MJ14 | 1.896 | JR14 | Gold | ||||
| 1.3 | 571 | 64.047354 | -24.068669 | MJ14 | 1.896 | MJ14 | 1.896 | JR14 | Gold | ||||
| 2.1 | 268 | 64.041183 | -24.061881 | MJ14 | 1.8925 | MJ14 | 1.8925 | JR14 | 1.90 | Gold | |||
| 2.2 | 248 | 64.043004 | -24.063036 | MJ14 | 1.8925 | MJ14 | 1.8925 | JR14 | 1.89 | Gold | |||
| 2.3 | 572 | 64.047475 | -24.068850 | MJ14 | 1.8925 | MJ14 | 1.8925 | JR14 | 1.90 | Gold | |||
| 3.1 | 494 | 64.030783 | -24.067117 | MJ14 | 1.9885 | MJ14 | 1.9885 | JR14 | 1.99 | Gold | |||
| 3.2 | 372 | 64.035254 | -24.070981 | MJ14 | 1.9885 | MJ14 | 1.9885 | JR14 | 1.99 | Gold | |||
| 3.3 | 64.041817 | -24.075711 | MJ14 | 1.9885 | MJ14 | 1.9885 | JR14 | 1.99 | Gold | ||||
| 4.122Systems 3 and 4 are believed to be different subtructures of the same source galaxy due to the similar redshift and spatial position of the multiple images in each system. | 494 | 64.030825 | -24.067225 | MJ14 | 1.9886 | 1.99 | Gold | ||||||
| 4.2 | 372 | 64.035154 | -24.070981 | MJ14 | 1.9887 | 1.99 | Gold | ||||||
| 4.3 | 955 | 64.041879 | -24.075856 | MJ14 | 1.9888 | 1.99 | Gold | ||||||
| 5.133The GLASS spectroscopic redshifts of 5.1 and 5.4 were determined after the HFF modeling procedure took place. Therefore, neither image was included in the Gold sample. | 519 | 64.032375 | -24.068411 | TJ14 | 2.09 | Bronze | |||||||
| 5.2 | 520 | 64.032663 | -24.068669 | MJ14 | 2.092 | IB15 | 2.09 | Gold | |||||
| 5.3 | 584 | 64.033513 | -24.069447 | MJ14 | 2.10 | Gold | |||||||
| 5.433The GLASS spectroscopic redshifts of 5.1 and 5.4 were determined after the HFF modeling procedure took place. Therefore, neither image was included in the Gold sample. | 1031 | 64.043554 | -24.076951 | JPK | 2.09 | ||||||||
| 6.1 | 258 | 64.040042 | -24.061839 | TJ14 | |||||||||
| 6.2 | 64.041458 | -24.062589 | TJ14 | ||||||||||
| 6.3 | 64.049400 | -24.072235 | RK | ||||||||||
| 7.1 | 312 | 64.039800 | -24.063092 | MJ14 | 2.0854 | MJ14 | 2.0854 | JR14 | 2.09 | Gold | |||
| 7.2 | 321 | 64.040633 | -24.063561 | MJ14 | 2.0854 | MJ14 | 2.0854 | JR14 | 2.09 | Gold | |||
| 7.3 | 700 | 64.047117 | -24.071108 | MJ14 | 2.0854 | MJ14 | 2.0854 | JR14 | Gold | ||||
| 8.1 | 432 | 64.036596 | -24.066125 | MJ14 | Silver | ||||||||
| 8.2 | 433 | 64.036833 | -24.066342 | MJ14 | Silver | ||||||||
| 8.3p | 924 | 64.046070 | -24.075174 | JPK | |||||||||
| 9.1 | 1088 | 64.027025 | -24.078583 | MJ14 | Silver | ||||||||
| 9.2 | 1107 | 64.027521 | -24.079106 | MJ14 | Silver | ||||||||
| 9.3 | 64.036453 | -24.083973 | MJ14 | ||||||||||
| 10.1 | 1033 | 64.026017 | -24.077156 | MJ14 | 2.2982 | MJ14 | 2.2982 | JR14 | 2.29 | Gold | |||
| 10.2 | 1144 | 64.028471 | -24.079756 | MJ14 | 2.2982 | MJ14 | 2.2982 | JR14 | Gold | ||||
| 10.3 | 1326 | 64.036692 | -24.083901 | MJ14 | 2.2982 | MJ14 | 2.2982 | JR14 | Gold | ||||
| 11.1 | 64.039208 | -24.070367 | MJ14 | 1.0054 | SR14 | Gold | |||||||
| 11.2 | 64.038317 | -24.069753 | MJ14 | 1.0054 | SR14 | Gold | |||||||
| 11.3 | 440 | 64.034259 | -24.066018 | MJ14 | |||||||||
| 11.3a | 471 | 64.035807 | -24.066659 | ||||||||||
| 12.1 | 734 | 64.038263 | -24.073696 | MJ14 | Silver | ||||||||
| 12.2 | 736 | 64.037686 | -24.073294 | MJ14 | Silver | ||||||||
| 12.34412.3 does not belong to the Gold sample despite our measurement of because it is still not known whether 12.3 is the correct counter-image to 12.1 and 12.2, both of which lack spectroscopic confirmation. | 64.029117 | -24.066742 | MJ14 | 1.95 | |||||||||
| 13.1 | 784 | 64.027579 | -24.072786 | MJ14 | 3.2226 | MJ14 | 3.2226 | JR14 | Gold | ||||
| 13.2 | 64.032129 | -24.075169 | MJ14 | 3.2226 | MJ14 | 3.2226 | JR14 | Gold | |||||
| 13.3 | 1224 | 64.040338 | -24.081544 | MJ14 | 3.2226 | MJ14 | 3.2226 | JR14 | Gold | ||||
| 14.155The spectroscopic redshift of system 14 was reported erroneously by Jauzac et al. (2014) at using incomplete CLASH-VLT data. We measured for all three images in the system, in agreement with the redshift obtained using the complete CLASH-VLT data (Grillo et al., 2015, I. Balestra, private communication). | 889 | 64.026233 | -24.074339 | MJ14 | 2.0531 | JR14 | 1.637 | CG15 | 1.63 | Gold | |||
| 14.2 | 880 | 64.031042 | -24.078961 | MJ14 | 2.0531 | JR14 | 1.637 | CG15 | 1.63 | Gold | |||
| 14.3 | 1213 | 64.035825 | -24.081328 | MJ14 | 2.0531 | JR14 | 1.63 | Gold | |||||
| 15.1 | 957 | 64.026860 | -24.075745 | MJ14 | 2.34 | Gold | |||||||
| 15.2 | 64.029438 | -24.078583 | MJ14 | Bronze | |||||||||
| 15.3 | 64.038217 | -24.082993 | MJ14 | ||||||||||
| 16.1 | 1186 | 64.024058 | -24.080894 | MJ14 | 1.9644 | MJ14 | 1.96 | Gold | |||||
| 16.2 | 64.028329 | -24.084542 | MJ14 | 1.9644 | MJ14 | Gold | |||||||
| 16.3 | 1362 | 64.031596 | -24.085769 | MJ14 | 1.9644 | CG15 | 1.97 | Gold | |||||
| 17.1 | 64.029875 | -24.086364 | MJ14 | 2.2181 | MJ14 | 2.2181 | JR14 | Gold | |||||
| 17.2 | 64.028608 | -24.085986 | MJ14 | 2.2181 | MJ14 | 2.2181 | JR14 | Gold | |||||
| 17.3 | 1197 | 64.023329 | -24.081581 | MJ14 | 2.2181 | MJ14 | 2.2181 | JR14 | 2.23 | Gold | |||
| 18.1 | 1341 | 64.026075 | -24.084233 | MJ14 | Silver | ||||||||
| 18.2 | 1305 | 64.025067 | -24.083350 | MJ14 | Silver | ||||||||
| 18.3 | 64.030900 | -24.086744 | MJ14 | ||||||||||
| 23.1 | 750 | 64.044546 | -24.072100 | MJ14 | 2.09 | Gold | |||||||
| 23.2 | 752 | 64.039604 | -24.066631 | MJ14 | Gold | ||||||||
| 23.3 | 332 | 64.034342 | -24.063742 | MJ14 | 2.09 | Gold | |||||||
| 24.1 | 301 | 64.040915 | -24.062959 | MJ14 | Bronze | ||||||||
| 24.2 | 302 | 64.041066 | -24.063057 | MJ14 | Bronze | ||||||||
| 24.3 | 676 | 64.048893 | -24.070871 | MJ14 | |||||||||
| 24.3a | 64.047590 | -24.070764 | JPK | ||||||||||
| 25.1 | 64.044891 | -24.061068 | MJ14 | Bronze | |||||||||
| 25.2 | 64.045448 | -24.061409 | MJ14 | Bronze | |||||||||
| 25.3 | 64.048254 | -24.064513 | MJ14 | Bronze | |||||||||
| 25.4 | 479 | 64.049697 | -24.066948 | MJ14 | Bronze | ||||||||
| 26.1 | 209 | 64.046470 | -24.060393 | MJ14 | 2.19 | Gold | |||||||
| 26.2 | 217 | 64.046963 | -24.060793 | MJ14 | Bronze | ||||||||
| 26.3 | 64.049089 | -24.062876 | MJ14 | ||||||||||
| 27.1 | 488 | 64.048159 | -24.066959 | MJ14 | Silver | ||||||||
| 27.2 | 347 | 64.047465 | -24.066026 | MJ14 | 2.11 | Gold | |||||||
| 27.3 | 210 | 64.042226 | -24.060543 | MJ14 | Bronze | ||||||||
| 28.1 | 64.036457 | -24.067026 | MJ14 | 0.94 | Gold | ||||||||
| 28.2 | 64.036870 | -24.067498 | MJ14 | 0.94 | Gold | ||||||||
| 28.3 | 64.040923 | -24.071151 | MJ14 | ||||||||||
| 28.3a6 | 788 | 64.044083 | -24.074456 | D15 | 0.7097 | IB15 | |||||||
| 29.17729.1 was originally assigned as a Gold image from GLASS spectroscopy, but further analysis after the samples were chosen revealed that the spectroscopic confirmation was too tenuous. Therefore, this object should not be considered to be spectroscopically confirmed. | 280 | 64.034272 | -24.063032 | MJ14 | Gold | ||||||||
| 29.2 | 64.040131 | -24.066757 | MJ14 | ||||||||||
| 29.2a6 | 428 | 64.040480 | -24.066330 | RK | 2.2669 | IB15 | |||||||
| 29.3 | 753 | 64.044610 | -24.071482 | MJ14 | 2.28 | Gold | |||||||
| 30.1 | 1248 | 64.033088 | -24.081806 | MJ14 | Silver | ||||||||
| 30.2 | 1240 | 64.032649 | -24.081546 | MJ14 | Silver | ||||||||
| 31.1 | 1061 | 64.023833 | -24.077621 | MJ14 | Silver | ||||||||
| 31.2 | 64.030507 | -24.082725 | MJ14 | Silver | |||||||||
| 31.3 | 1335 | 64.032456 | -24.083821 | MJ14 | Silver | ||||||||
| 32.1 | 1241 | 64.024130 | -24.081640 | MJ14 | |||||||||
| 32.2 | 64.029591 | -24.085572 | MJ14 | ||||||||||
| 32.3 | 64.030468 | -24.085895 | MJ14 | ||||||||||
| 33.1 | 64.028427 | -24.082995 | MJ14 | Silver | |||||||||
| 33.2 | 64.035052 | -24.085486 | MJ14 | Silver | |||||||||
| 33.3 | 1035 | 64.022980 | -24.077275 | MJ14 | Silver | ||||||||
| 34.1 | 826 | 64.029254 | -24.073289 | MJ14 | Silver | ||||||||
| 34.2 | 875 | 64.030798 | -24.074180 | MJ14 | Silver | ||||||||
| 34.3 | 64.042074 | -24.082294 | RK | ||||||||||
| 35.1 | 64.037492 | -24.083636 | MJ14 | Silver | |||||||||
| 35.2 | 64.029418 | -24.079861 | MJ14 | Silver | |||||||||
| 35.3 | 915 | 64.024937 | -24.075016 | MJ14 | Silver | ||||||||
| 36.1 | 986 | 64.026270 | -24.075507 | MJ14 | |||||||||
| 36.2 | 1308 | 64.038420 | -24.083428 | MJ14 | |||||||||
| 36.3 | 64.029380 | -24.078900 | MJ14 | ||||||||||
| 36.4 | 64.029184 | -24.079041 | MJ14 | ||||||||||
| 37.1 | 1285 | 64.033791 | -24.082863 | MJ14 | Bronze | ||||||||
| 37.2 | 64.031419 | -24.081613 | MJ14 | Bronze | |||||||||
| 37.3 | 884 | 64.022507 | -24.074310 | MJ14 | |||||||||
| 37.3a | 64.022885 | -24.074317 | JPK | ||||||||||
| 38.1 | 1302 | 64.033625 | -24.083178 | MJ14 | Bronze | ||||||||
| 38.2 | 64.031255 | -24.081905 | MJ14 | Bronze | |||||||||
| 38.3 | 64.022701 | -24.074589 | MJ14 | ||||||||||
| 39.1 | 64.037335 | -24.072924 | MJ14 | Bronze | |||||||||
| 39.2 | 64.037731 | -24.073135 | MJ14 | Bronze | |||||||||
| 40.1 | 64.037349 | -24.063062 | MJ14 | Silver | |||||||||
| 40.2 | 64.040346 | -24.064271 | MJ14 | Silver | |||||||||
| 40.3 | 64.047642 | -24.074430 | MJ14 | ||||||||||
| 40.3a | 64.047110 | -24.072435 | RK | ||||||||||
| 41.1 | 64.037183 | -24.063073 | MJ14 | Silver | |||||||||
| 41.2 | 64.040369 | -24.064369 | MJ14 | Silver | |||||||||
| 41.3 | 64.047605 | -24.074313 | MJ14 | ||||||||||
| 41.3a | 64.047064 | -24.072493 | RK | ||||||||||
| 42.1 | 674 | 64.045994 | -24.070768 | MJ14 | Bronze | ||||||||
| 42.2 | 64.042073 | -24.065547 | MJ14 | Bronze | |||||||||
| 42.3 | 261 | 64.035786 | -24.061938 | MJ14 | Bronze | ||||||||
| 43.1 | 1253 | 64.035667 | -24.082050 | MJ14 | Silver | ||||||||
| 43.2 | 1191 | 64.031195 | -24.079959 | MJ14 | Silver | ||||||||
| 43.3 | 64.024425 | -24.073603 | MJ14 | Bronze | |||||||||
| 44.1 | 64.045259 | -24.062757 | MJ14 | Bronze | |||||||||
| 44.2 | 185 | 64.041543 | -24.059997 | MJ14 | Bronze | ||||||||
| 44.3 | 64.049237 | -24.068168 | MJ14 | ||||||||||
| 45.16 | 1159 | 64.035673 | -24.079918 | MJ14 | 2.545 | IB15 | |||||||
| 45.1a | 64.037646 | -24.080469 | JPK | ||||||||||
| 45.2 | 64.025766 | -24.072231 | MJ14 | ||||||||||
| 45.3 | 64.032893 | -24.076993 | MJ14 | ||||||||||
| 46.1 | 64.038256 | -24.080451 | MJ14 | Bronze | |||||||||
| 46.2 | 64.026402 | -24.072239 | MJ14 | Bronze | |||||||||
| 46.3 | 64.033057 | -24.076204 | MJ14 | Bronze | |||||||||
| 47.1 | 64.026328 | -24.076694 | MJ14 | Bronze | |||||||||
| 47.2 | 64.028329 | -24.078999 | MJ14 | Bronze | |||||||||
| 47.3 | 1320 | 64.038206 | -24.083719 | MJ14 | |||||||||
| 48.1 | 1376 | 64.035489 | -24.084668 | MJ14 | Silver | ||||||||
| 48.2 | 64.029244 | -24.081802 | MJ14 | Silver | |||||||||
| 48.3 | 977 | 64.023416 | -24.076122 | MJ14 | Silver | ||||||||
| 49.1 | 896 | 64.033944 | -24.074569 | MJ14 | |||||||||
| 49.2 | 1161 | 64.040175 | -24.079864 | MJ14 | |||||||||
| 49.3 | 64.026833 | -24.069967 | MJ14 | ||||||||||
| 50.1 | 64.034790 | -24.074585 | MJ14 | ||||||||||
| 50.2 | 64.039683 | -24.078869 | MJ14 | ||||||||||
| 50.3 | 64.026789 | -24.069208 | RK | ||||||||||
| 51.1 | 1403 | 64.040160 | -24.080290 | MJ14 | Silver | ||||||||
| 51.2 | 958 | 64.033663 | -24.074752 | MJ14 | Silver | ||||||||
| 51.3 | 64.026620 | -24.070494 | MJ14 | Silver | |||||||||
| 52.1 | 427 | 64.045857 | -24.065830 | MJ14 | Bronze | ||||||||
| 52.2 | 577 | 64.047698 | -24.068668 | MJ14 | Bronze | ||||||||
| 52.3 | 190 | 64.037724 | -24.059826 | MJ14 | |||||||||
| 53.1 | 580 | 64.046023 | -24.068800 | MJ14 | Bronze | ||||||||
| 53.2 | 64.044776 | -24.066682 | MJ14 | ||||||||||
| 53.3 | 223 | 64.036197 | -24.060643 | MJ14 | Bronze | ||||||||
| 54.1 | 712 | 64.046789 | -24.071342 | MJ14 | Bronze | ||||||||
| 54.2 | 464 | 64.041376 | -24.064519 | MJ14 | Silver | ||||||||
| 54.3 | 276 | 64.037157 | -24.062423 | MJ14 | Silver | ||||||||
| 55.1 | 64.035233 | -24.064726 | MJ14 | ||||||||||
| 55.2 | 924 | 64.046070 | -24.075174 | MJ14 | |||||||||
| 55.2a | 64.046836 | -24.075387 | RK | ||||||||||
| 55.3 | 64.038514 | -24.065965 | MJ14 | ||||||||||
| 56.1 | 64.035676 | -24.083589 | MJ14 | ||||||||||
| 56.2 | 64.030097 | -24.080924 | MJ14 | ||||||||||
| 56.3 | 64.023847 | -24.074998 | MJ14 | ||||||||||
| 57.1 | 1027 | 64.026224 | -24.076036 | MJ14 | Bronze | ||||||||
| 57.2 | 64.028843 | -24.079126 | MJ14 | Bronze | |||||||||
| 58.1 | 836 | 64.025187 | -24.073582 | MJ14 | Bronze | ||||||||
| 58.2 | 64.037730 | -24.082390 | MJ14 | ||||||||||
| 58.3 | 64.030481 | -24.079220 | MJ14 | Bronze | |||||||||
| 59.1 | 796 | 64.035851 | -24.072799 | MJ14 | Bronze | ||||||||
| 59.2 | 942 | 64.039936 | -24.075622 | MJ14 | Bronze | ||||||||
| 59.3 | 529 | 64.029105 | -24.067658 | MJ14 | Bronze | ||||||||
| 60.1 | 64.026724 | -24.073720 | MJ14 | ||||||||||
| 60.2 | 64.039708 | -24.082514 | MJ14 | ||||||||||
| 60.3 | 64.030984 | -24.077181 | MJ14 | ||||||||||
| 61.1 | 64.026732 | -24.073540 | MJ14 | ||||||||||
| 61.2 | 64.039768 | -24.082360 | MJ14 | ||||||||||
| 61.3 | 64.030593 | -24.077760 | MJ14 | ||||||||||
| 62.1 | 1135 | 64.026889 | -24.079610 | MJ14 | Bronze | ||||||||
| 62.2 | 1104 | 64.025993 | -24.078892 | MJ14 | Bronze | ||||||||
| 62.3 | 1370 | 64.036488 | -24.084935 | MJ14 | |||||||||
| 63.1 | 1013 | 64.025535 | -24.076650 | MJ14 | Bronze | ||||||||
| 63.2 | 1143 | 64.028147 | -24.079648 | MJ14 | Bronze | ||||||||
| 63.3 | 1350 | 64.037925 | -24.084479 | MJ14 | Bronze | ||||||||
| 64.1 | 1060 | 64.043100 | -24.077590 | MJ14 | |||||||||
| 64.2 | 500 | 64.031139 | -24.067177 | MJ14 | |||||||||
| 65.1 | 1091 | 64.042589 | -24.075532 | MJ14 | Bronze | ||||||||
| 65.2 | 380 | 64.028858 | -24.064627 | MJ14 | Bronze | ||||||||
| 65.3 | 64.037768 | -24.071656 | MJ14 | ||||||||||
| 66.1 | 1262 | 64.038101 | -24.082315 | MJ14 | |||||||||
| 66.2 | 898 | 64.026635 | -24.074675 | MJ14 | |||||||||
| 67.1 | 1262 | 64.038075 | -24.082404 | MJ14 | |||||||||
| 67.2 | 64.025451 | -24.073651 | MJ14 | ||||||||||
| 67.3 | 64.030363 | -24.079019 | MJ14 | ||||||||||
| 68.1 | 817 | 64.036098 | -24.073362 | MJ14 | Bronze | ||||||||
| 68.2 | 64.040352 | -24.076481 | MJ14 | Bronze | |||||||||
| 68.3 | 503 | 64.028017 | -24.067270 | MJ14 | |||||||||
| 69.1 | 64.036256 | -24.074225 | MJ14 | Bronze | |||||||||
| 69.2 | 64.037681 | -24.075260 | MJ14 | Bronze | |||||||||
| 69.3 | 64.028759 | -24.069109 | MJ14 | ||||||||||
| 70.1 | 64.038360 | -24.072385 | MJ14 | ||||||||||
| 70.2 | 64.038640 | -24.072520 | MJ14 | ||||||||||
| 70.3 | 64.032100 | -24.065580 | MJ14 | ||||||||||
| 71.1 | 64.027865 | -24.077908 | MJ14 | ||||||||||
| 71.2 | 64.027410 | -24.077382 | MJ14 | ||||||||||
| 72.1 | 64.031937 | -24.071316 | MJ14 | Bronze | |||||||||
| 72.2 | 64.030952 | -24.070480 | MJ14 | ||||||||||
| 73.1 | 64.043712 | -24.062603 | MJ14 | ||||||||||
| 73.2 | 64.041861 | -24.061243 | MJ14 | ||||||||||
| 75.1 | 683 | 64.027940 | -24.070843 | JPK | |||||||||
| 75.2 | 64.040646 | -24.080156 | JPK | ||||||||||
| 75.3 | 64.033095 | -24.074110 | JPK | ||||||||||
| 76.1 | 64.028127 | -24.070769 | JPK | ||||||||||
| 76.2 | 64.040809 | -24.080081 | JPK | ||||||||||
| 76.3 | 64.033054 | -24.073948 | JPK | ||||||||||
| 77.1 | 64.027688 | -24.070863 | JPK | ||||||||||
| 77.2 | 64.040441 | -24.080174 | JPK | ||||||||||
| 77.3 | 64.033187 | -24.074305 | JPK | ||||||||||
| 78.1 | 64.030426 | -24.081586 | JPK | ||||||||||
| 78.2 | 64.034504 | -24.083680 | JPK | ||||||||||
| 78.3 | 64.023305 | -24.075333 | JPK | ||||||||||
| 79.1 | 64.042799 | -24.066835 | JPK | ||||||||||
| 79.2 | 64.045584 | -24.070439 | JPK | ||||||||||
| 79.3 | 64.033939 | -24.061265 | JPK | ||||||||||
| 80.1 | 64.044641 | -24.064573 | JPK | ||||||||||
| 80.2 | 64.046823 | -24.067960 | JPK | ||||||||||
| 80.3 | 64.040052 | -24.061000 | JPK | ||||||||||
| 81.1 | 64.043629 | -24.067190 | JPK | ||||||||||
| 81.2 | 64.044861 | -24.068615 | JPK | ||||||||||
| 200.1 | 64.028745 | -24.080735 | RK | ||||||||||
| 200.2 | 64.023296 | -24.075063 | RK | ||||||||||
| 201.1 | 64.026265 | -24.068700 | RK | Bronze | |||||||||
| 201.2 | 64.040054 | -24.079110 | RK | Bronze | |||||||||
| 201.3 | 64.034916 | -24.074576 | RK | Bronze | |||||||||
| 202.1 | 64.030745 | -24.070510 | RK | Bronze | |||||||||
| 202.2 | 64.031721 | -24.071343 | RK | Bronze | |||||||||
| 203.1 | 587 | 64.030729 | -24.068882 | RK | Bronze | ||||||||
| 203.2 | 64.033525 | -24.071381 | RK | Bronze | |||||||||
| 203.3 | 1063 | 64.042442 | -24.077683 | RK | |||||||||
| 204.1 | 64.037673 | -24.061023 | RK | ||||||||||
| 204.2 | 64.042884 | -24.063891 | RK | ||||||||||
| 204.3 | 64.048181 | -24.070889 | RK | ||||||||||
| 205.1 | 64.038890 | -24.060637 | RK | ||||||||||
| 205.2 | 64.043317 | -24.062964 | RK | ||||||||||
| 205.3 | 64.049296 | -24.071014 | RK | ||||||||||
| 206.1 | 64.043575 | -24.059000 | RK | ||||||||||
| 206.2 | 264 | 64.047845 | -24.062067 | RK | |||||||||
| 206.3 | 64.050621 | -24.065758 | RK | ||||||||||
| 207.1 | 64.047137 | -24.061139 | RK | ||||||||||
| 207.2 | 470 | 64.050867 | -24.066531 | RK | |||||||||
| D22.1 | 64.034485 | -24.066919 | D15 | ||||||||||
| D22.2 | 64.034181 | -24.066489 | D15 | ||||||||||
| D22.3 | 64.034006 | -24.066447 | D15 | ||||||||||
| D22.4 | 64.033953 | -24.066906 | D15 | ||||||||||
| D27.1 | 64.041894 | -24.077451 | D15 | ||||||||||
| D27.2 | 64.036080 | -24.073203 | D15 | ||||||||||
| D30.1 | 64.040438 | -24.075768 | D15 | ||||||||||
| D30.2 | 64.035965 | -24.072468 | D15 | ||||||||||
| D31.1 | 64.040482 | -24.075471 | D15 | ||||||||||
| D31.2 | 64.036057 | -24.072411 | D15 | ||||||||||
| D32.1 | 767 | 64.045119 | -24.072336 | D15 | |||||||||
| D32.2 | 64.040081 | -24.066730 | D15 | ||||||||||
| D33.1 | 64.045367 | -24.072519 | D15 | ||||||||||
| D33.2 | 64.039992 | -24.066661 | D15 | ||||||||||
| D34.1 | 64.045499 | -24.072674 | D15 | ||||||||||
| D34.2 | 64.039916 | -24.066609 | D15 | ||||||||||
| D36.1 | 64.035459 | -24.067725 | D15 | ||||||||||
| D36.2 | 64.035603 | -24.067953 | D15 | ||||||||||
| D36.3 | 64.035472 | -24.068037 | D15 | ||||||||||
| D36.4 | 64.035183 | -24.067917 | D15 | ||||||||||
Note. — for multiple image systems 19-22 are intentially omitted for consistency with IDs from the recent literature (e.g. Jauzac et al., 2014). Entries where ends in “p” refer to proposed multiple candidates which are less confident identifications. Entries where ends in “a” offer alternative images to those with the same ID listed without “a.” Entries where is listed as “…” had no match in the grism detection image. RA and DEC reference the HFF v1.0 60mas mosaics. Cref. lists the shortnames for publications in which the coordinates have appeared or will appear, if publication is in preparation. (MJ14 = Jauzac et al. (2014), TJ14 = Johnson et al. (2014), SR14 = Rodney et al. in prep., JPK = Kneib et al. in prep., D15 = Diego et al. (2015a), RK = Kawamata et al. (2015), JR14 = Richard et al. (2014), AZ13 = Zitrin et al. (2013), CG15 = Grillo et al. (2015), IB15 = Balestra et al. (2015). Some multiple images have been targeted with spectroscopy by multiple authors. We list at most two references to spectroscopic redshifts, reporting the number of significant figures as they appear in each reference. () is the grism redshift we measure in this work. The typical uncertainty on is 0.01, corresponding to a grism wavelength uncertainty of . is the redshift obtained for a mulitple image system from hierarchical Bayesian modeling. ( conf. limits) is only shown for systems with two or more reliable photometric redshift measurements. Objects for which F140W magnitudes ( conf. limits) are listed as “…” are not detected in our photometric catalog. The magnification ( conf. limits) was calculated using the best-fit lens model scaled to the spectroscopic redshift of the mulitple image system, or if the spectroscopic redshift was not known. The “Sample” column refers to the category in which the HFF lens modeling assigned each multiple image based on the spectroscopic and photometric constraints. Only Gold and Silver images were used to constrain our lens model.
268 & 2.1 64.04116 -24.06185 1.90 4 2 [O iii] [O ii]
248 2.2 64.04304 -24.06305 1.89 4 2 [O ii] [O iii]
572 2.3 64.04748 -24.06885 1.90 4 2 [O iii] [O ii]
494 3.1;4.133Systems 3 and 4 are believed to be different subtructures of the same source galaxy due to the similar redshift and spatial position of the multiple images in each system. 64.03080 -24.06720 1.99 4 3 [O iii] H [O ii]
372 3.2;4.2 64.03518 -24.07098 1.99 4 2 [O iii] H
955 3.3;4.3 64.04185 -24.07581 1.99 4 3 [O iii] H [O ii]
519 5.1 64.03245 -24.06848 2.09 4 2 [O iii] H
520 5.2 64.03264 -24.06866 2.09 4 2 [O iii] H
584 5.3 64.03355 -24.06947 2.10 4 2 [O iii] H
1031 5.4 64.04355 -24.07696 2.09 4 2 [O iii] H
312 7.1 64.03981 -24.06310 2.09 4 2 [O iii] [O ii]
321 7.2 64.04058 -24.06354 2.09 4 1 [O iii]
1033 10.1 64.02602 -24.07717 2.29 3 1 [O iii]
456 12.344The uncertainty in for ID is , rather than the nominal because the redshift was obtained by fitting its continuum emission in the grism to SED templates rather than through the identification of emission lines. 64.02898 -24.06665 1.96 4 0
889 14.1 64.02623 -24.07433 1.63 4 3 [O iii] H [O ii]
880 14.2 64.03104 -24.07896 1.63 4 2 [O iii] [O ii]
1213 14.3 64.03583 -24.08132 1.63 4 3 [O iii] H [O ii]
957 15.1 64.02687 -24.07574 2.34 3 1 [O iii]
1186 16.1 64.02406 -24.08090 1.96 4 3 [O iii] H [O ii]
1362 16.3 64.03160 -24.08577 1.97 4 1 [O iii]
1197 17.3 64.02335 -24.08158 2.23 4 2 [O iii] [O ii]
750 23.1 64.04454 -24.07208 2.09 4 2 [O iii] [O ii]
332 23.3 64.03432 -24.06372 2.09 4 3 [O iii] H [O ii]
209 26.1 64.04646 -24.06040 2.19 3 2 [O iii] [O ii]
347 27.2 64.04746 -24.06601 2.11 4 1 [O iii]
394 28.1;28.25528.1 and 28.2 were detected as the same object in the segmentation map used to extract the grism data. Like 12.3, the redshifts of 28.1 and 28.2 were obtained by fitting the continuum emission in the grism to SED templates. 64.03667 -24.06732 0.94 4 0
753 29.3 64.04462 -24.07148 2.28 4 1 [O iii]
141 64.03330 -24.05824 0.82 4 2 H [O iii]
98 64.02949 -24.05639 2.14 4 3 [O iii] H [O ii]
94 64.03309 -24.05633 1.36 4 3 H [O iii] [O ii]
90000 64.02515 -24.05637 0.39 4 0
108 64.03986 -24.05719 2.22 4 3 [O iii] H [O ii]
90001 64.05564 -24.06030 0.41 4 0
155 64.02725 -24.05911 0.37 4 0
451 64.05742 -24.06632 1.35 4 4 H [S ii] [O iii] [O ii]
90002 64.05920 -24.06649 0.31 4 1 H
186 64.04089 -24.06035 0.40 4 0
Note. — GLASS spectroscopic results for all mulitply-lensed and the first 10 singly-lensed galaxies. The full catalog is given in the electronic edition. lists the best-fit and 68% confidence limits on the photometric redshift from the ASTRODEEP photometric catalog. is the grism spectroscopic redshift we measure in this work. The nominal uncertainty on is for objects with N. However, the redshift uncertainty is more variable for objects with N, which were confirmed by fitting the continuum grism spectra to SED templates (G. Brammer, in prep.). The full GLASS redshift PDFs are available online8.