Separating Galaxies from the Cluster Dark Matter Halo in Abell 611
Abstract
We investigate the mass content of galaxies in the core of the galaxy cluster Abell 611. We perform a strong lensing analysis of the cluster core and use velocity dispersion measurements for individual cluster members as additional constraints. Despite the small number of multiply-imaged systems and cluster members with central velocity dispersions available in the core of A611, the addition of velocity dispersion measurements leads to tighter constraints on the mass associated with the galaxy component, and as a result, on the mass associated with the dark matter halo. Without the spectroscopic velocity dispersions, we would overestimate the mass of the galaxy component by a factor of , or, equivalently, we would underestimate the mass of the cluster dark halo by . We perform an additional lensing analysis using surface brightness (SB) reconstruction of the tangential giant arc. This approach improves by up to a factor the constraints on the mass parameters of the 5 galaxies close to the arc. The resulting parameters are in good agreement with the scaling relation derived in the pointlike analysis. The galaxy velocity dispersions resulting from the SB analysis are consistent at the confidence level with the spectroscopic measurements. In contrast the truncation radii for 2-3 galaxies depart significantly from the galaxy scaling relation and suggest differences in the stripping history from galaxy to galaxy.
keywords:
dark matter, galaxy cluster, galaxy haloes, gravitational lensing.1 Introduction
Galaxies, and to a larger extent, clusters of galaxies, are dominated by dark matter (DM). Although DM cannot be observed directly, it can be detected through its gravitational effects. Thus gravitational lensing is a powerful tool for investigating the distribution of dark matter (e.g. see Schneider, 2003; Bartelmann, 2010; Kneib & Natarajan, 2011).
Lensing allows a direct probe of the total projected mass density of the lens. In the case of strong lensing (SL) by galaxy clusters, the location and redshift of sets of multiple images enable mapping of the mass-density distribution. To disentangle the cluster-scale dark halo component from the galaxies’ contribution, additional constraints sensitive to only one of the two components are necessary (Eichner et al., 2013; Monna et al., 2015).
A common assumption is that the DM content of galaxies scales in proportion to their light (e.g. see Koopmans et al., 2006). Luminosity scaling relations allow estimates of some properties of the galaxy dark halos including their mass or central velocity dispersion and their extent. Weak and strong lensing analyses reveal that the extent of a galaxy’s DM halo also depends on its environment (e.g. see Narayan, 1998; Geiger & Schneider, 1999; Limousin et al., 2007; Halkola, Seitz & Pannella, 2007). Galaxy-galaxy lensing analyses show that typical radii of dark matter halos are of the order of hundreds of kpc (Brimioulle et al., 2013; Limousin et al., 2007). In denser environment, like galaxy clusters (Limousin et al., 2007, 2009), galaxies are stripped during interactions with each other and with the smooth extended cluster dark matter halo. Simulations predict that galaxies in the cluster core should be strongly truncated (Merritt, 1983; Limousin et al., 2009) in agreement with lensing results. However uncertainties in the measurements of the truncation radii are large (Natarajan, Kneib & Smail, 2002; Limousin et al., 2007; Halkola, Seitz & Pannella, 2007; Donnarumma et al., 2011).
In parametric strong lensing analysis the mass of a galaxy is often represented by a velocity dispersion. For a singular isothermal sphere, (Elíasdóttir et al., 2007), where is the central velocity dispersion and is the halo truncation radius. Galaxy velocity dispersions are inferred directly from their luminosity through the Faber-Jackson relation () (Faber & Jackson, 1976). The respective mass is then estimated through the luminosity – velocity dispersion – mass scaling relations. However, large scatter in the Faber-Jackson relation inherently introduces modelling biases in lensing analyses.
Direct measurement of the velocity dispersions of individual cluster members allows a more direct estimate of their total mass, independent of the lensing signal. Spectroscopic velocity dispersion measurements are thus useful for separating the galaxy component from the global cluster DM halo. Monna et al. (2015) show that using velocity dispersion measurements in a SL analysis sets stronger constraints on the galaxy dark matter halos and breaks the internal degeneracy between their mass profile parameters. By using Hectospec (Fabricant et al., 2005, 2013) velocity dispersions for cluster members in the core of the galaxy cluster Abell 383, Monna et al. (2015) improve constraints on the galaxy luminosity scaling relations by 50%. Furthermore, surface brightness reconstruction of the giant arc in Abell 383 measures the extent of the DM halos of some cluster members near the arc.
| Filter | Instrument | 5 Depth |
|---|---|---|
| f225w | WFC3/UVIS | 25.4 |
| f275w | WFC3/UVIS | 25.6 |
| f336w | WFC3/UVIS | 26.0 |
| f390w | WFC3/UVIS | 26.5 |
| f435w | ACS/WFC | 26.3 |
| f475w | ACS/WFC | 26.7 |
| f606w | ACS/WFC | 27.0 |
| f775w | ACS/WFC | 26.2 |
| f814w | ACS/WFC | 26.7 |
| f850lp | ACS/WFC | 25.9 |
| f105w | WFC3/IR | 26.9 |
| f110w | WFC3/IR | 26.9 |
| f125w | WFC3/IR | 26.8 |
| f140w | WFC3/IR | 26.9 |
| f160w | WFC3/IR | 26.7 |
| ID | RaJ2000 | DecJ2000 | zsp | magF814W | Reff (kpc) | (km/s) |
|---|---|---|---|---|---|---|
| BCG | 120.23676 | 36.05657 | 0.287 | 16.6 | 40.0 | |
| GR | 120.22530 | 36.05598 | 0.291 | 19.2 | 5.4 | |
| G2 | 120.24033 | 36.05950 | 0.283 | 20.0 | 3.4 | |
| G4 | 120.23850 | 36.06141 | 0.281 | 19.9 | 1.9 | |
| 243 | 120.22977 | 36.05394 | 0.287 | 19.9 | 1.3 | |
| 446 | 120.21320 | 36.06816 | 0.286 | 20.5 | 2.3 | |
| 123 | 120.25097 | 36.04291 | 0.283 | 19.0 | 9.0 | |
| 533 | 120.25350 | 36.07586 | 0.290 | 19.4 | 3.5 | |
| 489 | 120.25670 | 36.06833 | 0.284 | 19.4 | 2.9 | |
| 248 | 120.22717 | 36.05502 | 0.295 | 20.7 | 1.3 | |
| 159 | 120.25952 | 36.04721 | 0.283 | 19.4 | 2.4 | |
| 345 | 120.25213 | 36.05861 | 0.291 | 19.1 | 4.1 | |
| 316 | 120.22361 | 36.05819 | 0.297 | 19.6 | 2.2 | |
| 402 | 120.25158 | 36.06192 | 0.288 | 19.1 | 4.2 | |
| 380 | 120.21555 | 36.06329 | 0.287 | 20.3 | 2.0 | |
| 137 | 120.23792 | 36.04691 | 0.279 | 20.4 | 1.3 | |
| 512 | 120.21346 | 36.06996 | 0.278 | 20.3 | 2.2 |
Here we investigate a second cluster, Abell 611 (A611 hereafter) at . Several previous SL analyses derive a mass distribution for A611 focusing on different aspects of mass modelling through strong lensing. For example, Richard et al. (2010) analyse 20 galaxy clusters from the LoCuSS survey, including A611, to constrain the total mass in cluster cores and to compare them with X-ray measurements. Donnarumma et al. (2011) combine SL and X-ray analyses of A611 and tested different approaches for modelling the mass associated with the cluster galaxy component. Within the cluster core (r kpc), SL and X-ray mass measurements agree well, but in the outer region there are discrepancies. The disagreement at large radius suggests an incorrect estimate of the relative contributions of the baryonic and DM components to the cluster mass as a result of the degeneracy between the galaxy and the smooth large scale dark matter components. Newman et al. (2009, 2013a) combine kinematic data with strong and weak lensing to model the mass distribution of the cluster from the very central region out to well beyond the virial radius. They use measurement of the BCG velocity dispersion to constrain its stellar mass and thus to disentangle the baryonic and DM components in the very core. An NFW profile fails to describe the cluster DM alone; shallower profiles fit the data better. More recently, Zitrin et al. (2015) presented a statistical weak and strong lensing analysis of the complete CLASH cluster sample, including A611. They examine the effect of different mass parametrizations on the resulting mass model and show that systematic differences of in the projected surface mass density can result from various lensing degeneracies.
We use a set of spectroscopic velocity dispersions measured with Hectospec (see Fabricant et al., 2005, 2013) mounted on the Multiple Mirror Telescope (MMT) to improve constraints on the mass distribution of A611 and its mass components. We carry out a SL analysis for A611, both with and without the velocity dispersion measurements and examine the impact of these measurements in constraining both the mass in galaxies and in the dark matter halo. We also use the surface brightness morphology of the giant arc to refine constraints on five cluster galaxies neighbouring the arc.
§2 describes the photometric and spectroscopic datasets. §3 describes the SL analysis, the mass components included in the mass model and the lensed systems used as constraints. The SL analysis results are in §4. We discuss the improvements resulting from the use of velocity dispersion measurements in the lensing analysis. §5 discusses the surface brightness reconstruction of the giant tangential arc. We conclude in §6. We assume a cosmological model with Hubble constant km s-1 Mpc-1 and density parameters and . Magnitudes are in the AB system.
2 Photometric and Spectroscopic Dataset
A611 was observed in 2012 during the Hubble Space Telescope (HST) Cycle 19, as part of the CLASH survey. It was observed with the HST Advanced Camera for Surveys (HST/ACS) and the Wide Field Camera 3 (HST/WFC3) UVIS and IR cameras providing deep photometry in 15 different HST filters, to a depth of roughly AB (3). The photometric dataset111available at http://archive.stsci.edu/prepds/clash/ was processed with the Mosaicdrizzle pipeline (see Koekemoer et al., 2011) to generate mosaic drizzled images with a common scale of 65mas/pixel, centred on the cluster. The field of view (FOV) is in the ACS filters and in the WFC3IR images. In Tab. 1 we list the filters of the photometric data with the respective depths. We generate multi-band photometric catalogues of fluxes extracted within (9 pixels) diameter aperture using SExtractor 2.5.0 (Bertin & Arnouts, 1996) in dual image mode. We use the weighted sum of all of the WFC3IR images as the detection image.
We measured redshifts and velocity dispersions with the Hectospec fiber spectrograph mounted on the MMT (Fabricant et al., 2005). Hectospec has 300 fibers deployable over a 1 degree field. The instrument has 1.5′′ fibers and the spectra cover the wavelength range 3500 - 9150 Å. The resolution is of 5.5 Å FWHM, which corresponds to 105 km/s at 6000 Å. We acquired data under variable conditions with typical seeing of 0.9″on February 9, April 5, and April 9-10, 2010, on November 22-23, 2011, and on October 8 and November 28, 2013 (Fabricant et al., 2013). The typical integration time was 1 hour. All redshifts are published in Lemze et al. (2013).
Within 1.5′ of the cluster centre, the Hectospec data provide redshifts for 27 cluster members and central velocity dispersions for seventeen of these members. We include a central velocity dispersion here only when its uncertainty is % of the dispersion.
We extract the velocity dispersions from the Hectospec spectra by applying the University of Lyon Spectroscopic analysis Software7 (UlySS; Koleva et al., 2009). Single age stellar population models calculated with the PEGASE-HR code (Le Borgne et al., 2004) and the MILES stellar library (Sánchez-Blázquez et al., 2006) provide the basis for fitting the observed spectrum. We limit the spectral fitting range to Angstrom rest-frame wavelengths where we obtain the smallest velocity dispersion errors and the most stable velocity dispersions (Fabricant et al., 2013). Based on the measured line spread function, we convolve models to the wavelength dependent spectral resolution of the Hectospec data (Fabricant et al., 2013). We convolve models that are parametrized by age and metallicity with the line-of-sight velocity dispersion; we then use minimization to determine the best-fit age, metallicity and velocity dispersion. Fabricant et al. (2013) discuss the details of these measurements. Zahid et al. (2015) carry out a further demonstration of the excellent agreement between these measurements and those derived for the same galaxies by the SDSS.
Following Jorgensen, Franx & Kjaergaard (1995), we correct the measured velocity dispersion observed with the Hectospec aperture fibers, to estimate the galaxy central stellar velocity dispersion within the effective radius of the galaxy , , according to
| (1) |
where is the fiber aperture. We estimate the effective radii of cluster members with GALFIT (Peng et al., 2010) by fitting the surface brightness distribution of the galaxies in the HST/F814W filter with de Vaucouleurs profiles. Table 2 lists all of the galaxies with measured velocity dispersions used in the lensing analysis.
3 Strong Lensing modeling
We model the mass distribution in the core of A611 using the software GLEE developed by A. Halkola and S. Suyu (Suyu & Halkola, 2010; Suyu et al., 2012). We use the observed positions of the multiple images as constraints throughout the analyses; thus we refer to these models as pointlike. Spectroscopic redshifts of the lensed sources, if available, are additional constraints. The best fitting model is found through a simulated annealing minimization in the image plane. The most probable parameters and uncertainties for the cluster mass model are then obtained from Monte Carlo Markov Chain (MCMC) sampling.
3.1 Multiple images
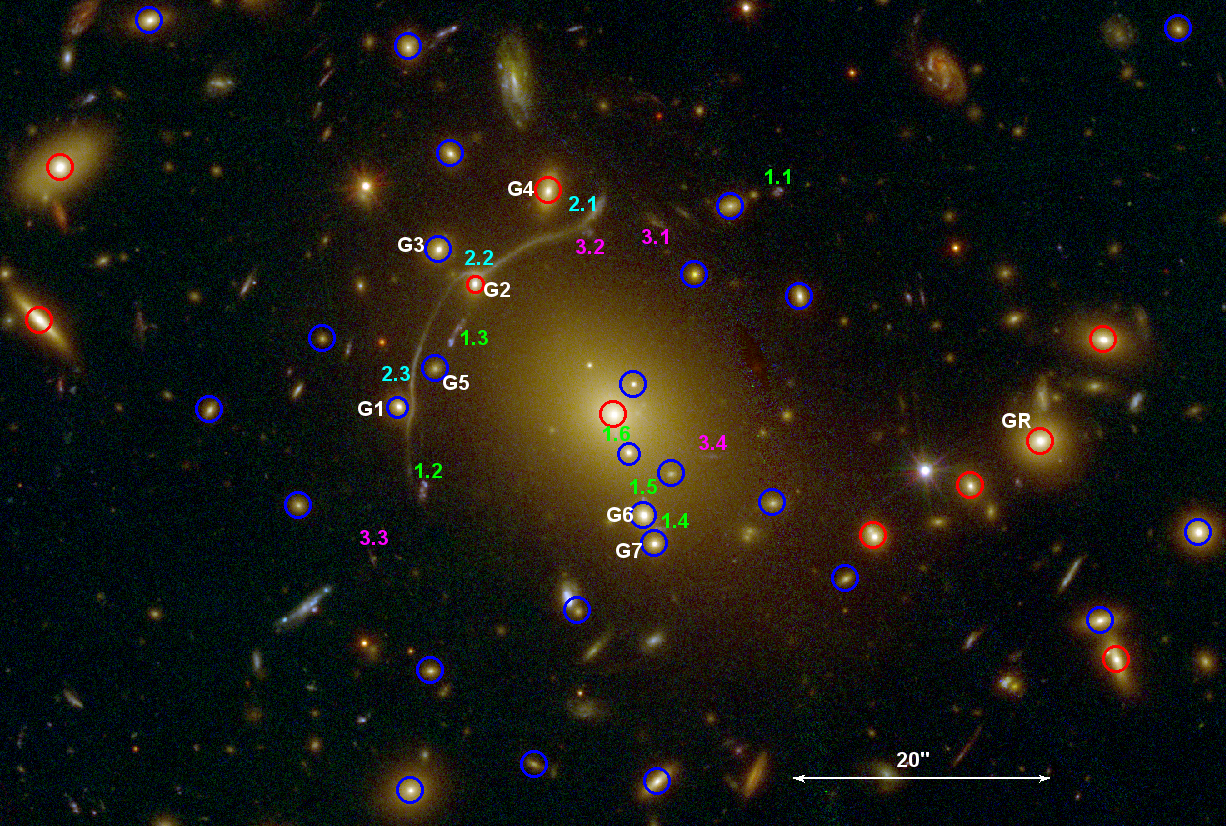
To reconstruct the mass distribution in the core of A611, we use three robust systems of multiple images as constraints (Fig. 1; see Newman et al., 2013a; Zitrin et al., 2015).
System 1 is a quintuply lensed source spectroscopically confirmed at (the redshift has been recently revised, see Newman et al. 2013a). A central image, embedded in the BCG light, is associated with this system and is included as a constraint, for a total of 6 multiple images.
System 2 is a giant tangential arc at a distance of from the BCG, passing in between 5 bright galaxies (G1-G5). We use the positions of the three brightest knots of the arc as constraints in the analysis. This system has a spectroscopic redshift of .
Finally system 3 is a quadruply lensed source, for which no spectroscopic redshift is available. Thus its redshift is a free parameter and is optimized around the photometric redshift of the brightest lensed image (3.1) using a flat prior in the range [0.5, 2.5].
The position of all the multiple images are listed in Tab. 3 together with their respective redshifts.
We adopt errors of on the position of the observed multiple images to account for uncertainties due to density fluctuations along the line of sight (see Host, 2012; D’Aloisio & Natarajan, 2011).
| Id | Ra | Dec | |||
|---|---|---|---|---|---|
| 1.1 | 120.232260 | 36.061430 | 1.56 | - | 1.1 |
| 1.2 | 120.241820 | 36.055075 | 1.57 | - | 0.6 |
| 1.3 | 120.241110 | 36.058144 | - | - | 0.4 |
| 1.4 | 120.235610 | 36.054100 | - | - | 0.1 |
| 1.5 | 120.235950 | 36.054732 | - | - | 0.2 |
| 1.6 | 120.236680 | 36.056140 | - | - | 0.8 |
| 2.1 | 120.237240 | 36.060997 | 0.91 | - | 1.0 |
| 2.2 | 120.240480 | 36.059643 | - | - | 0.6 |
| 2.3 | 120.242150 | 36.057169 | 0.86 | - | 0.6 |
| 3.1 | 120.235610 | 36.060708 | 1.54 | 0.7 | |
| 3.2 | 120.237380 | 36.060528 | 1.12 | ″ | 0.3 |
| 3.3 | 120.243160 | 36.053450 | 1.52 | ″ | 0.4 |
| 3.4 | 120.234070 | 36.055653 | - | ″ | 1.1 |
3.2 Cluster mass component
Cluster smooth large scale halo
We describe the smooth dark halo (DH) mass component of the cluster with a Pseudo Isothermal Elliptical Mass Distribution (PIEMD) profile (Kassiola & Kovner, 1993).
Its projected surface density is
| (2) |
where and are the halo velocity dispersion and core radius. is the 2D radius, defined as for a profile with ellipticity , where is the axis ratio. The asymptotic () Einstein radius for this profile is
| (3) |
where is the halo velocity dispersion, is the speed of light, and and are the distances to the lensed source and between the lens and the source, respectively. The
Einstein parameter is the Einstein radius for .
We use as a parameter to describe the mass amplitude of the lens halo.
All the DH parameters are optimized using flat priors. The halo is initially centred on the BCG, and its position is optimized within 3 arcsec. The axis ratio and position angle (PA) vary within [0,1] and respectively. The core radius varies within [0,60] kpc. The Einstein parameter is optimized in the range
corresponding to a velocity dispersion of km/s.
BCG
Newman et al. (2009, 2013a, 2013b) perform a detailed analysis of the stellar mass profile of the BCG in A611 by combining SL and kinematic analyses. They model the BCG stellar mass profile using a dual pseudo elliptical isothermal profile (dPIE, see Elíasdóttir et al., 2007) to fit the surface brightness profile of the BCG.
The effective radius of the BCG is consistent with the truncation radius of the dPIE profile ( kpc Newman et al. 2013a, b). By combining lensing and kinematic analysis they estimate the amplitude of the dPIE profile describing the BCG stellar mass. This amplitude is characterized by a central velocity dispersion km/s.
In our lensing model, we also describe the BCG stellar mass component by using a dPIE profile. For this mass component we adopt the parameters estimated by Newman et al. (2013a, b) and we optimize them within their uncertainties using gaussian priors.
Cluster members
Our analysis includes cluster members within a FOV of centred on the cluster core (RAJ2000= and DECJ2000=).
Within this FOV there are 27 spectroscopically confirmed cluster members from the Hectospec survey with .
Further candidate cluster members are selected photometrically. We select bright galaxies () on the cluster red sequence with (Fig. 2).
We also require that these galaxies have photometric redshift . Photometric redshifts are estimated using the CLASH dataset (see Tab. 1), based on the spectral energy distribution (SED) fitting code LePhare222http://www.cfht.hawaii.edu/ arnouts/lephare.html (Arnouts et al., 1999; Ilbert et al., 2006),
using the COSMOS galaxy spectra (Ilbert et al., 2009) as templates.
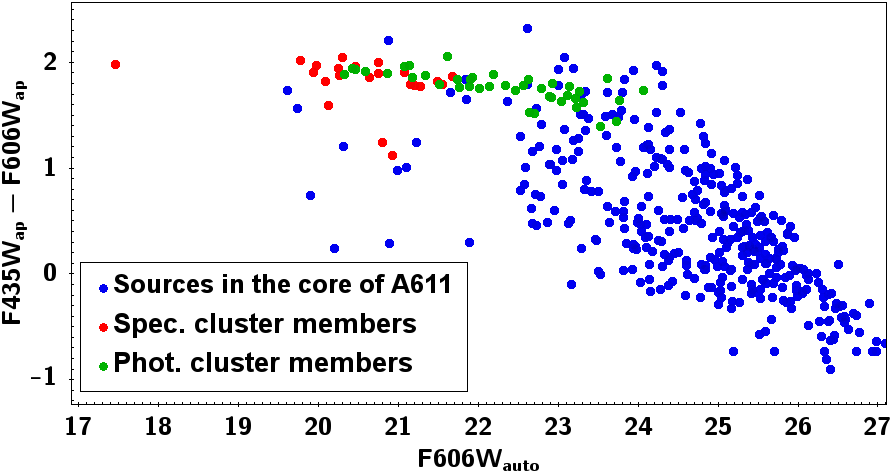
We select a total of 69 cluster members; 27 are spectroscopic members and 42 are photometric candidates.
Galaxies are modelled with dPIE profiles (Elíasdóttir et al., 2007). This profile is characterized by a central velocity dispersion , a core radius and a truncation radius , marking the region where the density slope changes from to .
The projected surface mass density is
| (4) |
where , as for the PIEMD mass profile. The total mass is
| (5) |
which, for , reduces to
| (6) |
For a vanishing core radius, corresponds to the radius containing half of the total mass of the galaxy ( see Appendix A3 in Elíasdóttir et al., 2007). We adopt vanishing core radii for the cluster members, unless stated otherwise. Thus there are 2 free parameters associated with each galaxy, and .
To reduce the total number of free parameters for the cluster members, we adopt luminosity scaling relations to derive the galaxy parameters and (e.g. see Jullo et al., 2007; Eichner et al., 2013). The Faber-Jackson relation (Faber & Jackson, 1976) allows estimation of the central velocity dispersion of elliptical galaxies directly from the observed photometry:
| (7) |
where and are the central velocity dispersion and luminosity of a fiducial reference galaxy.
The Fundamental Plane (e.g. see Dressler et al., 1987; Faber et al., 1987; Bender, Burstein & Faber, 1992) also provides a luminosity scaling relation for the size of the halos. Following Hoekstra et al. (2003); Halkola, Seitz & Pannella (2007); Limousin et al. (2007) the truncation radii of galaxy halos scale with their luminosities according to
| (8) |
where and are the truncation radius and luminosity of the reference galaxy.
The total mass-to-light ratio for the cluster members is
| (9) |
which, given Eq. 8, implies
| (10) |
Combining Eq. 6, 8 and 10 we derive a relation among the exponents of the luminosity scaling relations
| (11) |
Measurements of the exponent from photometric analysis give value between 0.25 and 0.3 (see e.g., Kormendy & Bender, 2013; Focardi & Malavasi, 2012): measurements through strong and weak lensing analysis provide a value of (see Rusin et al., 2003; Brimioulle et al., 2013). From our sample of galaxies with measured velocity dispersion in A611, in the F814W band. Thus we adopt this value. Following our previous analysis, we assume a constant mass-to-light ratio () (see Eichner et al., 2013; Monna et al., 2015), which then implies from Eq. 11. The exponents of the scaling relations are fixed to these values throughout our analysis. The constraints available in the field of the cluster are insufficient for further investigation of the choice of values of the exponents. Throughout our analysis we do investigate the amplitude of the luminosity scaling relation by tuning the parameters and of the reference galaxy. Thus the velocity dispersion and truncation radius of the th cluster member follow the scaling relation
| (12) |
where and are the values for the reference galaxy GR.
As fiducial galaxy GR we adopt a bright elliptical (, ) west of the BCG, slightly outside the critical lines for a source at redshift . This galaxy has a measured velocity dispersion km/s (Table 2). We optimize the velocity dispersion through the lensing analysis with a gaussian prior consistent with the measurement uncertainties.
The GR truncation radius is a free parameter optimized with a flat prior in the range .
The cluster members with measured are assigned their central velocity dispersions fixed to the spectroscopic measurement throughout the modelling. Thus we assume that the measured central stellar velocity dispersion is a robust estimate of the central velocity dispersion of the galaxy halo.
In addition seven galaxies located very close to the tangential arc and to the central multiple images of system 1 (G1 to G7, see Fig. 1), are individually optimized. Two of these galaxies, G2 and G4, have measured that are optimized with a gaussian prior within the measurement errors.
The central velocity dispersions for the other galaxies (G1, G3, G5, G6 and G7) are optimized with a flat prior in the range km/s. For these 5 cluster members, the truncation radii are free parameters optimized within .
The position, axis ratio , and PA of all the galaxies are fixed to the values extracted from the photometry in the F814W filter. Only for the galaxies G1 to G5, the axis ratio and PA are optimized with a gaussian prior.
Finally, we also allow for an external shear component to account for the large scale environmental contribution to the lensing potential.
4 Pointlike model
| wo/ | w/ | |
| DH | ||
| x | ||
| y | ||
| b/a | ||
| PA | ||
| BCG | ||
| GR | ||
| G1 | ||
| b/a | ||
| PA | ||
| G2 | ||
| b/a | ||
| G3 | ||
| b/a | ||
| G4 | ||
| b/a | ||
| G5 | ||
| G6 | ||
| b/a | ||
| G7 | ||
| b/a | ||
| PA | ||
Given the model in Section 3, we perform a minimization analysis on the position of the observed multiple images. Then we run MCMC chains to obtain the final best model and the relative uncertainties. The final best model has and reproduces the multiple images with a mean accuracy of . Fig. 3 shows the distance between the predicted and the observed positions of the multiple images as a function of the projected distance of the lensed image from the BCG. These are in Tab. 3, together with the model prediction of the source redshift for system 3. System 3 has a mean rms of 0.6″for the multiple image reproduction and a redshift , consistent with the photometric redshift.
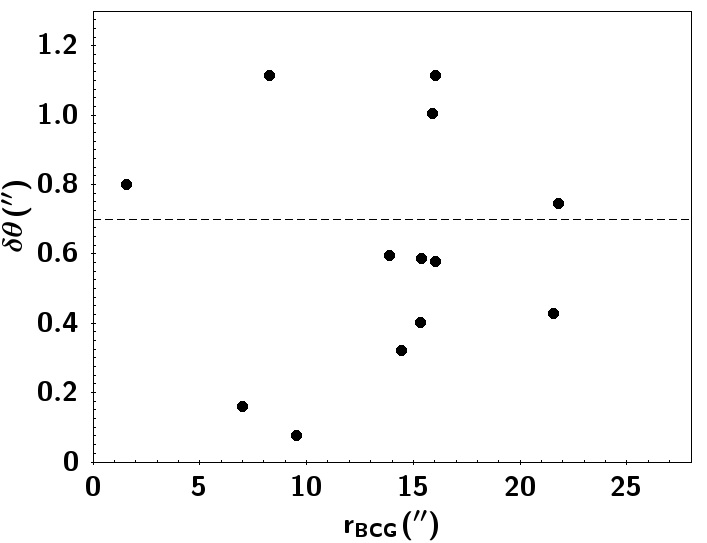
The model yields a cluster dark halo centred at arcsec, arcsec with respect to the BCG, its axis ratio is with P.A.=. The core radius is kpc and the Einstein parameter arcsec corresponding to km/s. For a source at , the halo has a fiducial Einstein radius arcsec. The total mass of the cluster within the Einstein radius is . The external shear component has magnitude of .
The final velocity dispersion for the reference galaxy is km/s and its truncation radius is kpc. The galaxy scaling relation is then
| (13) |
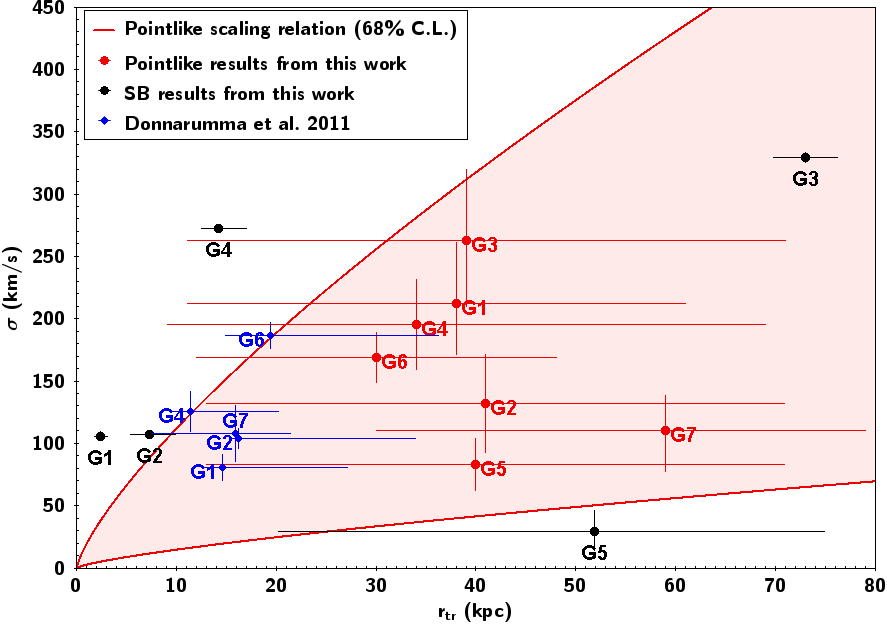
Although the error in is large, the relation implies that galaxies are tidally truncated in the cluster core consistent with previous analyses (e.g. Natarajan, Kneib & Smail, 2002; Limousin et al., 2007; Donnarumma et al., 2011; Monna et al., 2015).
These results are in excellent agreement with Donnarumma et al. (2011), who perform a detailed strong lensing and X-ray analysis of A611. They test different approaches to modelling the mass associated with the cluster galaxy component.
They individually optimize the mass parameters of galaxies which have strong impact on the observed lensing features just as we do in our analysis. In case 6 of their analysis, the velocity dispersion and truncation radius of six galaxies close to the lensed systems are individually optimized in the ranges [90, 190] km/s and [2, 35] kpc, respectively for and . In contrast with our approach, their scaling relation reference galaxy GR has a fixed truncation radius of 43 kpc (in agreement with results from galaxy-galaxy lensing presented in Natarajan et al. (2009)) and has optimized in the range [120, 200] km/s.
They perform the lensing analysis in the source plane and obtain a total reduced . The final velocity dispersion for their reference galaxy GR is km/s, consistent at the level with our results. We also find overall agreement for the galaxies that we individually optimized. However, in both analyses the mass parameters have large uncertainties (see Fig. 6 in the next section).
Table 4 summarizes the parameters for all of the cluster mass components, including the individually optimized galaxies, G1 to G7.
| wo/ | w/ | |
|---|---|---|
| DH | ||
| Galaxies | ||
To examine the impact of incorporating the measured velocity dispersions of the 17 cluster members in the lensing analysis, we model the cluster core without using the (“wo/”).
The best model wo/ predicts the multiple images positions with a mean accuracy of 0.8″; with the measured velocity dispersions we obtain ″.
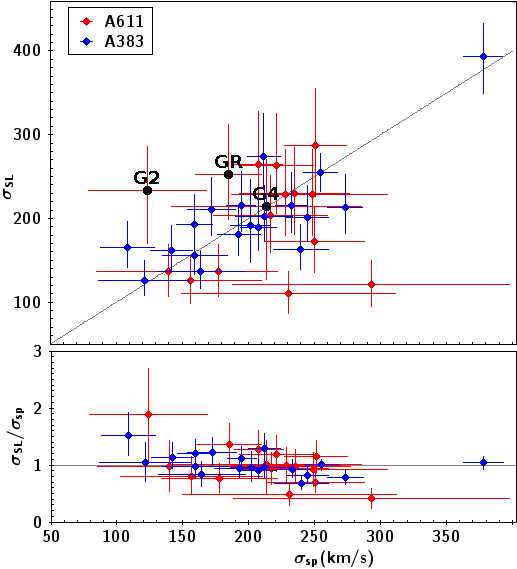
Constraints on the parameters of the mass components are similar in both models (Tab. 4). However the velocity dispersions predicted by lensing show some deviations from the available spectroscopic measurements .
Fig. 4 shows the measured versus the value predicted from lensing () for the model . For comparison we also plot the results for A383 in Monna et al. 2015. In A383 the spectroscopically measured and the lensing prediction agree well. The difference between A611 and A383 probably depends on the sample of cluster members for which we have . In the case of Abell 383 (Monna et al., 2015), there are 8 cluster members with inside the cluster critical lines, and another 5 slightly outside. Thus in A383 we constrain the galaxy truncation radii with an error of . In A611 we derive much weaker constraints on the truncation radii because the sample of cluster members with measured includes fewer galaxies (only 5 inside the critical lines) which have a strong impact on the lensing potential.
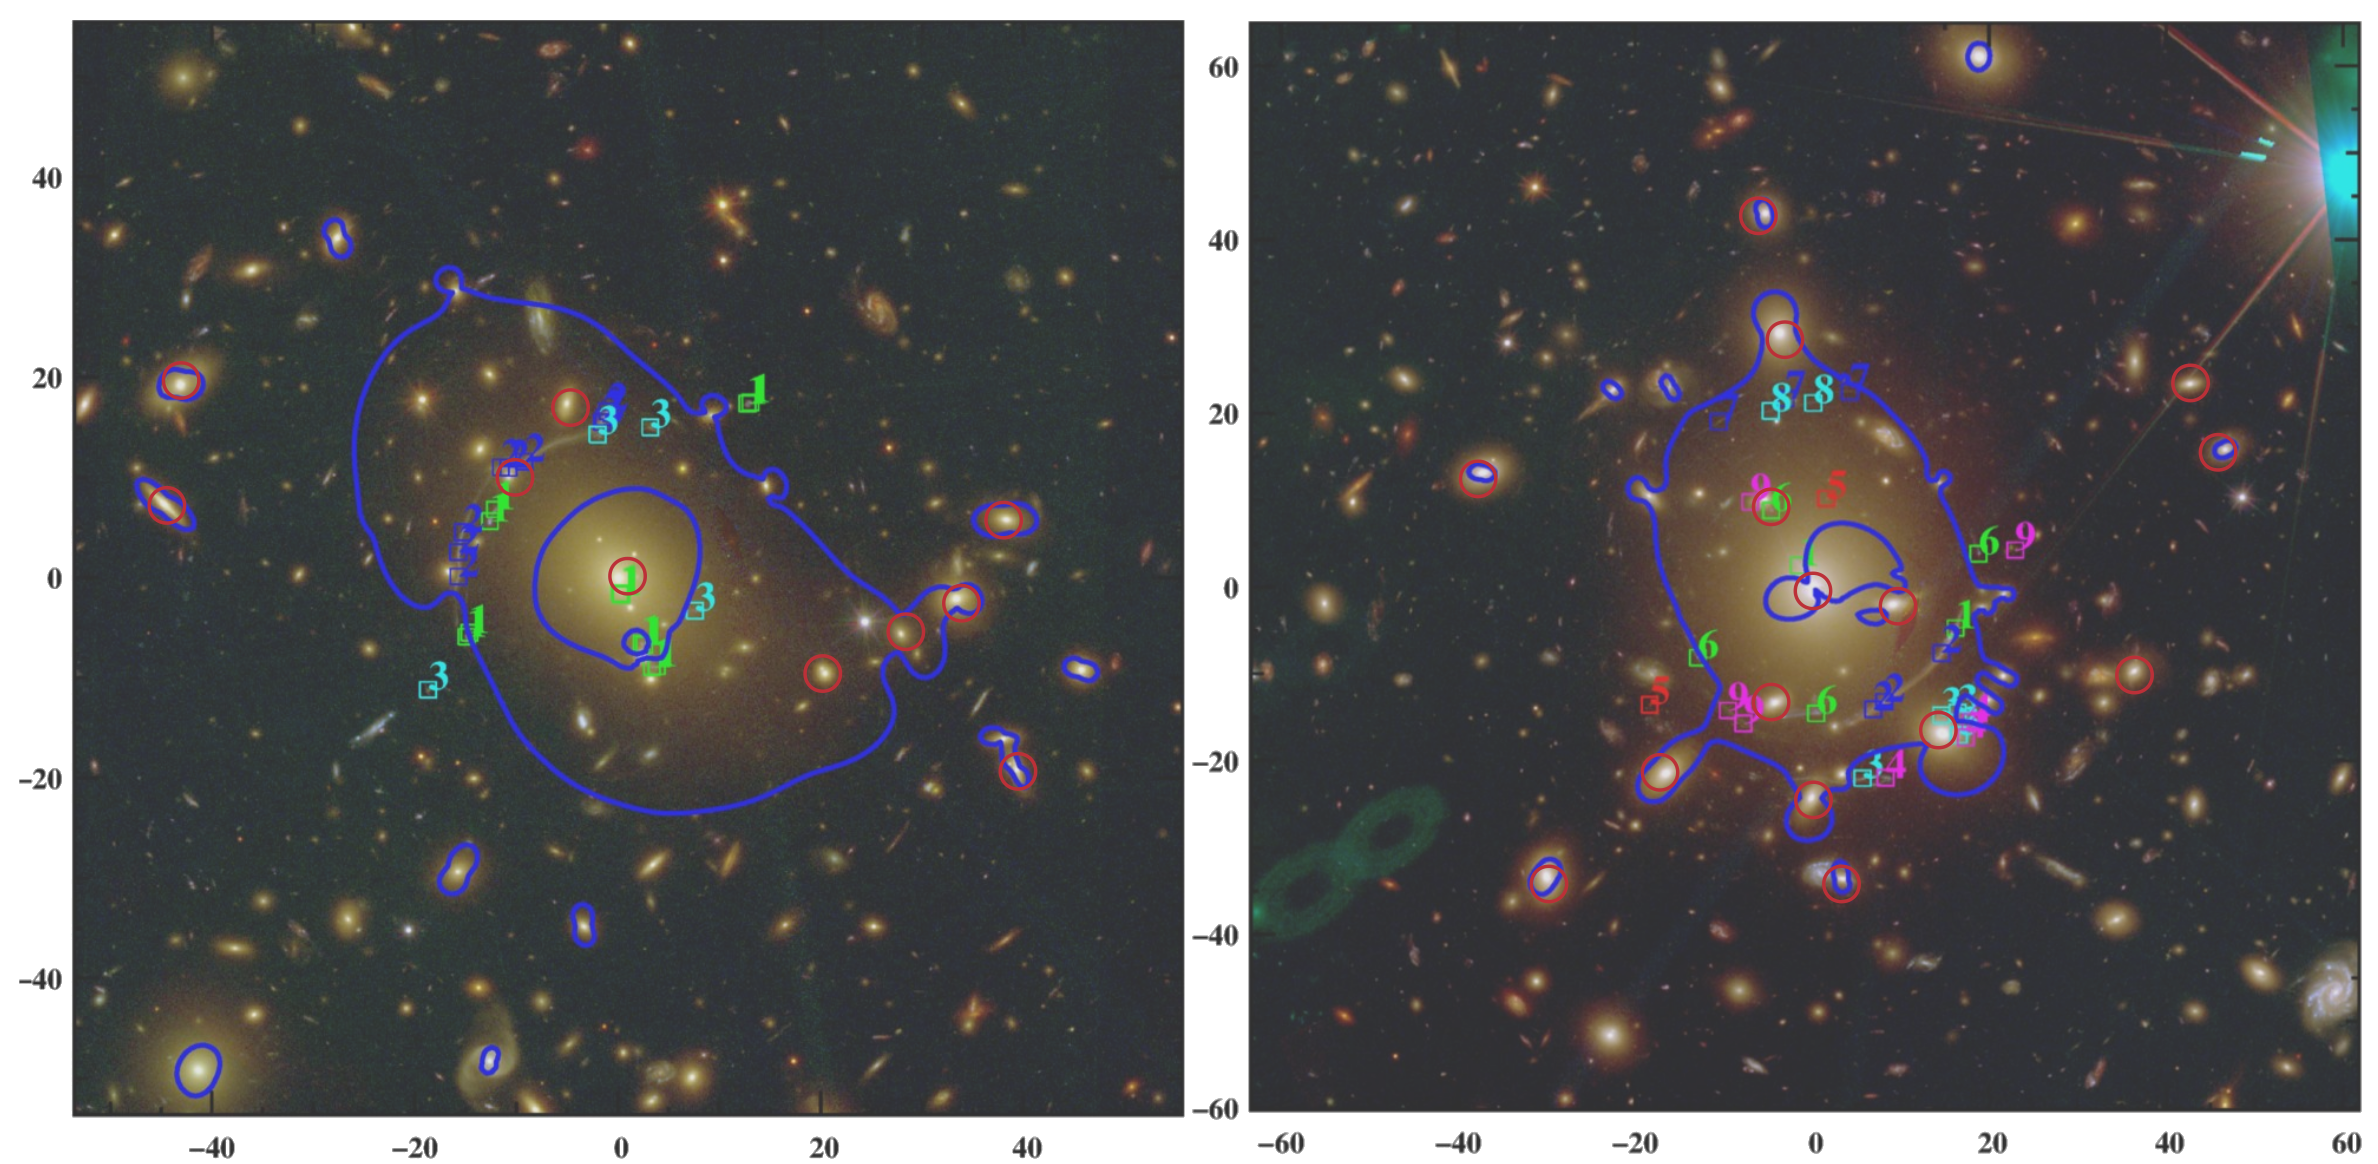
Furthermore A611 has the fewer robust SL features identified in the core of the cluster than A383 does. Fig. 5 shows the two clusters to highlight the difference between them. The figure marks the galaxies with measured over a field of centred on the BCG along with the multiple images and the critical curves.
The use of velocity dispersion measurements of cluster members properly weights the galaxy contribution to the total mass of the cluster.
The lensing analysis predicts kpc and km/s for GR. This velocity dispersion is overestimated by a factor of 1.4 with respect to the spectroscopic measurement km/s. The total mass associated with GR is compared with estimated using the measured values in the analysis.
Overestimation of the mass of GR translates into a global overestimate of the total galaxy mass component in the cluster. Table 5 lists the projected mass for the cluster galaxy contribution and for the large scale dark halo. The mass associated with the cluster members is over-estimated by a factor of without use of the velocity dispersions in the analysis. Consequently the mass associated with the large scale dark halo is underestimated by in the model “wo/”.
In spite of the small sample of cluster members with measured velocity dispersions in A611, these spectroscopic measurements allow proper weighting of the mass associated with the galaxies relative to the large scale dark matter halo.
5 Surface Brightness Reconstruction of the giant arc
In the pointlike analysis, we individually optimized some of the cluster members which reside very close to multiple images and thus probably contribute significantly to the local lensing distortion. However, the mass profiles for these galaxies are actually poorly constrained by the pointlike modelling.
Here we use the surface brightness (SB) reconstruction of the giant arc
to improve the constraints on the mass parameters of the galaxies, G1 to G5, that are close to the arc by using the entire pixel to pixel lensing information encoded in the arc.
The analysis is performed in the HST/ACS/F775W image. We subtract the neighbouring cluster members from the image of the arc using GALFIT (Peng et al., 2010) thus removing light that would otherwise contaminate the arc SB reconstruction.
We start the SB modelling from the final best model obtained in the pointlike analysis.
The SB reconstruction of giant arcs is a powerful tool for placing strong constraints on the mass distribution of the lens, but it is only effective in the local
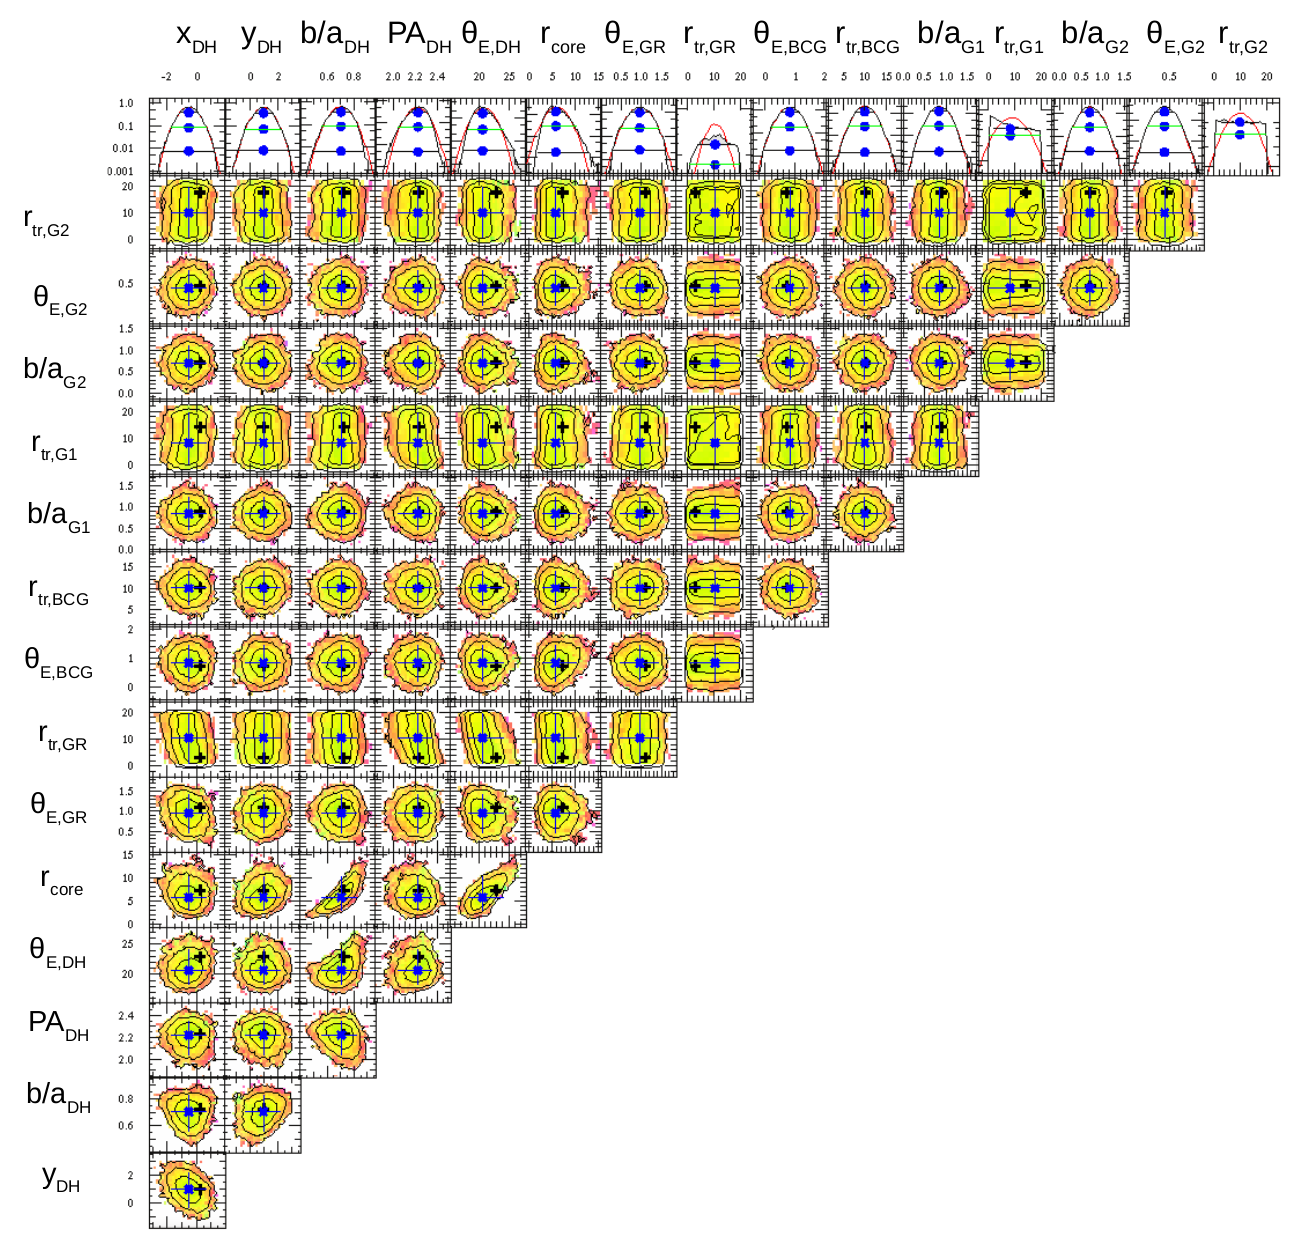
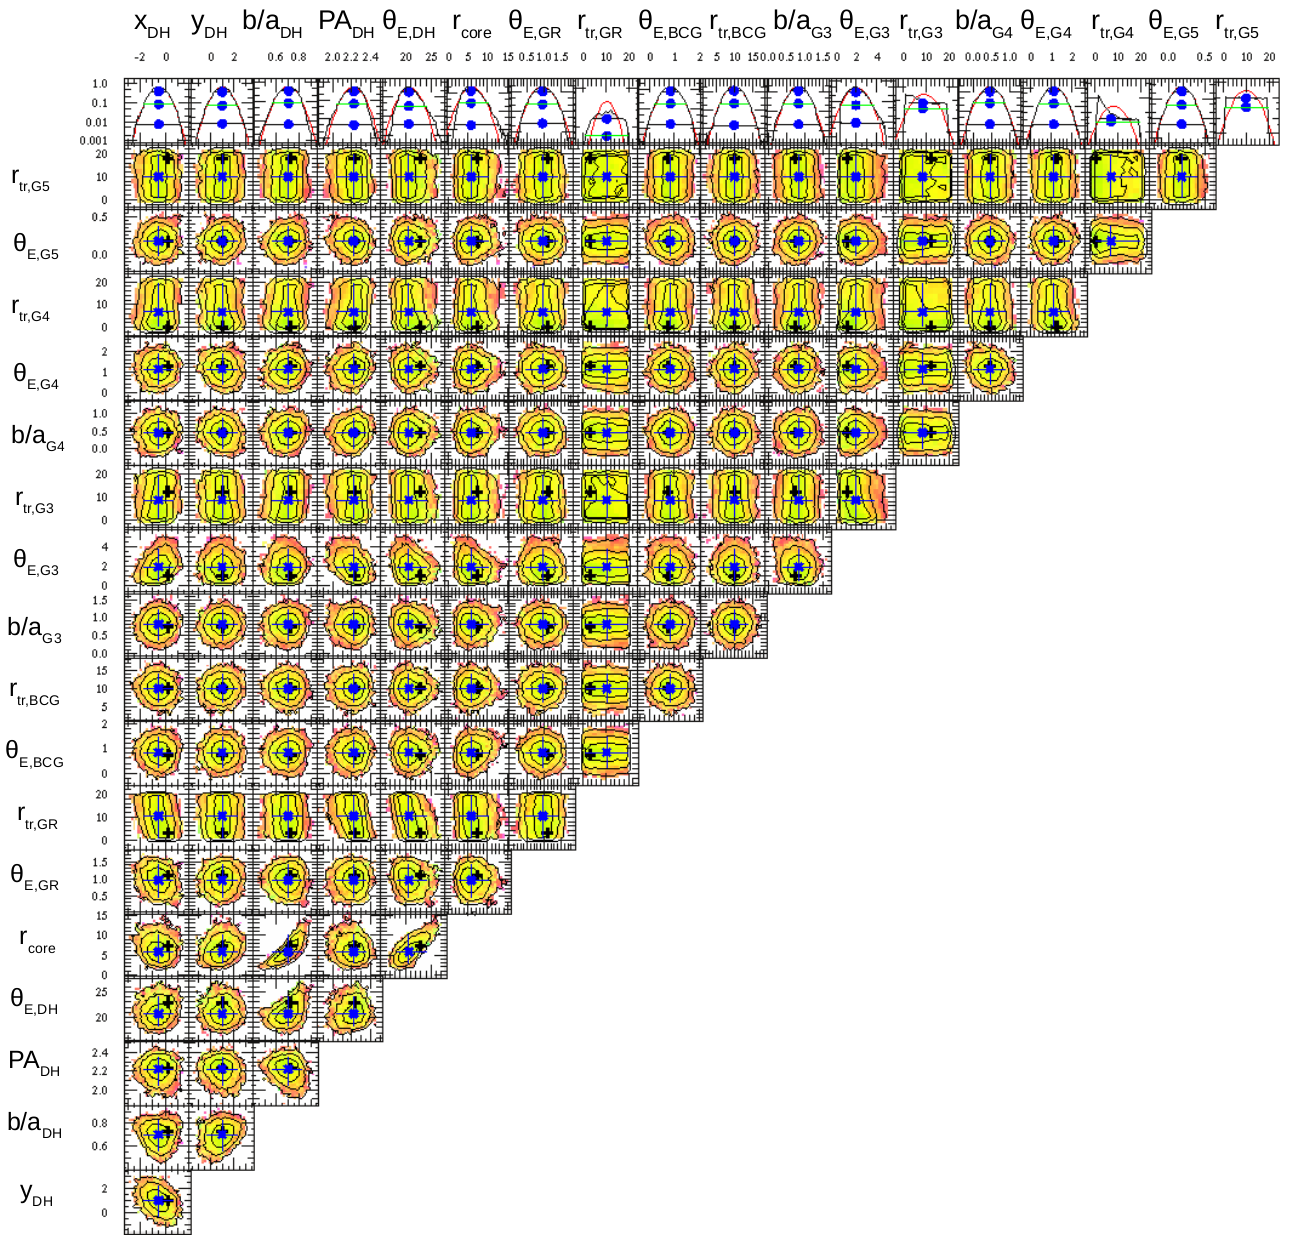
neighbourhood of the reconstructed arc. The pixel to pixel constraints associated with the giant arc are of the order of higher than the pointlike constraints associated with the other multiple image systems used in the analysis. Thus the minimization and the MCMC analyses are dominated by the constraints from the arc. Throughout the SB analysis we must fix the parameters of the mass components which do not play a major role in the local distortion of the giant arc. In Appendix A we show the MCMC resulting from the pointlike analysis. The parameters describing the mass component of galaxies G1-G5 have no degeneraies with the parameters of the large scale dark halo, the BCG and the reference galaxy GR. Thus through the SB reconstruction of the giant arc, the
parameters describing the DH, BCG and GR are fixed to the values of the final best model of the pointlike analysis. Only the five galaxies G1-G5 close to the giant arc (see Fig. 1), are individually optimized in the SB reconstruction. Their ellipticity, position angle, velocity dispersions and truncation radii are free parameters. Given the larger number of constraints provided by the SB analysis, we also release the core radii for these galaxies to infer a more detailed profile of the local mass distribution. Two of these galaxies, G2 and G4, have measured velocity dispersions (see Tab.2) optimized within the spectroscopic error with a gaussian prior.
We perform the SB reconstruction through a linear inversion method (Warren & Dye, 2003) which reconstructs the pixellated brightness distribution of the source, with regularization of its intensity, through a Bayesian analysis (Suyu et al., 2006).
The first model resulting from the SB reconstruction has a large reduced . For consistency with the pointlike analysis, where we adopt larger uncertainties in the multiple images position of 1″, at this stage of the SB analysis we increase the pixel noise associated with the HST/ACS/F775W image by a factor of .
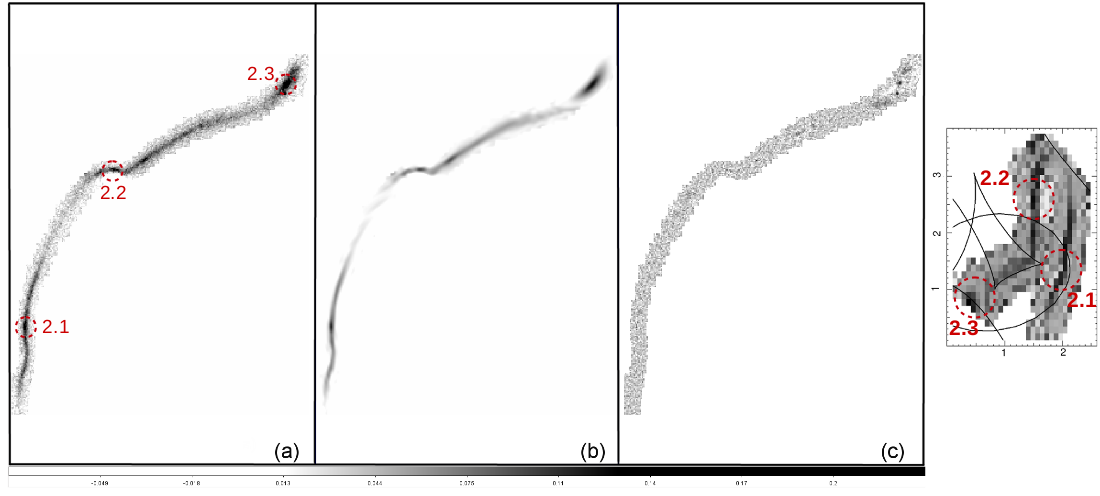
Fig.6 shows the results of the surface brightness reconstruction of the arc in the F775W filter as well as the reconstructed source. The giant arc is reconstructed well(panel b in Fig. 6) with on the pixel intensities and with residuals lower then (panel c in Fig. 6). Large residuals remain close to the upper multiple image 2.3, where a bright compact object is clearly identified. Our reconstruction does not reproduce this object as part of the lensed system. This compact object is unlikely to be part of the lensed source. Otherwise it would be possible to identify such a substructure close to the other multiply lensed structures of the arc as well (i.e. close to image 2.1 and 2.2). On the right side of Fig. 6 we show the source reconstruction of the lensed system. We obtain a good SB reconstruction of the giant arc in the image plane. In the source plane, however, the substructures of the arc have an offset of arcseconds, which corresponds to kpc at the redshift of the source.
Tab. 6 summarizes the resulting mass parameters for galaxies G1-G5 optimized through this analysis with their respective uncertainties.
The halo axis ratio b/a and position angles are consistent with the results from the pointlike analysis, as well as with the values measured from the photometry. Only G4 obtains a considerably larger axis ratio b/a=1 with respect to the b/a=0.5 measured from the photometry and resulting from the pointlike model.
The velocity dispersions for G2 and G4 are both consistent with the spectroscopic measurements (see Tab.2), although G4 has an higher value compared with the estimates from the pointlike analysis. The other galaxies obtain velocity dispersions which depart significantly from the previous pointlike results.
Overall the SB modelling yields improved constraints on the galaxy truncation radii and masses. The truncation radii for G3, G4 and G5 agree at the level with the pointlike estimate. For G1 and G2 we obtain quite small radii (kpc) indicating that the dark matter halos of these objects are highly truncated. The total mass associated with each galaxy is consistent within the 1 uncertainties with the mass estimated through the pointlike analysis, but now the masses are better constrained by a mean factor of . Fig. 7 compares and derived through the surface brightness reconstruction with the pointlike results. At the confidence level, the galaxies are consistent with the scaling relation derived in the pointlike analysis, except for G1 and G2 which deviate substantially from the relation. Fig. 7 also shows results from Donnarumma et al. (2011) for comparison.The Donnarumma et al. (2011) results for galaxies G1-G5 are generally consistent with our scaling relation and with the results from the pointlike analysis. However, they predict smaller and for these galaxies as a result of the smaller range adopted for the parameter optimization ( [120, 200] km/s for velocity dispersions and [2, 35] kpc for truncation radii). Nevertheless overall both approaches predict that these galaxies are highly truncated. According to the SB reconstruction, G1 has kpc, only twice its effective radius () as measured in the HST/F814W image. This galaxy has a total mass . Comparing its total mass with a prediction for field galaxies (e.g. Brimioulle et al., 2013), G1 has probably been stripped of of its original dark matter halo. G2 and G4 have also apparently lost most of their dark halos through stripping processes ( and respectively); G3 and G5 have lost and , respectively. Variations in the stripped mass may be explained by differences in the stripping processes resulting from different orbits through the cluster (Warnick, Knebe & Power, 2008).
| Pointlike model | SB model | |
| G1 | ||
| b/a | ||
| PA | ||
| G2 | ||
| b/a | ||
| PA | ||
| G3 | ||
| b/a | ||
| PA | ||
| G4 | ||
| b/a | ||
| PA | ||
| G5 | ||
6 Conclusion
We use central velocity dispersion measurements for 17 members of the galaxy cluster A611
as constraints to refine a SL model for the cluster.
The inclusion of velocity dispersion measurements improves determination of the mass associated with galaxies in the cluster relative to the mass contained in the extended dark matter halo. Without the spectroscopically determined , the mass associated with the galaxies is overestimated by a factor , and consequently the mass of the large scale dark matter is underestimated by .
In contrast with the cluster A383 (Monna et al., 2015) where the use of central velocity dispersions substantially improves constraints on the truncation radii of cluster galaxies, there is little change in these constraints in the case of A611.
Errors in the truncation radii for galaxies in A611 are comparable with the errors from the SL modelling without using . This result for A611 relative to A383 is due to both the size of the samples of cluster members with measured velocity and the number of lensed features. In A383 (Monna et al., 2015) there are galaxies with measured inside the critical lines and the constraints on the truncation radii improve by . In A611, there are only 5 galaxies inside the region probed robustly by SL. Furthermore, A611 has only 3 systems of multiple images in the cluster core whereas A383 has 10.
SB reconstruction of the tangential giant arc associated with A611 does provide additional constraints on 5 cluster members projected near the arc. The galaxies G2 and G4 get velocity dispersions from the SB analysis which are consistent at the confidence level with the respective spectroscopic measurements. Overall the parameters of the galaxies are in agreement with the scaling relation derived in the pointlike analysis. In contrast two of these galaxies depart substantially from the galaxy scaling relation. Their small truncation radii may reflect differing stripping history among individual cluster members (Warnick, Knebe & Power, 2008).
More extensive samples of spectroscopically measured velocity dispersions for members of a set of clusters will eventually provide a platform for refining the relative contribution of the cluster members and the dark matter halo to the overall cluster mass distribution as a function of total cluster mass and as a function of the evolutionary state of the cluster. Combined with large redshift surveys of the central cluster region they promise insight into the stripping processes that govern the evolution of galaxies in dense cluster environments.
Acknowledgements
We thank Andrew Newman and David Sand for generously providing their Hectospec spectra of A611 so that we could extract central velocity dispersions of additional cluster members. We also thank Aleksi Halkola, who provided the tool GLEE used to perform this analysis. Finally we thank Megan Donahue, Brenda Frye, Claudio Grillo and Massimo Meneghetti for their comments and contributions to this work. This work is supported by the Transregional Collaborative Research Centre TRR 33 - The Dark Universe and the DFG cluster of excellence “Origin and Structure of the Universe”. The CLASH Multi-Cycle Treasury Program (GO-12065) is based on observations made with the NASA/ESA Hubble Space Telescope. The Space Telescope Science Institute is operated by the Association of Universities for Research in Astronomy, Inc. under NASA contract NAS 5-26555. The Dark Cosmology Centre is funded by the DNRF. Support for AZ is provided by NASA through Hubble Fellowship grant #HST-HF-51334.01-A awarded by STScI. The Smithsonian Institution supports the research of DGF, MJG, and HSH.
References
- Arnouts et al. (1999) Arnouts S., Cristiani S., Moscardini L., Matarrese S., Lucchin F., Fontana A., Giallongo E., 1999, Mon. Not. Roy. Astron. Soc., 310, 540
- Bartelmann (2010) Bartelmann M., 2010, Classical and Quantum Gravity, 27, 233001
- Bender, Burstein & Faber (1992) Bender R., Burstein D., Faber S. M., 1992, ApJ, 399, 462
- Bertin & Arnouts (1996) Bertin E., Arnouts S., 1996, A&AS, 117, 393
- Brimioulle et al. (2013) Brimioulle F., Seitz S., Lerchster M., Bender R., Snigula J., 2013, Mon. Not. Roy. Astron. Soc., 432, 1046
- D’Aloisio & Natarajan (2011) D’Aloisio A., Natarajan P., 2011, Mon. Not. Roy. Astron. Soc., 411, 1628
- Donnarumma et al. (2011) Donnarumma A. et al., 2011, A&A, 528, A73
- Dressler et al. (1987) Dressler A., Lynden-Bell D., Burstein D., Davies R. L., Faber S. M., Terlevich R., Wegner G., 1987, ApJ, 313, 42
- Eichner et al. (2013) Eichner T. et al., 2013, ApJ, 774, 124
- Elíasdóttir et al. (2007) Elíasdóttir Á. et al., 2007, ArXiv e-prints
- Faber et al. (1987) Faber S. M., Dressler A., Davies R. L., Burstein D., Lynden-Bell D., 1987, in Nearly Normal Galaxies. From the Planck Time to the Present, Faber S. M., ed., pp. 175–183
- Faber & Jackson (1976) Faber S. M., Jackson R. E., 1976, ApJ, 204, 668
- Fabricant et al. (2013) Fabricant D., Chilingarian I., Hwang H. S., Kurtz M. J., Geller M. J., Del’Antonio I. P., Rines K. J., 2013, PASP, 125, 1362
- Fabricant et al. (2005) Fabricant D. et al., 2005, PASP, 117, 1411
- Focardi & Malavasi (2012) Focardi P., Malavasi N., 2012, ApJ, 756, 117
- Geiger & Schneider (1999) Geiger B., Schneider P., 1999, Mon. Not. Roy. Astron. Soc., 302, 118
- Halkola, Seitz & Pannella (2007) Halkola A., Seitz S., Pannella M., 2007, ApJ, 656, 739
- Hoekstra et al. (2003) Hoekstra H., Franx M., Kuijken K., Carlberg R. G., Yee H. K. C., 2003, Mon. Not. Roy. Astron. Soc., 340, 609
- Host (2012) Host O., 2012, Mon. Not. Roy. Astron. Soc., 420, L18
- Ilbert et al. (2006) Ilbert O. et al., 2006, A&A, 457, 841
- Ilbert et al. (2009) Ilbert O. et al., 2009, ApJ, 690, 1236
- Jorgensen, Franx & Kjaergaard (1995) Jorgensen I., Franx M., Kjaergaard P., 1995, Mon. Not. Roy. Astron. Soc., 276, 1341
- Jullo et al. (2007) Jullo E., Kneib J.-P., Limousin M., Elíasdóttir Á., Marshall P. J., Verdugo T., 2007, New Journal of Physics, 9, 447
- Kassiola & Kovner (1993) Kassiola A., Kovner I., 1993, in Liege International Astrophysical Colloquia, Vol. 31, Liege International Astrophysical Colloquia, Surdej J., Fraipont-Caro D., Gosset E., Refsdal S., Remy M., eds., p. 571
- Kneib & Natarajan (2011) Kneib J.-P., Natarajan P., 2011, A&ARv, 19, 47
- Koekemoer et al. (2011) Koekemoer A. M. et al., 2011, ApJS, 197, 36
- Koleva et al. (2009) Koleva M., Prugniel P., Bouchard A., Wu Y., 2009, A&A, 501, 1269
- Koopmans et al. (2006) Koopmans L. V. E., Treu T., Bolton A. S., Burles S., Moustakas L. A., 2006, ApJ, 649, 599
- Kormendy & Bender (2013) Kormendy J., Bender R., 2013, ApJ, 769, L5
- Le Borgne et al. (2004) Le Borgne D., Rocca-Volmerange B., Prugniel P., Lançon A., Fioc M., Soubiran C., 2004, A&A, 425, 881
- Lemze et al. (2013) Lemze D. et al., 2013, ApJ, 776, 91
- Limousin et al. (2007) Limousin M., Kneib J. P., Bardeau S., Natarajan P., Czoske O., Smail I., Ebeling H., Smith G. P., 2007, A&A, 461, 881
- Limousin et al. (2009) Limousin M., Sommer-Larsen J., Natarajan P., Milvang-Jensen B., 2009, ApJ, 696, 1771
- Merritt (1983) Merritt D., 1983, ApJ, 264, 24
- Monna et al. (2015) Monna A. et al., 2015, Mon. Not. Roy. Astron. Soc., 447, 1224
- Narayan (1998) Narayan R., 1998, New Astronomy Reviews, 42, 73
- Natarajan, Kneib & Smail (2002) Natarajan P., Kneib J.-P., Smail I., 2002, ApJ, 580, L11
- Natarajan et al. (2009) Natarajan P., Kneib J.-P., Smail I., Treu T., Ellis R., Moran S., Limousin M., Czoske O., 2009, ApJ, 693, 970
- Newman et al. (2013a) Newman A. B., Treu T., Ellis R. S., Sand D. J., 2013a, ApJ, 765, 25
- Newman et al. (2013b) Newman A. B., Treu T., Ellis R. S., Sand D. J., Nipoti C., Richard J., Jullo E., 2013b, ApJ, 765, 24
- Newman et al. (2009) Newman A. B., Treu T., Ellis R. S., Sand D. J., Richard J., Marshall P. J., Capak P., Miyazaki S., 2009, ApJ, 706, 1078
- Peng et al. (2010) Peng C. Y., Ho L. C., Impey C. D., Rix H.-W., 2010, AJ, 139, 2097
- Richard et al. (2010) Richard J., Kneib J.-P., Limousin M., Edge A., Jullo E., 2010, Mon. Not. Roy. Astron. Soc., 402, L44
- Rusin et al. (2003) Rusin D. et al., 2003, ApJ, 587, 143
- Sánchez-Blázquez et al. (2006) Sánchez-Blázquez P. et al., 2006, Mon. Not. Roy. Astron. Soc., 371, 703
- Schneider (2003) Schneider P., 2003, ArXiv Astrophysics e-prints
- Suyu & Halkola (2010) Suyu S. H., Halkola A., 2010, A&A, 524, A94
- Suyu et al. (2012) Suyu S. H. et al., 2012, ApJ, 750, 10
- Suyu et al. (2006) Suyu S. H., Marshall P. J., Hobson M. P., Blandford R. D., 2006, Mon. Not. Roy. Astron. Soc., 371, 983
- Warnick, Knebe & Power (2008) Warnick K., Knebe A., Power C., 2008, Mon. Not. Roy. Astron. Soc., 385, 1859
- Warren & Dye (2003) Warren S. J., Dye S., 2003, ApJ, 590, 673
- Zahid et al. (2015) Zahid H. J., Damjanov I., Geller M. J., Hwang H. S., Fabricant D. G., 2015, ArXiv e-prints
- Zitrin et al. (2015) Zitrin A. et al., 2015, ApJ, 801, 44
Appendix A MCMC Sampling of the pointlike models
In this section we present the Monte Carlo Markov Chain sampling of the parameters describing the mass components of A611 resulting from the pointlike analysis, presented in Sec. 4. The color scale correspond to 68.3% (green), 95.5% (yellow) and 99.7% (orange). The blue dot indicate the median of the distribution, the black cross is the best value. Fig. 8 shows the MCMC sampling for the parameters of the smooth dark halo, the BCG, the reference galaxy GR and the galaxies G1 and G2. Fig. 9 shows the sampling of the mass parameters for DH, BCG, GR together with the galaxies G3, G4 and G5. In both plots there is no degeneracy between the parameters of the galaxies in the neighborhood of the giant arc (G1-G5) and the mass components of the large scale halo, the BCG and the reference galaxy.
