BEST sensitivity to O(1) eV sterile neutrino
Abstract
Numerous anomalous results in neutrino oscillation experiments can be attributed to interference of eV sterile neutrino. The specially designed to fully explore the Gallium anomaly Baksan Experiment on Sterile Transitions (BEST) starts next year. We investigate the sensitivity of BEST in searches for sterile neutrino mixed with electron neutrino. Then, performing the combined analysis of all the Gallium experiments (SAGE, GALLEX, BEST) we find the regions in model parameter space (sterile neutrino mass and mixing angle), which will be excluded if BEST agrees with no sterile neutrino hypothesis. For the opposite case, if BEST observes the signal as it follows from the sterile neutrino explanation of the Gallium (SAGE and GALLEX) anomaly, we show how BEST will improve upon the present estimates of the model parameters.
I Introduction
Neutrino oscillations111There are antineutrino oscillations as well, but in the general discussion we do not distinguish the two cases. provide with the only direct irrefutable evidence for incompleteness of the Standard Model of particle physics (SM). Moreover, while most issues of the neutrino experiments can be properly addressed by making at least two out of three SM neutrinos massive, there are several anomalous results which are definitely beyond the grasp of this simple extension.
The results of experiments LSND Athanassopoulos et al. (1995); Aguilar-Arevalo et al. (2001), MiniBooNE Aguilar-Arevalo et al. (2010, 2013), SAGE Abdurashitov et al. (1999, 2006), GALLEX Kaether et al. (2010), analysis of measured reactor antineutrinos Mueller et al. (2011); Huber (2011) show anomalous change of neutrino fluxes. If attributed to oscillations, it requires much bigger values of neutrino squared mass difference, eV2, as compared to the already known values of the two mass squared differences (so called solar, eV2 and atmospheric, eV2 Olive et al. (2014)) sufficient to explain the results of the great majority of neutrino oscillation experiments. The hierarchy between the two mass differences, , can be described by three neutrino eigenstates and hence is consistent with three neutrino pattern. The third mass difference making the pronounced hierarchy asks for (at least) one more neutrino eigenstate, that the SM does not have. A hunt for the new light neutrino specie is the main task of many developing projects Abazajian et al. (2012).
The anomalies naturally form two classes. There are anomalous appearances (excesses of signal events) and anomalous disappearances (lacks of signal events). An anomalous disappearance of neutrinos can point at oscillations into the (hypothetical) fourth light neutrino state, singlet with respect to the SM gauge group, and hence called sterile, while the SM neutrinos are dubbed active. In particular, observed by experiments SAGE Abdurashitov et al. (2009) and GALLEX Kaether et al. (2010) lack of electron neutrinos from artificial radioactive neutrino sources can be explained by oscillations into sterile neutrinos, which obviously escape detection. Then electron neutrino flux measured at a distance from the source is proportional to the electron neutrino survival probability (against transition into the sterile state). For the artificial sources under discussion, the neutrino flux is quasi-monochromatic. The survival probability for neutrino of energy is determined in the two-neutrino effective oscillating system through the sterile-active mixing angle and the squared mass difference (saturated mostly by the sterile neutrino squared mass) as follows, see e.g. Bilenky et al. (1999),
| (1) |
The joint analysis Giunti and Laveder (2011) of the four Gallium anomalous results (two per each experiment) reveals the anomaly—disappearance of electron neutrinos—at the statistical level of 2-3 standard deviations. Within the hypothesis of oscillations into sterile neutrino, the best fit of model parameters entering the survival probability (1) have typical values in the region Giunti et al. (2012)
| (2) |
The new Gallium experiment BEST Gavrin et al. (2010, 2011); Abazajian et al. (2012) in Baksan Neutrino Observatory was proposed to thoroughly explore the Gallium anomaly. It is a short-baseline experiment utilizing the artificial compact 51Cr source of almost monochromatic electron neutrinos to be measured at effectively two distances of m and m from the source. After accurate measurement and detailed analysis of the neutrino-Gallium cross section Frekers et al. (2011, 2013, 2015) it has been recently approved, see Refs. Abdurashitov et al. (2011); Gorbachev et al. (2012, 2013); Gavrin (2013); Gavrin et al. (2015) for description of the passed and present R&D stages. It will start supposedly next year with production of artificial 3 MCi radioactive 51Cr source of electron neutrinos. In this paper we refine the preliminary estimates Abazajian et al. (2012) of the BEST sensitivity to the sterile neutrino parameters and its prospects in exploring the Gallium anomaly.
The paper is organized as follows. Sec. II contains brief descriptions of the main idea of the experiment, the artificial source, detecting technique, data processing, registration efficiency, and final accuracy in measurement of the electron neutrino flux. We discuss the anomalous results of the Gallium experiments in sec. III and present the region in the sterile neutrino model parameter space (, ) favored by the Gallium anomaly. In sec. IV we outline the regions to be excluded by BEST, if its result is consistent with no oscillation hypothesis, and the regions to be excluded by the joint analysis of all the Gallium experiments. Likewise we consider the possibility that the BEST future result is consistent with predictions of the sterile neutrino model with parameters tuned at the best-fit to the Gallium anomaly, outline the favored by BEST region in this case and present the region chosen by the joint analysis of all the Gallium experiments. We summarize in sec. V.
II Description of the experiment: layout, operation and data analysis
BEST is a short-baseline neutrino oscillation experiment. The size is determined from eq. (1) by the best-fit values (2), which for MeV-scale neutrino energy implies 1 m-scale oscillation length. The artificial radioactive source of 3MCi is made of 51Cr, which decays emitting quasi-monochromatic neutrinos of energies MeV (dominant mode), MeV, MeV, and MeV. The source intensity is measured with not worse than 0.5% accuracy by making use of the methods presented in Refs. Gorbachev et al. (2014); Veretenkin et al. (2014); Gorbachev and Malyshkin (2015).
The source is a solid homogeneous cylinder with diameter about 9 cm and height about 10 cm. It is placed in the center of sphere of radius m filled with homogeneous liquid Gallium 71Ga. The sphere is inside the cylindrical vessel of radius m and height also filled with homogeneous liquid Gallium, see Fig. 1.
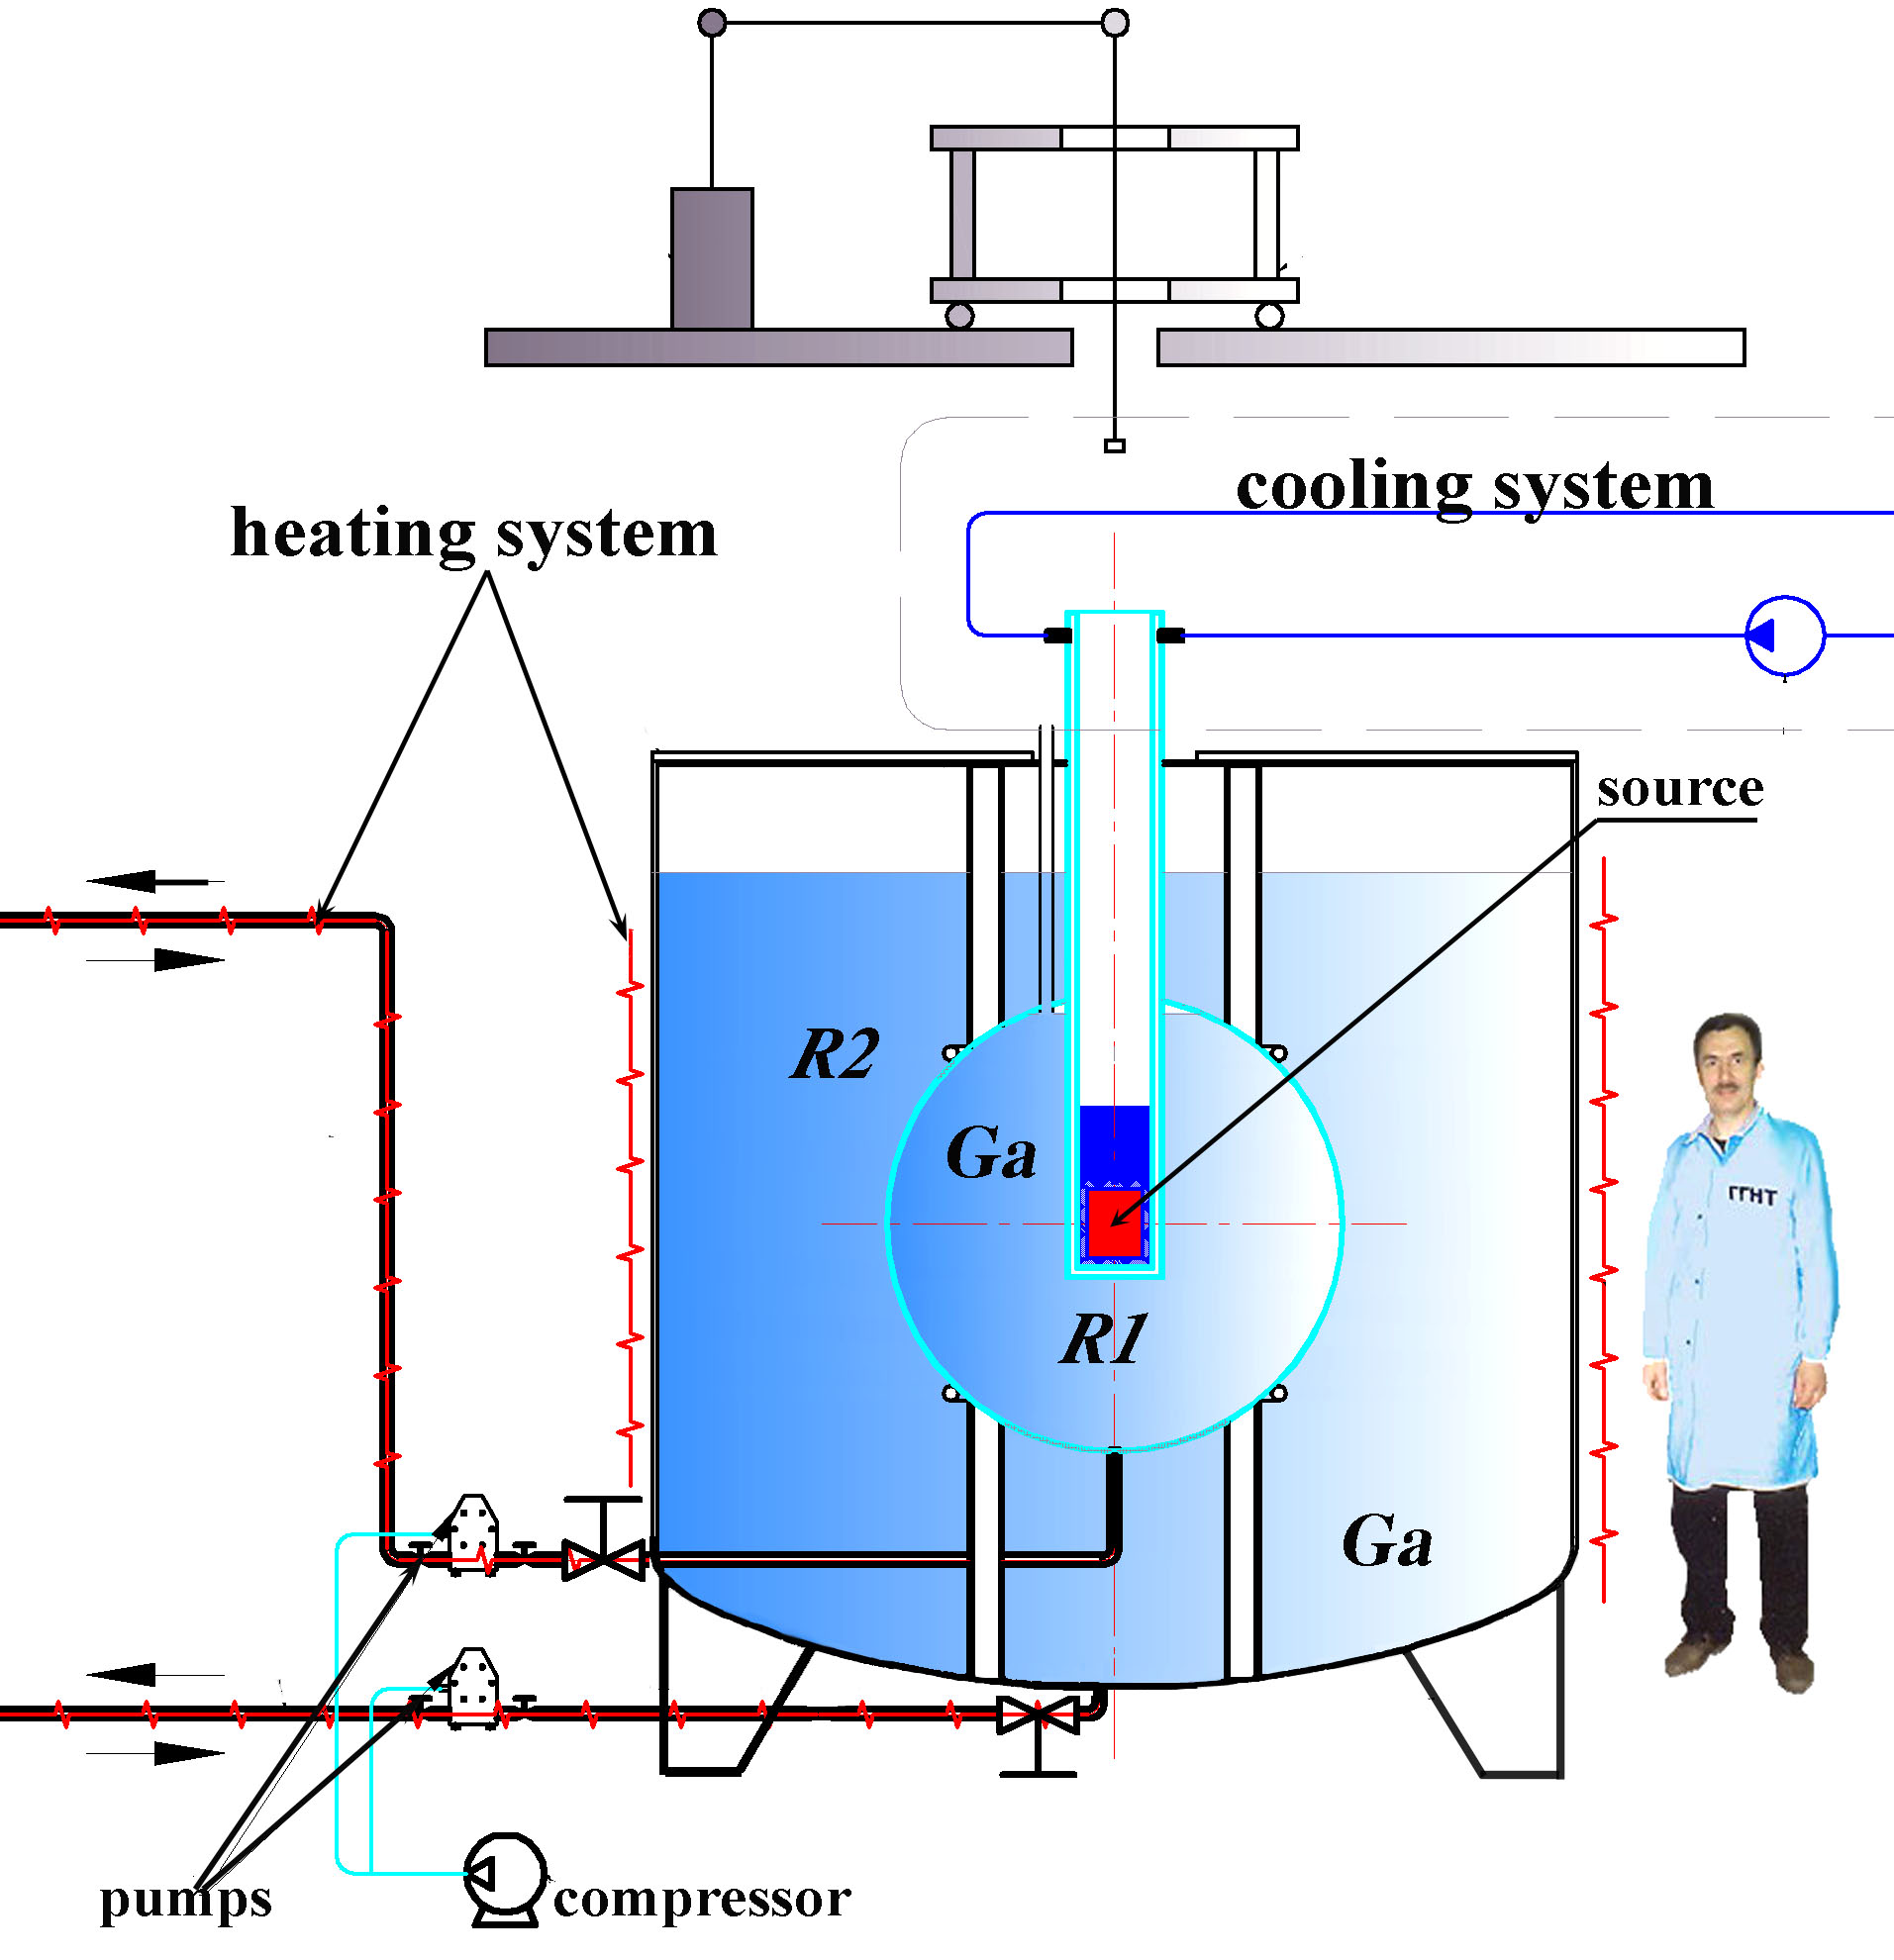
The allocated for the artificial source central part of construction can be approximated 222The use of the effective geometry changes the neutrino count rate by less than 2% Abazajian et al. (2012), which impact on our estimates of the BEST sensitivity is negligible. as a spherical region of radius cm. Only this part is free of Gallium. The electron neutrinos can be captured by 71Ga nuclei, which turn into 71Ge. This Germanium isotop decays solely by electron capture to the ground state of 71Ga with half-life of 11.43 d. Without oscillations to the sterile neutrinos, at the beginning of irradiation the mean production rate of 71Ge in each zone is 65 atoms per day. After an exposure period, the 71Ge atoms produced by neutrino capture are extracted from Gallium and counted separately for each vessel with mostly the same technique Abdurashitov et al. (2011) as used for the SAGE experiment. The lifetime of 51Cr is 27.7 d and several subsequent extractions are planned. A Monte Carlo simulation of the entire experiment—10 extractions each with 9-day exposure—which uses typical values of extraction efficiency, counter efficiency, counter background rates, and includes the known solar neutrino rate, indicates that the rate in each zone can be measured with a statistical uncertainty of about . An expected total systematic uncertainty is about . The combined fit to the 10 extractions enables measurement of the electron neutrino flux keeping it under control in each vessel with accuracy better than 5% Abazajian et al. (2012); Gavrin et al. (2015).
III Gallium anomaly
We start with analysis of anomalous results, observed in SAGE and GALLEX, to find the region in sterile neutrino parameter space favored by the explanation of the anomaly as oscillations into the sterile neutrinos.
In SAGE the artificial sources have been placed in the center of spherical vessel, which for our purposes may be approximated as a sphere of radius cm with central part of radius cm free of Gallium and allocated for the source. The artificial sources were of the cylindrical form with height of 15 cm and diameter of 9.5 cm Abdurashitov et al. (1999). It can be approximated as a sphere of radius cm. In the first experiment the 51Cr source was used. It provided the same neutrino spectrum as in case of BEST, which is effectively two-peak with energy lines at MeV (dominant peak) and MeV. In the second experiment the 37Ar source was used. The dominant neutrino mode is at MeV, the subdominant is very close, MeV, so the source is monochromatic with a high accuracy.
Neutrino flux at the distance from the source is proportional to the survival probability (1). The rate of induced transitions Ge is also proportional to the Gallium density, which was uniform, and to the neutrino capture cross section, , which is different for different neutrino energies, and has been recently refined Frekers et al. (2011, 2013, 2015). The contribution of each neutrino line to the number of transition is weighted with intensity of the line and neutrino caption cross section , . Finally, for the ratio of signal, expected within the sterile neutrino hypothesis, and signal, expected without sterile neutrino, we obtain
| (3) |
where the relative contributions of the two lines in the 51Cr source are , , the integration goes between the radius of the central part and the vessel radius , the normalizing effective length is ; the results are further averaged over the artificial source of finite size (variable ) adopting the spherical approximation with radius .
Likewise this formula can be applied to describe the results of the SAGE experiment with 37Ar source.
The two measurements in GALLEX experiment Cribier et al. (1996) have been performed with 51Cr radioactive sources. In each case the radioactive source can be approximated by a homogeneous sphere of radius m. The source was placed in a center of the vessel which for our purposes can be approximate as a sphere of radius m, the radius of the central part with source is m. To describe the expected ratio of the signals with sterile neutrino and without sterile neutrino one can use the same formula (3) with the same values of and , as those adopted for the SAGE with 51Cr source, and , .
The anomalous results read Giunti and Laveder (2011)
| (4) |
The best fit values of the sterile neutrino model parameters entering the theoretical expectations (3) through the survival probability (1), can be obtained by minimizing the statistics defined as the following sum over all the four experiments
| (5) |
where stand for corresponding uncertainties in measured values (4).
We find for the best-fit value
| (6) |
which we exploit below as a refined version of the estimate (2). In Fig. 2
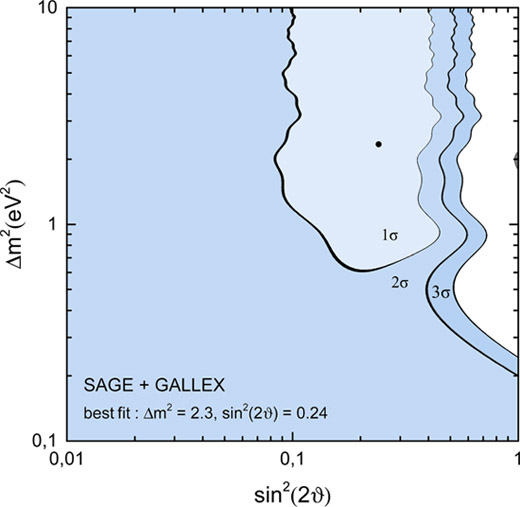
we present the contours outlining the regions consistent with the sterile neutrino explanation of the anomaly at 1 , 2 and 3 confidence levels. The contours refer to the corresponding marginal values of for with two free parameters: , respectively Olive et al. (2014); the oscillation parameters , are adopted in the minimized -function for the four Gallium radioactive source experiments. As one observes from Fig. 2, the lines of constant forms rather shallow profile, so the best-fit value (6) is not actually indicative: the 1 -region is quite broad, eV2, . It is in agreement, of course, with the statement Giunti and Laveder (2011) that the statistical significance of the observed anomaly is not high, at the level of 2-3 , as we mention in Introduction.
IV Sensitivity contours
As noticed in sec. II the technique used in BEST allows to measure the ratio in each vessel with accuracy of about . The presence of two vessels enables performing two independent experiments in the same time. The predictions for the expected ratios are given by the same formula (3) with and for experiment one and and for experiment two.
Further we treat the would-be measured at BEST ratio as a random Gaussian variable with central value and standard deviation , so that is distributed as
| (7) |
For each value of the corresponding model parameters are determined by maximization of the likelihood function
| (8) |
Suppose, that the BEST results are consistent with a particular theory prediction . Then within the Bayesian approach the favored value of the sterile neutrino parameters are determined from (8) marginalized over with Gaussian prior (7), which gives
Thus, the favored model parameters are distributed as (8) with the following replacement and .
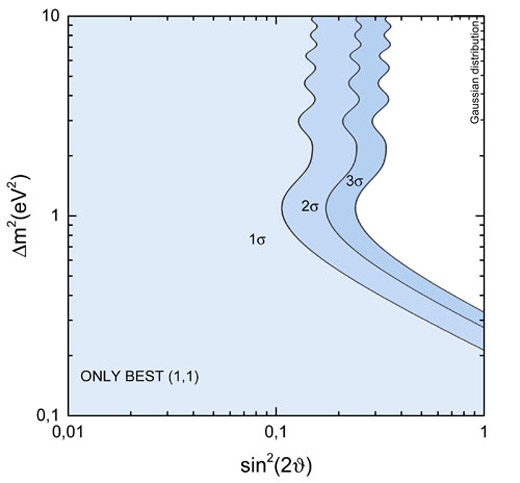
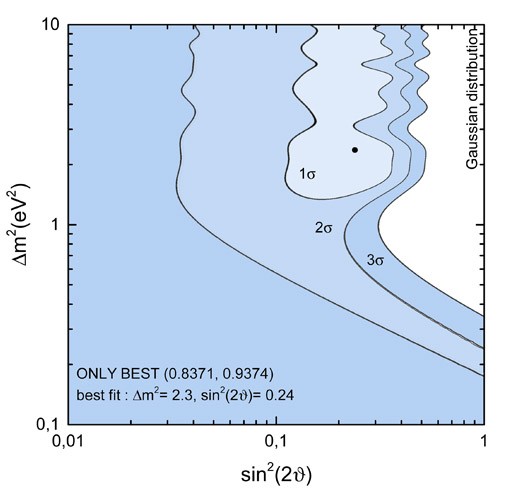
Then the BEST sensitivity can be obtained using the same -expression (5) with and . To illustrate this formula in Fig. 3 we present the plots with exclusion regions for two cases: (top panel) BEST observations are fully consistent with only three neutrino states, i.e. for each vessel; (bottom panel) BEST observations are fully consistent with the best fit oscillation parameters (6) from the sterile neutrino explanation of the Gallium anomaly, which for the BEST setup implies
| (9) |
for the inner and outer vessels, respectively. The regions outside the 2 contours will be excluded by BEST in these two cases at 95%CL, which illustrate the BEST prospects in testing the Gallium anomaly.
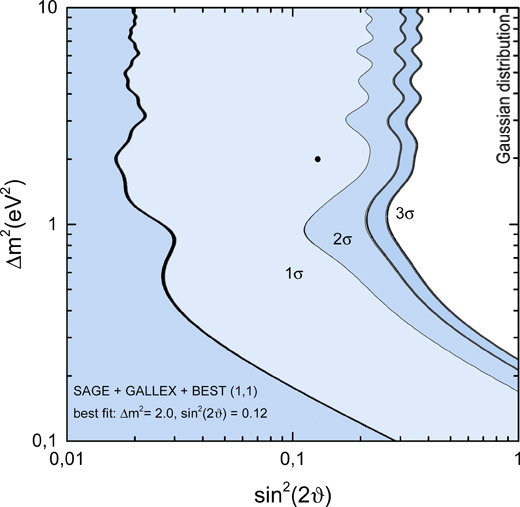
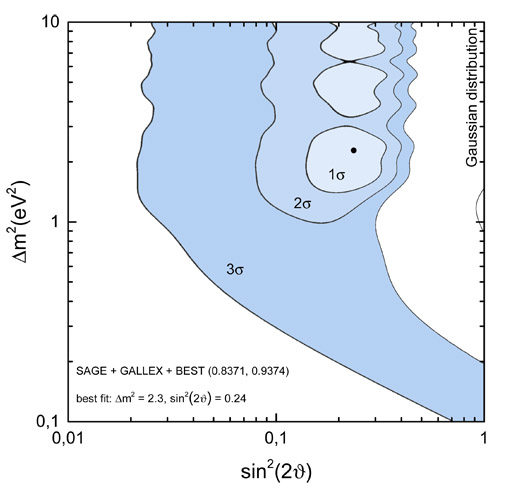
The plots in Fig. 3, as compared to that in Fig. 2, ensure that the status of the Gallium anomaly after the BEST experiment will largely depend on its results. To support this conclusion, we calculate the joint -statistics (5) for all the radioactive source experiments by SAGE, GALLEX, and BEST (6 experiments in total) assuming for the latter an error and central values consistent with either the three neutrinos only, hence , or with the best-fit values (6), and hence ratios (9). The favored in these cases regions of the model parameter space are presented in Fig. 4.
V Conclusions
To summarize, we present the refined estimates of BEST sensitivity to models with light sterile neutrinos mixed with electron neutrinos. We study possible impact of the future BEST results on the status of the Gallium anomaly.
The performed numerical studies are illustrated with plots in Figs. 3, 4. It is worth noting that the region eV2 is excluded for by the peak searches in -decays, the strongest limits are placed by the Troitsk -mass experiment Belesev et al. (2013, 2014). Note also, that sterile neutrino of mass eV noticeably changes the cosmological prediction of the standard CDM model. In particular, the Planck experiment Ade et al. (2015) excludes masses above eV for the fully thermalized sterile neutrino. However, this cosmological limit considerably depends on the cosmological data set used in the analysis. Also, this limit is inapplicable if the sterile neutrinos are not thermalized in the early Universe plasma of the Standard Model particles, which can happen in specific extensions of the Standard Model, see e.g. Hannestad et al. (2014); Dasgupta and Kopp (2014). Thus, cosmology still allows for the presence of light sterile neutrinos (introduced to explain the Gallium anomaly) with extended particle physics and/or cosmological model. In turn, direct searches for light sterile neutrinos, like that provided by BEST, can test such extensions.
We thanks F. Bezrukov, S. Demidov and G. Rubtsov for valuable discussions. The work was supported by the RSF grant 14-22-00161.
References
- Athanassopoulos et al. (1995) C. Athanassopoulos et al. (LSND), Phys. Rev. Lett. 75, 2650 (1995), arXiv:nucl-ex/9504002 [nucl-ex] .
- Aguilar-Arevalo et al. (2001) A. Aguilar-Arevalo et al. (LSND), Phys. Rev. D64, 112007 (2001), arXiv:hep-ex/0104049 [hep-ex] .
- Aguilar-Arevalo et al. (2010) A. A. Aguilar-Arevalo et al. (MiniBooNE), Phys. Rev. Lett. 105, 181801 (2010), arXiv:1007.1150 [hep-ex] .
- Aguilar-Arevalo et al. (2013) A. A. Aguilar-Arevalo et al. (MiniBooNE), Phys. Rev. Lett. 110, 161801 (2013), arXiv:1207.4809 [hep-ex] .
- Abdurashitov et al. (1999) J. N. Abdurashitov et al. (SAGE), Phys. Rev. C59, 2246 (1999), arXiv:hep-ph/9803418 [hep-ph] .
- Abdurashitov et al. (2006) J. N. Abdurashitov et al., Phys. Rev. C73, 045805 (2006), arXiv:nucl-ex/0512041 [nucl-ex] .
- Kaether et al. (2010) F. Kaether, W. Hampel, G. Heusser, J. Kiko, and T. Kirsten, Phys. Lett. B685, 47 (2010), arXiv:1001.2731 [hep-ex] .
- Mueller et al. (2011) T. A. Mueller et al., Phys. Rev. C83, 054615 (2011), arXiv:1101.2663 [hep-ex] .
- Huber (2011) P. Huber, Phys. Rev. C84, 024617 (2011), [Erratum: Phys. Rev.C85,029901(2012)], arXiv:1106.0687 [hep-ph] .
- Olive et al. (2014) K. A. Olive et al. (Particle Data Group), Chin. Phys. C38, 090001 (2014).
- Abazajian et al. (2012) K. N. Abazajian et al., (2012), arXiv:1204.5379 [hep-ph] .
- Abdurashitov et al. (2009) J. N. Abdurashitov et al. (SAGE), Phys. Rev. C80, 015807 (2009), arXiv:0901.2200 [nucl-ex] .
- Bilenky et al. (1999) S. M. Bilenky, C. Giunti, and W. Grimus, Prog. Part. Nucl. Phys. 43, 1 (1999), arXiv:hep-ph/9812360 [hep-ph] .
- Giunti and Laveder (2011) C. Giunti and M. Laveder, Phys. Rev. C83, 065504 (2011), arXiv:1006.3244 [hep-ph] .
- Giunti et al. (2012) C. Giunti, M. Laveder, Y. F. Li, Q. Y. Liu, and H. W. Long, Phys. Rev. D86, 113014 (2012), arXiv:1210.5715 [hep-ph] .
- Gavrin et al. (2010) V. N. Gavrin, V. V. Gorbachev, E. P. Veretenkin, and B. T. Cleveland, (2010), arXiv:1006.2103 [nucl-ex] .
- Gavrin et al. (2011) V. N. Gavrin, V. V. Gorbachev, E. P. Veretenkin, B. T. Cleveland, S. R. Elliott, and J. S. Nico, in Neutrino telescopes. Proceedings, 14th International Workshop, Venice, Italy, March 15-18, 2011 (2011).
- Frekers et al. (2011) D. Frekers et al., Phys. Lett. B706, 134 (2011).
- Frekers et al. (2013) D. Frekers et al., Phys. Lett. B722, 233 (2013).
- Frekers et al. (2015) D. Frekers et al., Phys. Rev. C91, 034608 (2015).
- Abdurashitov et al. (2011) J. N. Abdurashitov, V. N. Gavrin, V. V. Gorbachev, T. V. Ibragimova, I. N. Mirmov, A. A. Shikhin, V. E. Yants, and B. T. Cleveland, Instrum. Exp. Tech. 54, 156 (2011), [Prib. Tekh. Eksp.2011,no.2,12(2011)].
- Gorbachev et al. (2012) V. V. Gorbachev, B. T. Cleveland, V. N. Gavrin, T. V. Ibragimova, A. V. Kalikhov, J. S. Nico, and E. P. Veretenkin, Topics in astroparticle and underground physics. Proceedings, 12th International Conference, TAUP 2011, Munich, Germany, September 5-9, 2011, J. Phys. Conf. Ser. 375, 042068 (2012).
- Gorbachev et al. (2013) V. V. Gorbachev, E. P. Veretenkin, V. N. Gavrin, S. N. Dan’shin, T. V. Ibragimova, A. V. Kalikhov, and T. V. Knodel, Phys. Atom. Nucl. 76, 1507 (2013), [Yad. Fiz.76,1591(2013)].
- Gavrin (2013) V. N. Gavrin, Phys. Atom. Nucl. 76, 1238 (2013), [Yad. Fiz.76,1299(2013)].
- Gavrin et al. (2015) V. Gavrin et al., Proceedings, International Workshop on Prospects of Particle Physics: “Neutrino Physics and Astrophysics” (PPP 2014), Phys. Part. Nucl. 46, 131 (2015).
- Gorbachev et al. (2014) V. V. Gorbachev, V. N. Gavrin, T. V. Ibragimova, A. V. Kalikhov, Y. M. Malyshkin, and A. A. Shikhin, Yadernaya fizika i inzhiniring 5, 892 (2014).
- Veretenkin et al. (2014) E. P. Veretenkin, V. V. Gorbachev, V. N. Gavrin, S. N. Danshin, T. V. Ibragimova, Y. P. Kozlova, and I. N. Mirmov, Yadernaya fizika i inzhiniring 5, 904 (2014).
- Gorbachev and Malyshkin (2015) V. V. Gorbachev and Y. M. Malyshkin, Instrum. Exp. Tech. 58, 418 (2015).
- Cribier et al. (1996) M. Cribier et al., Nucl. Instrum. Meth. A378, 233 (1996).
- Belesev et al. (2013) A. I. Belesev, A. I. Berlev, E. V. Geraskin, A. A. Golubev, N. A. Likhovid, A. A. Nozik, V. S. Pantuev, V. I. Parfenov, and A. K. Skasyrskaya, JETP Lett. 97, 67 (2013), arXiv:1211.7193 [hep-ex] .
- Belesev et al. (2014) A. I. Belesev, A. I. Berlev, E. V. Geraskin, A. A. Golubev, N. A. Likhovid, A. A. Nozik, V. S. Pantuev, V. I. Parfenov, and A. K. Skasyrskaya, J. Phys. G41, 015001 (2014), arXiv:1307.5687 [hep-ex] .
- Ade et al. (2015) P. A. R. Ade et al. (Planck), (2015), arXiv:1502.01589 [astro-ph.CO] .
- Hannestad et al. (2014) S. Hannestad, R. S. Hansen, and T. Tram, Phys. Rev. Lett. 112, 031802 (2014), arXiv:1310.5926 [astro-ph.CO] .
- Dasgupta and Kopp (2014) B. Dasgupta and J. Kopp, Phys. Rev. Lett. 112, 031803 (2014), arXiv:1310.6337 [hep-ph] .