On the spreading of impacting drops
Abstract
The energy budget and dissipation mechanisms during droplet impact on solid surfaces are studied numerically and theoretically. We find that for high impact velocities and negligible surface friction at the solid surface (i.e. free-slip), about one half of the initial kinetic energy is transformed into surface energy, independent of the impact parameters and the detailed energy loss mechanism(s). We argue that this seemingly universal rule is related to the deformation mode of the droplet and is reminiscent of pipe flow undergoing a sudden expansion, for which the head loss can be calculated by multiplying the kinetic energy of the incoming flow by a geometrical factor. For impacts on a no-slip surface also dissipation in the shear boundary layer at the solid surface is important. In this case the geometric head loss acts as a lower bound on the total dissipation (i.e. the spreading on a no-slip surface approaches that on a free-slip surface when the droplet viscosity is send to zero).
This new view on the impact problem allows for simple analytical estimates of the maximum spreading diameter of impacting drops as a function of the impact parameters and the properties of the solid surface. It bridges the gap between previous momentum balance approaches and energy balance approaches, which hitherto did not give consistent predictions in the low viscosity limit. Good agreement is found between our models and experiments, both for impacts on “slippery” or lubricated surfaces (e.g. Leidenfrost droplet impacts and head-on droplet-droplet collisions) and for impacts on no-slip surfaces.
1 Introduction
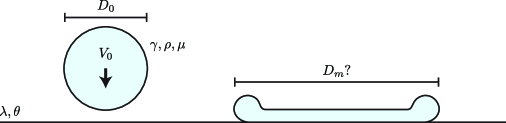
The common event of a liquid drop colliding with a solid surface is a very rich phenomenon: droplets can splash, spread or bounce (Rein, 1993; Yarin, 2006; Marengo et al., 2011; Quéré, 2013; Josserand & Thoroddsen, 2016), often entrapping air in the process (Chandra & Avedisian, 1991; Thoroddsen et al., 2005). But despite the great experimental progress on the droplet impact problem (Thoroddsen et al., 2008) consensus has yet to be reached on many of its basic laws. One of the very basic questions (see figure 1) is to find out the maximum spreading diameter of the droplet, given its initial diameter , its impact velocity , the properties of the liquid (density , surface tension , and viscosity ), and the conditions at the solid surface: the slip length (Lastakowski et al., 2014) and the (dynamic) liquid-solid contact angle (Šikalo et al., 2005; Antonini et al., 2012). The influence of the surrounding air is often negligible in the overall spreading dynamics (Visser et al., 2015). Using dimensional analysis, the problem can be reduced to finding the spreading ratio , where
are the impact Weber and Reynolds numbers, which reflect, respectively, the importance of the surface tension and viscosity with respect to the initial inertia of the drop.
Knowing the maximum surface coverage that an impacting drop can reach is of great importance in a wide variety of applications: from ink-jet printing (Van Dam & Le Clerc, 2004), spray cooling (Kim, 2007) and self-cleaning surfaces (Blossey, 2003), to blood spatter analysis in crime scenes (Laan et al., 2014) and anti-icing of aircraft wings (Mishchenko et al., 2010). All these applications deal with high inertia impacts (, ) in which the droplets greatly deform. This regime will be the focus of this work.
In the literature one can identify two strategies to estimate : (i) an energy balance or (ii) a force/momentum balance. In the first case it is usually assumed that the initial kinetic energy is mainly consumed by the creation of new surface area and by viscous dissipation in the shear boundary layer growing into the droplet from the solid surface (Chandra & Avedisian, 1991; Pasandideh-Fard et al., 1996; Aziz & Chandra, 2000; Ukiwe & Kwok, 2005; Lee et al., 2016). Although this approach works reasonably well in the viscous limit, where the boundary layer dominates the dynamics, it has been found that it severely overestimates the maximum spreading for cases in which viscous dissipation is supposed to be negligible (Chandra & Avedisian, 1991; Jiang et al., 1992; Clanet et al., 2004; Attané et al., 2007). Viscosity free models based on a momentum balance, on the other hand, predict the spreading in this regime quite well (Clanet et al., 2004; Eggers et al., 2010; Lastakowski et al., 2014). The question is whether we can bring the two approaches in line.
As has previously been noted by Villermaux & Bossa (2011); Roisman et al. (2012), such a discrepancy between energy and momentum approaches also occurs in a closely related fluid dynamics problem: that of the growth of a hole in a punctured liquid film (Taylor, 1959; Culick, 1960). Taylor found that, after a start-up period (Sünderhauf et al., 2002; Savva & Bush, 2009), a thick cylindrical rim forms that consumes the film at a constant retraction velocity . Using momentum and mass conservation he derived that for a film of thickness this velocity must be , in good agreement with experiments. One year later, Culick, seemingly unaware of Taylor’s result, wrote a short comment on the same problem, finding the same steady state velocity. Moreover, he emphasized that this velocity is lower by a factor of than what one would get from an energy balance between the kinetic energy of the rim and the surface energy consumed by it. That is, one half of the available surface energy never makes it into kinetic energy. The rest must be dissipated somewhere, somehow. Although viscous stresses do not enter explicitly in the momentum balance for the retraction problem, Culick argued a posteriori that they have to be concentrated near the rim entrance, where fluid from the stationary film is accelerated to match the velocity in the rim. The volume over which the associated dissipation occurs must then scale in such a way with viscosity as to make the final answer independent of it. Interestingly, the problem can also be related to the head loss in a pipe flow undergoing a sudden expansion (Villermaux & Bossa, 2011). In this situation the energy is generally lost to recirculation eddies forming downstream of the expansion section. But also here the final dissipation is insensitive to the details and can be directly calculated by multiplying the initial kinetic energy by a geometric factor (Batchelor, 1967).
In this work we use direct numerical simulations to demonstrate that a similar universal energy loss occurs for droplets which greatly deform during impact (i.e. at high Weber numbers). Taking this loss into account in a simple energy balance allows us to predict (without fitting parameters) the spreading diameters found in impact situations in which surface friction is negligible (as is the case, for example, for Leidenfrost droplets, for head-on droplet-droplet collisions or for impacts at very high Reynolds numbers). To make the story complete we extend this model to spreading on “dry” solid surfaces at intermediate Reynolds numbers, for which the flow is also hindered by the no-slip boundary condition.
2 Method
The calculation and visualization of energy dissipation inside an impacting droplet requires detailed information about the flow field. To this end, we used the open source volume of fluid solver Gerris (Popinet, 2009) to simulate the impact event. Gerris solves the incompressible Navier-Stokes equation on an adaptive grid (Popinet, 2003) and is renowned for its physically sound treatment of interface dynamics (Popinet, 2009). This makes Gerris well suited for simulating two-phase flows involving a multitude of length scales, such as droplet impact (Thoraval et al., 2012, 2013).
In each simulation an axisymmetric droplet, surrounded by a gas, was set to collide with an impermeable boundary of the domain. For the high Weber number cases the minimum refinement levels were 10 in the interior of the droplet and 13 at its surface (corresponding to and cells in one droplet diameter). During the simulations, these resolutions were adaptively increased in regions of high vorticity and strong curvature (up to levels 12 and 16, respectively). The liquid-air density and viscosity ratios were set to and , mimicking water in air. In Visser et al. (2015) we compared the droplet profiles obtained with this numerical scheme to experimental recordings with high temporal and spatial resolution. Good agreement was found in all cases.
The numerical approach makes it relatively straightforward to impose different slip conditions and liquid-solid contact angles at the solid surface. For maximal contrast, we studied the limiting cases of no-slip (slip length , radial velocity at ) and free-slip boundary conditions (, at ). In the no-slip simulations the interface of the impacting droplet often did not coalesce with the surface, so that a thin layer of air remained between the surface and the liquid. During the spreading phase the effective slip length introduced by this air layer was always small compared to the thickness of the shear boundary layer in the liquid, so that it did not noticeably change the overall dynamics as compared to true no-slip (we checked this for a few cases by forcing the droplet to coalesce at initialization). This non-coalescence behaviour fixed the contact angle for the no-slip droplets to . For the free-slip case we used both and . The latter case describes the head-on collision of two equally sized droplets that coalesce upon contact (Roisman et al., 2009).
With the axisymmetry assumed in the simulations we obviously cannot capture non-axisymmetric effects like azimuthal rim destabilization and break-up (Villermaux & Bossa, 2011). However, this idealization allows us to test basic models in the very high () Weber number regime, which is difficult to access experimentally.
3 Deformation modes: from puddle to pizza
When the Reynolds number is high, the qualitative mode of deformation of an impacting droplet mainly depends on its Weber number. In figure 2 we show numerically obtained profiles and internal flow patterns (at maximal spreading) for four orders of magnitude in Weber number (). The results for no-slip and free-slip boundary conditions are shown side by side to facilitate a direct comparison. The Reynolds number was in all eight cases.
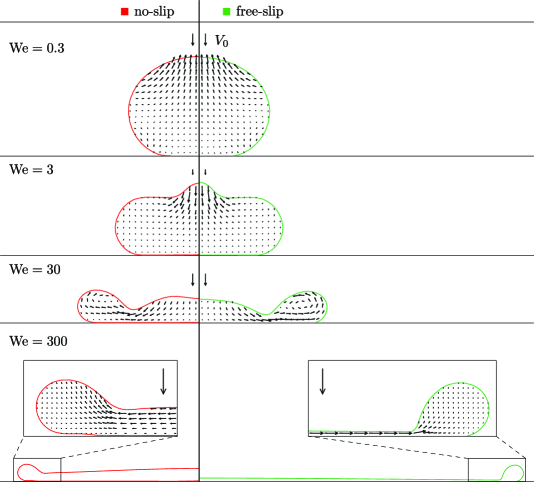
For the surface tension of the droplet dominates over its inertia and the droplet therefore deforms only slightly from spherical during impact. The close similarity between left and right profiles in figure 2 indicates that there is no large effect of the slip length in this case. This can be easily understood from the fact that, at this low Weber number, the impact time is too short for the shear boundary layer at the no-slip surface to grow appreciable. The thickness of the boundary layer at the time of maximum deformation, , can be estimated as the distance of momentum diffusion (Roisman, 2009; Eggers et al., 2010; Visser et al., 2015), with the kinematic viscosity of the liquid. Comparing this to the central height of the droplet, gives , where we introduced . From our simulations we find that for , so that .
As the Weber number is increased beyond , the droplet gradually starts to lose its spherical shape. At , the spread-out droplet resembles a puddle with a flattened top and a rounded edge. Although the droplet height is now lower, , and the dimensionless spreading time has increased, , there is still no noticeable effect of the no-slip condition. Indeed, a quick calculation gives . In contrast to the case, the central part of the droplet still moves down at the moment of maximum spreading. Markedly, near the top surface the downwards flow velocity is even higher than the initial impact velocity. When the simulation is continued, this “jet” further penetrates into the bulk, creating an indentation in the drop’s upper surface before the droplet finally retracts and rebounds. It has been shown that around this indentation almost completely perforates the droplet, giving it the appearance of a doughnut (Renardy et al., 2003). Under these special conditions a fast upwards jet is produced as the thick retracting rim closes in on the central hole and squeezes out the air (Bartolo et al., 2006).
Around yet another mode of deformation starts to set in. Shortly after impact, a rim (now thin compared to ) is squeezed out from the bottom part of the droplet, while the rest of the droplet moves on in an almost undisturbed way. As the droplet sinks into the solid, more and more liquid flows out into this rim, which is at the same time pulled back by surface tension. The liquid in the rim whirls around as it is pushed out through the narrow neck connecting the rim and the central part of the droplet (Clanet et al., 2004). As can be seen in figure 2, this vortical motion is still present at the moment of maximum spreading. In this deformation mode we start to see an influence of the slip condition on the spreading. The thickness of the boundary layer is not negligible compared to the thickness of the neck, . As a consequence the neck is slightly thicker in the no-slip case, and the droplet spreads out somewhat less.
When the Weber number is increased by another order of magnitude, to , the qualitative features of the drop’s deformation discussed for become more pronounced. In this case a thin lamella bordered by a rim spreads out radially from the impact zone (see also figures 4(a) and (b)). The vortical motions in the rim are now absent (see insets figure 2). Again the bulk of the droplet moves on in an undisturbed way initially, but around it gradually starts to slow down (Eggers et al., 2010). At the moment of maximal extension the droplet has attained the shape of a pizza: a thin, almost flat central part, bordered by a thick cylindrical rim. The maximum diameter and the time in which it is reached now strongly depend on the slip length. On the free-slip surface the droplet spreads out roughly twice as far as on the no-slip surface, and it takes about twice as long ( for no-slip and for free-slip). For higher Weber numbers this discrepancy between no-slip and free-slip impacts further increases, but the qualitative mode of deformation remains the same.
To summarize: For an impacting droplet deforms only slightly from spherical. Then between roughly and it undergoes a transition from being puddle-shaped (thick rim compared to ) to being pizza-shaped (thin rim compared to ). In this transitional regime the flow can be very complex and is therefore difficult to characterize in general. For the pizza shape becomes progressively more pronounced and no new transitions (in shape) occur.
From the above considerations the following message can be taken: if some simple, general laws could be found for droplet impact, then one would expect them, at the very least, to be different in the regimes (spherical shape) and (pizza shape). At low Weber numbers, when the deformations are small, simple laws can be derived in a relatively straightforward manner (Richard & Quéré, 2000; Okumura et al., 2003). For , on the other hand, it is not so clear whether this is possible (even in principle), as we will outline in the next section.
4 Energy loss mechanisms
As mentioned in the introduction, the most straightforward approach to estimate is to assume that all of the initial energy is used up by the work done against surface tension, with and the kinetic and surface energy of the droplet before impact. If we exploit the fact that for the droplet spreads out into a thin disk (see section §3), then can be estimated as , where the term proportional to accounts for the work done in expanding the wetted area with a dynamic contact angle 111For simplicity we assume that the contact angle remains constant during the spreading, which, in general, does not have to be the case, but it holds for our simulations. (Šikalo et al., 2005). Equating and leads to
| (1) |
As shown in figure 3, this naive expression correctly captures the large Weber number trend for free-slip impacts. However, the predicted pre-factor is completely off. For and equation (1) predicts a spreading ratio of . This is about higher than the ratio found in our simulations (and in experiments). A first hint as to where this difference comes from was already discussed in the context of figure 2. The fact that some of the initial kinetic energy shows up as vortical motions in the rim, invalidates the assumption underlying equation (1) that all of it is spend on surface energy (Clanet et al., 2004). As vortical motions are absent for , one might expect the above approximation to become better here, at least for the free-slip case, where there is no boundary layer. But as it turns out, it becomes even worse. Equation (1) predicts , while the actual spreading ratio is , a difference of .
Since at high Weber numbers the “left-over” kinetic energy alone cannot account for the observed deviation from equation (1), we must seek for other loss channels. In our simulations the only other possibility is viscous dissipation. Figures 4(a) and (b) show simulation snapshots for (free-slip on the left, no-slip on the right) in which the red shading indicates the local dissipation rate in cylindrical coordinates (, ):
| (2) |
where and are the radial and vertical velocity, respectively.
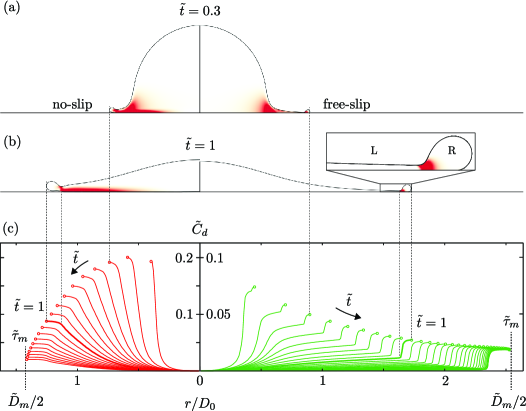
In the no-slip case the term causes a significant amount of viscous dissipation near the solid surface, which somewhat occludes the picture. In the free-slip droplet this boundary layer is absent, and we can now easily identify other regions of high dissipation. A strong peak appears for example where liquid from the lamella enters the rim (see inset figure 4(b)). This is reminiscent of the dissipative behaviour described in the introduction for a retracting rim (the Taylor-Culick problem). However, notice that in the initial stage of the impact (figure 4(a)) there is also a large contribution to the dissipation where liquid from the central part of the droplet flows around the corner into the lamella.
To see how these two different contributions evolve during the spreading, and how much they contribute to the total dissipation rate, , it is convenient to look at cumulative plots of the dissipation rate, integrated along the -axis, i.e.
| (3) |
The lines are shown in figure 4(c) for different times , and for running from the centre of the drop, , to the tip of the rim at . The final value, , of each of these lines then corresponds to .
In the free-slip case two dissipative phases can be distinguished. For dimensionless times most of the dissipation happens where the liquid flows into the lamella, while for the peak near the rim becomes dominant (see figure 4(c), right panel). While the first contribution slowly diminishes in time, the contribution from the peak first increases and then approaches a constant value. For the impact parameters considered here it turns out that both phases contribute about the same amount to the total dissipation: (see also figure 5).
During the no-slip impact the total dissipation rate is initially roughly twice as high as that for the free-slip impact (mind the different scales on the axes). As the droplet spreads out, this high rate then quickly drops to about the same final value as observed for the free-slip case. Dissipation in the shear boundary layer now overwhelms the two contributions described above, although some signs of those can still be seen in the snapshots (figures 4(a) and (b), left panels).
To conclude, during droplet impacts at there can be at least four different loss mechanisms at work: (i) left-over kinetic energy (in the form of vortical motions), (ii) viscous dissipation in the flow from the bulk into the lamella, (iii) viscous dissipation in the flow from the lamella into the rim, and, on a no-slip surface (iv) dissipation in the shear boundary layer. Only their combined effect can explain the overall mismatch between equation (1) and observations (simulations). Coming back to the concluding statement of the previous section, it may seem unlikely, at first sight, that this complex behaviour could give rise to a single simple law.
5 Overall energy budget
Despite the pessimistic forecasts concluding the previous sections, a surprisingly simple picture emerges when we look at the final energy distributions shown in figure 5. For free-slip impacts (figure 5(b)), the part of the initial kinetic energy that finally makes it into surface energy is virtually independent of We and Re. For (at least) two orders of magnitude in Weber number (from 30 to 3000) the change in surface energy amounts to roughly 1/2 of the initial kinetic energy. At , the remaining 1/2 is distributed approximately equally among kinetic energy and viscous dissipation, while at the higher Weber numbers it is mainly dissipated. In other words, it seems that for (and free-slip) the overall energy loss is independent of both the detailed loss mechanism and the overall impact parameters.
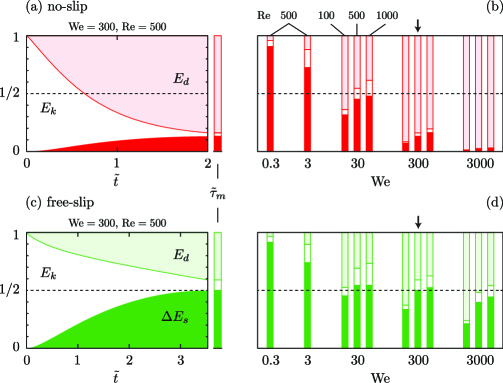
As outlined in the introduction, we believe that this ‘1/2-rule’ is a manifestation of a geometrical head loss, that also occurs, for example, in suddenly expanding pipe flows and for retracting rims. In other words, the amount of dissipation seems to be imposed by the deformation mode of the droplet. Although we did not succeed to find a general proof of this rule for the highly transient flow situation presented by droplet impact (as can be done for steady pipe flow and rim retraction), experiment will be our judge (section §7).
As expected, the 1/2-rule breaks down for no-slip impacts (figure 5(a)), for which dissipation in the boundary layer often also plays an important role (§4), and for , where the mode of deformation drastically changes (§3). In figure 5(b) we can also observe a deviation from the 1/2-rule when the Reynolds number gets too low compared to the Weber number, as is most clearly seen for the free-slip droplet with and . This marks the transition to a regime in which also viscosity greatly influences the deformation of the droplet. In the rim retraction problem this transition sets in for , where Oh is the Ohnesorge number with as relevant length scale the thickness of the liquid film (Sünderhauf et al., 2002; Savva & Bush, 2009). If we tentatively assume that this result extends to the droplet impact case, with as length scale, i.e. , we find that for a deviation from the 1/2-rule can be expected around , consistent with the simulations. For things become simple again as one here approaches the ‘elastic regime’ of small deformations. In this regime practically all of the initial kinetic energy is transformed into surface energy, and back (Richard & Quéré, 2000; Okumura et al., 2003; De Ruiter et al., 2014). Assuming that the droplet deforms into a slightly oblate ellipsoid, one finds (Richard & Quéré, 2000), which is consistent with experiments (Okumura et al., 2003).
The 1/2-rule for droplet impacts with and is the main finding of this work. It can be concisely stated as follows: even if friction at the solid surface is negligible, still about one half of the initial kinetic energy is lost as far as its transformation to surface energy is concerned. On a no-slip surface it acts as a lower bound as .
In the next sections we will use this rule to derive simple analytical expressions for the spreading ratios in both free-slip and no-slip circumstances, and compare these to our simulation results and experiments.
6 Analytical expressions for the spreading ratio in free-slip and no-slip impacts
We will now return to the basic impact problem formulated in the introduction, and assess whether the discovered 1/2-rule can be applied to estimate the maximum spreading ratio . This will allow for a direct comparison to a large set of experimental data.
For free-slip, the 1/2-rule states that the initial surface energy and about half of the initial kinetic energy are transformed into the final surface energy . Equating these energies, , and solving for , leads to:
| (4) |
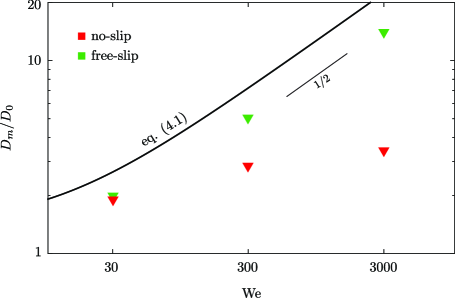
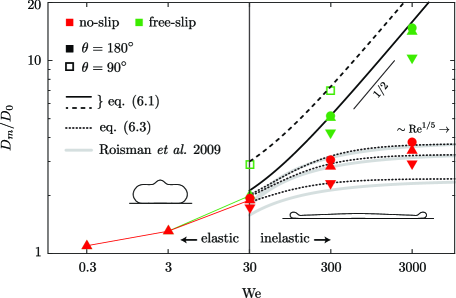
Qualitatively, this expression is similar to equation (1), but it should now also be quantitatively correct, as we have properly accounted for the head loss . In figure 6 we have plotted equation (4) for and , together with the maximum spreading diameters found in our simulations for these contact angles. For the free-slip cases with and we find an excellent agreement. Of course this agreement was to be expected for the simulations, as these gave us the idea for the 1/2-rule in the first place. That it also works for is evidence of its generality. In the next section a direct comparison to experiments, for which the Reynolds number was higher by an order of magnitude, will further strengthen this idea.
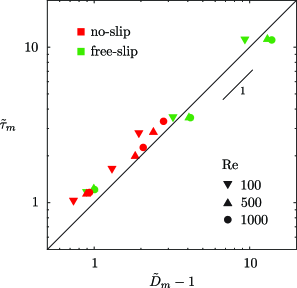
As anticipated, the no-slip simulations show a large deviation from equation (4) at high Weber numbers. Here the spreading is also hindered by dissipation in the shear boundary layer at the solid surface. Integrating equation (2) over both volume and time gives that this contribution scales as . For the thickness of the boundary layer we use, as before, (see e.g. Eggers et al. (2010)). The simplest (general) assumption we can make for the spreading time is that it is proportional to the maximum spreading diameter over the typical flow velocity , i.e. . It turns out that for the relation describes our simulation data quite well over a wide range of impact conditions (see figure 7). Using this in our estimate of we find
| (5) |
where will be a fitting parameter of . In the limit where the retraction by surface tension is negligible () and the spreading is large we will have , so that equation (5) gives . This famous scaling law for the viscosity dominated regime, was previously derived from slightly different (but consistent) starting points (Clanet et al., 2004; Roisman, 2009; Eggers et al., 2010). The advantage of the derivation given here is that the underlying assumptions, and thereby equation (5), are still valid for finite Weber numbers, when the spreading is also hindered by the simultaneous retraction of the rim. If we assume, as a first approximation, that the dissipation in the boundary layer and the head loss can simply be added to find the total dissipation , then the energy balance in terms of becomes:
| (6) |
One can easily check that this expression reduces to equation (4) in the limit . Although equation (6) does not allow for an explicit analytical solution for it can be easily solved numerically. As shown in figure 6, with it predicts the spreading ratios found in the no-slip simulations reasonably well. In section §7 and appendix A it is shown that the same value of also works well for previous experimental data, covering a wide range of impact conditions. The observed deviations can be partly understood from a careful inspection of equation (2) for the local dissipation rate. In places where the boundary layer and expansion flows overlap, cross-terms proportional to give additional contributions to the dissipation in the boundary layer. Also the strong assumption that the hindrance of the flow in the boundary layer does not affect the head loss, is probably not precisely true. In hindsight it is thus quite surprising that equation (6) works so well. Interestingly, for (, ) equation (6) severely underestimates the spreading. As it turns out (see figure 8(a)), the combination of this low Reynolds number with a high Weber number, makes that a thin sheet is ejected from the edge of the droplet during impact. This sheet is lifted from the surface, so that the no-slip condition has no effect on this part of the droplet, leading to the larger than expected spreading in this special case.
In the derivation of equation (6) we took the free-slip scenario as our basis and then corrected it for the dissipation in the shear boundary layer on no-slip surfaces. One can also approach this problem from the opposite side, and instead correct the large Weber number no-slip limit, , for the simultaneous retraction of the rim (Roisman et al., 2009). Assuming that the rim retracts over a typical distance , where is the Taylor-Culick retraction velocity on a stationairy sheet, and using that in the shear dominated limit one has and (see below) one arrives at the expression , where and are adjustable parameters (Roisman et al., 2009). We found that and best describe our results (Roisman et al. (2009) originally proposed and ). As shown in figure 6, this expression captures our simulation data quite well. Likewise, it describes the recent results by Laan et al. (2014) as discussed in appendix A. However, we note that this expression does not approach the correct limit if the Reynolds number is send to infinity for a fixed Weber number, i.e. if the thickness of the boundary layer is small compared to the final thickness of the droplet. In this case it is more appropriate to use equation (6), which (by design) does handle this limit correctly (see also appendix A).
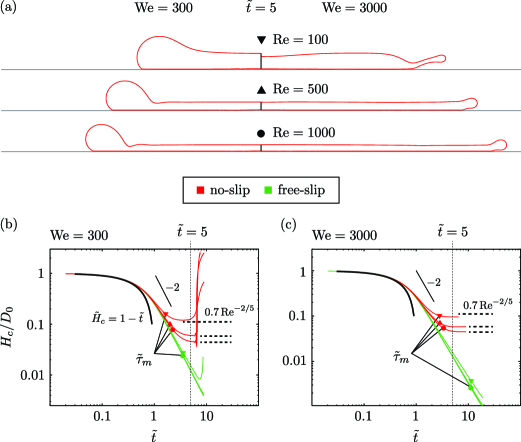
Although the maximum spreading ratio of no-slip droplets depends on both We and Re, this is not the case for the minimum droplet thickness reached during the impact. As can been seen in figure 8(b), where we have plotted the time evolution of the central height , this minimum thickness is reached later than the maximum spreading and is well described by for both and (i.e. independent of We). As argued in Roisman et al. (2009); Eggers et al. (2010) the scaling can be understood as a collision of the upper part of the drop surface, which according to potential flow theory decreases in time as , and the boundary layer, which grows as . In the absence of a thick rim (i.e. ) the final droplet shape will approximate that of a disk. Using mass conservation, , one recovers the upper bound for no-slip impacts. For free-slip impacts, on the other hand, the central height of the droplet does not reach a minimum value and keeps on decreasing as until rebound. These findings are in good agreement with recent experiments (Lagubeau et al., 2012; Lastakowski et al., 2014).
7 Comparison to experiments
Our simulations were done for a limited set of Reynolds numbers between 100 and 1000, but we hypothesised that the 1/2-rule and the equations derived from it, (4) and (6), should hold quite generally. In figure 9 we compare these models with available experimental data on (a) free-slip and (b) no-slip impacts.
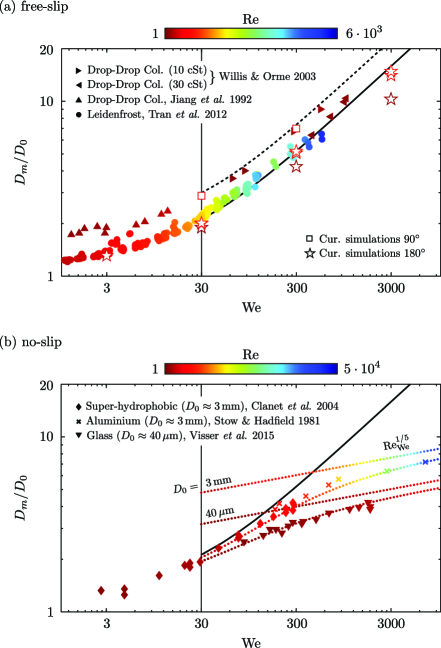
Following Lastakowski et al. (2014) we expect the free-slip condition to hold for impacts of Leidenfrost droplets (Tran et al., 2012), which hover on a vapour film, and for symmetric droplet-droplet collisions (Jiang et al., 1992; Willis & Orme, 2003), where the mirror symmetry is equivalent to a free-slip condition and a contact angle of (Roisman et al., 2009). Figure 9(a) shows that there is a good agreement between the free-slip data and equation (4), especially if one takes into account that the Reynolds number reached in the experiments is one order of magnitude higher than that in our simulations. This provides strong evidence that the 1/2-rule is indeed independent of Re. Notice that the droplet collision data for the highest viscosity (30 cSt) lay somewhat below the line, and come closer to the prediction for . This could either be a manifestation of the Reynolds number dependence we observed also in our simulations at low Reynolds numbers, or an indication that the droplets did not coalesce. However, the latter possibility is very unlikely, as these experiments were performed under vacuum conditions.
The no-slip condition generally holds for impacts on dry surfaces at room temperature, for which experimental spreading ratios obtained for water droplets (Stow & Hadfield, 1981; Clanet et al., 2004; Visser et al., 2015) are shown in figure 9(b). The data points overlap with free-slip experiments at low Weber numbers, but start to deviate at larger Weber numbers. Here we expect them to bend towards the limit , as was the case in our simulations. However, whereas in the simulations we kept Re fixed as We was varied, in experiments it is usually the impact velocity that is varied, while the droplet diameter and liquid properties are kept fixed. For the free-slip prediction this is of no consequence, as it only depends on We, but for experiments on no-slip surfaces it means that the spreading limit effectively keeps shifting up as We is increased. For a given droplet diameter and liquid, we can predict this shift by expressing the Reynolds number in terms of We, as follows: , so that one expects the droplet diameters to stay below . In figure 9(b) we have plotted this relation for water droplets of mm and m, corresponding to the liquid and diameters used in the experiments (straight dotted lines). The bended dotted lines represent equation (6) with and as before. For both diameters this model fits the data well within experimental error. The match even seems to be somewhat better than for our simulations. This may indicate that the assumption that the dissipation in the boundary layer and the head loss can be added independently, is satisfied more closely for these experimental parameters. The use of a constant dynamic contact angle of 180∘ in the model is justified by the fact that for high Weber number impacts, wettability effects play only a minor role compared to inertia and viscous shear (Rioboo et al., 2002). Furthermore, in experiments it is seen that the dynamic contact angle of an impacting drop is generally closer to than to their static value (Šikalo et al., 2005).
8 Conclusion & outlook
Inelastic droplet impact () seems to fall into a special class of fluid problems in which the total energy loss associated with surface deformations does not explicitly depend on the properties of the liquid, nor on the detailed loss mechanism(s). This universal head loss is significant, as it always amounts to about 1/2 of the initial kinetic energy, even when all other sources of dissipation are negligible.
When this 1/2-rule is incorporated in a simple energy balance one obtains an accurate analytical expression for the spreading ratio on free-slip surfaces (equation (4)). For impacts on no-slip surfaces this result must be corrected for dissipation in the shear boundary layer. The resulting expression (equation (6)) is in reasonable agreement with both simulations and experiments and is consistent with previous modelling approaches. The advantage of an energy balance approach is that it can generally be easily adapted to new scenarios. One can, for example, include a finite slip length into the model by simply replacing the estimate by in the derivation of equation (6), or even incorporate non-Newtonian effects (Boyer et al., 2016).
The 1/2-rule breaks down for where a different mode of deformations sets in as one approaches the elastic regime observed for . Coincidentally the behaviour for in the elastic regime, (Richard & Quéré, 2000; Okumura et al., 2003), is almost the same as that for for free-slip impacts at high Weber numbers (for ), . A plot of versus We on a logarithmic scale will therefore give the impression of a uniform scaling for over the whole range from elastic to inelastic impacts. However, this does not have any physical significance, as the origin of the numerical pre-factors is very different in both cases.
Also when the Reynolds number is small compared to the Weber number, deviations from the 1/2-rule can be observed. Based on the analogy to the Taylor-Culick problem we speculated that this transition sets in for . This is consistent with our current simulations, but a more systematic study around this transition would have to be performed to put this idea on more firm grounds.
We hope that this study provides a useful new view on the old problem of droplet impact. On the other hand, the universal head loss discovered for this complex transient flow problem raises the interesting question as to its general applicability to free-surface flows involving large deformations. It will be interesting to study the involved boundary layer dynamics and the coupling between flow and free-surface surface deformation on a more fundamental level in simpler flow geometries. With the current advent of reliable and flexible numerical fluid solvers like Gerris, such a systematic approach is well within reach.
Acknowledgements.
We thank Rodolfo Ostilla Mónico, Rianne de Jong, Marie-Jean Thoraval and Minori Shirota for a careful reading of the first manuscript and fruitful discussions. This project received funding from an ERC Advanced Grant and from the NWO Spinoza programme.Appendix A Comparison of no-slip droplet impact models to experiments Laan et al. (2014)
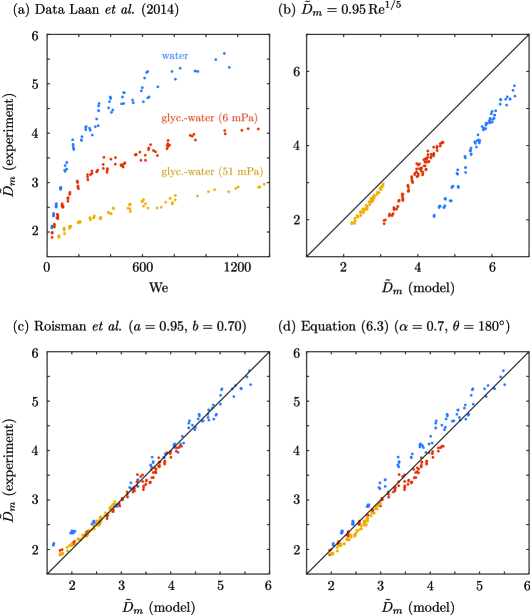
In the main text (§6) we discussed two complementary approaches to model the impact of a droplet onto a no-slip surface. One approach is to take the free-slip case as a basis and correct it for dissipation in the shear boundary layer (equation (6)). The other approach is to start from the limit in which the thickness of the spreading lamella is set by the boundary layer, so that , and then subtract a correction, , for the simultaneous retraction of the rim on this film (Roisman et al., 2009). We found that both approaches capture our no-slip simulation data reasonably well. Here we further test the models and the parameters proposed for them ( and , respectively) by a direct comparison to an extensive set of experimental data kindly provided to us by Laan et al. (2014).
As shown in figure 10, overall both models agree well with the experimental data. As can be expected the model by Roisman et al. (2009) (figure 10c) is somewhat more accurate for the larger spreading ratios, where the shear boundary layer dominates the dynamics, but it shows an underestimation (especially for the low viscosity water) for . Here the boundary layer (with thickness ) does not occupy the whole thickness of the spreading lamella. As a consequence the retraction velocity (based on in this model) is overestimated (and the spreading is thus underestimated). Equation (6) on the other hand does not assume that the lamella thickness is set by the boundary layer and it therefore does not have this problem (figure 10d). However, for this model the match is somewhat less good at larger spreading ratios.
References
- Antonini et al. (2012) Antonini, C., Amirfazli, A. & Marengo, M. 2012 Drop impact and wettability: From hydrophilic to superhydrophobic surfaces. Phys. Fluids 24, 102104.
- Attané et al. (2007) Attané, P., Girard, F. & Morin, V. 2007 An energy balance approach of the dynamics of drop impact on a solid surface. Phys. Fluids 19 (May), 012101.
- Aziz & Chandra (2000) Aziz, S. D. & Chandra, S. 2000 Impact, recoil and splashing of molten metal droplets. Int. J. Heat Mass Transf. 43 (16), 2841–2857.
- Bartolo et al. (2006) Bartolo, D., Josserand, C. & Bonn, D. 2006 Singular jets and bubbles in drop impact. Phys. Rev. Lett. 96, 124501.
- Batchelor (1967) Batchelor, G. K. 1967 An introduction to fluid dynamics. Cambridge Univ. Press.
- Blossey (2003) Blossey, R. 2003 Self-cleaning surfaces virtual realities. Nat. Mater. 2, 301–306.
- Boyer et al. (2016) Boyer, F., Sandoval-Nava, E., Snoeijer, J. H., Dijksman, J. F. & Lohse, D. 2016 Drop impact of shear thickening liquids. Phys. Rev. Fluids 1, 013901.
- Chandra & Avedisian (1991) Chandra, S. & Avedisian, C. T. 1991 On the Collision of a Droplet with a Solid Surface. Proc. R. Soc. A Math. Phys. Eng. Sci. 432 (1884), 13–41.
- Clanet et al. (2004) Clanet, C., Béguin, C., Richard, D. & Quéré, D. 2004 Maximal deformation of an impacting drop. J. Fluid Mech. 517, 199–208.
- Culick (1960) Culick, F. E. C. 1960 Comments on a Ruptured Soap Film. J. Appl. Phys. 31 (6), 1128.
- De Ruiter et al. (2014) De Ruiter, J., Lagraauw, R., Van den Ende, D. & Mugele, F. 2014 Wettability-independent bouncing on flat surfaces mediated by thin air films. Nat. Phys. 11 (1), 48–53.
- Eggers et al. (2010) Eggers, J., Fontelos, M. A., Josserand, C. & Zaleski, S. 2010 Drop dynamics after impact on a solid wall: Theory and simulations. Phys. Fluids 22 (6), 062101.
- Jiang et al. (1992) Jiang, Y. J., Umemura, A. & Law, C. K. 1992 An experimental investigation on the collision behaviour of hydrocarbon droplets. J. Fluid Mech. 234, 171–190.
- Josserand & Thoroddsen (2016) Josserand, C. & Thoroddsen, S. T. 2016 Drop impact on solid surface. Annu. Rev. Fluid Mech. 48 (1), 365–391.
- Kim (2007) Kim, J. 2007 Spray cooling heat transfer: The state of the art. Int. J. Heat Fluid Flow 28, 753–767.
- Laan et al. (2014) Laan, N., De Bruin, K. G., Bartolo, D., Josserand, C. & Bonn, D. 2014 Maximum Diameter of Impacting Liquid Droplets. Phys. Rev. Appl. 2 (4), 044018.
- Lagubeau et al. (2012) Lagubeau, G., Fontelos, M. A., Josserand, C., Maurel, A., Pagneux, V. & Petitjeans, P. 2012 Spreading dynamics of drop impacts. J. Fluid Mech. 713, 50–60.
- Lastakowski et al. (2014) Lastakowski, H., Boyer, F., Biance, A.-L., Pirat, C. & Ybert, C. 2014 Bridging local to global dynamics of drop impact onto solid substrates. J. Fluid Mech. 747, 103–118.
- Lee et al. (2016) Lee, J. B., Derome, D., Guyer, R. & J., Carmeliet 2016 Modelling the maximum spreading of liquid droplets impacting wetting and non-wetting surfaces. Langmuir 0 (ja).
- Marengo et al. (2011) Marengo, M., Antonini, C., Roisman, I. V. & Tropea, C. 2011 Drop collisions with simple and complex surfaces. Curr. Opin. Colloid Interface Sci. 16 (4), 292–302.
- Mishchenko et al. (2010) Mishchenko, L., Hatton, B., Bahadur, V., Taylor, J. A., Krupenkin, T. & Aizenberg, J. 2010 Design of Ice-free Nanostructured Impacting Water Droplets. ACS Nano 4 (12), 7699–7707.
- Okumura et al. (2003) Okumura, K., Chevy, F., Richard, D., Quéré, D. & Clanet, C. 2003 Water spring: A model for bouncing drops. Europhys. Lett. 62 (2), 237.
- Pasandideh-Fard et al. (1996) Pasandideh-Fard, M., Qiao, Y. M., Chandra, S. & Mostaghimi, J. 1996 Capillary effects during droplet impact on a solid surface. Phys. Fluids 8 (3), 650.
- Popinet (2003) Popinet, S. 2003 Gerris: A tree-based adaptive solver for the incompressible Euler equations in complex geometries. J. Comput. Phys. 190 (July 2003), 572–600.
- Popinet (2009) Popinet, S. 2009 An accurate adaptive solver for surface-tension-driven interfacial flows. J. Comput. Phys. 228 (16), 5838–5866.
- Quéré (2013) Quéré, D. 2013 Leidenfrost Dynamics. Annu. Rev. Fluid Mech. 45, 197–215.
- Rein (1993) Rein, M. 1993 Phenomena of liquid drop impact on solid and liquid surfaces. Fluid Dyn. Res. 12 (2), 61–93.
- Renardy et al. (2003) Renardy, Y., Popinet, S., Duchemin, L., Renardy, M., Zaleski, S., Josserand, C., Drumright-Clarke, M. A., Richard, D., Clanet, C. & Quéré, D. 2003 Pyramidal and toroidal water drops after impact on a solid surface. J. Fluid Mech. 484, 69–83.
- Richard & Quéré (2000) Richard, D. & Quéré, D. 2000 Bouncing water drops. Europhys. Lett. 50 (6), 769–775.
- Rioboo et al. (2002) Rioboo, R., Marengo, M. & Tropea, C. 2002 Time evolution of liquid drop impact onto solid, dry surfaces. Exp. Fluids 33 (1), 112–124.
- Roisman (2009) Roisman, I. V. 2009 Inertia dominated drop collisions. II. An analytical solution of the Navier-Stokes equations for a spreading viscous film. Phys. Fluids 21 (5), 052104.
- Roisman et al. (2009) Roisman, I. V., Berberovi, E. & Tropea, C. 2009 Inertia dominated drop collisions. I. On the universal flow in the lamella. Phys. Fluids 21 (5), 052103.
- Roisman et al. (2012) Roisman, I. V., Planchette, C., Lorenceau, E. & Brenn, G. 2012 Binary collisions of drops of immiscible liquids. J. Fluid Mech. 690, 512–535.
- Savva & Bush (2009) Savva, N. & Bush, J. W. M. 2009 Viscous sheet retraction. J. Fluid Mech. 626 (2009), 211.
- Stow & Hadfield (1981) Stow, C. D. & Hadfield, M. G. 1981 An Experimental Investigation of Fluid Flow Resulting from the Impact of a Water Drop with an Unyielding Dry Surface. Proc. R. Soc. A Math. Phys. Eng. Sci. 373 (1755), 419–441.
- Sünderhauf et al. (2002) Sünderhauf, G., Raszillier, H. & Durst, F. 2002 The retraction of the edge of a planar liquid sheet. Phys. Fluids 14 (1), 198.
- Taylor (1959) Taylor, G. 1959 The Dynamics of Thin Sheets of Fluid. III. Disintegration of Fluid Sheets. Proc. R. Soc. A Math. Phys. Eng. Sci. 253 (1274), 313–321.
- Thoraval et al. (2012) Thoraval, M.-J., Takehara, K., Etoh, T. G., Popinet, S., Ray, P., Josserand, C., Zaleski, S. & Thoroddsen, S. T. 2012 von Kármán Vortex Street within an Impacting Drop. Phys. Rev. Lett. 108 (26), 264506.
- Thoraval et al. (2013) Thoraval, M.-J., Takehara, K., Etoh, T. G. & Thoroddsen, S. T. 2013 Drop impact entrapment of bubble rings. J. Fluid Mech. 724, 234–258.
- Thoroddsen et al. (2008) Thoroddsen, S. T., Etoh, T. G. & Takehara, K. 2008 High-Speed Imaging of Drops and Bubbles. Annu. Rev. Fluid Mech. 40, 257–285.
- Thoroddsen et al. (2005) Thoroddsen, S. T., Etoh, T. G., Takehara, K., Ootsuka, N. & Hatsuki, Y. 2005 The air bubble entrapped under a drop impacting on a solid surface. J. Fluid Mech. 545, 203.
- Tran et al. (2012) Tran, T., Staat, H. J. J., Prosperetti, A., Sun, C. & Lohse, D. 2012 Drop Impact on Superheated Surfaces. Phys. Rev. Lett. 108 (3), 036101.
- Ukiwe & Kwok (2005) Ukiwe, C. & Kwok, D. Y. 2005 On the maximum spreading diameter of impacting droplets on well-prepared solid surfaces. Langmuir 21 (31), 666–673.
- Van Dam & Le Clerc (2004) Van Dam, D. B. & Le Clerc, C. 2004 Experimental study of the impact of an ink-jet printed droplet on a solid substrate. Phys. Fluids 16 (9), 3403–3414.
- Villermaux & Bossa (2011) Villermaux, E. & Bossa, B. 2011 Drop fragmentation on impact. J. Fluid Mech. 668, 412–435.
- Visser et al. (2015) Visser, C., Frommhold, P. E., Wildeman, S., Mettin, R., Lohse, D. & Sun, C. 2015 Dynamics of high-speed micro-drop impact: numerical simulations and experiments at frame-to-frame times below 100 ns. Soft Matter 11, 1708–1722.
- Šikalo et al. (2005) Šikalo, Š., Wilhelm, H.-D., Roisman, I. V., Jakirlić, S. & Tropea, C. 2005 Dynamic contact angle of spreading droplets: Experiments and simulations. Phys. Fluids 17 (2005), 062103.
- Willis & Orme (2003) Willis, K. & Orme, M. 2003 Binary droplet collisions in a vacuum environment: an experimental investigation of the role of viscosity. Exp. Fluids 34 (1), 28–41.
- Yarin (2006) Yarin, A. L. 2006 Drop Impact Dynamics: Splashing, Spreading, Receding, Bouncing…. Annu. Rev. Fluid Mech. 38, 159–192.