The Science Case for ALMA Band 2 and Band 2+3
Abstract
We discuss the science drivers for ALMA Band 2 which spans the frequency range from 67 to 90 GHz. The key science in this frequency range are the study of the deuterated molecules in cold, dense, quiescent gas and the study of redshifted emission from galaxies in CO and other species. However, Band 2 has a range of other applications which are also presented. The science enabled by a single receiver system which would combine ALMA Bands 2 and 3 covering the frequency range 67 to 116 GHz, as well as the possible doubling of the IF bandwidth of ALMA to 16 GHz, are also considered.
1 Introduction
ALMA Band 2 spans from GHz (bounded by an opaque line complex of ozone lines) up to 90 GHz which overlaps with the lower frequency end of ALMA Band 3. Band 2 is the only remaining frequency band on ALMA for which receivers have not yet been designed and developed. Below we lay out the compelling and varied science which ALMA Band 2 enables.
Receiver technology has advanced since the original definition of the ALMA frequency bands. It is now feasible to produce a single receiver which could cover the whole frequency range from 67 GHz to 116 GHz, encompassing Band 2 and Band 3 in a single receiver cartridge, a so called Band 2+3 system. In addition, there are now foreseen upgrades to ALMA system which could double it backend bandwidth to 16 GHz. The science drivers discussed below therefore also discuss the advantages of these two enhancements over the originally foreseen Band 2 system.
Level 1 Science Projects
There are two top level science drivers for ALMA Band 2. The first is the study of gas in external galaxies where Band 2 makes it possible to study redshifted CO for both redshift determination and to accurately measure the cool molecular gas mass. Band 2 will also allow the study of the properties and evolution of the dense gas (via the dense gas tracers HCN, HNC and HCO+) in the crucial redshift range where the cosmic star-formation density is rapidly declining. The second top level driver is the study of lowest energy transitions of the simple deuterated molecules which trace the coldest, densest and more quiescent molecular gas in a range of environments.
2 Extragalactic Science
2.1 Redshift searches
Redshifts are essential for understanding the distribution and evolution of galaxies through cosmic time. ALMA’s power as a redshift engine has already been demonstrated with its serendipitous measurements of redshifts (=4.4) in just 2 minutes of observing time (Swinbank et al. 2012). Using molecular and atomic lines such as CO, [CI], [CII] and H2O, ALMA is already breaking the decades-long monopoly of optical telescopes for redshift determinations. With full frequency scans to identify lines in mm spectra becoming the favoured option for redshift determinations (Weiß et al. 2009), the detection of two transitions of CO provides an unambiguous redshift.
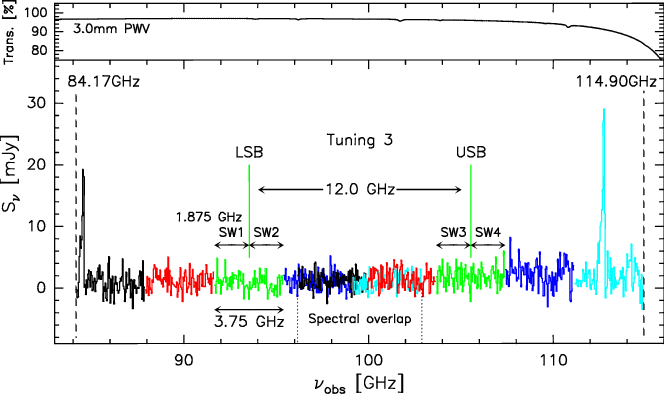
With the most consistent, and low, atmospheric transparency (Fig. 1, left), ALMA Band 3, which covers the lowest excitation CO lines is currently the favoured band for redshift determinations. However, Band 3 does not contain any lines in the “redshift desert” ranges 0.370.99 and 1.742.00. In addition, only at 3 does Band 3 include two CO lines needed to derive an unambiguous redshift. Confirmation of lower redshifts therefore requires an additional follow-up observation of a higher frequency line in another ALMA band.
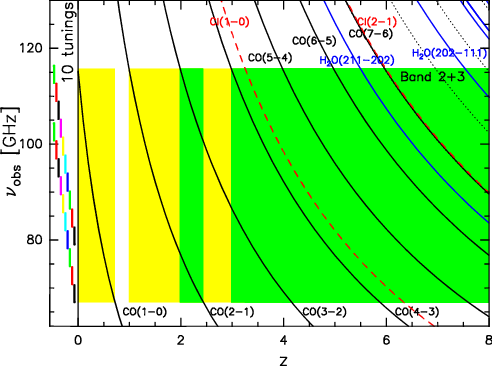
The extension of the low-frequency edge of Band 3 to 67 GHz with a new Band 2+3 receiver would solve most of the limitations of the current Band 3 for redshift searches. As shown in Fig. 1, only a small redshift desert at 0.720.99 would remain which would require searches at Band 4 or 5. The main gains of a Band 2+3 system are that it will allow the detection of at least 1 line for the entire 1 range, and unambiguous redshifts for 2, with the exception of 2.53.0. This is well matched to the redshift distribution of dusty galaxies, which increases steeply up to 2.5 (e.g. Chapman et al. 2005; Weiß et al. 2013). The success rate of a Band 2+3 redshift survey will thus approach 100%, a major revolution compared to current optical redshift surveys which have a 50% spectroscopic completeness rate, and to Band 3 only surveys, where the completion rate is of order of 70% (Weiß et al. 2013).
The width of the spectral bands is an additional important consideration for redshift searches, where contiguous spectral coverage is essential. As shown in Fig. 1, left), the effective 1.875 GHz bandwidth of the current basebands requires more than two tunings to fill the 8.0 GHz gap between the LSB and USB, creating an overlap region in the middle of the contiguous spectral coverage, but lower coverage at the outer edges where unfortunately the atmospheric transmission is worst. If the two basebands could cover at least the full 4.0 GHz within the sidebands, or cover a contiguous 16.0 GHz without a gap, this would make both redshift searches (and spectral surveys in general) more efficient: with the current 23.75 GHz coverage, 10 tunings are required ( Fig. 1, right); with a 24.0 GHz coverage, this can be reduced to 6 tunings; with a contiguous 16 GHz coverage per tuning, the entire Band 2+3 (except 1.0 GHz at the edges) can be covered with only 3 tunings. This would increase to 4 tunings for a two sideband configuration (similar to the current Band 3 system) with 8 GHz in each sideband. It is important to note that this high gain in efficiency can only be obtained with a combined Band 2+3 receiver and not with separate Band 2 and Band 3 receivers.
2.2 Running out of gas in the third quarter
The epoch of galaxy formation is most commonly traced by the cosmic star-formation rate density of the Universe (SFRD). The SFRD peaks at , during a period usually associated with the main epoch of galaxy assembly. In this epoch, roughly half of the stars present in galaxies today are formed (e.g. Reddy et al. 2008; Shapley 2011). The SFRD then declines dramatically toward lower redshift, by roughly an order of magnitude, from to , with the most significant decrease at .
One of the most important diagnostics of the epoch of galaxy assembly and the successive decline of the SFRD are observations of cool gas. Theory predicts and observations confirm that the molecular gas fraction increases with lookback time, by as much as a factor of 7 from to (e.g. Tacconi et al. 2008; Genzel et al. 2010; Narayanan et al. 2012; Tacconi et al. 2013). At , molecular gas can contribute as much as 6070% to the total baryonic inventory. Such a high gas content and the decline in gas mass fraction toward lower redshifts is undoubtedly associated with the peak of the SFRD, and its decrease toward the present day. The epoch from is thus crucial to understand how and why galaxies “ran out of fuel” for star formation “in the third quarter” of the age of the Universe.
Recent years have seen the number of high- galaxies with molecular gas-mass estimates increase exponentially. However, uncertainties in two critical factors still hamper the interpretation of observations: one is the large uncertainty in , the factor that converts observed CO column densities to H2 masses. for high-SFR galaxies such as luminous infrared galaxies (LIRGs), ultra-LIRGs (ULIRGs), and sub-millimeter galaxies (SMGs), typically forming stars in compact dense regions, has been found to be 5 times lower than for “Milky-Way-like” galaxies, similar in mass but with star formation in more extended disks. This results in a bimodality of gas scaling relations such as the Schmidt-Kennicutt law which relates SFR and gas surface density (e.g. Daddi et al. 2008, 2010b; Tacconi et al. 2010, 2013). is also a strong function of metallicity (e.g. Maloney & Black 1988; Glover & Mac Low 2011; Genzel et al. 2012; Bolatto et al. 2013). Ultimately, assumptions are made based on observations in a single CO transition, and the more varied galaxy populations and different physical conditions at high redshift make uncertain.
The other uncertainty is linked with the necessity, up to now, of observing high-redshift galaxies in high-J CO transitions. Most of the observations of gas in high- galaxies have been carried out in CO(3-2) or higher-J lines (e.g. Daddi et al. 2008, 2010b; Genzel et al. 2010; Tacconi et al. 2013). However, the estimate of gas masses is ultimately based on the CO(1-0) transition, so that ratios of the higher-J lines relative to 10 must be assumed. As illustrated in the right panel of Fig. 2, these ratios are critically related to excitation conditions, which are known to vary between low- vs. high-SFR galaxies, and compact vs. extended star-forming regions (e.g. Weiß et al. 2005; Danielson et al. 2011). Observing only high-J lines skews mass estimates toward the warm, dense gas traced by these transitions, and can cause molecular gas masses to be severely underestimated (e.g. Dannerbauer et al. 2009; Aravena et al. 2010; Ivison et al. 2011).
2.2.1 Band 2 and cool gas mass
Band 2 can mitigate, if not completely resolve, these uncertainties while also constraining the unknown physical conditions in these high-z galaxies. CO(1-0) is unobservable at with only Band 3, and CO(2-1) is recovered by Band 3 only at 1.0. However, Band 2 enables CO(1-0) measurements over this crucial range in redshift, from to where SFRD falls dramatically and the Universe is about 3/4 of its present age ( corresponds to lookback times from 3.4 Gyr to 7.7 Gyr). Figure 2 (left panel) illustrates the CO ladder and the band coverage as a function of redshift. From to , Band 2 combined with the other ALMA bands enables observations of between seven and nine transitions, including the four with lowest J; Band 2 covers 10, thus making possible a complete assessment of excitation conditions and the CO spectral line energy distribution (SLED).
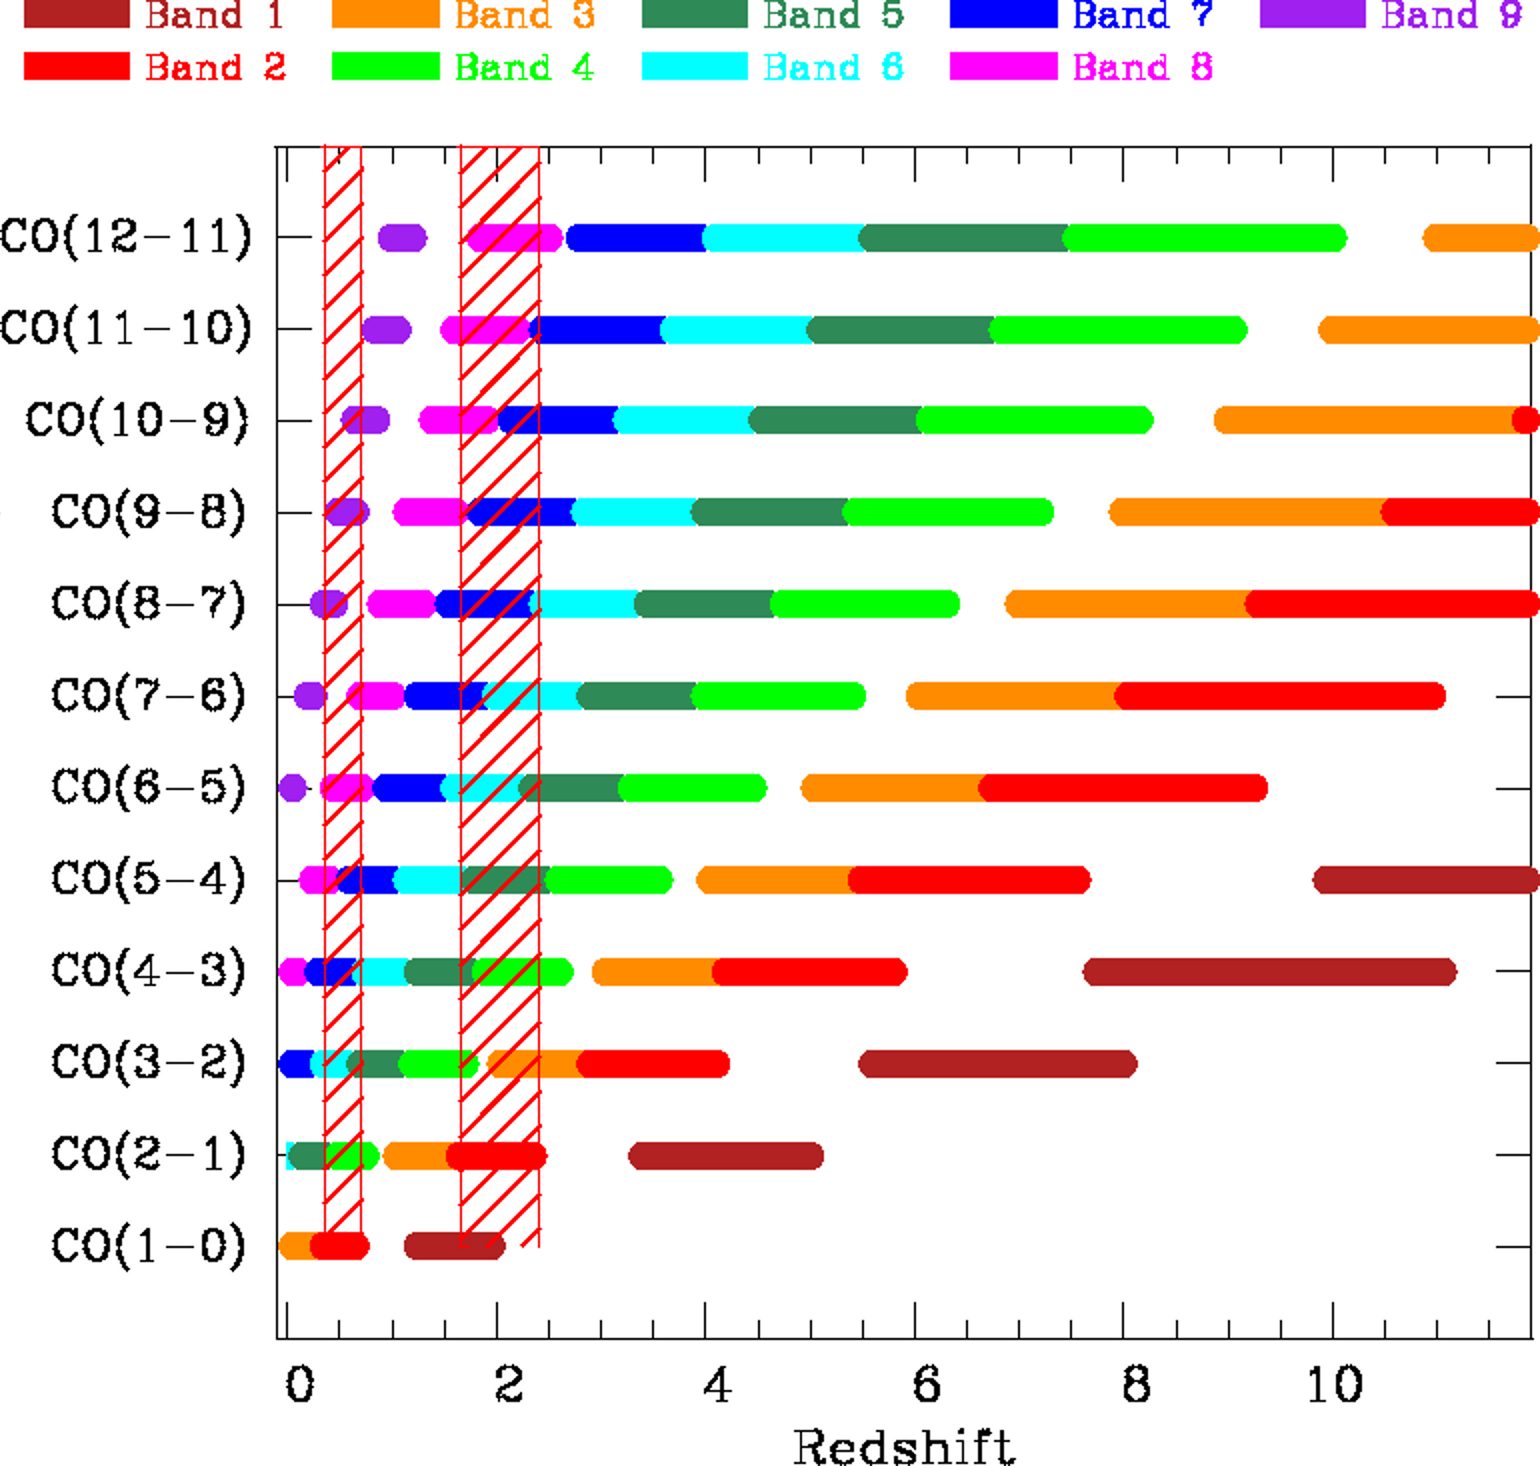
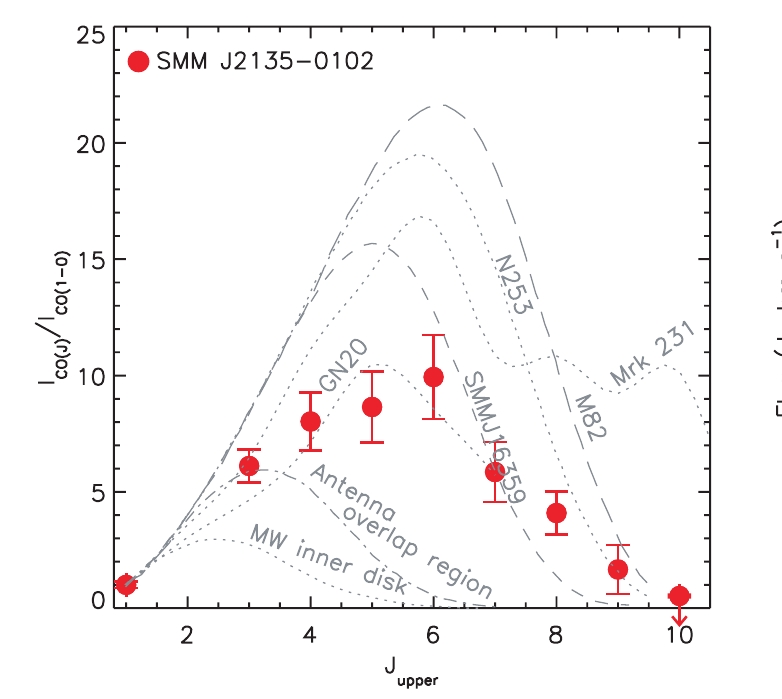
No CO lines can be observed in Band 1 until , where the 1-0 transition enters the band; Band 2 recovers CO(2-1) at which remains observable with Band 2 until . Thus, in the redshift range where the SFRD is peaking, from to , Band 2, together with the other ALMA bands, provides coverage of between eight and eleven CO transitions; Bands 2+1 measure the two lowest-J transitions, indispensable for accurate gas mass estimates. As shown in Fig. 2 (right panel), such band coverage is fundamental because of the shape of the CO cooling curve, which peaks around 65 in the case of starbursts, or toward lower J in the case of more quiescent disks. The factor to scale the higher-J lines to 10 depends on excitation, and is virtually impossible to estimate without multiple transitions. Without the two lowest CO transitions, the mass in molecular gas can be underestimated by more than a factor of 2, depending on the excitation of the gas (Dannerbauer et al. 2009).
Expanding the frequency coverage of ALMA by installing Band 2 will allow the almost complete exploration of the cool gas content in galaxies in this “third quarter" of the age of the Universe. There would remain only a gap of 0.7 Gyr in the evolution of the Universe (between and , where CO(2-1) shifts out of Band 4 and into Band 3; CO(1-0) is recovered by Band 1 at ). These low-J transitions are necessary to accurately estimate the cool molecular gas mass, as well as image its distribution and kinematics. This epoch in redshift is crucial for observationally constraining the physical mechanisms which quench star formation and cause galaxies to transform from blue star-forming systems to “red and dead” ones.
2.2.2 Band 2 sensitivity and resolution
The Band 2 specifications (12 Jy km s-1 in 60 s integration time with 50 12m antennas) make ALMA an extremely sensitive facility for measuring cool molecular gas mass at high redshift. For a gas mass of at (assuming a Galactic conversion factor), we expect a CO(1-0) flux FCO of 0.004 Jy km s-1 per channel, assuming 10 km s-1 channels and a velocity width 100 km s-1. We would obtain a 5 detection in about 25 minutes. For of gas (at as before), we would expect a smaller velocity width, say 80 km s-1; with 20 km s-1 channels, we would be able to achieve a 5 detection in 2.5 hr. This means that at these redshifts, in reasonable times, ALMA is able to image and study the kinematics of the cool gas masses associated with galaxies 108-9.6 . It is the galaxies in this range of masses which are evolving the most at these redshifts (in the “last quarter” of the age of the Universe), and constitute an important constraint for galaxy evolution schemes (e.g. Bundy et al. 2006; Weinmann et al. 2012).
At higher redshifts, Band 2 probes CO(2-1) from to ; at the same redshifts, CO(1-0) is observable with Band 1. At , of gas, spread over ten 20 km s-1 channels, would give FCO0.0017 Jy km s-1 per channel (again assuming a Galactic conversion factor). A 5 detection could be achieved in 2.1 hr. This redshift range is where the cosmic SFRD peaks, and is where the gas-mass fractions are among the highest yet explored with current facilities. By enabling more accurate gas mass estimates with low-J lines as well as probing the dynamics of this cool gas, ALMA Band 2 would open up a new era in the study of galaxy evolution.
In an extended configuration, at , ALMA would resolve structures on scales of 400 pc. At , the situation is not significantly worse, since this same configuration with 006 resolution would probe structures on scales of 500 pc. Such scales are where gas scaling relations start to break down (e.g. Verley et al. 2010), and are thus a suitable resolution for our science goals.
2.3 Dense star-forming gas and molecular outflows in nearby galaxies
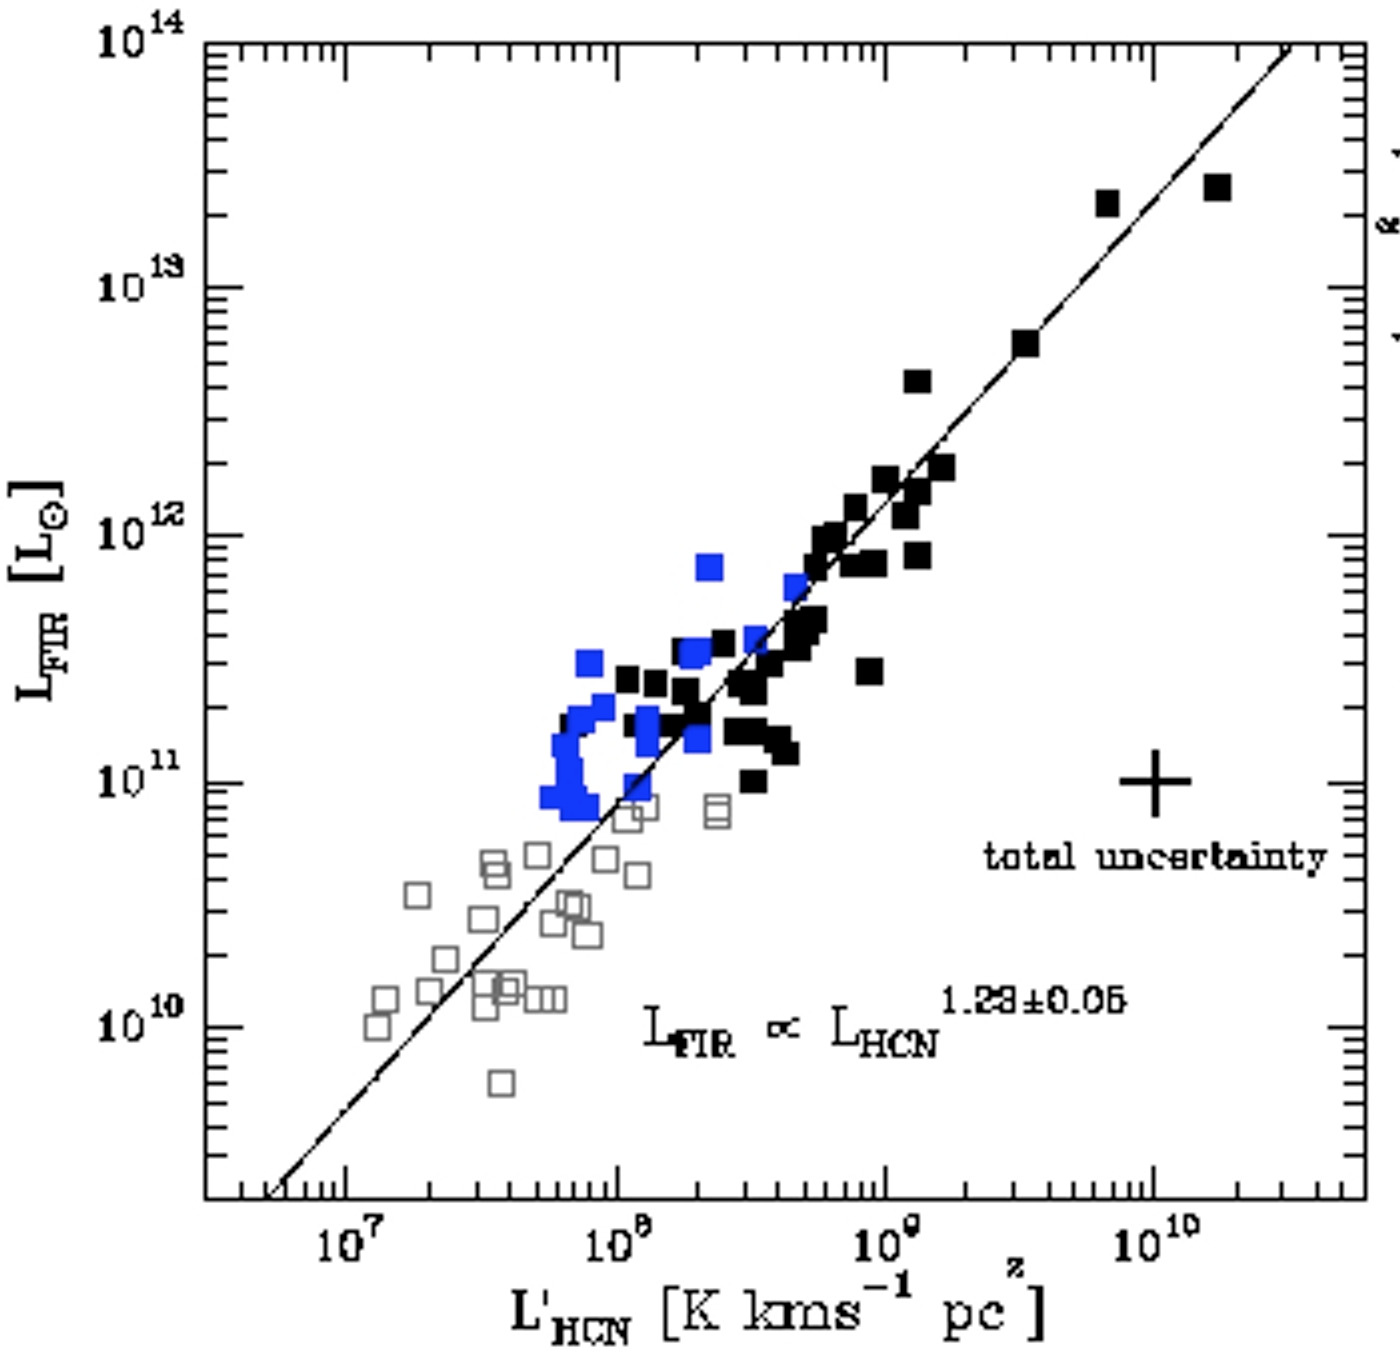
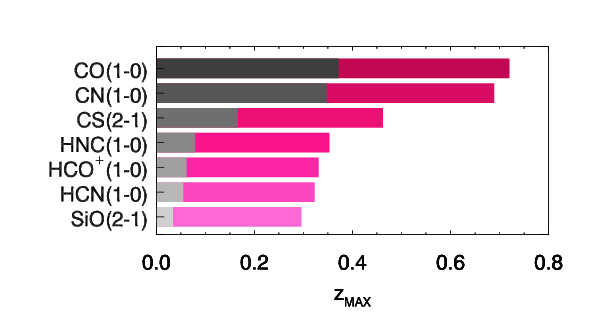
Although observations of CO line emission serve as an effective means of studying the cold molecular gas reservoir in the interstellar medium of high-redshift galaxies, probing the dense molecular gas (105 cm-3) more directly associated with star-formation is best achieved through observations of higher dipole moment molecules, such as HCN, HNC or HCO+. The luminosity in the HCN J=1-0 line is known to correlate tightly with infrared (IR) luminosity in nearby galaxies (Gao & Solomon 2004a, b; García-Burillo et al. 2012, Fig. 3), a correlation which extends down to the IR luminosities of dense Galactic molecular cloud cores, (Wu et al. 2005). For warm gas (70 K), the mass in dense gas can be estimated from the HCNJ=1-0 line luminosity following, M⊙ (Gao & Solomon 2004b). As this dense gas in our own Galaxy is generally associated with sites of ongoing star-formation (indicated by the IR luminosity), it is believed that the presence of strong HCN J=1-0 line emission in a high-redshift galaxy may be interpreted as the signature of an ongoing starburst (Solomon et al. 2003). By comparing the dense gas masses estimated from HCN J=1-0 with the total molecular gas masses estimated from low-J CO line emission, one can estimate the dense fraction in galaxies over Cosmic time. Similarly, the dense gas mass can be compared to the star-formation rates (obscured and un-obscured) in order to estimate a true star-formation efficiency.
With the sensitivity of current facilities, detection of the low-J transitions of the dense gas tracers HCN, HCO+ and HNC ( GHz) in emission at high-redshift (z > 1) is only possible for the most luminous ( L⊙), or gravitationally lensed objects. Although more than 100 high-redshift galaxies have now been detected in CO line emission (see review by Carilli & Walter 2013), of these only a few have also been detected in HCN J=1-0 line emission (e.g. Solomon et al. 2003; Vanden Bout et al. 2004; Carilli et al. 2005). The HCN J=5-4 line has been detected in the strongly lensed quasar, APM08279+5255 at z=3.9 (Wagg et al. 2005). Because they are typically more luminous in the IR than the nearby galaxy sample, these high-redshift galaxies may be used to constrain the extreme end of the HCN to IR luminosity correlation ( L⊙). Although the current data suggest a deviation from the correlation at this high luminosity end (Riechers et al. 2007; García-Burillo et al. 2012), this needs to be confirmed through observations of more objects with comparable luminosities. HCO+ is also known to be a good tracer of dense gas in extragalactic environments (e.g. Graciá-Carpio et al. 2006; Riechers et al. 2006), however observations of this species are more difficult as it is an molecular ion (Papadopoulos 2007).
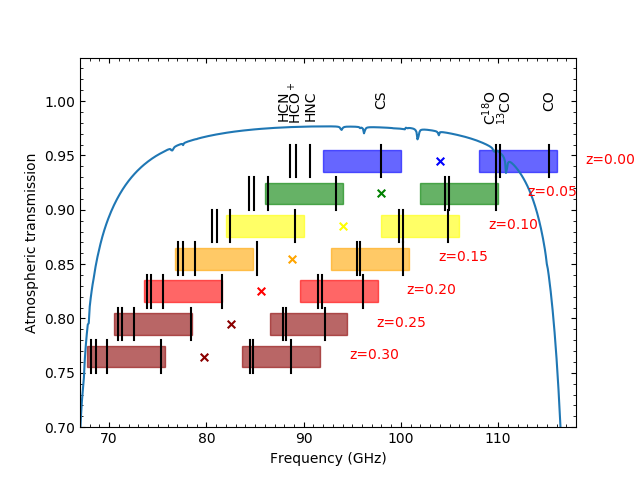
Figure 4 shows the value of Band 2+3 with a 16 GHz bandwidth (8 GHz in each sideband) for simultaneously studying the relative evolution of molecular reservoirs in galaxies (traced by CO J=1-0 and its isotopolgues) and the dense star forming gas (traced by HCN, HCO+, HNC and CS). At redshift z=0, all the J=1-0 transition of CO species plus CS J=2-1 can be observed simultaneously. Moving to higher redshifts additional dense gas tracers can also be observed simultaneously. Beyond z=0.15, the J=1-0 transitions of HCN, HCO+ and HNC can all be observed simultaneously with the CO species while beyond z=0.20 all four dense gas tracers are simultaneously observable with all the CO species. If the IF bandwidth in each sideband was expanded to 9 GHz, then at least two dense gas tracers (CS and HNC) would be observable with all the CO isotopolgues at all redshifts . All four dense gas tracers would be simultaneously observable (with the CO species) for all redshifts up to if the IF bandwidth was 10 GHz or greater in each sideband.
2.3.1 Molecular outflows and AGN feedback
The massive molecular outflow in the ULIRG, Mrk 231, which is the best studied so far, has been detected not only in low-J CO transitions (Feruglio et al. 2010; Cicone et al. 2012), but also in the high density molecular tracers HCN(1-0), HCO+(1-0), HNC(1-0) (Aalto et al. 2012). Moreover, the broad wings that trace the outflow are more prominent in the higher density species (HCN) than in the low-J CO lines, as indicated by the line core-to-wings intensity ratios which are up to a factor of 4 higher in the HCN than in the CO lines. These results suggest that not only very dense () molecular gas survives in the outflow, but also that these high dipole moment molecules are enhanced in the wind, and they may therefore constitute the best tool to explore the outflow. A possible explanation for such enhanced HCN emission in the massive molecular wind can be the presence of strong shocks; however, the hypothesis of strong shocks seems to be in contrast with the results of the CO excitation study of the outflowing gas in Mrk 231 (Cicone et al. 2012). Given the direct link between HCN and star formation rate (Gao & Solomon 2004b), the detection of the outflow in HCN, HCO+ and HNC is also intriguing in light of the recent models of triggered by AGN feedback in which star formation occurs within massive molecular outflows (“positive AGN feedback”, Ishibashi & Fabian 2012; Zubovas et al. 2013; Silk 2013).
Other important molecular transitions will come for free within Band 2(+3), which include CS(2-1) 97.98 GHz and SiO (2-1) 86.85 GHz. CS, being particularly resistant to shocks and UV photo-dissociation, is a very good and unbiased tracer of dense molecular gas, and can be used to determine the amount of dense gas in the outflows and its relationship with the diffuse component traced by the lowest J transitions of CO. Silicon monoxide (SiO) is an unambiguous tracer of strong shocks: these can modify the chemistry of the local ISM, by destroying dust grains and injecting silicon and SiO into the gas phase, therefore resulting in an abundance of SiO enhanced by orders of magnitude. This molecule represents an independent tool to test the presence of shocks and their relevance in the feedback process. The J=1-0 transition of CS and SiO are covered by the ALMA Band 1 and the Q Band of JVLA , but the J=2-1 transitions are crucial to study the excitation of these species in the outflow.
Summarising, HCN(1-0), HCO+(1-0) and HNC(1-0) are probably privileged tracers of massive molecular outflows, and can be used explore the outflow in nearby galaxies, where we have enough signal and resolution to resolve them. Moreover, with Band 2 we can exploit CS(2-1) and SiO(2-1) to study in detail the physical properties of the outflows and the role of shocks, therefore discriminating between different models of AGN feedback. Without Band 2, all of these transitions are only detectable in sources at redshift , which means that the number of possible targets in which to trace quasar feedback mechanisms is limited to just a few objects (e.g. Mrk 231).
Such studies would also benefit from increased bandwidth: on the one hand, the continuum can be estimated and subtracted with greater accuracy, and on the other, most of the previously mentioned transitions can be observed simultaneously with a single observation. A combined Band 2+3 receiver would be more efficient for this work than a separate Band 2 receiver.
2.3.2 The prospects of Band 2/2+3 for dense gas tracers
Band 2(+3) receivers on ALMA open up the possibility of detecting (and imaging) the J=1-0 transitions of HCN, HCO+ and HNC in star-forming galaxies and AGN out to =0.3, compared to only 0.05 with the current Band 3 capabilities. Extending to 0.05z0.3 opens up a volume 185 times larger to enable detailed case studies of targets that are rare in the local Universe, but more representative of the galaxy populations at high-. As the number density of IR luminous star-forming galaxies is increasing with redshift, surveys of HCN J=1-0 with Band 2 would provide the only means of constraining the apparent non-linearity at the highest end of the relationship. The spatial resolution achievable with ALMA at these frequencies means that we will probe the spatial distribution of dense gas in the interstellar medium of galaxies over the last two billion years of the Universe. In the 0.05z0.3 range, the Universe evolved by 3 Gyr, while the spatial scale changes from 1′′/kpc to 4′′/kpc. We also note that these lines only enter Band 1 at 1, where similar studies will be limited by sensitivity and spatial resolution.
2.4 Galaxy environment
Galaxies occur in a range of environments, from close-pairs to clusters which are the largest collapsed structures in the Universe with total masses up to (e.g. Arnaud et al. 2009). One of the most important issues is the spatial and temporal evolution of star formation activity within these environments. A key requirement for star formation is the presence of a reservoir of dense, cold gas that can be efficiently converted into stars. This is especially crucial for galaxies in rich clusters, because they are expected to be affected by mechanisms able to remove cold gas from the haloes and disks of infalling galaxies (e.g., ram pressure stripping, Gunn & Gott 1972) or to prevent further cooling of gas within galaxies’ dark matter haloes (starvation or strangulation, e.g. Larson et al. 1980; Bekki et al. 2002). This environmental dependence profoundly influences the evolutionary histories of galaxy clusters and the star formation-galaxy density relation represents a well-established observational hallmark of how galaxies evolve as a function of environment (e.g. Geach et al. 2009).
Studies of star formation activity based on multi-wavelength tracers have shown a gradual truncation, from to 1, in the cores of rich clusters (e.g. Hashimoto et al. 1998; Ellingson et al. 2001; Gómez et al. 2003; Patel et al. 2009). Determining the nature and modes of star formation requires a robust understanding of the relationship between the gas content of a galaxy and its star formation rate. Remarkable progress has been made in understanding the conversion mechanisms in field galaxies (e.g. Wong & Blitz 2002; Bigiel et al. 2008; Daddi et al. 2010a; Genzel et al. 2010; Tacconi et al. 2010; Combes et al. 2011), but the cold and dense gas fueling the star formation has been difficult to investigate in clusters (e.g Wagg et al. 2012; Casasola et al. 2013), despite their exceptional opportunities for cosmological studies. So far, cold gas has been detected in cluster galaxies only up to 0.5, especially in the outskirts of rich clusters (e.g. Geach et al. 2009; Jablonka et al. 2013), while the range is yet unexplored.
For the first time, ALMA Band 2 will offer the opportunity to study the CO(1-0) line in group and cluster galaxies at , in a redshift range where the gas-star conversion in clusters is completely unexplored. Although similar redshift ranges are observable in other ALMA bands, Band 2 enables accurate estimates of molecular gas content (see Sect. 2.2). In addition, Band 2 offers a field of view times larger (depending on the redshift range) than other ALMA bands at higher frequencies; clusters at 1 are generally 1 arcmin in size (e.g., Wagg et al. 2012; Casasola et al. 2013) so that the Band 2 field-of-view of 70-90” gives coverage of the entire cluster and resolves individual cluster members with only a single pointing. Observations of cluster members covering a wider radial range can help distinguish the various physical processes expected to play a role (e.g., ram-pressure stripping, strangulation, tidal interactions, and mergers) because these processes peak in effectiveness at different clustercentric radii (De Lucia et al. 2010; Moran et al. 2007). How, when, and where such mechanisms affect the evolution of galaxies has yet to be explored.
3 Deuterated Molecules: Probing the Coldest, Densest, Most Quiescent Gas
Deuterium is produced by primordial nucleosynthesis and destroyed in stars. In the local universe this has resulted in an abundance of deuterium of of that hydrogen (Linsky 1998). Nevertheless a range of deuterium-containing molecules have been detected in interstellar clouds with abundances approaching 50% that their hydrogen-containing counterparts (e.g. Ceccarelli et al. 1998; Crapsi et al. 2005) (Figure 10) and even species containing multiple D atoms such as ND3 have been detected (Lis et al. 2002).
The factor enhancement in singly deuterated species compared to their hydrogen counterparts and up to for multiply deuterated (e.g. 2017A&A...600A..61H) species is a result of two factors. The first is the small zero-point energy difference between the deuterium and hydrogen containing species. This drives the chemical networks producing these species to favour the deuterated species at low temperature. At temperatures below K the reaction
(Watson 1974) enhances the abundance of H2D+ as the back reaction is suppressed. The H2D+ formed can subsequently react with CO and N2 to produce DCO+ and N2D+ respectively. With the decrease in abundance of the neutral gas species as they condense on to the surfaces of grains (freeze-out) in high density, lower temperature regions (e.g. Caselli et al. 1999), the dominant destruction routes for H and H2D+ become less effective. This, combined with the enhanced rate of H2D+ production, leads to increasing levels of deuteration. Eventually, the reduction in the gas-phase abundance of CO results in N2D+ becoming the major product of the destruction of H2D+. Deuterium-containing molecules and ultimately N2D+ are therefore highly selective probes of the coldest, densest regions of molecular gas in a range of objects.
3.1 Prestellar Cores
Prestellar cores are the cold ( K), dense ( cm-3) and quiescent (dominated by the thermal pressure) reservoirs in nearby low mass star forming regions, with gravitationally unstable, centrally concentrated density profiles (e.g. Keto & Caselli 2008).

They show the largest deuterium fractions and highest degree of CO freeze out among the starless cores (Crapsi et al. 2005). These objects are the transitional stage from molecular cloud to star forming clump and their properties set the initial conditions for the formation of the next generation of individual low mass protostars (e.g. Ward-Thompson et al. 1999). The properties of these future stellar cradles provide crucial tests of star formation theories and deuterated molecules are key tracers of their physical conditions and dynamics in their central regions.
| Deuterated Species | |||||
|---|---|---|---|---|---|
| Molecule | Freq. | Molecule | Freq. | ||
| (GHz) | (GHz) | ||||
| CH2D+ | 1(1,0)-1(1,1) | 67.273 | DN13C | J=1-0 | 73.367 |
| D13CO+ | J=1-0 | 70.733 | DNC | J=1-0 | 76.306 |
| D13CN | J=1-0 | 71.175 | DOC+ | J=1-0 | 76.386 |
| DCO+ | J=1-0 | 72.039 | N2D+ | J=1-0 | 77.108 |
| C2D | N=1-0 | 72.108 | NH2D | 1(1,1)0 - 1(0,1)0 | 85.926 |
| DCN | J=1-0 | 72.415 | |||
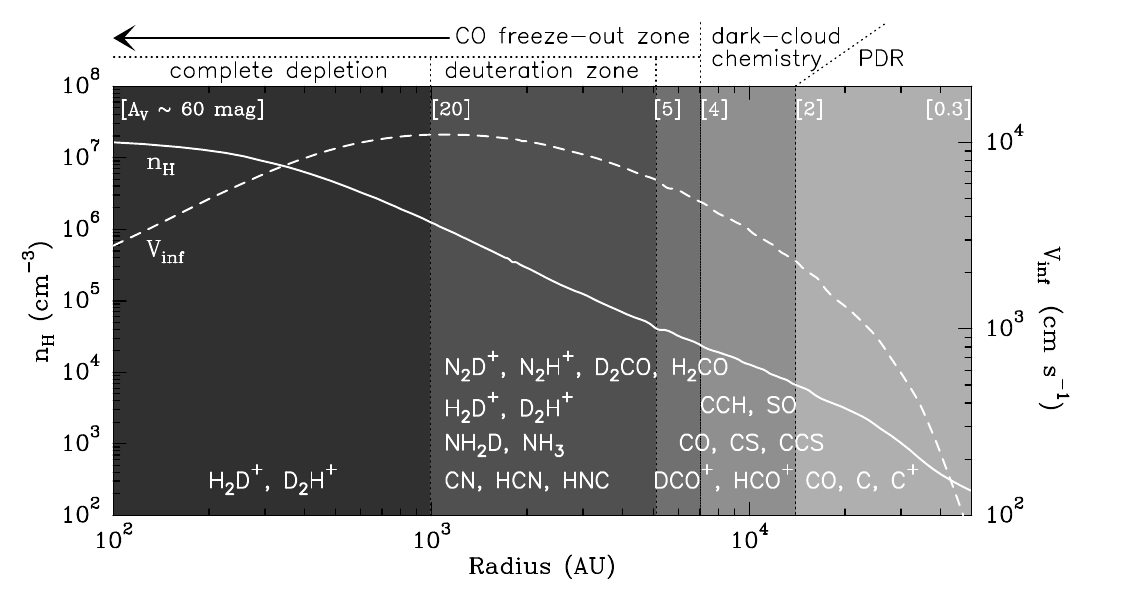
Figure 5 shows the size and location of the deuteration zone within the prototypical pre-stellar core L1544 in the Taurus molecular cloud, with the peak emission in the deuterated species coincident with the dust continuum peak (Caselli et al. 2002; Vastel et al. 2006). A schematic of the structure of a pre-stellar core based on detailed modelling of L1544 is shown in Figure 6 indicating the important tracers of the different regions of the core (Caselli 2011).
In the outer regions of the core, where the density rises above cm-3 a dark-cloud chemistry dominates with species like HCO+, C2H, H2CO tracing the material, with DCO+ becoming important as the low temperature enhances the H2D+/H ratio (see previous section). Moving to the higher density interior, where there is less gas phase CO and the region (in this model) of maximum infall velocity ( km s-1), the nitrogen bearing such as N2H+ and NH3 and then their deuterated counterparts become the dominant tracers. The inner most regions are currently unexplored. Some authors predict complete freeze-out of species heavier than He (e.g. Walmsley et al. 2004), so that the only likely tracers of the gas at densities above about 106 cm-3 are the deuterated variants of H, H2D and D2H+. However, observations with the Plateau de Bure interferometer (PdBI) have shown deuterated ammonia strongly peaked at the dust peak (Crapsi et al. 2007), while water vapour emission from the central 1000 AU has also been detected (Caselli et al. 2012). Thus, easy-to-observe deuterated species such as N2D+ can still be present in pre-stellar core centres. As a core evolves to higher average density the global N2D+ to N2H+ ratio can provide an indicator of the dynamical evolution of the prestellar core (Crapsi et al. 2005).
The small infall velocities and low degree of turbulence in these regions (Caselli 2011) highlights an especially important feature of the J=1-0 transition of N2D+ (and N2H+) compared to their higher J transitions. The Band 2 J=1-0 transitions of these species, unlike the higher J transitions, have an isolated single hyperfine component. This component provides a sensitive tracer of the velocity and line width structure of regions without the ambiguities introduced by optical depth and velocity dispersion-driven blending of overlapping hyperfine components which affect the higher J transitions.
3.2 Protostellar Envelopes: Tracing Protostellar Evolution
Deuterated species trace not only the quiescent gas contracting in prestellar cores, but also the most quiescent regions around protostars; the gas which has not yet been affected by feedback by the radiation or wind from a protostar. Emprechtinger et al. (2009) have shown how the global N2D+ to N2H+ ratio decreases with increasing dust temperature providing an age indicator for the youngest low mass protostars, the Class 0 sources (Figure 8).
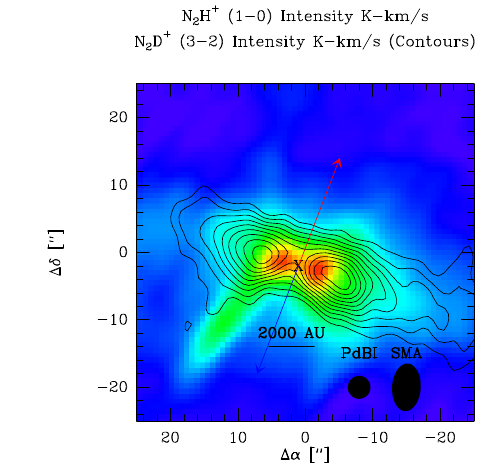
Spatially resolving these deuterium rich circumstellar regions, as Tobin et al. (2013) have recently done for a small sample of low mass protostars, will provide the opportunity to study pristine circumstellar gas. Figure 8 shows Tobin et al. (2013) observations of the protostar in L1157. Here the N2D+ traces a cold, dense AU-sized flattened structure (a disk or toroid) around the central protostar which drives a well collimated outflow in the perpendicular direction. The increasing ratio of the N2H+ to N2D+ emission close to the star is consistent with the heating of the material by the central source. However the detailed analysis of of the N2D+ and its comparison with the N2H+ are significantly hampered by the lack of N2D+ J=1-0 data, which ALMA Band 2 can provide.
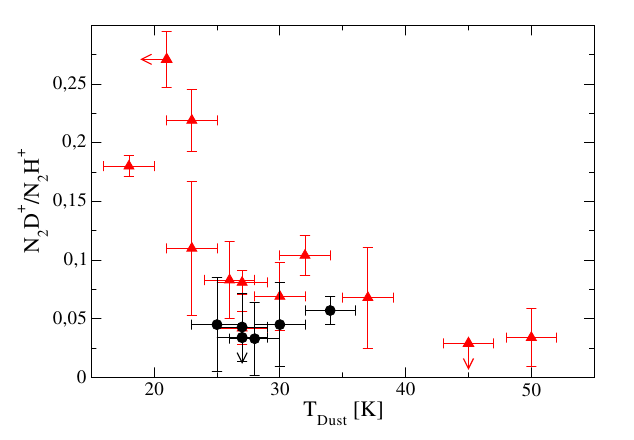
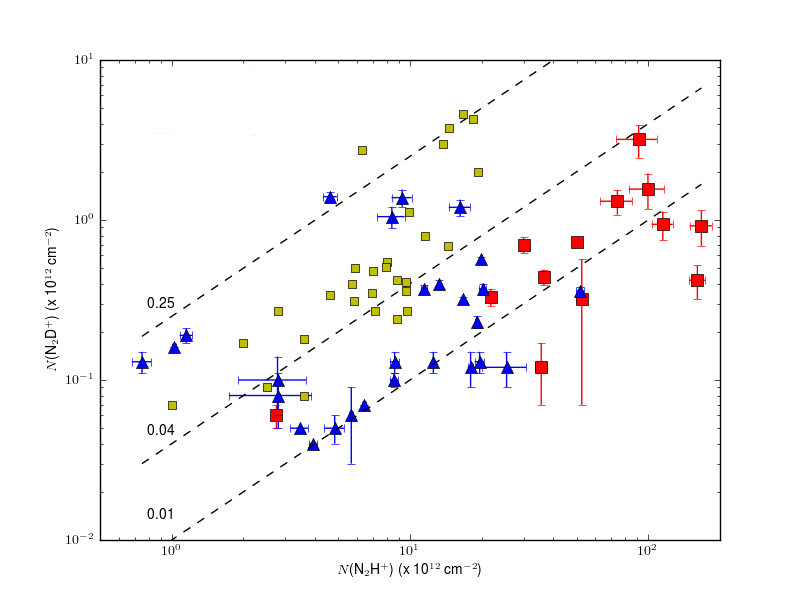
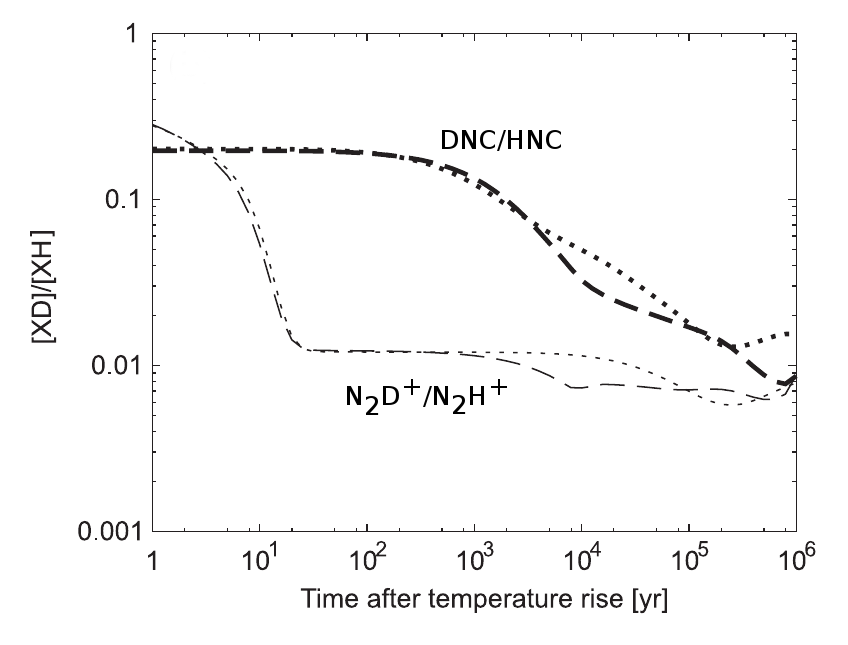
The conditions for high deuteration occur not only in regions of low mass star formation but also in regions forming massive stars. Observing a sample of objects spanning a likely range of evolutionary stages in the formation of massive stars, from high mass starless core candidates to ultra-compact HII regions, Fontani et al. (2011) detected deuteration fractions in N2D+ as high as 25%. These observations for the first time identified deuteration fractions in massive star forming regions as high as seen in low mass star forming regions. These results demonstrate the potential of deuterated species as a long searched for probe of the evolution state and age of massive protostars. Comparison of the deuteration fraction for different species can also provide an estimate of the time since a young massive has started to significantly heat its environment (Fontani et al. 2014, ; Figure 10). Once again, the isolated hyperfine component of N2D+ will provide precious information on the kinematics of the cold and dense gas on the verge of star formation.
3.3 Proto-planetary Disks: The CO Snowline
Deuterated species are also important probes of the heavily shielded, and therefore cold, dense mid-plane of proto-planetary disks; the regions within which planets form. By tracing the decrease in gas phase CO abundance, N2D+ and N2H+ can identify the location of the ‘CO snowline’, an important transition region for the properties of the dust. Outside the snowline the frozen CO ice mantles enhance the ‘stickiness’ of the dust, promoting the growth of larger grains enroute to planet formation (Ros & Johansen 2013) and potentially impacting the composition of the atmospheres of the planets which form (Öberg et al. 2011a). The ice also provides a substrate for chemical reactions which can alter the gas phase chemistry, for example acting as a source of H2CO (Qi et al. 2013).
Observations of DCO+ together with other species, can map the ionization fraction, a controlling parameter in the coupling of the gas and magnetic field, as a function of radius and height in the disk (Öberg et al. 2011b). The presence of a quiescent ‘dead zone’ within a disk where the ionisation is too low for the magneto-rotational instability (MRI) to operate would have important implications for the settling and evolution of dust to form planetesimal and, once planets have formed, their migration (Ciesla 2007; Matsumura et al. 2009; Okuzumi & Hirose 2012).
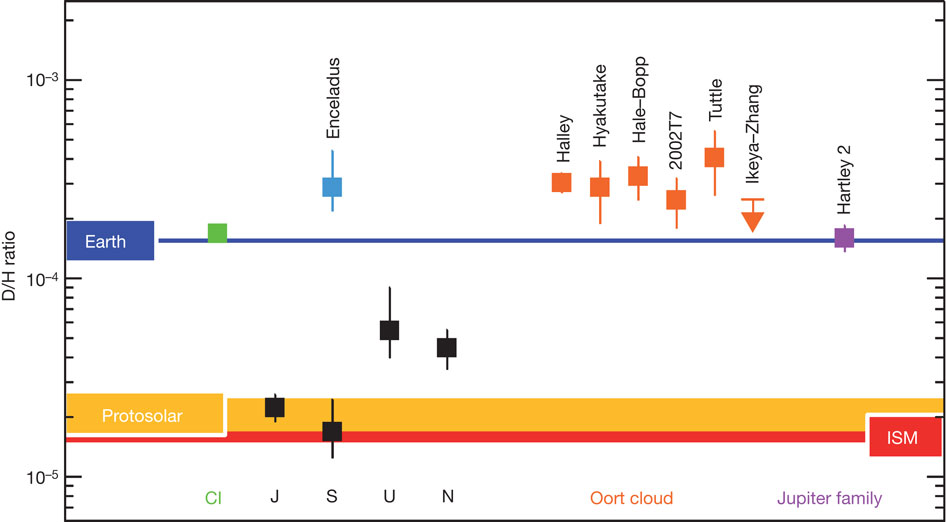
In our own solar system a wide range of deuteration is observed (Figure 11) which has important implications for the origin and evolution of volatiles, and especially water, on Earth: whether it is directly accreted from the proto-solar nebula or delivered by asteroids and comets after the Earth formed. Mapping the deuteration in proto-planetary disks can potentially similarly constrain the transport of volatiles from the disk to planets and how intra-planetary system variations are established.
3.4 Deuterium in External Galaxies
In the 40 years since the first molecular detection in the extragalactic interstellar medium, the number of species identified in external galaxies is now more than 50. Many of these species have been observed in nearby starburst galaxies (Martín et al. 2006, 2011; Aladro et al. 2011, 2012; Requena-Torres et al. 2011), due to their brightness. Although the only current extragalactic detection of a deuterated species, is a tentative detection of DCN by Martín et al. (2006) in the nucleus of NGC253, ALMA Band 2 will revolutionise the study of these species in external galaxies as the simulated spectrum in Figure 12 shows.
Astrochemical models (Bayet et al. 2010) have explored a large parameter space of physical conditions covering different extragalactic environments and provided a guide to observations of deuterated molecules arising from the dense gas in external galaxies and the extreme environments which they can probe. For example, the high spatial density of massive star formation in mergers and starburst galaxies (e.g. Suchkov et al. 1993; VERITAS Collaboration et al. 2009; Acero et al. 2009) creates regions of extremely high cosmic ray energy density, up to about ten thousand times that in the disk of the Milky Way Galaxy, potentially driving the formation a top-heavy stellar initial mass function and bimodal star formation (Papadopoulos 2010; Papadopoulos et al. 2011).

Although currently qualitative in nature, the astrochemistry models provide some important conclusions: (i) HDO and DCN are abundant, regardless of the extragalactic environment; and (ii) DCO+ is a tracer of enhanced cosmic-ray irradiated molecular gas which together with the other ions accessible in the ALMA Band 2+3 (HCO+, HOC+, N2H+ and their deuterated isotopologues), probes the ionization of the gas.
3.5 A Second Route to Deuteration?
One surprising result is the high levels of deuteration seen in DCN in some regions of warm gas such as in the inner regions of circumstellar disks (Öberg et al. 2012) and in the Orion Bar (Parise et al. 2009). Two possible explanations have been advanced for these observations. First, the gas phase DCN is transitory, resulting from the current evaporation of DCN formed in the ice mantles during the earlier evolution of the gas and dust through a cold, dense phase (Tielens 1983). Alternatively, a deuteration route involving CH2D+, which is effective for temperatures up to K, could directly produce high levels of deuteration in the warm gas (Parise et al. 2009; Öberg et al. 2012). Distinguishing between these two possible explanations in a given region requires observations of CH2D+ and ALMA Band 2 is essential in doing this as it contains the J=1-0 transition of CH2D+ (Table 1).
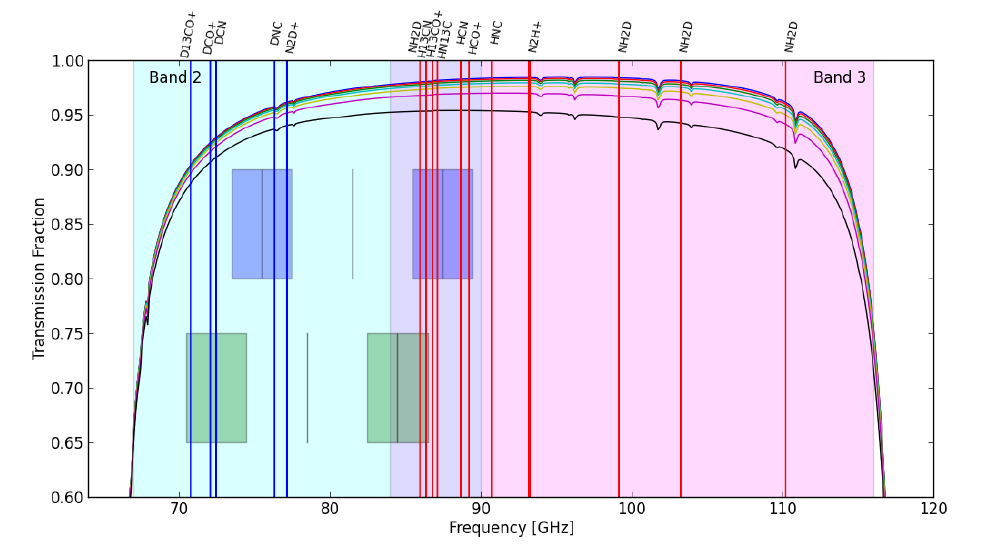
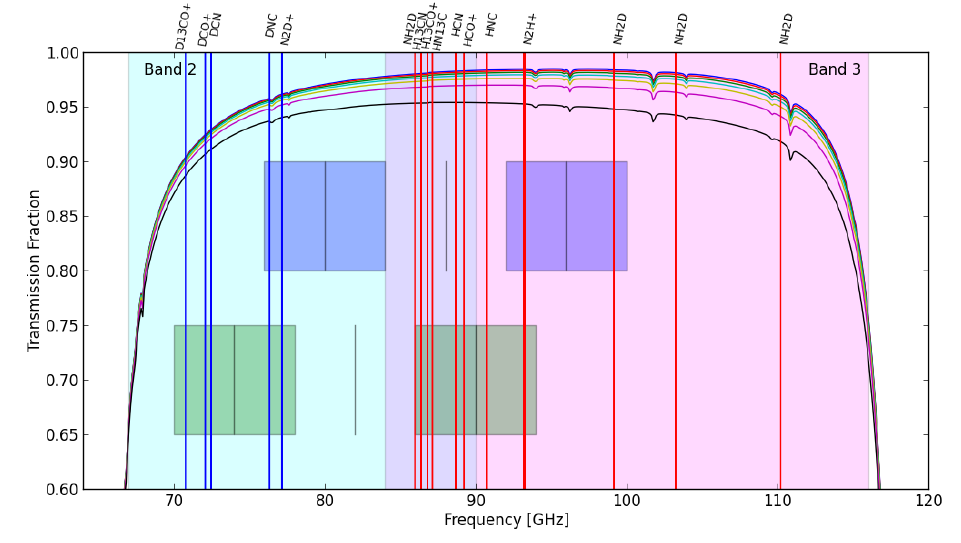
3.6 ALMA Band 2: The Deuterium Band
The enhancement of deuterated species in cold regions directly points to the importance of the low J transitions, and in particular the J=1-0 transition, in reliably establishing the excitation and column density of deuterated species. Many of the simple deuterated species including N2D+, DCO+, DCN, DNC, DOC+ (as well as their 13C and 15N containing isotopologues) have their ground state transitions in ALMA Band 2 (Table 1). Among the ALMA frequency bands, Band 2 is unique in its ability to observe many of these important deuterated species simultaneously. In a single frequency (Figure 13, left) setting DCO+ and DCN and their 13C and 15N isotopologues can be observed together with N2D (deutero-ammonia). While a second setting (Figure 13, right) can observe DOC+, DNC, N2D+ and N2D together with the 13C variants of HCN, HCO+ and HNC. A future upgrade to a 16 GHz bandwidth will allow simultaneous observation of all these deuterated species plus N2H+in a single setting, as well as HCN, HNC HCO+ and their 13C and 15N isotopologues. No other ALMA frequency band can match Band 2 in this ability to study deuterated molecules, both in terms of the number of species accessible and the importance of the transitions. noline] Model to justify importance of J=1-0 lines in constraining column densities and excitation. Also describe efficiency by pointing out difficulty in observing lines in other bands.
4 Level 2 Science Projects
4.1 The nature of the earliest ionized gas during massive star formation
noline]Add figure. Ultracompact HII regions (UCHIIs) have been known for decades to be the clearest signpost of the formation of truly massive stars (O and early B, MM⊙), because only these stars can produce a significant numbers of UV photons ( s-1). Typical UCHIIs discovered in early surveys (e.g. Wood & Churchwell 1989) have emission measures pc cm-6 (where and are the size and electron number density respectively) and can well be accounted for by homogeneous ionized gas that becomes optically thin (marked by a spectral index change from in the optically thick regime to ) at a frequency of 1 to 5 GHz. However, a population of smaller (sizes of hundreds to few thousands of AU), denser HII regions has been identified, usually called hypercompact HII regions (HCHIIs). The turnover frequency of a homogeneous HII region scales as (see Kurtz 2005), so the turnover frequency of these HII regions with pc cm-6 falls in the range from 20 to 150 GHz, the central part of which would be covered by ALMA Band 2 (65 to 90 GHz). These HCHIIs are believed to signpost the appearance of photoionization in the formation of O-type and early B massive stars, and therefore are key to understanding the late stages of formation and end of accretion. There is evidence that HCHII regions are not simply homogeneous spheres expanding hydrodynamically, but that they have density gradients (see e.g. Fig. 6 of Keto et al. 2008) and supersonic motions (broad recombination lines with FWHM km s-1) due to ionized outflow or even inflow (e.g. Keto & Wood 2006). ALMA with Band 2 capabilities would offer the unique opportunity of characterizing this early ionized gas both in free-free continuum (SEDs) and in hydrogen recombination lines. The latter are a unique probe of the dynamics of the ionized gas. Furthermore, mm recombination lines cover a unique niche compared to cm and sub-mm RLs: the cm lines are faint and are pressure broadened, whereas the sub-mm RLs can be contaminated with molecular lines and are more prone to non-LTE effects (e.g. Peters et al. 2012; Galván-Madrid et al. 2012). ALMA Band 2 is able to observe the alpha RLs from H45 (69.830 GHz) to H42 (85.688 GHz) while a Band 2+3 system will reach up to H37 (106.737 GHz) and H38 (115.274 GHz). A Band 2+3 system with a 16 GHz bandwidth would allow the simultaneous observation of three recombination lines (H45, 46 and 41) which, because of the increasing frequency separation of the higher lines, is not possible in any other ALMA Band. At a typical distance of 5 kpc, the maximum ALMA angular resolution in this band of 0.05" is equivalent to AU, sufficient to map the continuum and dynamics of these sources.
4.2 From Grains to Planets: The evolution of dust from the interstellar medium to planet formation
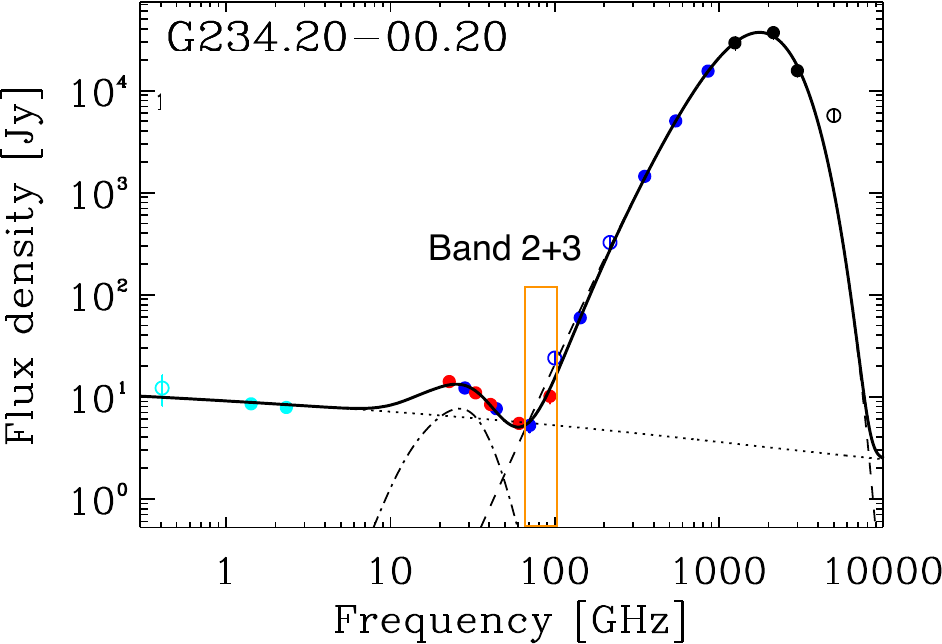
The far-IR to mm wavelength spectral energy distribution (SED) of the interstellar medium is dominated by thermal emission from dust grains with the shape of the SED sensitive to the properties of the dust grains. In particular, for a given dust grain composition and shape, the slope of the emission flux density as a function of wavelength traces the dust grain size distribution, becoming shallower as the grains become larger (Draine 2003). By measuring the variation in this spectral slope across the (sub)mm wavelength window from the pristine interstellar medium to protoplanetary disks it is possible to trace the evolution of the interstellar dust as it grows to form planets (Draine 2006; Natta et al. 2007).
The fact that observations are most sensitive to the emission from grains with sizes similar to the observing wavelength, means there is a considerable advantage in measuring grain growth by observing at longer wavelengths. However, around cm wavelengths the contribution to the SED from free-free emission and spinning dust begins to dominate over the thermal dust emission. It is important to accurately model and remove this emission. In low mass star forming regions and protoplanetary disks, the ALMA Band 2 window is the longest wavelength still dominated by thermal dust emission (Figure 14). Combined with ALMA Band 1 as well as longer wavelength VLA/SKA observations ALMA Band 2 will be a uniquely powerful probe of grain physics and growth in protoplanetary disks. We stress that full coverage of the spectral energy distribution from the sub-mm through cm wavelengths, and especially across the 100-30 GHz frequency range, is essential to disentangle the various contributions of the emission.
In order to sample the SED across the full sub-mm to cm wavelength window, previous measurements of grain growth have needed to rely on combining flux measurements from observations at different telescopes. The absolute flux calibration has been a major factor limiting the accuracy with which it is possible to derive the spectral slope, and hence dust grain size distribution. One immediate advantage of ALMA in this area of science is the much greater absolute flux calibration accuracy over existing facilities. An additional advantage of going to long wavelengths, is that for a fixed bandwidth (as is the case for ALMA continuum observations) the fractional bandwidth in a single wavelength setup increases. In other words, for a source detected at a given signal to noise, it becomes easier to detect an intrinsic spectral index in the source across the instantaneously-observed bandpass. This has the major advantage that the uncertainty in the measured spectral slope of the source is limited by the signal to noise per channel and bandpass calibration and not the absolute flux calibration. If the instantaneous bandwidth is increased from 8 to 16 GHz, as proposed in one part of the ALMA development plan, or if the Band 2 receivers extend to cover the Band 3 wavelength window, the advantages outlined above improve dramatically. This accuracy is expected to allow precise measurements of grain size variations within disks, which are a powerful probe of the grain growth physics and its evolution towards planet formation (Pinilla et al. 2012; van der Marel et al. 2013).
Typical star-forming cores in nearby star formation regions have angular sizes of ". The large primary beam (70–90”) at Band 2 makes it possible to observe these in a single pointing without worrying about primary beam attenuation or the reduced surface brightness sensitivity penalty arising when mosaiced observations are required.
The expected very good phase stability at Band 2 wavelengths means it should be possible to image with the most extended antenna configurations, and so achieve angular resolutions ". This is particularly important for studying dust properties in protoplanetary disks. Grain growth is predicted to be non-uniform across the disk, varying both generally with radius in the disk, but also due to stochastic physical processes (Pérez et al. 2012; van der Marel et al. 2013). Being able to spatially resolve the dust grain size distribution across the disk would help address a key problem in the understanding of planet formation – the ‘metre barrier’. Theoretically we understand how small grains can grow to metre sizes in a disk by coagulation. However, current turbulent disk models struggle to make particles much bigger than this as these large metre-size boulders get destroyed by collisions. One potential mechanism to overcome the barrier is that gas and dust get pressure-confined in small pockets within the disk, allowing the dust grains to interact constructively rather than destructively, and thereby grow to sizes larger than the theoretical barrier. Once they do so they are no longer destroyed by collisions and can grow to form planetesimals and eventually planets. The upper-limit to the ‘barrier size’ varies inversely linearly proportionally with the radius from the central star. At 1 AU from the star, the barrier occurs for grains of metre size. While at 100 AU the barrier appears to limit grains to sizes below millimetre sizes. One can use ALMA Band 2 observations to identify the regions in the outer disk where grains have grown from mm to cm sizes. Once identified, studying these regions to understand how the grains overcome the barrier will be a major step forward in understanding planet formation, including the formation of earth-like planets close to the habitable zone if the same physical processes operate at 1 AU as at 100 AU.
4.3 Isotopic variations: Probing the mixing in stars
The fundamental role played by asymptotic giant branch (AGB) stars in the enrichment of the interstellar medium (ISM) and the chemical evolution of galaxies is well-established (Busso et al. 1999). Almost half of the heavy elements returned to the ISM originates in evolved stars with initial masses between 1 and 8 M⊙ (Maeder 1992). The chemical composition of the material returned to the ISM during the AGB, is determined by the nucleosynthesis in the stellar core and the subsequent convective envelope mixing. Isotopic ratios are the best diagnostic tracers for the efficiency of the nucleosynthesis and mixing processes, as they are very sensitive to the precise conditions in the nuclear burning regions, and observations of the different molecular isotopologues are therefore the key to understanding the stellar origin of elements. Despite their obvious importance, the observational constraints are scarce, mainly due to the weakness of the various emission lines, and very little recent progress has been made. Scattered observations exist of small samples and essentially a statistically relevant data set is only availble for the carbon isotopes (Lambert et al. 1986; Schöier & Olofsson 2000) and to some extent, for the important oxygen isotopes (Harris et al. 1987), necessary to constrain the mixing processes. For the silicon isotopic ratios, essential to understand the origin of presolar SiC grains and the enrichment of our own Solar system (e.g. Lewis et al. 2013), the situation is even worse, with observations available only for a handful of stars. With its unprecedented sensitivity, ALMA can play a crucial role in this field, fundamental to stellar evolution and the formation of elements, by constraining the isotopic ratios in statistically significant samples of AGB stars with a limited amount of observing time.
| Species | Transition | Frequency (GHz) | Species | Transition | Frequency (GHz) | |
|---|---|---|---|---|---|---|
| Si13CC | 3(1,3)-2(1,2) | 65.036 | Si13CC | 3(1,2)-2(1,1) | 73.102 | |
| 30Si34S v=0 | J=J=4-3 | 68.052 | SiC2 v=0 | 21(4,17)-21(4,18) | 73.178 | |
| 30SiC2 | 3(0,3)-2(0,2) | 68.333 | Si13CC | 7(1,6)-7(1,7) | 74.384 | |
| Si13CC | 3(0,3)-2(0,2) | 68.610 | Si18O v=0 | J=2-1 | 80.705 | |
| 30SiC2 | 3(2,2)-2(2,1) | 68.777 | 30SiO v=2 | J=2-1 | 83.583 | |
| Si13CC | 3(2,2)-2(2,1) | 69.129 | 30SiO v=1 | J=2-1 | 84.164 | |
| 30SiC2 | 3(2,1)-2(2,0) | 69.255 | SiO v=4 | J=2-1 | 84.436 | |
| 29SiC2 | 3(0,3)-2(0,2) | 69.264 | 29SiO v=2 | J=2-1 | 84.575 | |
| Si13CC | 3(2,1)-2(2,0) | 69.682 | 30SiO v=0 | J=2-1 | 84.746 | |
| 29SiC2 | 3(2,2)-2(2,1) | 69.735 | SiO v=3 | J=2-1 | 85.038 | |
| SiC2 v=0 | 11(2,9)-11(2,10) | 69.910 | 30Si34S v=0 | J=5-4 | 85.065 | |
| 30SiS v=0 | J=4-3 | 70.041 | 29SiO v=1 | J=2-1 | 85.167 | |
| 29SiC2 | 3(2,1)-2(2,0) | 70.242 | SiO v=2 | J=2-1 | 85.640 | |
| SiC2 v=0 | 3(0,3)-2(0,2) | 70.260 | 29SiO v=0 | J=2-1 | 85.759 | |
| Si34S v=0 | J=4-3 | 70.629 | SiO v=1 | J=2-1 | 86.243 | |
| SiC2 v=0 | 3(2,2)-2(2,1) | 70.763 | Si13CC | 4(1,4)-3(1,3) | 86.563 | |
| 29SiS v=0 | J=4-3 | 71.284 | SiO v=0 | J=2-1 | 86.847 | |
| SiC2 v=0 | 3(21)-2(20) | 71.302 | 30SiS v=0 | J=5-4 | 87.551 | |
| SiS v=3 | J=4-3 | 71.558 | Si34S v=0 | J=5-4 | 88.286 | |
| Si33S v=0 | J=4-3 | 71.595 | 29SiS v=0 | J=5-4 | 89.104 | |
| SiS v=2 | J=4-3 | 71.911 | SiS v=3 | J=5-4 | 89.446 | |
| SiS v=1 | J=4-3 | 72.265 | Si33S v=0 | J=5-4 | 89.489 | |
| SiS v=0 | J=4-3 | 72.618 | SiS v=2 | J=5-4 | 89.888 |
With a combined Band 2+3 receiver, simultaneous observations of several different important isotopologues of the most abundant elements can be obtained in one observational set-up. Simultaneous observations of lower frequency transitions are crucial for reliable abundance estimates, since they probe the outflowing cool gas on the largest scales. In particular, some of the lower transitions of the oxygen, silicon and sulfur isotopologues of SiO and SiS are only available within the frequency range of Band 2 (Table 2).
The circumstellar envelopes of mass-losing AGB stars within 500 pc (constituting a sample of a few hundred stars) range from a few to several tens of arcsecs on the largest scales. The larger primary beam at the lower frequencies is well matched to the size of the envelopes of the most extended, allowing their imaging without concerns about the primary beam attenuation or the need for mosaic observations.
4.4 Sunyaev-Zel’dovich Effect Observations of Galaxy Clusters
Galaxy clusters are among the largest gravitationally bound structures to form by the current epoch, and serve both as probes of cosmology and astrophysical laboratories for tests of plasma physics, shocks, the particle nature of dark matter, AGN lifecycles and feedback, and the impact of environment on galaxy evolution, to name a few examples. One exciting probe of the intracluster medium (ICM) – the hot ( K) X-ray emitting gas that comprises of a cluster’s total mass – is the thermal Sunyaev-Zel’dovich (SZ) effect (Sunyaev & Zeldovich (1972); for reviews, see Carlstrom et al. (2002); Kitayama (2014)). Due to the inverse Compton scattering of photons from the Cosmic Microwave Background (CMB), the SZ effect is proportional to the Compton parameter, which scales as the line of sight integral of electron pressure (). The SZ effect uniquely has redshift-independent surface brightness and manifests itself as a decrement in intensity (or brightness temperature) at frequencies below the peak in the CMB spectrum ( GHz). By contrast, X-ray emission suffers from cosmological dimming and scales as the line of sight integral of ICM density squared, meaning X-ray surface brightness declines rapidly with both cluster radius and redshift.
The SZ spectrum is a broadband continuum, resolvable over the same broad range of angular scales subtended by a galaxy cluster. Figure 15 (top) shows the relative magnitude of the SZ intensity in ALMA Bands 1–5 (i.e. GHz, where the SZ effect is a decrement), compared to typical dusty submm and radio synchrotron sources that can contaminate SZ measurements. Because the angular diameter distance is a slow function of redshift at intermediate and higher redshifts (), galaxy clusters at these distances typically subtend several arcminutes. The exception to this is the highest redshift clusters. Growing from the largest fluctuations in the primordial matter density power spectrum, these systems serve as powerful probes of cosmology and cluster evolution, and are lower mass than their nearby counterparts. Thanks to deep SZ, X-ray, and near-IR surveys, such systems are now being discovered at , which is near the turnover in . Here a cluster of a given physical size will subtend the smallest angular size, and the bulk SZ signal is often contained within 1-2’. Additionally, submillimeter surveys have discovered protoclusters (lower mass cluster precursors) as associations of dusty, star-forming galaxies. Bands 2 and 2+3 will serve as a powerful and sensitive tool for probing the SZ effect from such systems as they begin to virialize (Figure 15, lower panel). ALMA’s sensitivity in Band 2 may also allow detection of the SZ effect from individual galaxies. Massardi et al. 2008 predicted tens to hundreds of galaxies could be found in a 1 sq. degree survey with Band 2 through their SZ signatures, which would subtend scales. By stacking the Planck SZ signals from the locally brightest galaxies, recent work by Greco et al. 2015 has shown that galaxies with masses have SZ fluxes on the order of several tens to hundreds of Jy in Band 2, readily detectable in short ALMA observations.


Since ALMA Band 1 will have the largest field of view (), and therefore will recover the largest angular extents, the case has been made that it will be the best ALMA band for detection of galaxy clusters through the SZ effect (see e.g. the ALMA Band 1 science case). This argument strongly favors brightness temperature, which benefits from the larger beam size useful for detection of an extended source. However, for astrophysical studies we are often interested in features of a given angular scale or in a range of scales, and for that one must consider the flux density on these scales. Figure 15 (lower panel) shows that for studies of SZ features of a given angular size, a broad tuning that spans Band 2+3 will offer the highest sensitivity. The tuning setup shown considers likely upgrades to the ALMA digitizers and correlator, which will bring 16-GHz of total bandwidth in two 8-GHz sidebands separated by 8 GHz (i.e. by digitizing IF bands spanning 4-12 GHz).
A few of the cluster astrophysical studies that will benefit by the construction Band 2+3 are:
-
•
Studies of Shocks: Galaxy clusters assemble hierarchically by accreting filamentary gas and merging subclusters that drive shocks through the ICM. Of the three main thermodynamic parameters – temperature, density, and pressure – pressure is the most sensitive to a shock’s Mach number. As demonstrated in MUSTANG studies exploiting the 9” resolution of the 100-meter Green Bank Telescope (GBT) at 3.3 mm (e.g. Mason et al. (2010); Korngut et al. (2011) and more recently in ALMA Band 3 observations (e.g. Kitayama et al. (2016); Basu et al. (2016)), the SZ is a natural tool for detecting and characterizing the pressure discontinuity at a shock, particularly in high- clusters where cosmological dimming of X-ray surface brightness makes X-ray observations challenging and expensive. The differing line of sight dependence of the thermal SZ effect also offers a way to test X-ray modeling of shocks.
-
•
Studies of Cold Fronts: In many merging clusters, contact density discontinuities with no clear, associated pressure jumps have been observed. This is expected both inside the shock front where the density gradient steepens and in subsonic motions such as minor mergers that induce sloshing. In such features, called “cold fronts”, the jump in density is accompanied by a corresponding drop in temperature, keeping the thermal pressure roughly constant. If SZ observations were to reveal a discontinuity at a cold front, this would indicate some of the pressure balance across the front is due to non-thermal pressure, such as that due to turbulence and magnetic fields.
-
•
Studies of AGN-driven Radio Bubbles / X-ray Cavities: Feedback from AGN offsetting cooling flows is thought to occur primarily mechanically, through shocks driven by AGN jet-inflated bubbles. The SZ can both probe the shocks and, uniquely, determine the plasma composition in these radio bubbles (see Pfrommer et al. (2005)). Observations of the SZ signature from X-ray cavities can provide valuable insight into the nature of AGN feedback in galaxy clusters.
-
•
Studies of ICM Turbulence through Pressure Fluctuations: Turbulent motions in the intracluster medium have long been an open question for cluster astrophysics. These motions can contribute to the non-thermal pressure support not accounted for in X-ray mass estimates that assume thermal hydrostatic equilibrium (HSE). Turbulent motions in the ICM are thought to bias mass estimates by at radii typically used in cosmological studies.111This radius is typically , the radius within which the average density of the cluster exceeds the critical density of the Universe at the cluster redshift by 500. The nature of turbulent motions can also be used to place constraints on ICM viscosity and the scales of injection and dissipation, which are important parameters in hydrodynamic simulations that include cooling, mixing, and cluster magnetic fields.
Cluster astrophysicists have long sought for an X-ray microcalorimeter observatory to measure ICM motion (through X-ray line spectroscopy) and spectroscopic measurements of temperature fluctuations. However, with the loss of the Hitomi (Astro-H) X-ray satellite, the next opportunity for such an instrument may come no earlier than 2028 with the planned launch date for Athena. Measuring pressure fluctuations through the SZ power spectrum of galaxy clusters will probe cluster outskirts, which matter for reliable mass estimation, in the much nearer term, advancing the state of the art for ICM physics now.
-
•
Joint SZ/X-ray Surface Brightness Constraints on Cluster Temperature: The eROSITA X-ray satellite will soon launch, and will perform the first all-sky X-ray survey in nearly 3 decades. It is expected to detect clusters and groups of galaxies out to (Pillepich et al. (2012, 2015). With a detection limit of 50 photons, few of these detections will accumulate enough counts for X-ray spectroscopy. SZ flux measurements can provide confirmation, mass estimates through scaling relations, and a method for determining a cluster’s radial temperature profile. The combination of SZ and X-ray flux allows one to jointly probe cluster temperature (see e.g. Mroczkowski et al. (2009)) without relying on spectroscopy. Further, this combination can also be used to estimate roughly the cluster redshift (see Churazov et al. (2015)).
-
•
High redshift clusters and protoclusters Detection of the SZ effect from forming high- clusters and protoclusters with compact angular size, well-matched to the beam size in Band 2+3.
Recent studies (e.g. Sayers et al. (2013); Gralla et al. (2014); Planck Collaboration et al. (2014)) have shown that Band 2+3 is near the minimum in contamination from radio and submillimeter sources, while the broad coverage of Bands 2+3 will offer better spectral leverage for separating contamination from the SZ signal. For good sampling of a broad range of spatial scales in a cluster, which is required both for spatial dynamic range in imaging and for studies of the pressure power spectrum in clusters, the broad fractional bandwidth () offered by Bands 2+ and 2+3 will offer exceptionally good uv-coverage. Such high-fidelity imaging at high resolution (5” resolution, compared to the typical arcminute resolution of an SZ survey instrument) is also important for probing the sources of scatter in SZ–mass scaling relations used for cosmology.
4.5 VLBI
The millimetre very long baseline interferometry (VLBI) science enabled by a beamformer for ALMA has recently been discussed by Fish et al. (2013). Below we discuss the range of potential VLBI science applications for Band 2 or Band 2+3 with ALMA in conjunction with other millimetre telescopes. Although few other millimetre telescopes currently operate over the full frequency range of ALMA Band 2/2+3, the availability of this band and the resolution, baseline coverage and sensitivity which ALMA will be able to provide for VLBI will likely stimulate adoption of this frequency range at other telescopes. At IRAM receivers which extend well in to the Band 2 frequency range are already in development.
4.5.1 Masers
The intense and spatially compact emission from masers allows the study of regions at resolutions not possible in other, thermally excited, molecular lines. Several probable maser transitions of methanol (66.95, 68.31 GHz; Class II masers; Cragg et al. 2005) and formaldehyde (72.84 GHz), fall in ALMA Band 2. (A further four Class II and three Class I methanol masers are known in Band 3 (Müller et al. 2004).) Some of these lines have been detected (from Galactic star forming regions) with single dishes but knowledge of this spectral region is limited due to the current lack of facilities. Models of methanol by Cragg et al. (2005) are successful in explaining the location of masers which have been imaged at high resolution and the detection statistics and line profiles can be used to develop diagnostics for maser locations and evolutionary stages to within a few thousand years (Ellingsen et al. 2011).
The millimetre wavelength maser transitions have simpler spectra than those at lower frequency, suggesting that the high frequency lines come from more compact gas clumps, however the parameter space probed by Band 2 is barely tested by observations. The milli-arcsec resolution available with VLBI will constrain the physical conditions on AU size-scales at the typical distances of massive young stellar objects (MYSOs) by revealing which lines co-propagate as well as distinguishing between disc, outflow and infall regions complementing VLBI observations of the 6.7 GHz Class II methanol masers (e.g. Bartkiewicz et al. 2009).
Formaldehyde masers also arise from the vicinity of MYSOs but they are less common and less well-understood than methanol masers but the cm-wave transitions have been observed to arise from within a few arcseconds of methanol masers. However, few existing observations have had sufficient resolution to verify whether they co-propagate with the methanol masers, that is whether they arise from exactly the same gas. Araya et al. (2010) showed formaldehyde masers populating a gap in the distribution of methanol masers, suggesting a likely separation of AU. Formaldehyde is unusual in showing deep, anomalous absorption and there has been much debate on whether this is directly associated with the maser mechanism (e.g. Araya et al. 2008).
Periodic or quasi-periodic flares with periods from a few weeks to many months are a remarkable property of many methanol masers (e.g. Maswanganye & Gaylard 2012) and at least one formaldehyde maser (Araya et al. 2010), but the mechanism(s) driving the variations are the subject of much speculation. Small time delays between different components of the same source suggest that the cause is a disturbance propagating at a speed intermediate between the speed of light and bulk gas motion. This suggests that the variations are, for example, mediated by dust heating. Monitoring multiple frequencies at high resolution will show what changes in physical conditions are associated with flares. Early results from the Korean VLBI Network suggest that mm-wave methanol masers are also variable but only very limited studies have been done to date.
The transitions of SiO in Band 2 (Table 2) can also be masers. Almost all known examples of SiO masers arise in the envelopes of evolved stars (Gray 2012) where VLBI observations of the masers have been used to image and monitor the evolution of the stellar outflows (e.g. Gonidakis et al. 2010) and in one case determine a high precision parallax distance (Min et al. 2014). In addition, the polarization of SiO maser spots has been used to trace the morphology of the stellar magnetic field close to the stellar photosphere (e.g. Kemball & Diamond 1997). Predictions for the polarization of the SiO transitions in the ALMA frequency range show that lines in Band 2 reaching fractional linear polarizations of % (Pérez-Sánchez & Vlemmings 2013). However these simulations do not include some effects which could increase the degree of polarization, so, for example, although the models suggest % linear polarization in the SiO J=1–0 transition (which occurs in ALMA Band 1), observations have detected masers spots in this transition with close to 100% polarization (e.g. Amiri et al. 2012) while linear polarizations of up to 60% have been detected in the J=5-4 transitions (Vlemmings et al. 2011). Circularly polarized SiO maser emission has also been detected, and although some maser spots can be up to % polarized towards the star TX Cam, the median value is % (compared to a median linear polarization of %) (Kemball & Diamond 1997). For comparison, current VLBI measurements have an estimated circular polarization accuracy of % or better (Kemball & Richter 2011).
Formaldehyde is better known for the extragalactic masers detected at 4-5 GHz, notably in Arp 220 (e.g. Baan et al. 1993). Absorption and emission are seen and the maser pump is controversial (e.g. Baan 2007) since the mechanism suggested for megamasers would not work on the scale of individual star-forming regions. Emission from Band 2 transitions has been detected by single dishes but VLBI is needed to investigate these maser components.
4.5.2 Event Horizon
Falcke et al. (2012) summarise the meeting held to discuss VLBI with ALMA and its potential to study the Event Horizon around a black hole. Each frequency penetrates a different depth into the black hole environment. Full frequency coverage is needed to distinguish between changes in spectral index due to scattering or due to intrinsic changes in emitting material and relativistic effects. Although in Band 2 scattering will be a significant issue for Sgr A*, a study of M87 using Band 2 would probe the material at around Schwarzchild radii where the spectral energy distribution deviates from a power law and variability is increasingly rapidly (see Hada et al. 2012).
4.5.3 Jet Launching and Shocks
Each mm-VLBI frequency samples the jet-launching region around AGN to a unique depth, probing the launching of the jet and the associated shocks. These phenomena can be resolved on milliarcsecond scales. Good frequency coverage, including Band 2, is essential to trace the spectral curvature, identify the jet flaring region and avoid ambiguities in Faraday rotation analysis due to the polarization angle changing very rapidly with frequency (Porth et al. 2011). Resolved polarization images will tackle the question of the role of magnetic fields in jet collimation, including Faraday rotation mapping and controversial topics such as possible helicity. The polarization vector orientation constrains the shock model as well as the evolution of the magnetic field after flares (Orienti et al. 2013) which at millimetre wavelengths preceed gamma-ray flares suggesting that the millimetre flares arise further from the nucleus and are possibly related to superluminal ejections. Another controversy concerns whether the associated shocks are due to ballistic ejecta or perturbations in a more continuous jet.
The millimetre-VLBI and gamma-ray behaviour of Mrk 501 suggests, as-yet unconfirmed, more distant jet limb-brightening/knot excitation. The spectrum turns over at 15 GHz, and the flux density halves between ALMA Bands 1 and 3 so Band 2 VLBI provides an ideal balance of resolution and flux density (Giroletti et al. 2008). Examining the small-scale structure of compact active galaxies also tackles questions such as the origins of FRI’s and the evolution of BL Lac objects (e.g. Liuzzo et al. in prep.) where the SEDs are likely to show significant structure in the frequency range covered by Bands 2 and 3.
4.5.4 High-z Absorption Kinematics, Chemistry and Fundamental Constants
HI absorption has been mapped against the cores of a number of active galaxies, providing important high resolution kinematic information (e.g. Conway 1996). Similar CO and CII studies will allow comparisons between the different components of the gas closest to the core. Absorption in the low-J transitions of CO and other species can be imaged at as good, or better, resolution as emission at the highest ALMA frequencies.
Previous millimetre absorption studies towards the lensed quasar PKS1830-211 have provided a spectacular molecular inventory of 42 species and 14 isotopomers in a spiral Galaxy (ATCA survey, Muller et al. (2011)). These molecules can be used as probes of the gas physical conditions, in particular to measure the temperature of the cosmic microwave background as a function of redshift (Muller et al. 2013). The presence of multiple transitions from the same species, or from isotopomers, allows the investigation of cosmological variations in the fundamental constants of nature, since the line spacing is sensitive to variations in (the fine structure constant) or (the proton to electron mass ratio) (e.g. Bagdonaite et al. 2013; Murphy et al. 2008).
The high angular resolution of VLBI is crucial in order to resolve molecular absorption. Sub-parsec scale imaging is essential to ensure that the molecules are cospatial (Sato et al. 2013), thus avoiding kinematic and chemical biases in these analyses. Bands 2 and 3 are rich in low-energy transitions of numerous species and are well-suited for absorption studies (with bright continuum sources and high dynamic range achievable). At such small angular scales, the continuum emission is liable to be variable and the availability of a wide band is advantageous to allow as many species as possible to be observed within a short time interval.
4.6 Cold Complex Chemistry
Glycine (NH2CH2COOH) is the simplest of all amino acids. Its detection in the interstellar medium is thus of key importance to understand the formation mechanisms of pre-biotic molecules relevant to life and potentially the origin of life on Earth. For over a decade there have been extensive searches for glycine toward high-mass star forming regions such as the hot molecular cores in SgrB2(N), Orion KL and W51 e1/e2 (see Kuan et al. 2003), although these studies have not yielded any detection (Snyder et al. 2005; Cunningham et al. 2007; Jones et al. 2007). Glycine and other amino acids have however been found in meteorites (for example Wild 2; Elsila et al. 2009), consistent with the idea that amino acids could have an interstellar origin (Ehrenfreund & Charnley 2000).
Several challenges are faced in the search of glycine in high-mass star forming regions. The spectral line densities measured toward hot molecular cores are usually high, leading to a high level of line blending and thus, of line confusion. This is due to the fact that hot cores show a very rich chemistry in complex organic molecules driven by the thermal desorption of the mantles of dust grains at the high gas/dust temperatures found in these objects (100-200 K; Garay & Lizano 1999, see e.g.. The typical linewidths of molecular rotational lines in hot cores are several km s-1, which also prevents a clear identification of the glycine lines which are expected to be weak. In addition, previous studies mainly targeted glycine lines at frequencies >100 GHz because the energies of their upper levels () were K, i.e. similar to the temperatures found in hot cores (see e.g. Snyder et al. 2005). And for the transitions at lower frequencies (such as those in the 3mm band, between 85 and 105 GHz), previous interferometric observations were not sensitive enough and only provided upper limits to the total column density of glycine toward the SgrB2 hot molecular core (of cm-2; Jones et al. 2007).
4.6.1 Glycine in Low-mass Star Forming Regions
In contrast with their high-mass counterparts, low-mass star forming regions may be better suited for the detection of glycine in the interstellar medium for several reasons. The level of line confusion is expected to be low in low-mass star forming regions (especially at their early stages represented by pre-stellar cores) because the measured gas temperatures are K and thus the number of molecular rotational lines that can be excited at these temperatures is significantly smaller. In addition, the typical linewidths in low-mass cores are km s-1, which allows a more accurate identification of the observed transitions since the lines likely suffer less from line blending. Complex organic molecules such as propylene (CH2CHCH3) have indeed been detected toward molecular dark cores such as TMC-1 (Marcelino et al. 2007), suggesting that non-canonical chemical mechanisms could be playing a key role in the formation of these large molecules in the interstellar medium (Rawlings et al. 2013).

The high-sensitivity of ALMA opens up the possibility to detect a large number of complex organic molecules of biochemical interest such as glycine in low-mass star forming regions. ALMA has therefore the potential to provide new insight into the formation processes of pre-biotic molecules in Space and into their subsequent delivery onto planetary systems. Low-mass star forming objects at different stages in their evolution (such as the pre-stellar core L1554, the low-mass warm core (or hot corino) IRAS16293, and the protoplanetary disk TW Hya) should be targeted so that the different formation routes of glycine can be analysed in detail along the formation process of low-mass stars. As shown below, ALMA Band 2 is very well suited for the discovery of glycine in young sun-like systems, because it covers the lowest excitation transitions of this molecule with the highest possible Einstein A coefficients.
Most of the glycine transitions observed in previous studies toward hot molecular cores are found in the 1.3mm wavelength range (Snyder et al. 2005). This is due to the fact that their Einstein A coefficients are s-1, one order of magnitude higher than those of the 3mm lines. However, the values of the upper state energys, , for these transitions are K. In the frequency range between 65 and 116 GHz (i.e. Band 2+3), glycine (conformer I) has several rotational transitions whose energy levels lie below 25 K and whose Einstein A coefficients are s-1. The lowest frequency transition of glycine with an Einstein A coefficient s-1 is indeed located at 60873.034 MHz. For frequencies lower than 72 GHz, there are 10 glycine lines with K and an Einstein A coefficient s-1, with a further 48 lines below 90 GHz with Einstein A coefficient s-1 and K of which 37 have K. Note that we only refer to glycine conformer I because the ground vibrational level of glycine conformer II lies 700 cm-1 (i.e. K) above that of the conformer I.
| Line | Transition | Frequencya | Einstein A | Energy |
|---|---|---|---|---|
| (MHz) | ( s-1) | (K) | ||
| 1 | 67189.12 | 1.3 | 18.8 | |
| 2 | 68323.70 | 1.3 | 21.1 | |
| 3 | 71611.56 | 1.5 | 21.5 | |
| 4 | 71646.39 | 1.6 | 22.4 | |
| 5 | 71910.30 | 1.6 | 20.2 | |
| 6 | 72559.35 | 1.7 | 23.3 | |
| 7 | 72061.11 | 1.7 | 23.3 | |
| 8 | 72841.25 | 1.7 | 22.3 | |
| 9 | 78524.63 | 2.1 | 24.0 |
a Müller et al. (2005)
Figure 16 (upper panel) shows the LTE spectrum of glycine between 60 and 250 GHz towards the L1544 pre-stellar core. The spherically symmetric radiative transfer calculations used the physical structure of the L1544 core derived by Keto & Caselli (2010) and the gas-phase water abundance profile inferred by Caselli et al. (2012) toward this core. Glycine is assumed to desorb together with water, following its gas-phase abundance profile but scaled down by the fraction of glycine present in the ices (solid abundance of glycine with respect to water; Bernstein et al. 2002; Muñoz Caro et al. 2002). This translates into gas-phase abundances of for glycine in L1544 (Jiménez-Serra et al. 2014). The glycine emission is expected to arise from the innermost few thousand AU of L1544 corresponding to angular scales of ”. These scales can be easily imaged by ALMA in Band 2 in its compact configuration.
Figure 16 (upper panel) shows that several glycine lines in Band 2+3 have peak intensities mK. In particular, the brightest lines with intensities mK are found below 80 GHz (Table 3), making these transitions prime targets for ALMA Band 2. Since the molecular gas in L1544 is very cold, the higher energy levels of glycine are not populated efficiently, making the glycine lines in Band 4 and Band 6 very weak. The transitions below 80 GHz are therefore key to probing cold glycine at the early stages in the formation of low-mass stars.
For comparison, Figure 16 (lower panel) shows the LTE predicted spectrum of glycine from a massive, hot molecular core. For these calculations the physical structure of the AFGL2591 hot core derived by Jiménez-Serra et al. (2012) was adopted. It was assumed that glycine is evaporated fully from ices and therefore its abundance in the gas phase is (Jiménez-Serra et al. 2014).
Despite the larger abundance of glycine in hot sources, its transitions in Band 2+3 are factors of weaker in hot sources than in cold objects. This is mainly due to the lower efficiency when populating the low energy levels of glycine at temperatures K. Although the glycine lines in Band 4 and Band 6 are bright, line blending and line confusion present problems for the detection and identification of low-abundant species such as amino acids. These models show that with ALMA Band 2+3 receivers the discovery of glycine would be possible toward the coldest phases of the formation of Solar-type systems.
4.7 Solar System Science: Time Variability
An advantage of a broad instantaneous bandwidth is the ability to simultaneously observe transitions which vary in time such as from comets and other solar system bodies. For example, studying the SO and SO2 on Io where outgassing from volcanoes and the sublimation of SO2 frost drive the composition of the atmosphere (2014DPS....4641101M). Or probing the structure of the hydrocarbon rich atmosphere of Titan where HNC and HC3N trace different ranges of heights in the atmosphere (2014ApJ...795L..30C; 2018ApJ...859L..15C). As Figure 17 shows, Band 2+3 with 8 GHz per sideband enables the simultaneous observation of a range of SO and SO2 transitions as well as allowing the simultaneous observation of HNC J=1-0 and two different J transitions of HC3N. Simultaneous observations of multiple transitions of a species provide much better constraints on the varying excitation and abundance of a molecule than observations of single transitions. The wide range of species detected in comets probe the composition and history of some of the more primitive material in our solar system and recently, other, solar systems (2018ASPC..517...73C; 2020NatAs.tmp...84C). Their highly variable emission makes simultaneous observations of related species in comets essential for reliable relative abundance determinations to, for example, measure the deuteration fraction with its implication for the transport of volatile species in the early solar system. The value of Band 2+3 for deuterium measurements is discussed above in Section 3.
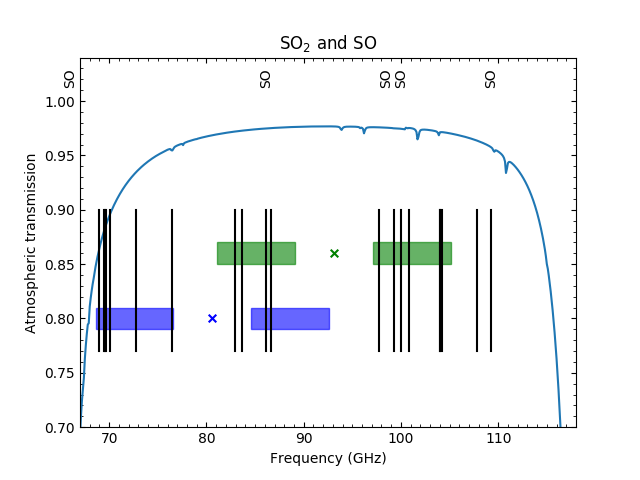
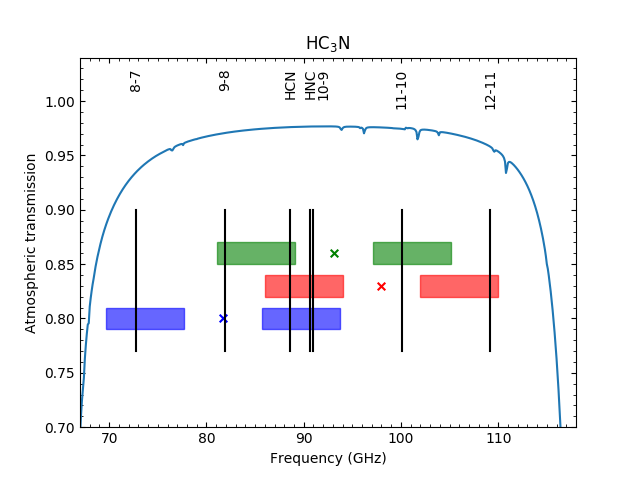
References
- Aalto et al. (2012) Aalto, S., Garcia-Burillo, S., Muller, S., et al. 2012, A&A, 537, A44
- Acero et al. (2009) Acero, F., Aharonian, F., Akhperjanian, A. G., et al. 2009, Science, 326, 1080
- Aladro et al. (2011) Aladro, R., Martín, S., Martín-Pintado, J., et al. 2011, A&A, 535, A84
- Aladro et al. (2012) Aladro, R., Viti, S., Riquelme, D., et al. 2012, Journal of Physics Conference Series, 372, 012039
- Amiri et al. (2012) Amiri, N., Vlemmings, W. H. T., Kemball, A. J., & van Langevelde, H. J. 2012, A&A, 538, A136
- Aravena et al. (2010) Aravena, M., Carilli, C., Daddi, E., et al. 2010, ApJ, 718, 177
- Araya et al. (2010) Araya, E. D., Hofner, P., Goss, W. M., et al. 2010, ApJ, 717, L133
- Araya et al. (2008) Araya, E. D., Hofner, P., Goss, W. M., et al. 2008, ApJS, 178, 330
- Arnaud et al. (2009) Arnaud, M., Bohringer, H., Jones, C., et al. 2009, in Astronomy, Vol. 2010, astro2010: The Astronomy and Astrophysics Decadal Survey, 4
- Baan (2007) Baan, W. A. 2007, in IAU Symposium, Vol. 242, IAU Symposium, ed. J. M. Chapman & W. A. Baan, 437–445
- Baan et al. (1993) Baan, W. A., Haschick, A. D., & Uglesich, R. 1993, ApJ, 415, 140
- Bagdonaite et al. (2013) Bagdonaite, J., Jansen, P., Henkel, C., et al. 2013, Science, 339, 46
- Bartkiewicz et al. (2009) Bartkiewicz, A., Szymczak, M., van Langevelde, H. J., Richards, A. M. S., & Pihlström, Y. M. 2009, A&A, 502, 155
- Basu et al. (2016) Basu, K., Sommer, M., Erler, J., et al. 2016, ApJ, 829, L23
- Bayet et al. (2010) Bayet, E., Awad, Z., & Viti, S. 2010, ApJ, 725, 214
- Bekki et al. (2002) Bekki, K., Couch, W. J., & Shioya, Y. 2002, ApJ, 577, 651
- Bennett et al. (2013) Bennett, C. L., Larson, D., Weiland, J. L., et al. 2013, ApJS, 208, 20
- Bernstein et al. (2002) Bernstein, M. P., Dworkin, J. P., Sandford, S. A., Cooper, G. W., & Allamandola, L. J. 2002, Nature, 416, 401
- Bigiel et al. (2008) Bigiel, F., Leroy, A., Walter, F., et al. 2008, AJ, 136, 2846
- Bolatto et al. (2013) Bolatto, A. D., Wolfire, M., & Leroy, A. K. 2013, ARA&A, 51, 207
- Bundy et al. (2006) Bundy, K., Ellis, R. S., Conselice, C. J., et al. 2006, ApJ, 651, 120
- Busso et al. (1999) Busso, M., Gallino, R., & Wasserburg, G. J. 1999, ARA&A, 37, 239
- Carilli et al. (2005) Carilli, C. L., Solomon, P., Vanden Bout, P., et al. 2005, ApJ, 618, 586
- Carlstrom et al. (2002) Carlstrom, J. E., Holder, G. P., & Reese, E. D. 2002, ARA&A, 40, 643
- Casasola et al. (2013) Casasola, V., Magrini, L., Combes, F., et al. 2013, A&A, 558, A60
- Caselli (2011) Caselli, P. 2011, in IAU Symposium, Vol. 280, IAU Symposium, ed. J. Cernicharo & R. Bachiller, 19–32
- Caselli & Ceccarelli (2012) Caselli, P. & Ceccarelli, C. 2012, A&A Rev., 20, 56
- Caselli et al. (2012) Caselli, P., Keto, E., Bergin, E. A., et al. 2012, ApJ, 759, L37
- Caselli et al. (1999) Caselli, P., Walmsley, C. M., Tafalla, M., Dore, L., & Myers, P. C. 1999, ApJ, 523, L165
- Caselli et al. (2002) Caselli, P., Walmsley, C. M., Zucconi, A., et al. 2002, ApJ, 565, 344
- Ceccarelli et al. (1998) Ceccarelli, C., Castets, A., Loinard, L., Caux, E., & Tielens, A. G. G. M. 1998, A&A, 338, L43
- Chapman et al. (2005) Chapman, S. C., Blain, A. W., Smail, I., & Ivison, R. J. 2005, ApJ, 622, 772
- Churazov et al. (2015) Churazov, E., Vikhlinin, A., & Sunyaev, R. 2015, MNRAS, 450, 1984
- Cicone et al. (2012) Cicone, C., Feruglio, C., Maiolino, R., et al. 2012, A&A, 543, A99
- Ciesla (2007) Ciesla, F. J. 2007, ApJ, 654, L159
- Combes et al. (2011) Combes, F., García-Burillo, S., Braine, J., et al. 2011, A&A, 528, A124
- Conway (1996) Conway, J. E. 1996, in IAU Symposium, Vol. 175, Extragalactic Radio Sources, ed. R. D. Ekers, C. Fanti, & L. Padrielli, 92
- Cragg et al. (2005) Cragg, D. M., Sobolev, A. M., & Godfrey, P. D. 2005, MNRAS, 360, 533
- Crapsi et al. (2005) Crapsi, A., Caselli, P., Walmsley, C. M., et al. 2005, ApJ, 619, 379
- Crapsi et al. (2007) Crapsi, A., Caselli, P., Walmsley, M. C., & Tafalla, M. 2007, A&A, 470, 221
- Cunningham et al. (2007) Cunningham, M. R., Jones, P. A., Godfrey, P. D., et al. 2007, MNRAS, 376, 1201
- Daddi et al. (2010a) Daddi, E., Bournaud, F., Walter, F., et al. 2010a, ApJ, 713, 686
- Daddi et al. (2008) Daddi, E., Dannerbauer, H., Elbaz, D., et al. 2008, ApJ, 673, L21
- Daddi et al. (2010b) Daddi, E., Elbaz, D., Walter, F., et al. 2010b, ApJ, 714, L118
- Danielson et al. (2011) Danielson, A. L. R., Swinbank, A. M., Smail, I., et al. 2011, MNRAS, 410, 1687
- Dannerbauer et al. (2009) Dannerbauer, H., Daddi, E., Riechers, D. A., et al. 2009, ApJ, 698, L178
- De Lucia et al. (2010) De Lucia, G., Boylan-Kolchin, M., Benson, A. J., Fontanot, F., & Monaco, P. 2010, MNRAS, 406, 1533
- Draine (2003) Draine, B. T. 2003, ARA&A, 41, 241
- Draine (2006) Draine, B. T. 2006, ApJ, 636, 1114
- Ehrenfreund & Charnley (2000) Ehrenfreund, P. & Charnley, S. B. 2000, ARA&A, 38, 427
- Ellingsen et al. (2011) Ellingsen, S. P., Breen, S. L., Sobolev, A. M., et al. 2011, ApJ, 742, 109
- Ellingson et al. (2001) Ellingson, E., Lin, H., Yee, H. K. C., & Carlberg, R. G. 2001, ApJ, 547, 609
- Elsila et al. (2009) Elsila, J. E., Glavin, D. P., & Dworkin, J. P. 2009, Meteoritics and Planetary Science, 44, 1323
- Emprechtinger et al. (2009) Emprechtinger, M., Caselli, P., Volgenau, N. H., Stutzki, J., & Wiedner, M. C. 2009, A&A, 493, 89
- Falcke et al. (2012) Falcke, H., Laing, R., Testi, L., & Zensus, A. 2012, The Messenger, 149, 50
- Feruglio et al. (2010) Feruglio, C., Maiolino, R., Piconcelli, E., et al. 2010, A&A, 518, L155
- Fish et al. (2013) Fish, V., Alef, W., Anderson, J., et al. 2013, ArXiv e-prints [arXiv:1309.3519]
- Fontani et al. (2011) Fontani, F., Palau, A., Caselli, P., et al. 2011, A&A, 529, L7
- Fontani et al. (2014) Fontani, F., Sakai, T., Furuya, K., et al. 2014, MNRAS, 440, 448
- Galván-Madrid et al. (2012) Galván-Madrid, R., Goddi, C., & Rodríguez, L. F. 2012, A&A, 547, L3
- Gao & Solomon (2004a) Gao, Y. & Solomon, P. M. 2004a, ApJS, 152, 63
- Gao & Solomon (2004b) Gao, Y. & Solomon, P. M. 2004b, ApJ, 606, 271
- Garay & Lizano (1999) Garay, G. & Lizano, S. 1999, PASP, 111, 1049
- García-Burillo et al. (2012) García-Burillo, S., Usero, A., Alonso-Herrero, A., et al. 2012, A&A, 539, A8
- Geach et al. (2009) Geach, J. E., Smail, I., Coppin, K., et al. 2009, MNRAS, 395, L62
- Genzel et al. (2012) Genzel, R., Tacconi, L. J., Combes, F., et al. 2012, ApJ, 746, 69
- Genzel et al. (2010) Genzel, R., Tacconi, L. J., Gracia-Carpio, J., et al. 2010, MNRAS, 407, 2091
- Giroletti et al. (2008) Giroletti, M., Giovannini, G., Cotton, W. D., et al. 2008, A&A, 488, 905
- Glover & Mac Low (2011) Glover, S. C. O. & Mac Low, M.-M. 2011, MNRAS, 412, 337
- Gómez et al. (2003) Gómez, P. L., Nichol, R. C., Miller, C. J., et al. 2003, ApJ, 584, 210
- Gonidakis et al. (2010) Gonidakis, I., Diamond, P. J., & Kemball, A. J. 2010, MNRAS, 406, 395
- Graciá-Carpio et al. (2006) Graciá-Carpio, J., García-Burillo, S., Planesas, P., & Colina, L. 2006, ApJ, 640, L135
- Gralla et al. (2014) Gralla, M. B., Crichton, D., Marriage, T. A., et al. 2014, MNRAS, 445, 460
- Gray (2012) Gray, M. 2012, Maser Sources in Astrophysics (Cambridge University Press)
- Gunn & Gott (1972) Gunn, J. E. & Gott, III, J. R. 1972, ApJ, 176, 1
- Hada et al. (2012) Hada, K., Kino, M., Nagai, H., et al. 2012, ApJ, 760, 52
- Harris et al. (1987) Harris, M. J., Lambert, D. L., Hinkle, K. H., Gustafsson, B., & Eriksson, K. 1987, ApJ, 316, 294
- Hartogh et al. (2011) Hartogh, P., Lis, D. C., Bockelée-Morvan, D., et al. 2011, Nature, 478, 218
- Hashimoto et al. (1998) Hashimoto, Y., Oemler, Jr., A., Lin, H., & Tucker, D. L. 1998, ApJ, 499, 589
- Ishibashi & Fabian (2012) Ishibashi, W. & Fabian, A. C. 2012, MNRAS, 427, 2998
- Ivison et al. (2011) Ivison, R. J., Papadopoulos, P. P., Smail, I., et al. 2011, MNRAS, 412, 1913
- Jablonka et al. (2013) Jablonka, P., Combes, F., Rines, K., Finn, R., & Welch, T. 2013, A&A, 557, A103
- Jiménez-Serra et al. (2014) Jiménez-Serra, I., testi, L., Caselli, P., & Viti, S. 2014, ApJ, 787, L33
- Jiménez-Serra et al. (2012) Jiménez-Serra, I., Zhang, Q., Viti, S., Martín-Pintado, J., & de Wit, W.-J. 2012, ApJ, 753, 34
- Jones et al. (2007) Jones, P. A., Cunningham, M. R., Godfrey, P. D., & Cragg, D. M. 2007, MNRAS, 374, 579
- Kemball & Diamond (1997) Kemball, A. J. & Diamond, P. J. 1997, ApJ, 481, L111
- Kemball & Richter (2011) Kemball, A. J. & Richter, L. 2011, A&A, 533, A26
- Keto & Caselli (2008) Keto, E. & Caselli, P. 2008, ApJ, 683, 238
- Keto & Caselli (2010) Keto, E. & Caselli, P. 2010, MNRAS, 402, 1625
- Keto & Wood (2006) Keto, E. & Wood, K. 2006, ApJ, 637, 850
- Keto et al. (2008) Keto, E., Zhang, Q., & Kurtz, S. 2008, ApJ, 672, 423
- Kitayama (2014) Kitayama, T. 2014, Progress of Theoretical and Experimental Physics, 2014, 06B111
- Kitayama et al. (2016) Kitayama, T., Ueda, S., Takakuwa, S., et al. 2016, PASJ, 68, 88
- Korngut et al. (2011) Korngut, P. M., Dicker, S. R., Reese, E. D., et al. 2011, ApJ, 734, 10
- Kuan et al. (2003) Kuan, Y.-J., Charnley, S. B., Huang, H.-C., Tseng, W.-L., & Kisiel, Z. 2003, ApJ, 593, 848
- Kurtz (2005) Kurtz, S. 2005, in IAU Symposium, Vol. 227, Massive Star Birth: A Crossroads of Astrophysics, ed. R. Cesaroni, M. Felli, E. Churchwell, & M. Walmsley, 111–119
- Lackington et al. (2016) Lackington, M., Fuller, G. A., Pineda, J. E., et al. 2016, MNRAS, 455, 806
- Lambert et al. (1986) Lambert, D. L., Gustafsson, B., Eriksson, K., & Hinkle, K. H. 1986, ApJS, 62, 373
- Larson et al. (1980) Larson, R. B., Tinsley, B. M., & Caldwell, C. N. 1980, ApJ, 237, 692
- Lewis et al. (2013) Lewis, K. M., Lugaro, M., Gibson, B. K., & Pilkington, K. 2013, ApJ, 768, L19
- Linsky (1998) Linsky, J. L. 1998, Space Sci. Rev., 84, 285
- Lis et al. (2002) Lis, D. C., Roueff, E., Gerin, M., et al. 2002, ApJ, 571, L55
- Maeder (1992) Maeder, A. 1992, A&A, 264, 105
- Maloney & Black (1988) Maloney, P. & Black, J. H. 1988, ApJ, 325, 389
- Marcelino et al. (2007) Marcelino, N., Cernicharo, J., Agúndez, M., et al. 2007, ApJ, 665, L127
- Martín et al. (2011) Martín, S., Krips, M., Martín-Pintado, J., et al. 2011, A&A, 527, A36
- Martín et al. (2006) Martín, S., Mauersberger, R., Martín-Pintado, J., Henkel, C., & García-Burillo, S. 2006, ApJS, 164, 450
- Mason et al. (2010) Mason, B. S., Dicker, S. R., Korngut, P. M., et al. 2010, ApJ, 716, 739
- Maswanganye & Gaylard (2012) Maswanganye, J. P. & Gaylard, M. J. 2012, in IAU Symposium, Vol. 287, IAU Symposium, ed. R. S. Booth, W. H. T. Vlemmings, & E. M. L. Humphreys, 108–109
- Matsumura et al. (2009) Matsumura, S., Pudritz, R. E., & Thommes, E. W. 2009, ApJ, 691, 1764
- Min et al. (2014) Min, C., Matsumoto, N., Kim, M. K., et al. 2014, PASJ, 66, 38
- Moran et al. (2007) Moran, S. M., Ellis, R. S., Treu, T., et al. 2007, ApJ, 671, 1503
- Mroczkowski et al. (2009) Mroczkowski, T., Bonamente, M., Carlstrom, J. E., et al. 2009, ApJ, 694, 1034
- Muñoz Caro et al. (2002) Muñoz Caro, G. M., Meierhenrich, U. J., Schutte, W. A., et al. 2002, Nature, 416, 403
- Müller et al. (2004) Müller, H. S. P., Menten, K. M., & Mäder, H. 2004, A&A, 428, 1019
- Müller et al. (2005) Müller, H. S. P., Schlöder, F., Stutzki, J., & Winnewisser, G. 2005, Journal of Molecular Structure, 742, 215
- Muller et al. (2013) Muller, S., Beelen, A., Black, J. H., et al. 2013, A&A, 551, A109
- Muller et al. (2011) Muller, S., Beelen, A., Guélin, M., et al. 2011, A&A, 535, A103
- Murphy et al. (2008) Murphy, M. T., Flambaum, V. V., Muller, S., & Henkel, C. 2008, Science, 320, 1611
- Narayanan et al. (2012) Narayanan, D., Bothwell, M., & Davé, R. 2012, MNRAS, 426, 1178
- Natta et al. (2007) Natta, A., Testi, L., Calvet, N., et al. 2007, Protostars and Planets V, 767
- Öberg et al. (2011a) Öberg, K. I., Murray-Clay, R., & Bergin, E. A. 2011a, ApJ, 743, L16
- Öberg et al. (2011b) Öberg, K. I., Qi, C., Wilner, D. J., & Andrews, S. M. 2011b, ApJ, 743, 152
- Öberg et al. (2012) Öberg, K. I., Qi, C., Wilner, D. J., & Hogerheijde, M. R. 2012, ApJ, 749, 162
- Okuzumi & Hirose (2012) Okuzumi, S. & Hirose, S. 2012, ApJ, 753, L8
- Orienti et al. (2013) Orienti, M., Koyama, S., D’Ammando, F., et al. 2013, MNRAS, 428, 2418
- Paine (2017) Paine, S. 2017, The am atmospheric model (v. 9.2)
- Papadopoulos (2007) Papadopoulos, P. P. 2007, ApJ, 656, 792
- Papadopoulos (2010) Papadopoulos, P. P. 2010, ApJ, 720, 226
- Papadopoulos et al. (2011) Papadopoulos, P. P., Thi, W.-F., Miniati, F., & Viti, S. 2011, MNRAS, 414, 1705
- Parise et al. (2009) Parise, B., Leurini, S., Schilke, P., et al. 2009, A&A, 508, 737
- Patel et al. (2009) Patel, S. G., Holden, B. P., Kelson, D. D., Illingworth, G. D., & Franx, M. 2009, ApJ, 705, L67
- Pérez et al. (2012) Pérez, L. M., Carpenter, J. M., Chandler, C. J., et al. 2012, ApJ, 760, L17
- Pérez-Sánchez & Vlemmings (2013) Pérez-Sánchez, A. F. & Vlemmings, W. H. T. 2013, A&A, 551, A15
- Peters et al. (2012) Peters, T., Longmore, S. N., & Dullemond, C. P. 2012, MNRAS, 425, 2352
- Pfrommer et al. (2005) Pfrommer, C., Enßlin, T. A., & Sarazin, C. L. 2005, A&A, 430, 799
- Pillepich et al. (2015) Pillepich, A., Mohammed, I., Porciani, C., & Reiprich, T. 2015, IAU General Assembly, 22, 2257162
- Pillepich et al. (2012) Pillepich, A., Porciani, C., & Reiprich, T. H. 2012, MNRAS, 422, 44
- Pinilla et al. (2012) Pinilla, P., Birnstiel, T., Ricci, L., et al. 2012, A&A, 538, A114
- Planck Collaboration et al. (2014) Planck Collaboration, Ade, P. A. R., Aghanim, N., et al. 2014, A&A, 565, A103
- Porth et al. (2011) Porth, O., Fendt, C., Meliani, Z., & Vaidya, B. 2011, ApJ, 737, 42
- Qi et al. (2013) Qi, C., Öberg, K. I., & Wilner, D. J. 2013, ApJ, 765, 34
- Rawlings et al. (2013) Rawlings, J. M. C., Williams, D. A., Viti, S., Cecchi-Pestellini, C., & Duley, W. W. 2013, MNRAS, 430, 264
- Reddy et al. (2008) Reddy, N. A., Steidel, C. C., Pettini, M., et al. 2008, ApJS, 175, 48
- Requena-Torres et al. (2011) Requena-Torres, M. A., Güsten, R., Martín-Pintado, J., et al. 2011, in EAS Publications Series, Vol. 52, EAS Publications Series, ed. M. Röllig, R. Simon, V. Ossenkopf, & J. Stutzki, 299–300
- Riechers et al. (2007) Riechers, D. A., Walter, F., Carilli, C. L., & Bertoldi, F. 2007, ApJ, 671, L13
- Riechers et al. (2006) Riechers, D. A., Walter, F., Carilli, C. L., et al. 2006, ApJ, 645, L13
- Ros & Johansen (2013) Ros, K. & Johansen, A. 2013, A&A, 552, A137
- Sato et al. (2013) Sato, M., Reid, M. J., Menten, K. M., & Carilli, C. L. 2013, ApJ, 764, 132
- Sayers et al. (2013) Sayers, J., Mroczkowski, T., Czakon, N. G., et al. 2013, ApJ, 764, 152
- Schöier & Olofsson (2000) Schöier, F. L. & Olofsson, H. 2000, A&A, 359, 586
- Shapley (2011) Shapley, A. E. 2011, ARA&A, 49, 525
- Silk (2013) Silk, J. 2013, ApJ, 772, 112
- Snyder et al. (2005) Snyder, L. E., Lovas, F. J., Hollis, J. M., et al. 2005, ApJ, 619, 914
- Solomon et al. (2003) Solomon, P., Vanden Bout, P., Carilli, C., & Guelin, M. 2003, Nature, 426, 636
- Suchkov et al. (1993) Suchkov, A., Allen, R. J., & Heckman, T. M. 1993, ApJ, 413, 542
- Sunyaev & Zeldovich (1972) Sunyaev, R. A. & Zeldovich, Y. B. 1972, Comments on Astrophysics and Space Physics, 4, 173
- Swinbank et al. (2012) Swinbank, A. M., Karim, A., Smail, I., et al. 2012, MNRAS, 427, 1066
- Tacconi et al. (2010) Tacconi, L. J., Genzel, R., Neri, R., et al. 2010, Nature, 463, 781
- Tacconi et al. (2008) Tacconi, L. J., Genzel, R., Smail, I., et al. 2008, ApJ, 680, 246
- Tacconi et al. (2013) Tacconi, L. J., Neri, R., Genzel, R., et al. 2013, ApJ, 768, 74
- Tielens (1983) Tielens, A. G. G. M. 1983, A&A, 119, 177
- Tobin et al. (2013) Tobin, J. J., Bergin, E. A., Hartmann, L., et al. 2013, ApJ, 765, 18
- van der Marel et al. (2013) van der Marel, N., van Dishoeck, E. F., Bruderer, S., et al. 2013, Science, 340, 1199
- Vanden Bout et al. (2004) Vanden Bout, P. A., Solomon, P. M., & Maddalena, R. J. 2004, ApJ, 614, L97
- Vastel et al. (2006) Vastel, C., Caselli, P., Ceccarelli, C., et al. 2006, ApJ, 645, 1198
- VERITAS Collaboration et al. (2009) VERITAS Collaboration, Acciari, V. A., Aliu, E., et al. 2009, Nature, 462, 770
- Verley et al. (2010) Verley, S., Corbelli, E., Giovanardi, C., & Hunt, L. K. 2010, A&A, 510, A64
- Vlemmings et al. (2011) Vlemmings, W. H. T., Humphreys, E. M. L., & Franco-Hernández, R. 2011, ApJ, 728, 149
- Wagg et al. (2012) Wagg, J., Pope, A., Alberts, S., et al. 2012, ApJ, 752, 91
- Wagg et al. (2005) Wagg, J., Wilner, D. J., Neri, R., Downes, D., & Wiklind, T. 2005, ApJ, 634, L13
- Walmsley et al. (2004) Walmsley, C. M., Flower, D. R., & Pineau des Forêts, G. 2004, A&A, 418, 1035
- Ward-Thompson et al. (1999) Ward-Thompson, D., Motte, F., & Andre, P. 1999, MNRAS, 305, 143
- Watson (1974) Watson, W. D. 1974, ApJ, 188, 35
- Weinmann et al. (2012) Weinmann, S. M., Pasquali, A., Oppenheimer, B. D., et al. 2012, MNRAS, 426, 2797
- Weiß et al. (2013) Weiß, A., De Breuck, C., Marrone, D. P., et al. 2013, ApJ, 767, 88
- Weiß et al. (2005) Weiß, A., Downes, D., Walter, F., & Henkel, C. 2005, A&A, 440, L45
- Weiß et al. (2009) Weiß, A., Ivison, R. J., Downes, D., et al. 2009, ApJ, 705, L45
- Wong & Blitz (2002) Wong, T. & Blitz, L. 2002, ApJ, 569, 157
- Wood & Churchwell (1989) Wood, D. O. S. & Churchwell, E. 1989, ApJ, 340, 265
- Zubovas et al. (2013) Zubovas, K., Nayakshin, S., King, A., & Wilkinson, M. 2013, MNRAS, 433, 3079