The 63Ni(n,) cross section measured with DANCE
Abstract
The neutron capture cross section of the s-process branch nucleus 63Ni affects the abundances of other nuclei in its region, especially 63Cu and 64Zn. In order to determine the energy dependent neutron capture cross section in the astrophysical energy region, an experiment at the Los Alamos National Laboratory has been performed using the calorimetric 4 BaF2 array DANCE. The (n,) cross section of 63Ni has been determined relative to the well known 197Au standard with uncertainties below 15%. Various 63Ni resonances have been identified based on the Q-value. Furthermore, the s-process sensitivity of the new values was analyzed with the new network calculation tool NETZ.
pacs:
25.40.Lw, 29.40.Vj, 29.25.Dz, 28.41.Kw, 25.40.-h, 26.20.Kn, 97.10.CnI Introduction
Nearly all of the observed abundances of elements heavier than iron are either formed by the s- or the r-process in almost equal shares. The specific s-process path depends on temperatures and neutron densities in stars, neutron capture cross sections (CS), and half-lives in case of unstable isotopes Reifarth et al. (2014). Some of those unstable isotopes in the s-process path play a particular role. They act as branching points when neutron capture and -decay compete, creating different possible ways for the nucleosynthesis mass flow. This branching affects the isotopic abundances of the heavier elements in the s-process Käppeler et al. (2011); Pignatari et al. (2010). Therefore, it is important to know the capture CS for these isotopes. 63Ni with a half-life of 100 yrs is one of these branching points (see figure 1). The mass flow can either proceed from 63Ni to 64Ni via neutron capture, or via beta decay to 63Cu.
From the astrophysical point of view there are two scenarios where this branching plays a role: The first are low-mass stars on the asymptotic giant branch (AGB) in a stage of thermal pulses during the He-shell burning phase, where current models consider two neutron sources Herwig (2005). Those are based on the reactions 13C(,n)16O and 22Ne(,n)25Mg which provide neutron densities of up to at a temperature of K and at K, respectively Busso et al. (1999); Heil et al. (2008). The second scenario is massive stars in a later stage of development. When they reach the He-core burning phase and later the convective C-shell burning phase, the 22Ne(,n)25Mg reaction provides around at K and at K, respectively.
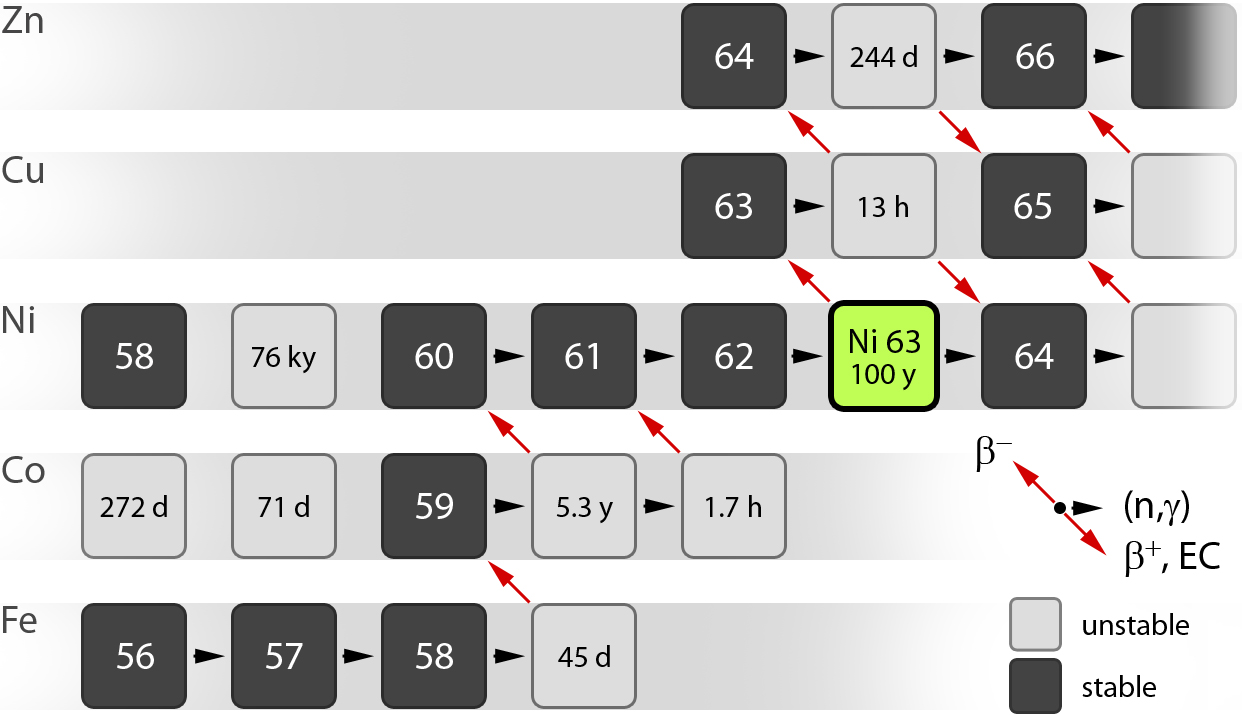
In the context of the solar abundance pattern, the s-process in massive stars is of major interest, since its signature dominates the nickel region. In the near future the analysis of isotopic nickel abundances in presolar SiC grains will become possible and the 63Ni CS can also help to constrain the s-process models for AGB stars Stephan et al. (2012a, b).
Until now, there was only one experimental CS dataset Lederer et al. (2013) and theoretical predictions Dillmann et al. (2008). In order to determine the energy dependent neutron capture CS in the astrophysical energy region from to 100 keV, an experiment at the Los Alamos National Laboratory has been performed using the time-of-flight technique and the calorimetric 4 BaF2 detector array DANCE, the Detector for Advanced Neutron Capture Experiments Reifarth et al. (2004). Various 63Ni resonances have been identified via the Q-value. The following sections describe the experimental approach for measuring the 63Ni neutron capture CS.
II Experiment
The neutron capture experiment with 63Ni was performed at the experimental area of flight path 14 (FP14) at the Manuel Lujan Jr. Neutron Scattering Center at the Los Alamos Neutron Science CEnter (LANSCE). The facility offers a white spallation neutron source, driven by a 100 A pulsed proton beam at a repetition rate of 20 Hz.
II.1 The DANCE array
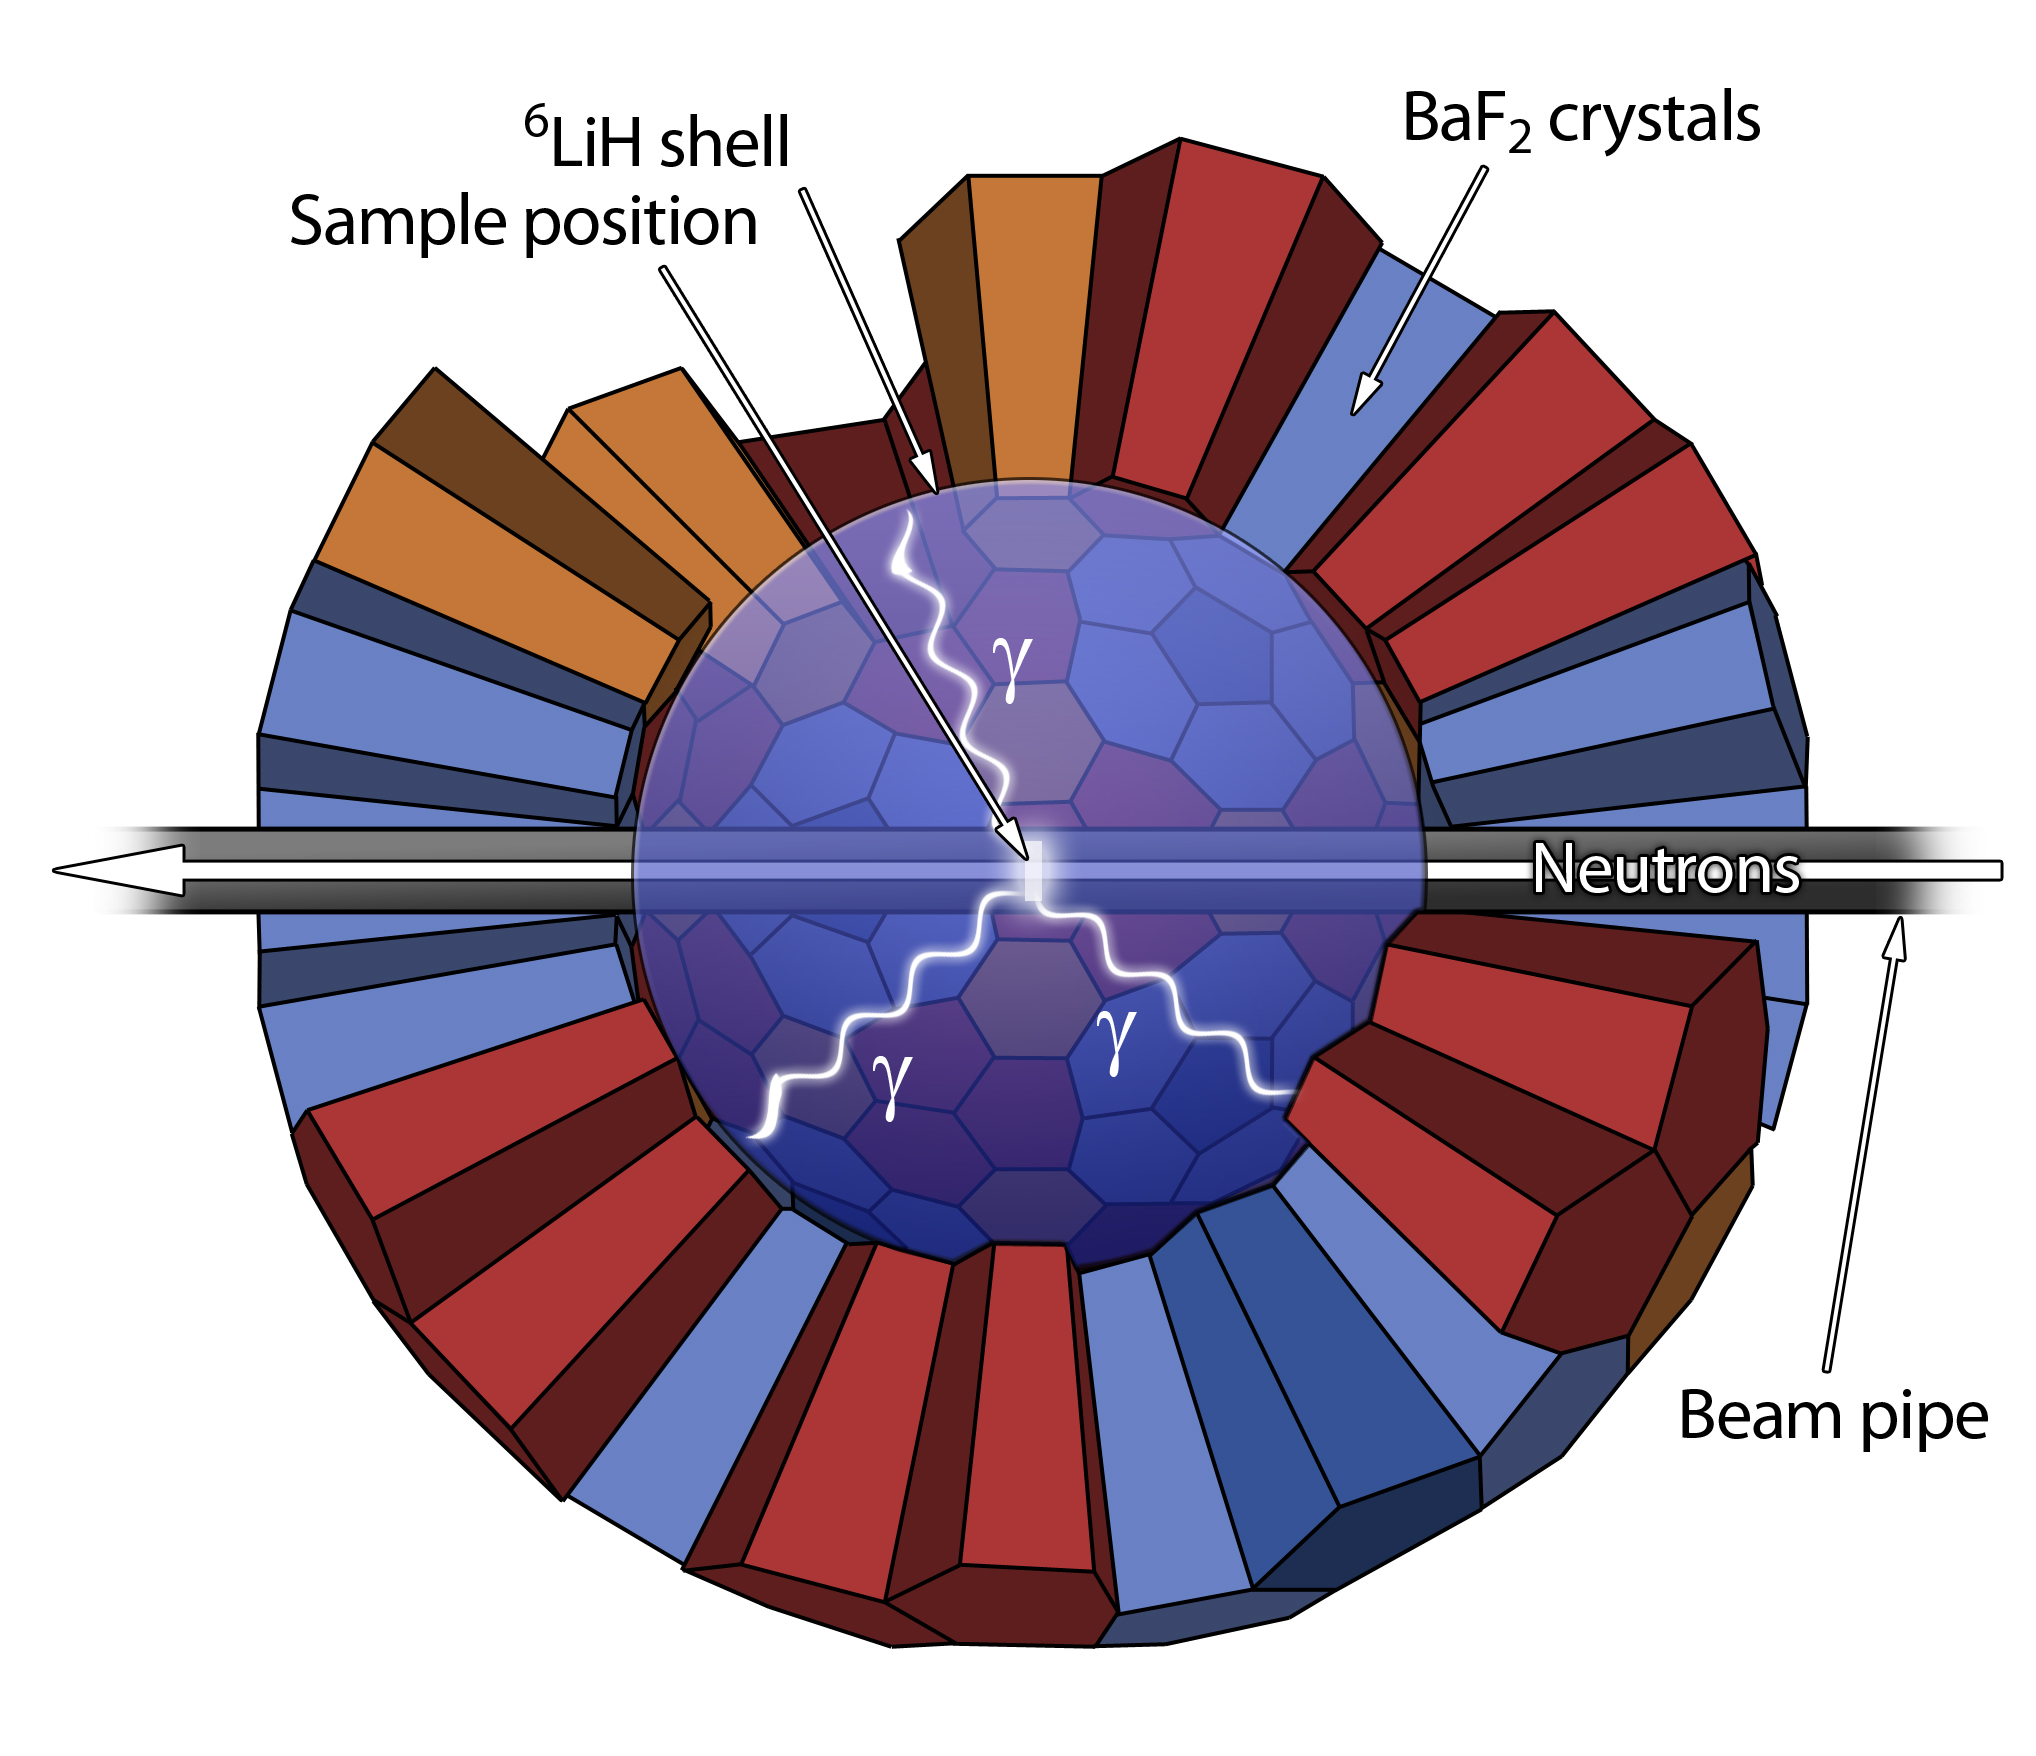
The prompt rays from 63Ni(n,) capture events were detected with DANCE – a high efficiency detector for cascades able to run in a calorimetric mode. The array consists of 160 spherically arranged BaF2-crystals (fig. 2) covering a solid angle of = 3.6 Esch et al. (2008). The full geometry contains 162 crystals, but for practical reasons two have to be left out for the beam pipe. The inner and outer radii of the BaF2 sphere are 17 cm and 32 cm. The space between the beam pipe and the crystals is filled with a 6LiH spherical shell, which significantly reduces the background induced by scattered neutrons captured in the crystals. This is very important, since capture CS are usually smaller than scattering CS Reifarth et al. (2004).
Summing over all energy deposited from a capture event allows to distinguish between captures on different isotopes based on their reaction Q-values. Additionally, the high segmentation is beneficial when high count rates are expected, and the ray multiplicity can be used to improve the discrimination of background.
II.2 Data acquisition and signal processing
The digitalization of the photomultiplier signals from individual detectors is done with Acqiris DC265 modules with 8 bit dynamic range. The data acquisition runs with a readout rate of 500 MHz. Thus, the BaF2 scintillation pulse shapes were sampled in 2 ns time steps and analyzed right away. Only the time and energy information was stored in order to reduce the data volume, which was done with MIDAS (Maximum Integration Data Acquisition System). A more detailed description of the data acquisition system of DANCE is given in Wouters et al. (2006). Afterwards, the MIDAS data files were processed offline with FARE Wu et al. (2012). With a definable coincidence window, the time information of each gamma detection was used to build capture events within that time window. All events then possess certain properties useful for analysis:
-
•
Energy value with long integration time for slow scintillation component of BaF2 (), deposited by a radiated after capture.
-
•
Energy value with short integration time for fast scintillation component of BaF2 (), deposited by a radiated after capture.
-
•
Total energy (): Sum over all of one event.
-
•
Crystal multiplicity (): Number of detector modules, that have responded.
-
•
Cluster multiplicity (): Number of detector module groups, that have responded. Neighboring crystals are combined to clusters.
-
•
Neutron energy via time-of-flight (TOF) method with a flight path length of 20.29 m.
Further spectral analysis was performed with the ROOT software Brun and Rademakers (1997).
II.3 Intrinsic Detector Background
BaF2 scintillators suffer from an intrinsic background because of an unavoidable contamination with 226Ra and its decay chain via 222Rn, 218Po, and 214Po. They all produce signals, when particles are emitted and interact with the crystals. In BaF2 crystals rays deposit about 15% of their energy in the fast component of the pulse, with a decay time of less than a nanosecond. On the other hand, when an particle interacts with the crystal, the resulting pulse shape features no fast component. Therefore, by analyzing the scintillation pulse shapes it is possible to identify and discriminate -signals Lanzan et al. (1992).
In the case of the DANCE data analysis, the identification is done via two different integration times leading to the ratio . Figure 3 shows the corresponding separation of events from and detections, which allowed the almost perfect suppression of -events.
II.4 The neutron flux at DANCE
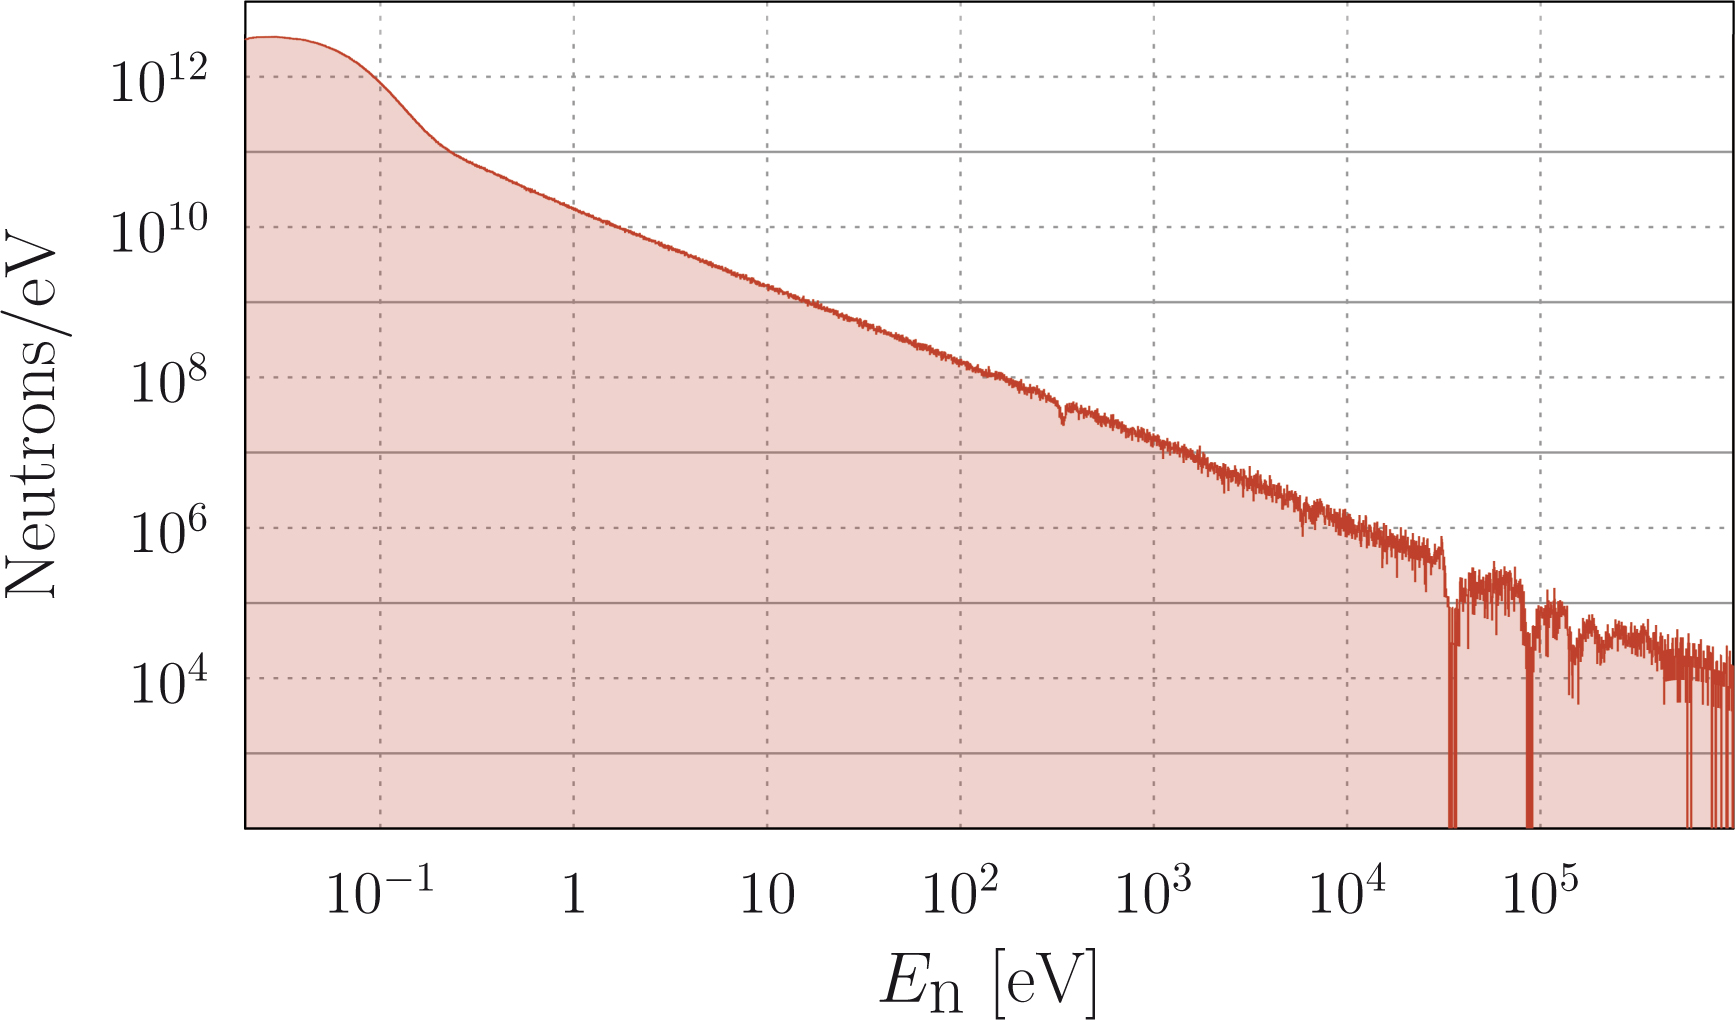
The precise knowledge of the energy dependence of the neutron flux at the position of DANCE is mandatory in order to determine cross sections with DANCE. Therefore, three different neutron monitors measure the flux simultaneously, about 2 m downstream of the sample position. Their working principle is based on the reactions 6Li(n,)3H, 10Be(n,)7Li and 235U(n,f). Figure 4 shows the neutron flux spectrum at the experimental area of DANCE, measured with the 6Li monitor. Between 1 eV and 1 MeV it can be described by a -powerlaw. The bump at the low energy end is produced by the water moderator close to the tungsten neutron production target. Several absorption features are visible, which are caused by Mn ( 340 eV) and Al ( 20 keV), contained in beamline components.
II.5 The 63Ni sample
Since there is no natural resource for the radioactive 63Ni, it has to be produced. The sample, a metallic foil of enriched 62Ni with 10.5 mm in diameter and a total mass of 347 mg, was exposed to the neutron radiation in the research reactor at the Institute Laue-Langevin (ILL) Grenoble more than 20 years ago Muthig (1984); Harder et al. (1992); Trautmannsheimer (1992). This irradiation lasted for 280 days with a thermal neutron flux of s-1 and resulted in a ratio of . The value was determined by means of multiple collection inductively coupled plasma mass spectrometry (MC-ICP-MS). The deployed MC-ICP-MS instrument was a Neptune (Thermo Fisher Scientific, Bremen, Germany), equipped with 9 Faraday cups. The determination was conducted in low resolution mode with a micro-concentric nebulizer at an uptake rate of approximately 50 L min-1. The sample was subject to chemical separation of the copper produced by the nickel decay prior to the analysis. The total -amount was estimated as mg. Additionally, as the analysis via Q-value and resonance identification showed, 59Ni ( = 76 kyr) was produced via 58Ni(n,) during the neutron irradiation as well.
III Spectral analysis
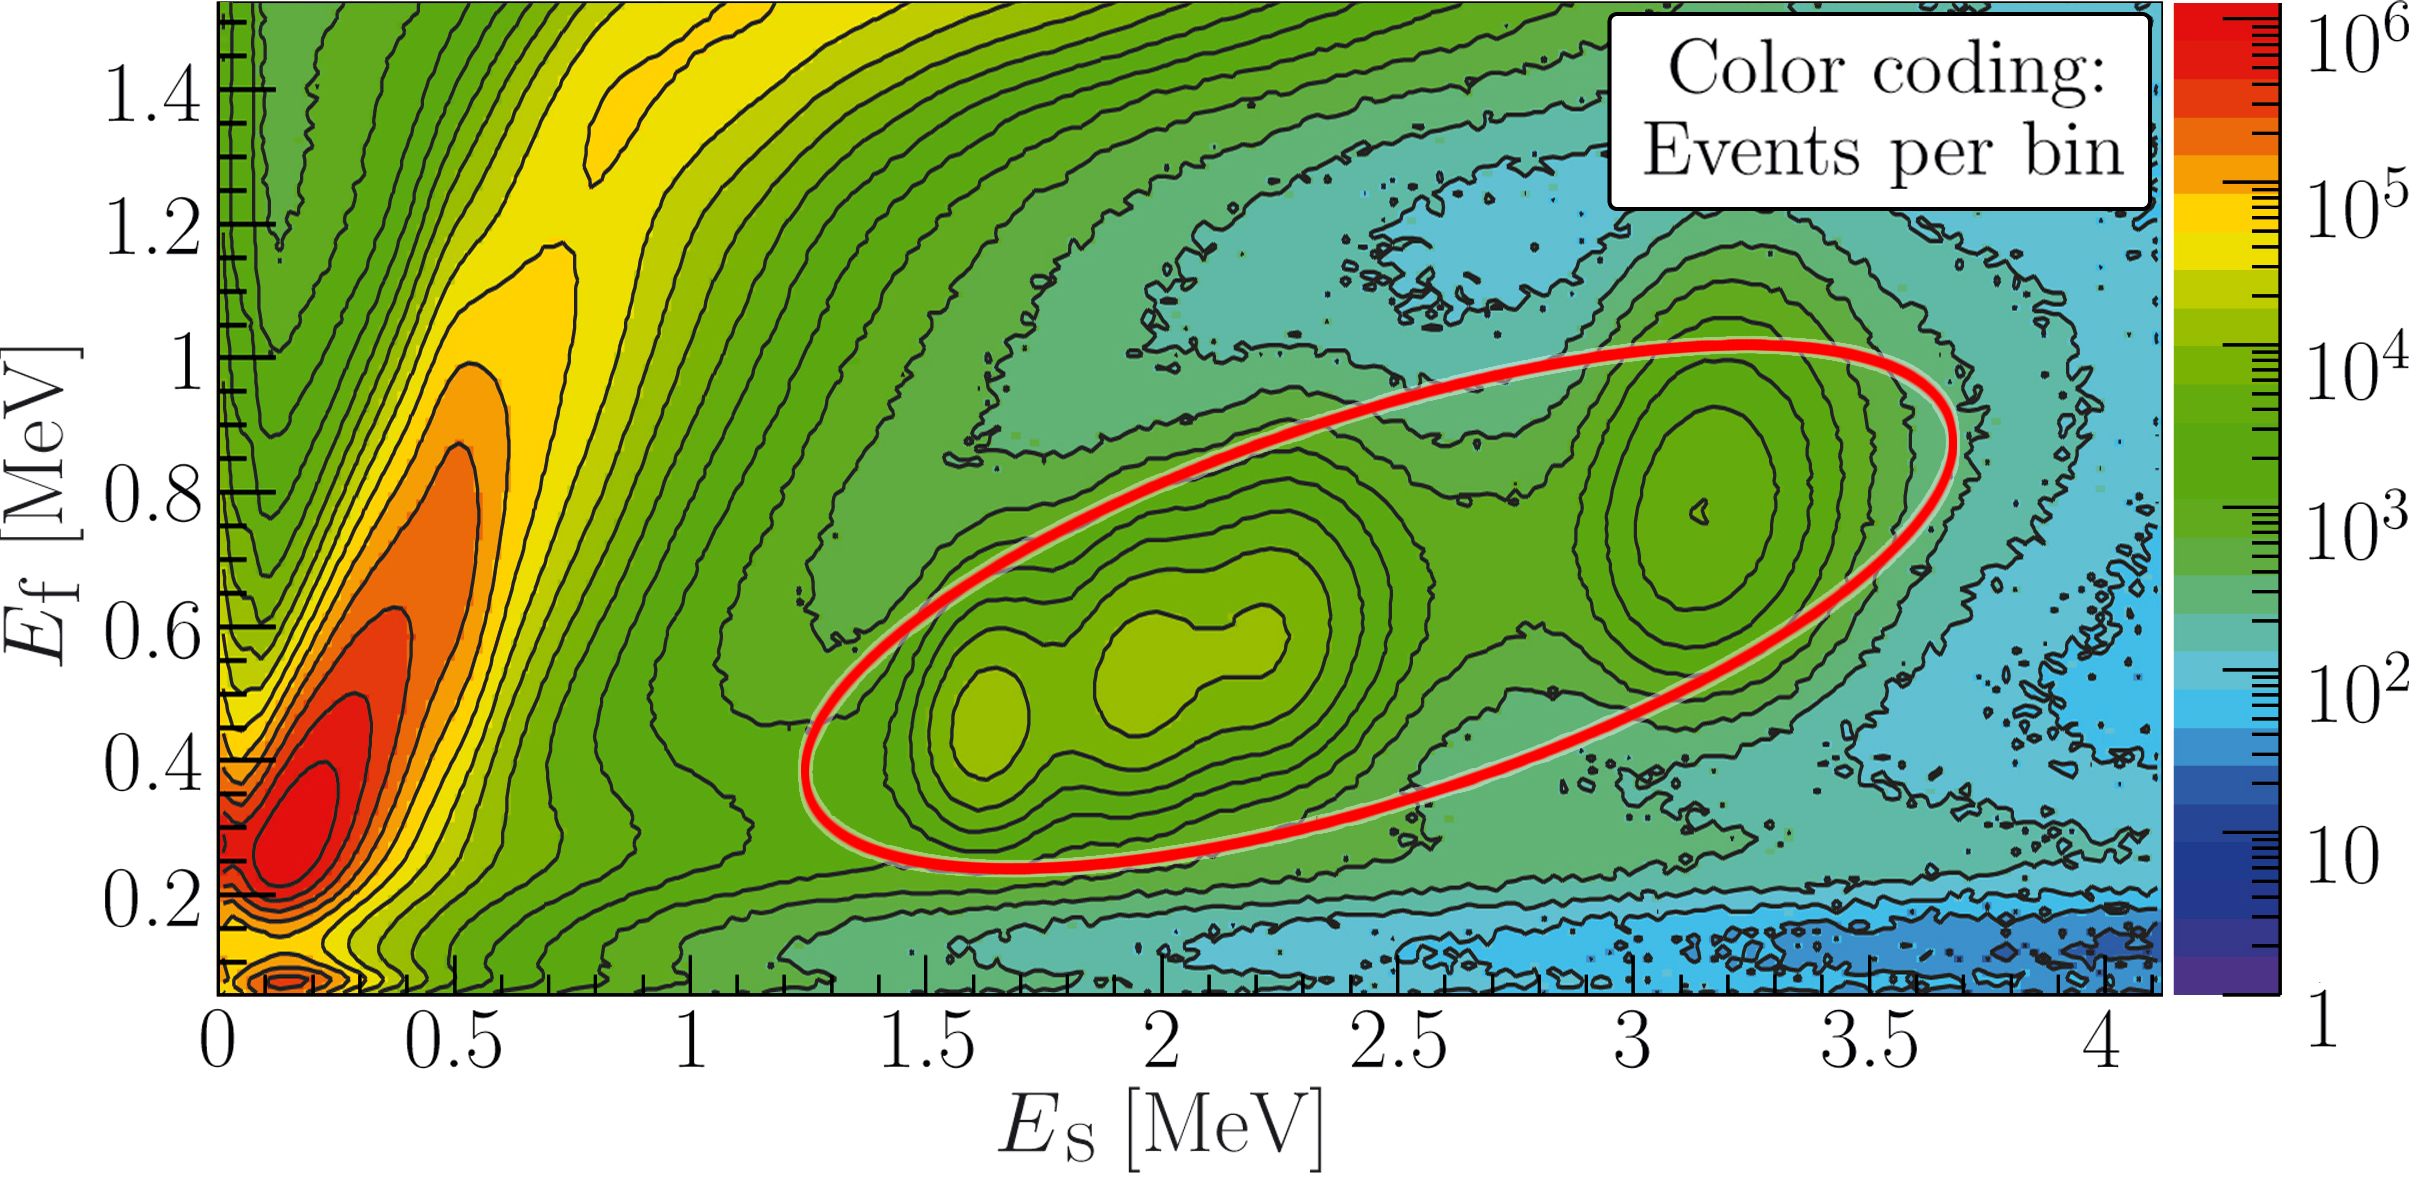
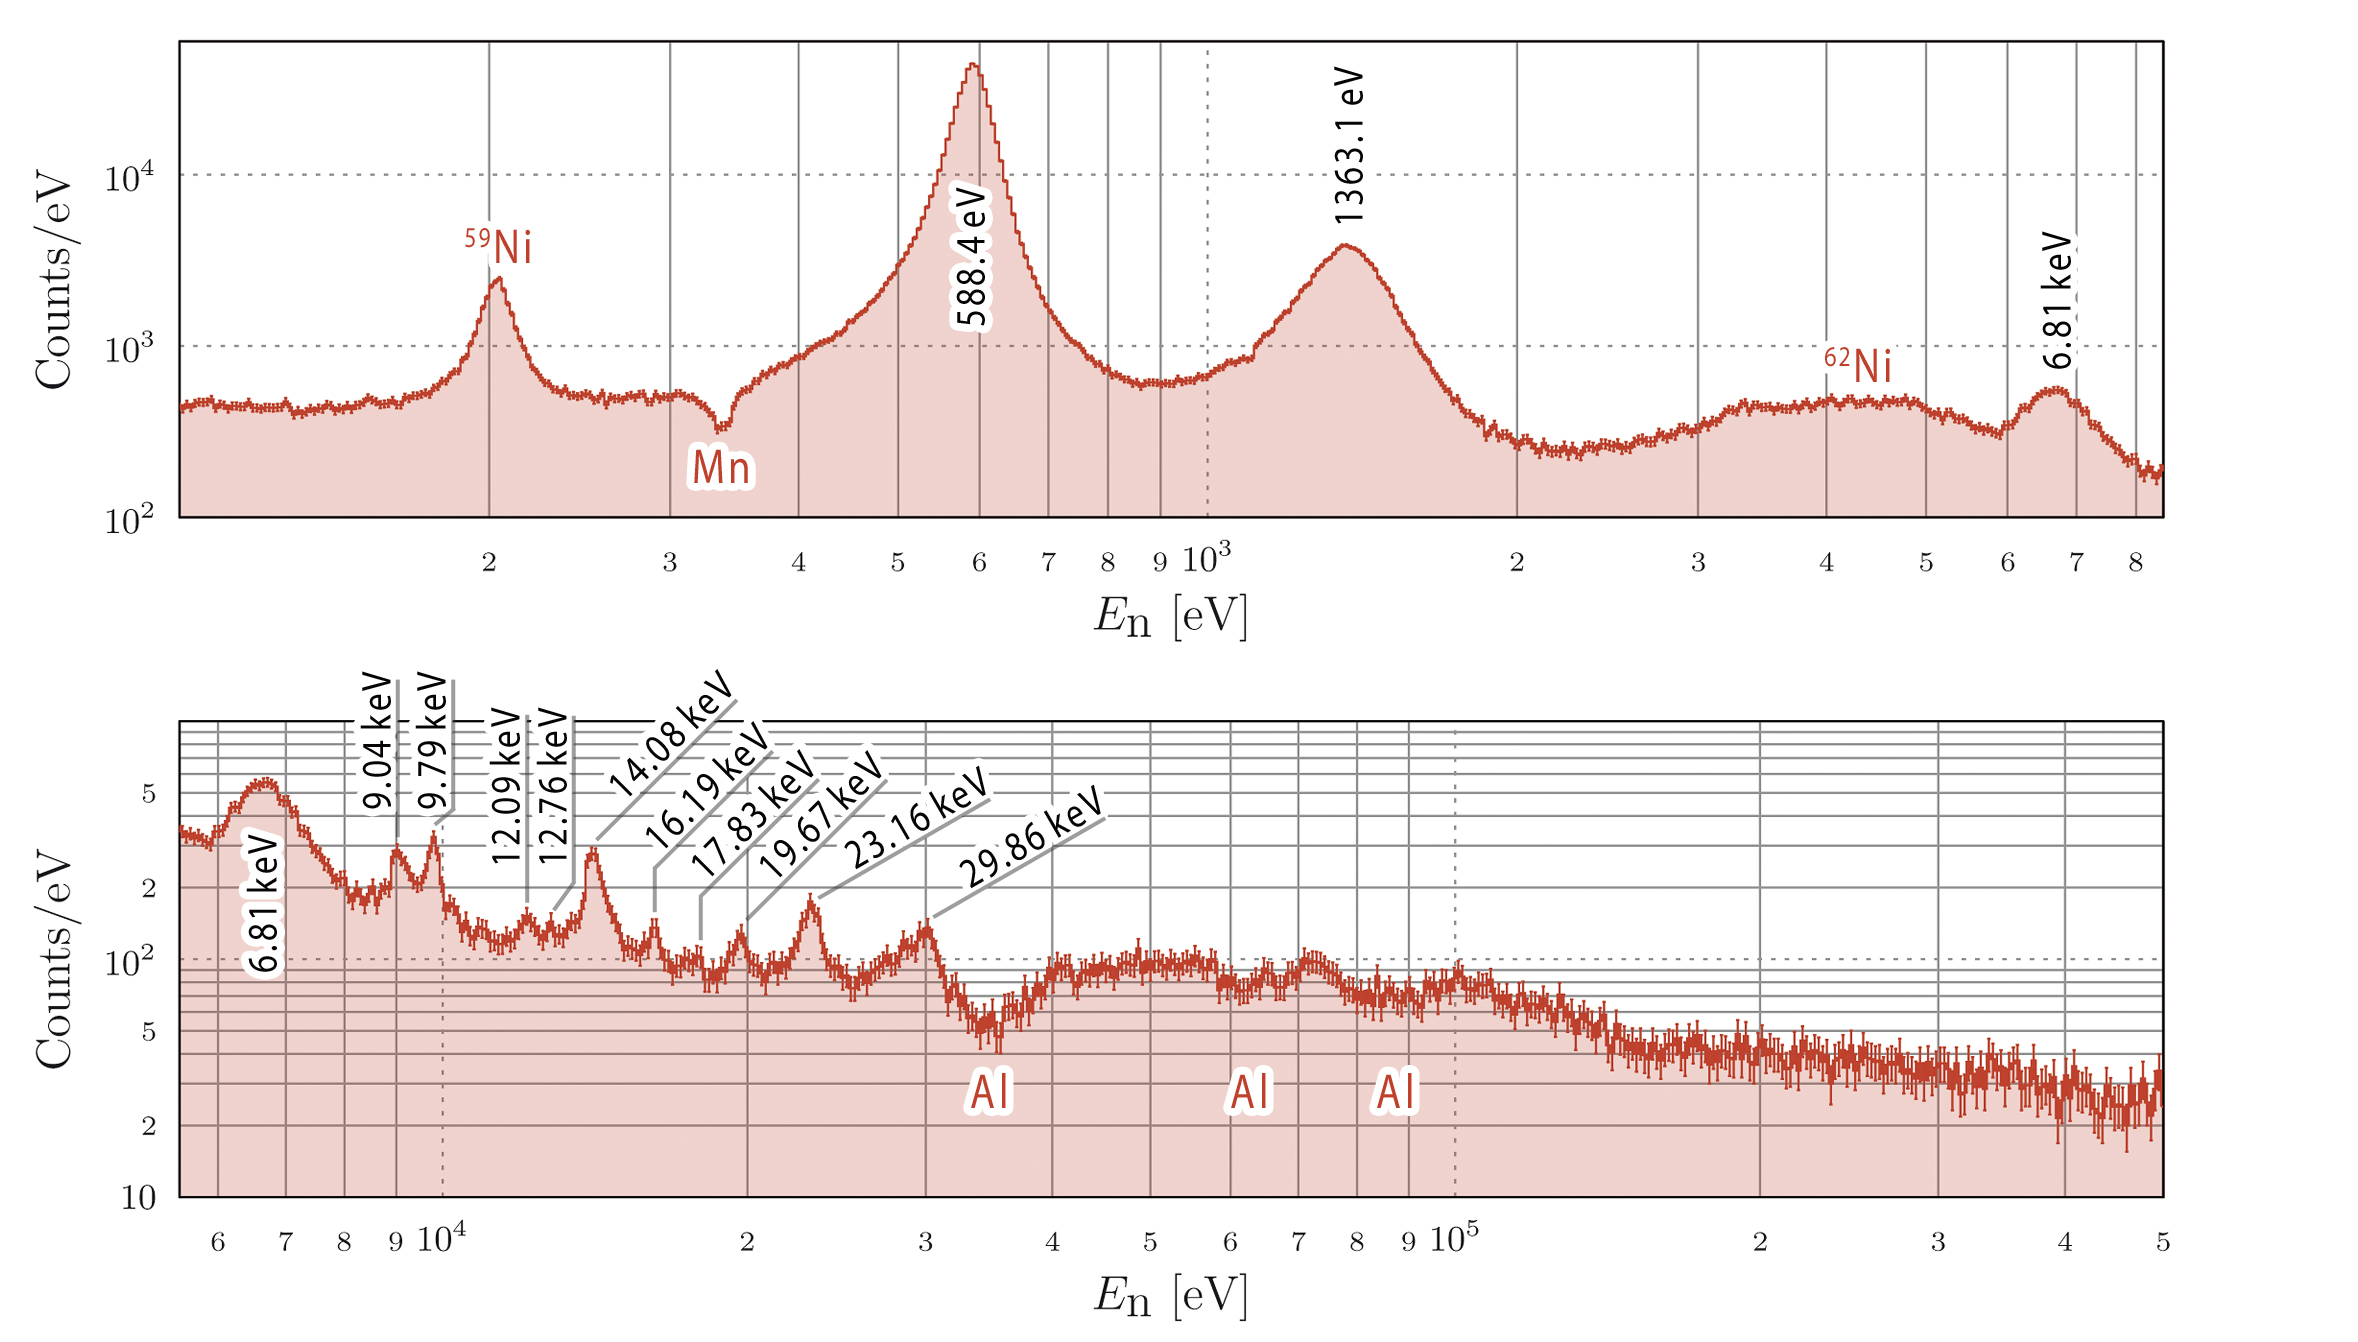
Figure 6 shows a 2-dimensional histogram of the number of events as a function of and obtained with DANCE. The 63Ni(n,) reaction has a Q-value of MeV. The latter and background from other species in the sample were identified via their Q-values using the total gamma energy information. Also, resonances were assigned to the corresponding isotopes. Two strong and several smaller peaks could be identified as resonances from 63Ni(n,). They are marked in figure 6.
Most of the observed background results from neutron captures on the main material of the sample, 62Ni, and also on the 59Ni and 63Cu contaminations. Neutron captures on 62Ni and 63Cu have significantly lower Q-values than on 63Ni: MeV and MeV. 59Ni(n,), has a higher Q-value of MeV. But the data show, that a significant contribution can only be found in the area of the strongest resonance at about 200 eV.
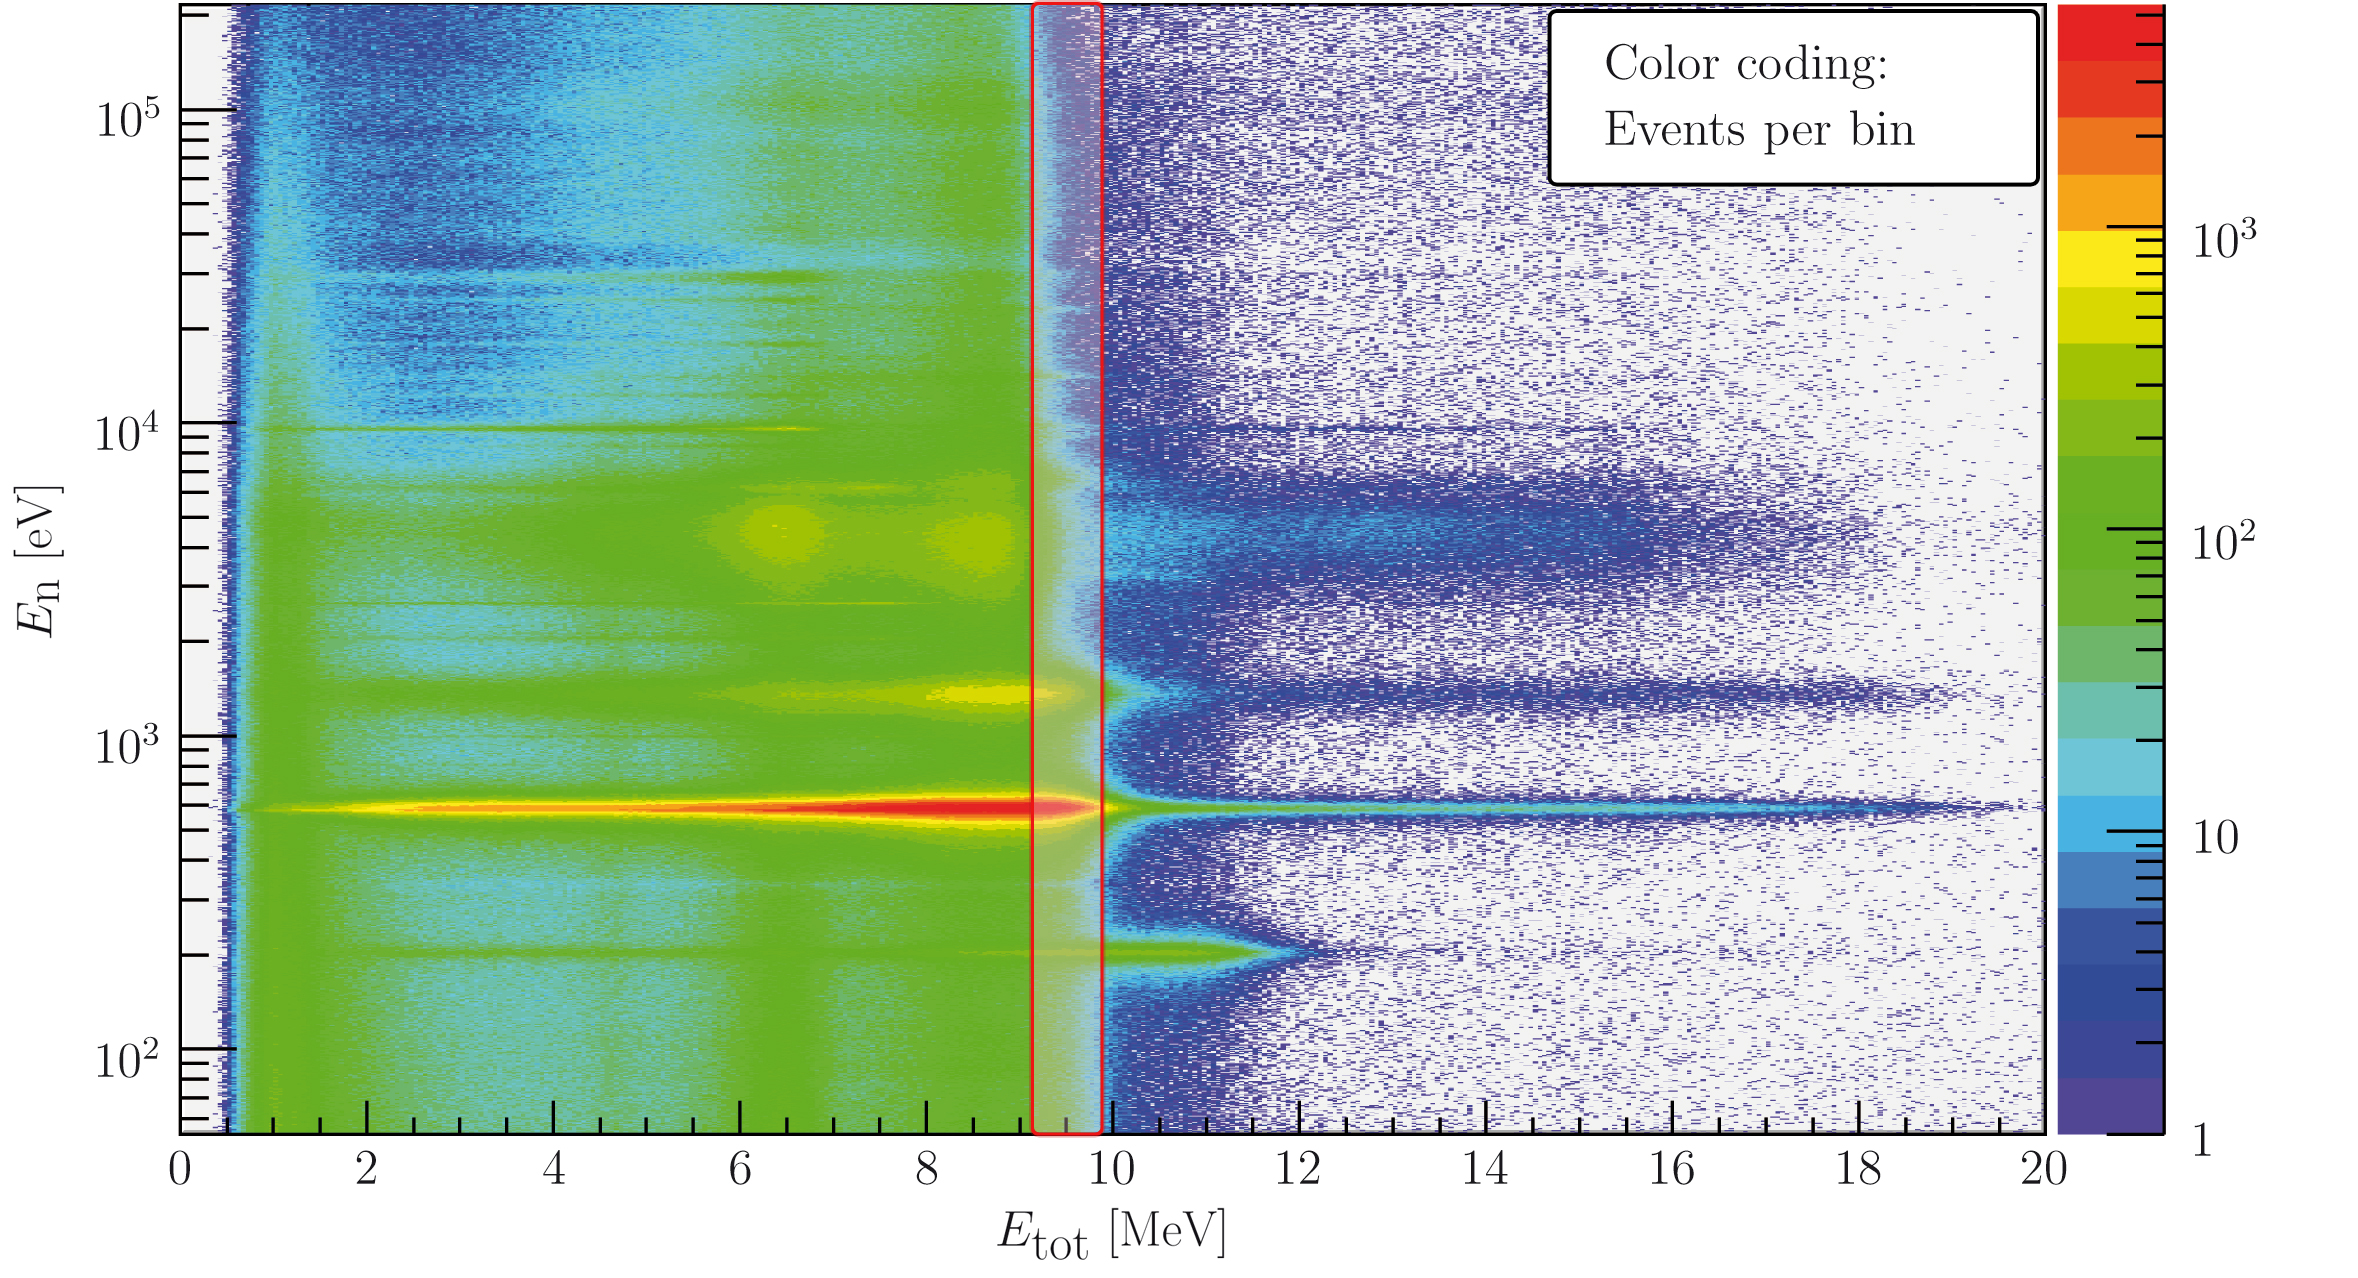
Additional signals originate from neutrons scattered on the sample which are captured in the detector material, specifically in Ba isotopes. This produces a significant background, which appears at the Q-values of the barium isotopes. 137Ba(n,) has the highest Q-value with 8.612 MeV which is close to 63Ni. However, the contribution of all the contaminants can be reduced with a cut on . Figure 6 shows a rough sketch of the applied cut (red box).
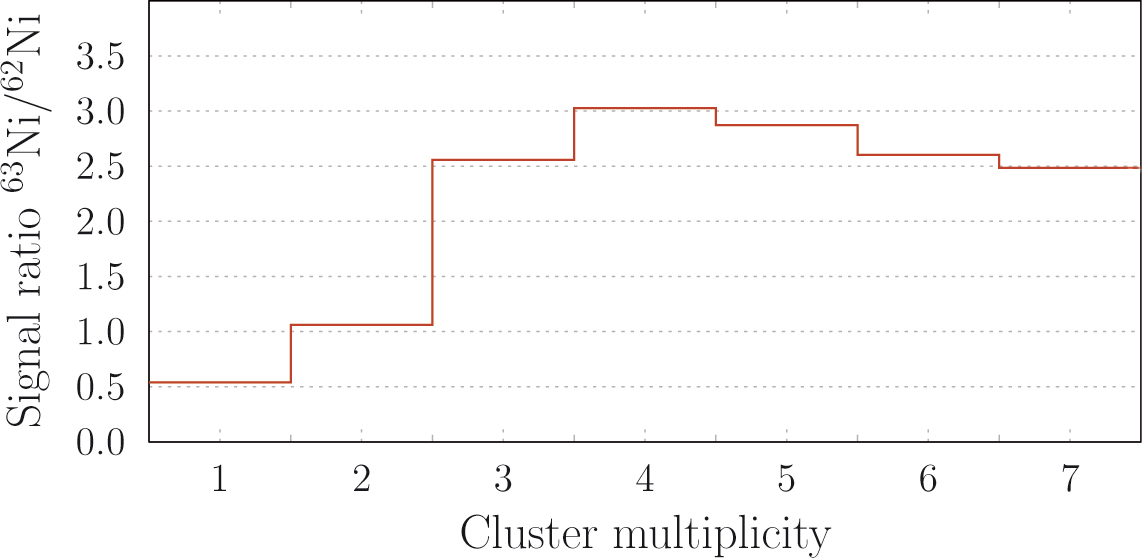
Concering 62Ni, it has also been observed that its capture events exhibit a cluster multiplicity distribution, that is different from 63Ni. Figure 7 shows the ratio of capture events of both isotopes for each multiplicity. The data were selected by placing cuts on around the corresponding Q-values and on around prominent resonances of 62Ni and 63Ni. Both distributions were then normalized to 1 to calculate the ratio. The plot shows a higher amount of 62Ni(n,) events for low multiplicities, which implies an additional tool for background reduction.
III.1 Background correction
There are several sources of background during a measurement with DANCE. These are natural radioactivity from the environment and beam-induced background, which can be corrected with measurements with an empty sample holder. Another source is sample induced background with the major contaminant of the sample, 62Ni, as the dominant source. It is possible to obtain pure 62Ni dominated spectra based on Q-value cuts and use them for background correction with the following method.
For both Ni isotopes, spectra were obtained by placing a cut around the corresponding Q-values. But, in both cases there are also events that belong to the other isotope. This can be written as two linear equations:
| (1a) | ||||
| (1b) | ||||
Here, and denote the count numbers that result by applying cuts on around the Q-values of 62Ni and 63Ni, respectively. In both cases these count numbers are the sum of events from captures on 62Ni and 63Ni, represented by and , and weighted by the efficiency factors , , and . Here, e.g. means the efficiency for the detection of 62Ni(n,) events when a cut around the Q-value of 63Ni is applied. The equations lead to the following expression for , which is the number of counts originating only from captures on 63Ni:
| (2) |
Thus, the efficiency factors had to be determined. First, in order to obtain the efficiency factor ratio , measurements with a 62Ni sample were performed. After background correction of these data, the ratio was calculated for each bin via the measured counts in the regions enclosed by the cuts. The next sections are dedicated to the determination of the factors and .
III.2 Efficiency determination
For the determination of the efficiency, not only the gamma cascade detection efficiency, but also the influence of the applied cuts had to be considered. This cannot simply be done with the help of calibration sources. For example, limiting the multiplicity range reduces the efficiency depending on the capturing isotope. However, former works showed that simulations of the detector response of DANCE with GEANT3 deliver results that are on very good agreement with measurements Heil et al. (2004). For the deduction of the efficiency, two tasks had to be performed. The first was the simulation of gamma cascades, which describe the decay of highly excited states in 64Ni. Second, in order to calculate the fraction of the capture events after the application of the cuts, GEANT3 simulations of the complete detector geometry with simulated cascades were conducted Apostolakis (1993).
III.2.1 Cascade simulations with DICEBOX
In order to simulate the response to 63Ni(n,) events, cascades were generated with the DICEBOX code Bečvář (1998). The code uses a Monte Carlo approach to produce levels and decay scheme above MeV using the statistical model based incorporating various models of level density (LD) and photon strength functions (PSFs). As we do not know the exact decay pattern of 63Ni we desided to make simulations with several different combinations of models. In these combinations we used the Constant-Temperature (CT) and the Back-Shifted Fermi Gas (BSFG) models in in the form from Egidy and Bucurescu (2005); von Egidy and Bucurescu (2009) for LD. A parity dependence up to a excitation energy of 5.5 MeV was assumed in some cases. The Axel-Brink model and model proposed by Kadmenskij, Markushev and Furman Kadmenskij (1983) were tested for PSF and the single-particle approximation was used for PSF. In total 64 dierent model combinations were used. For each combination we generated cascades in each of 15 nuclear realisations Bečvář (1998).
III.2.2 GEANT3 simulation of the detector response
The DANCE array has been simulated with GEANT3. This includes the following components:
-
•
BaF2 crystals
-
•
PVC wrapping of the crystals
-
•
6LiH neutron absorber shell
-
•
aluminum beam pipe
-
•
Ni sample and sample holder.
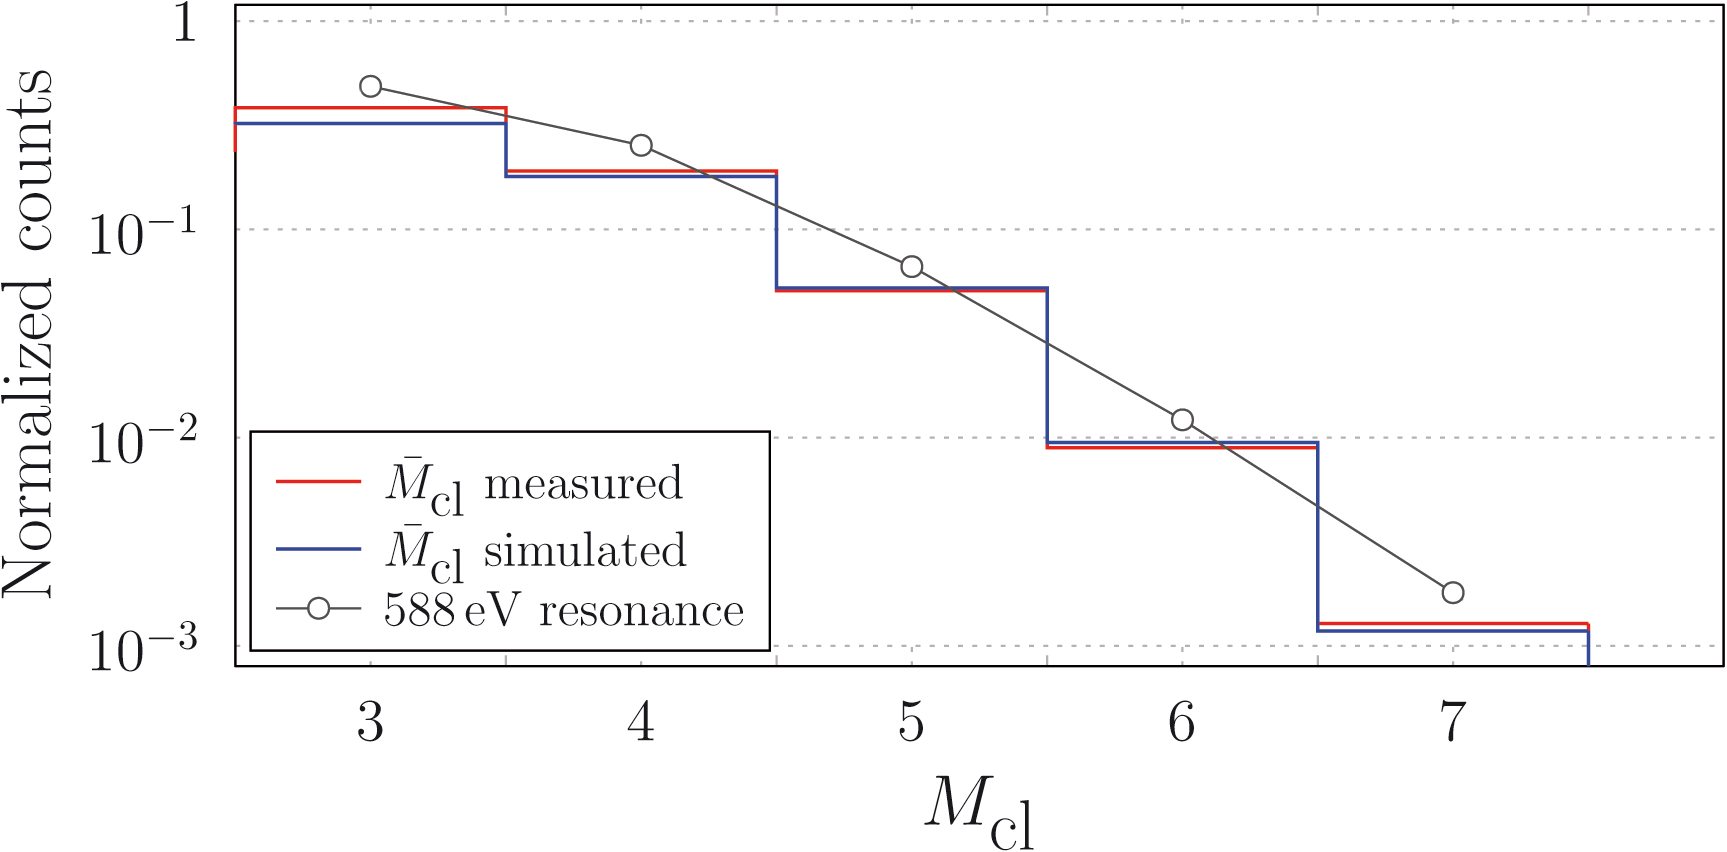
Figure 8 shows the cluster multiplicity distributions of the simulation in comparisson to the measured mean cluster multiplicity and the strongest resonance. The simulated data are in good agreement with the experimental results. Only the 588 eV resonance shows a different behaviour. The result of the simulations are the efficiency factors
| (3) | |||
| (4) |
for the used energy windows 6.0 MeV 6.5 MeV and 9.2 MeV 9.7 MeV, and multiplicities from 3 to 10. The results from all used models were averaged. We give conservative uncertainties for the efficiency factors that contain all the efficiency variations we observe depending on the used settings for the DICEBOX code. Additionally, we doubled the uncertainties for the 588 eV resonance to take its deviations from the mean multiplicity distribution into account.
III.3 Scattering correction
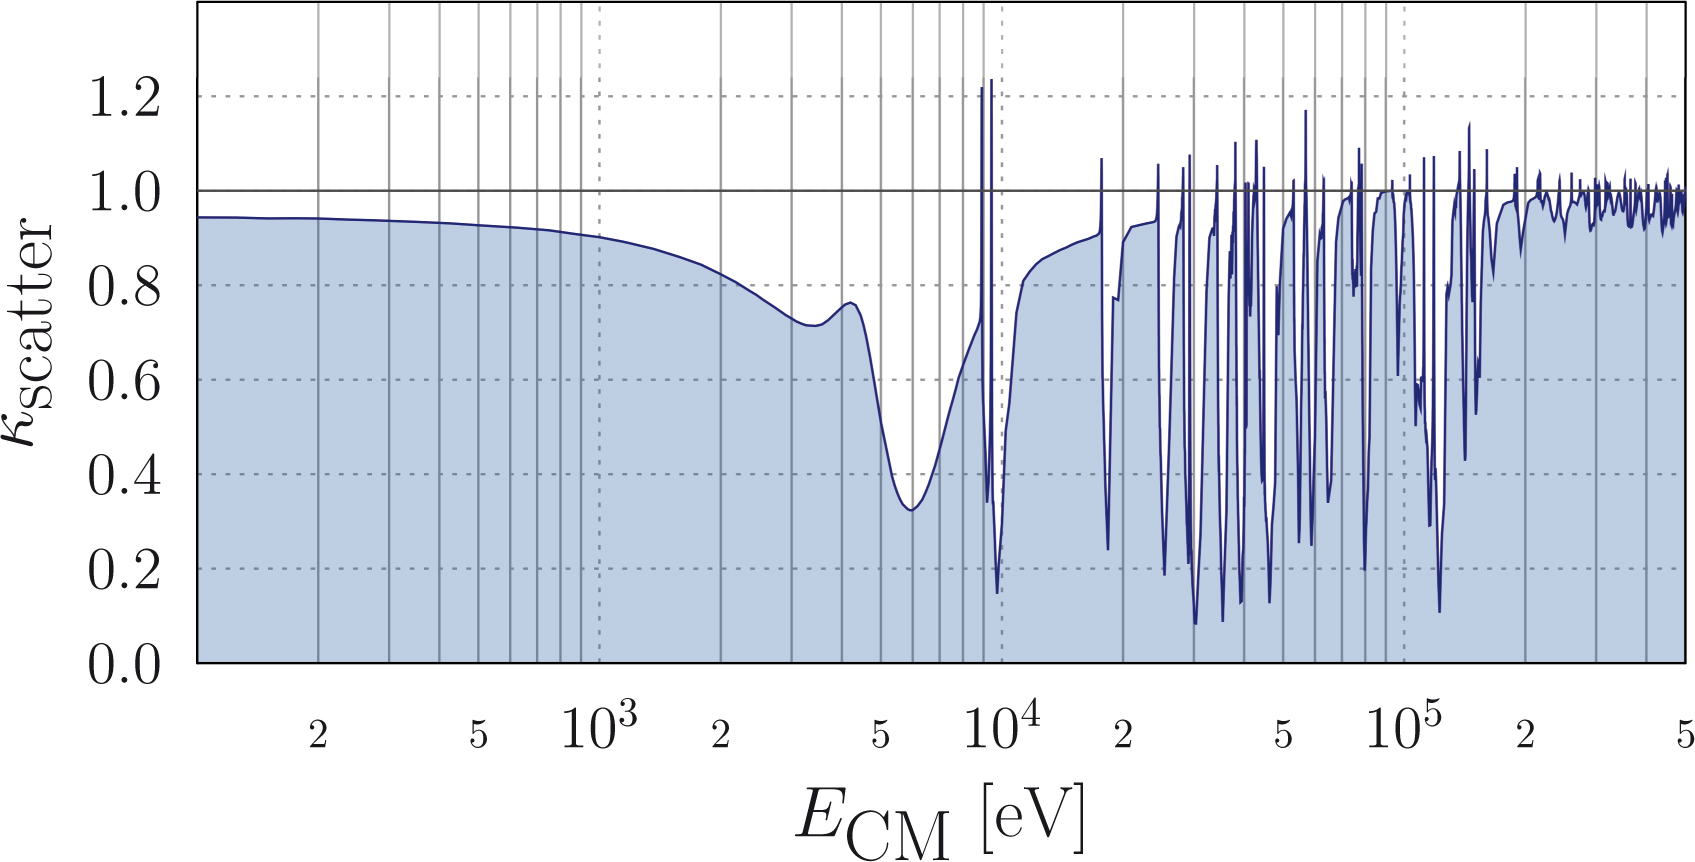
For the major contaminant of the sample, 62Ni, the neutron scattering cross section is larger than the capture cross section. Thus, the effects of neutron scattering in the sample were investigated with a Monte Carlo simulation, based on the CS data available at JEFF 3.0/A. This resulted in an energy dependent correction factor defined as
| (5) |
and plotted in figure 9. When neutrons are scattered in the sample, their mean path length through the sample is extended. This increases the propability for a capture event in the sample and the measured yield is enhanced. The calculated corrections are small for the major part of the measured energy range. But, especially for the broad resonance of 62Ni between 3 keV and 10 keV, the cross section needed significant corrections with a maximal factor of 0.32 at 6 keV. The statistical uncertainties of the simulation are below 1%.
This investigation could not be done for the 63Ni amount due to the fact that there is no measured scattering cross section. But, considering the 62Ni/63Ni ratio of the sample it is expected, that in this case 62Ni plays the major role. However, new data on the scattering cross section 63Ni could improve this correction.
III.4 Normalization
The well known cross section of 197Au(n,) was used to normalize the 63Ni spectra. The CS data was obtained from JENDL 4.0 Shibata et al. (2011). For the measurement, a gold sample with 10 mm diameter and 500 nm thickness was used. Due to the small thickness, no corrections for self-absorption neutrons were necessary. The strong resonance at 4.9 eV was observed with DANCE and used as reference. The relation
| (6) |
gives the normalization factor for the determination of the 63Ni CS. The first term is the ratio of the gold CS over the measured number of capture events. and are the neutron fluxes for both measurements obtained with the 6Li neutron monitor, and are the particle numbers of both samples, and and denote the cross sectional areas of the samples.
| KADoNiS | n_TOF | this work | ||||
| MACS | Rate | MACS stat sys | MACS stat sys | Rate | ||
| keV] | [mb] | - | [cm3/mol/s] | [mb] | [mb] | [cm3/mol/s] |
| 5 | ||||||
| 10 | ||||||
| 15 | ||||||
| 20 | ||||||
| 25 | ||||||
| 30 | ||||||
| 40 | ||||||
| 50 | ||||||
| 60 | ||||||
| 80 | ||||||
| 100 | ||||||
IV Discussion and results
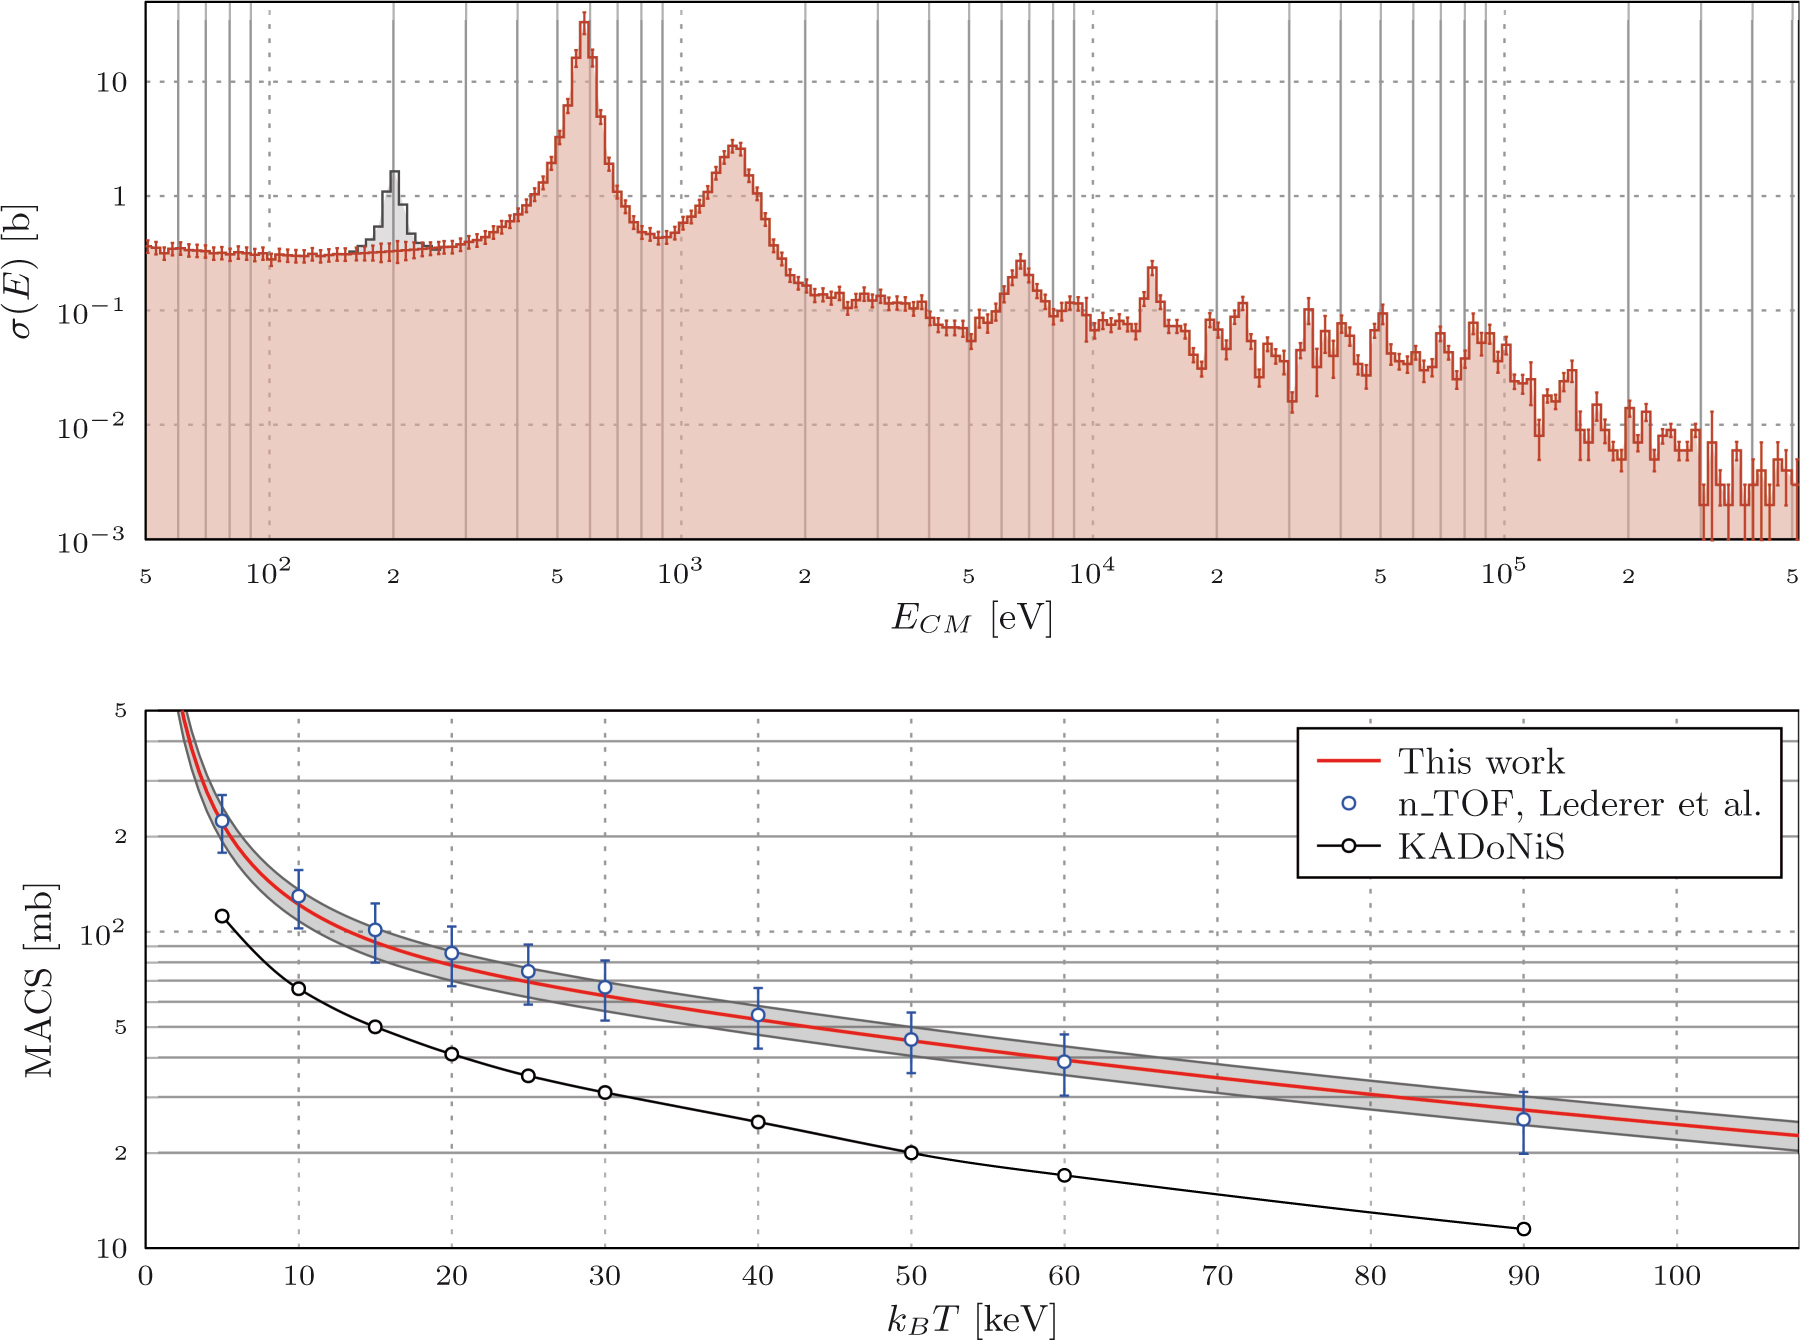
Based on the analysis described in the previous sections, the neutron capture cross section of 63Ni could be determined from 40 eV to 500 keV, which covers the energy range of the s-process. The result is plotted in the top panel of figure 10. Systematic uncertainties arise for different reasons:
-
•
The remaining contribution of the 59Ni resonance at 200 eV. Its influence on the MACSs for the s-process however is below 1 for all considered temperatures. The 63Ni CS between 150 and 250 eV was estimated with a linear interpolation as shown in figure 10 (top).
- •
-
•
The uncertainties of the efficiency factors are in the order of 3.
-
•
The sample diameter was determined with 5 and the amount of 63Ni with 1 uncertainty.
-
•
The Gold CS was used for the normalization and its uncertainties are in the order of 3.
This sums up to a systematic uncertainty of about 7. Together with the statistic uncertainties, the overall uncertainties stay below 17%, depending on the number of counts, which is an improvement over the data from n_TOF.
IV.1 Maxwellian averaged cross section
Via numerical integration the measured CS was converted into Maxwellian averaged cross sections (MACS) that can readily be used for nucleosynthesis calculations. We provide MACS for thermal energies from = 5 keV to = 100 keV. The bottom panel of figure 10 shows the results compared to the KADoNiS database value which underestimated the CS by a factor of two. Also, a comparison to experimental data from Lederer et al. (2013) is given. Our 63Ni(n,) CS is in very good agreement with the latter. The data are also compiled in table 1, together with stellar reaction rates calculated via
| (7) |
| [eV] | [eV] | [eV] |
|---|---|---|
with the Avogadro number , the kinetic energy , and the neutron mass . denotes the stellar enhancement factor and the measured MACS. In Rauscher et al. (2011) it was shown that the contribution of the ground state to the CS decreases for higher temperatures. But, the contribution of the first excited state is expected to grow in the same way. Thus, is close to 1 for all given temperatures.
IV.2 63Ni(n,) resonances
The measured differential capture cross section allows to identify 63Ni(n,) resonances. The determined resonance energies of 13 resonances are compiled in table 2.
V Sensitivity study with NETZ

Since the neutron capture cross section of 63Ni is by a factor of 2 higher than expected from previous theoretical predictions, its impact on s-process nucleosynthesis was investigated. This was done with the new and free to use online tool called NETZ Jaag et al. (2013). The original code was written by Stefan Jaag Jaag (1991) at the Karlsruhe Institute of Technology. Further improvements and the web interface development have been done at the Goethe University in Frankfurt.
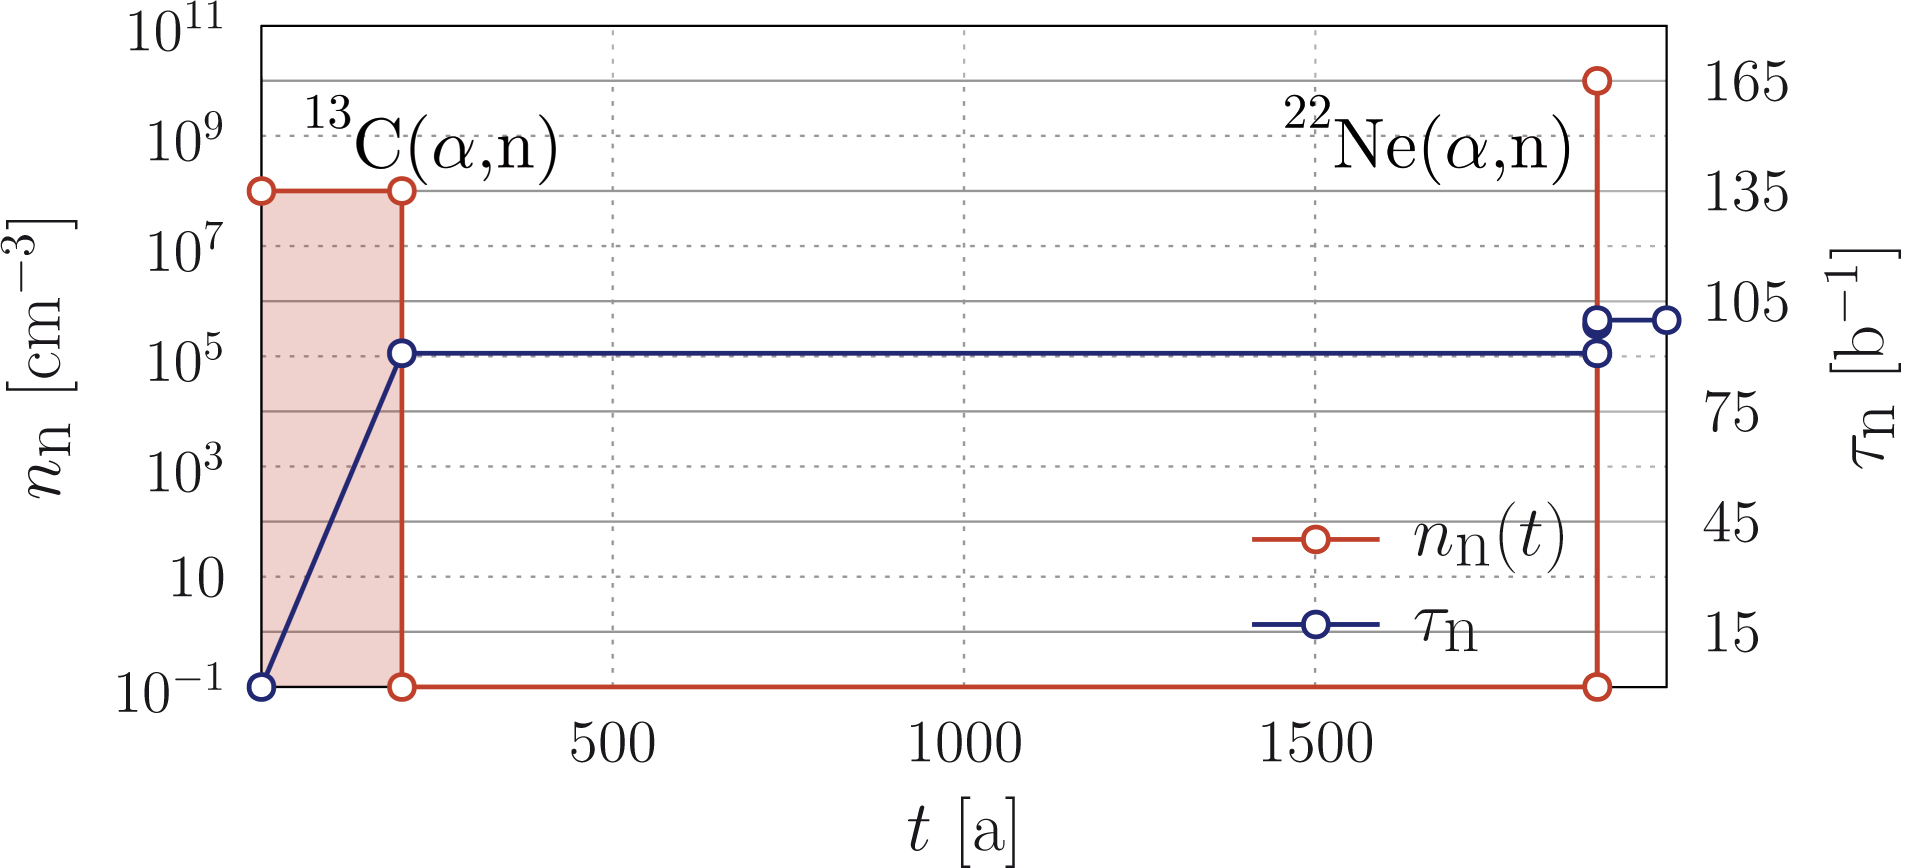
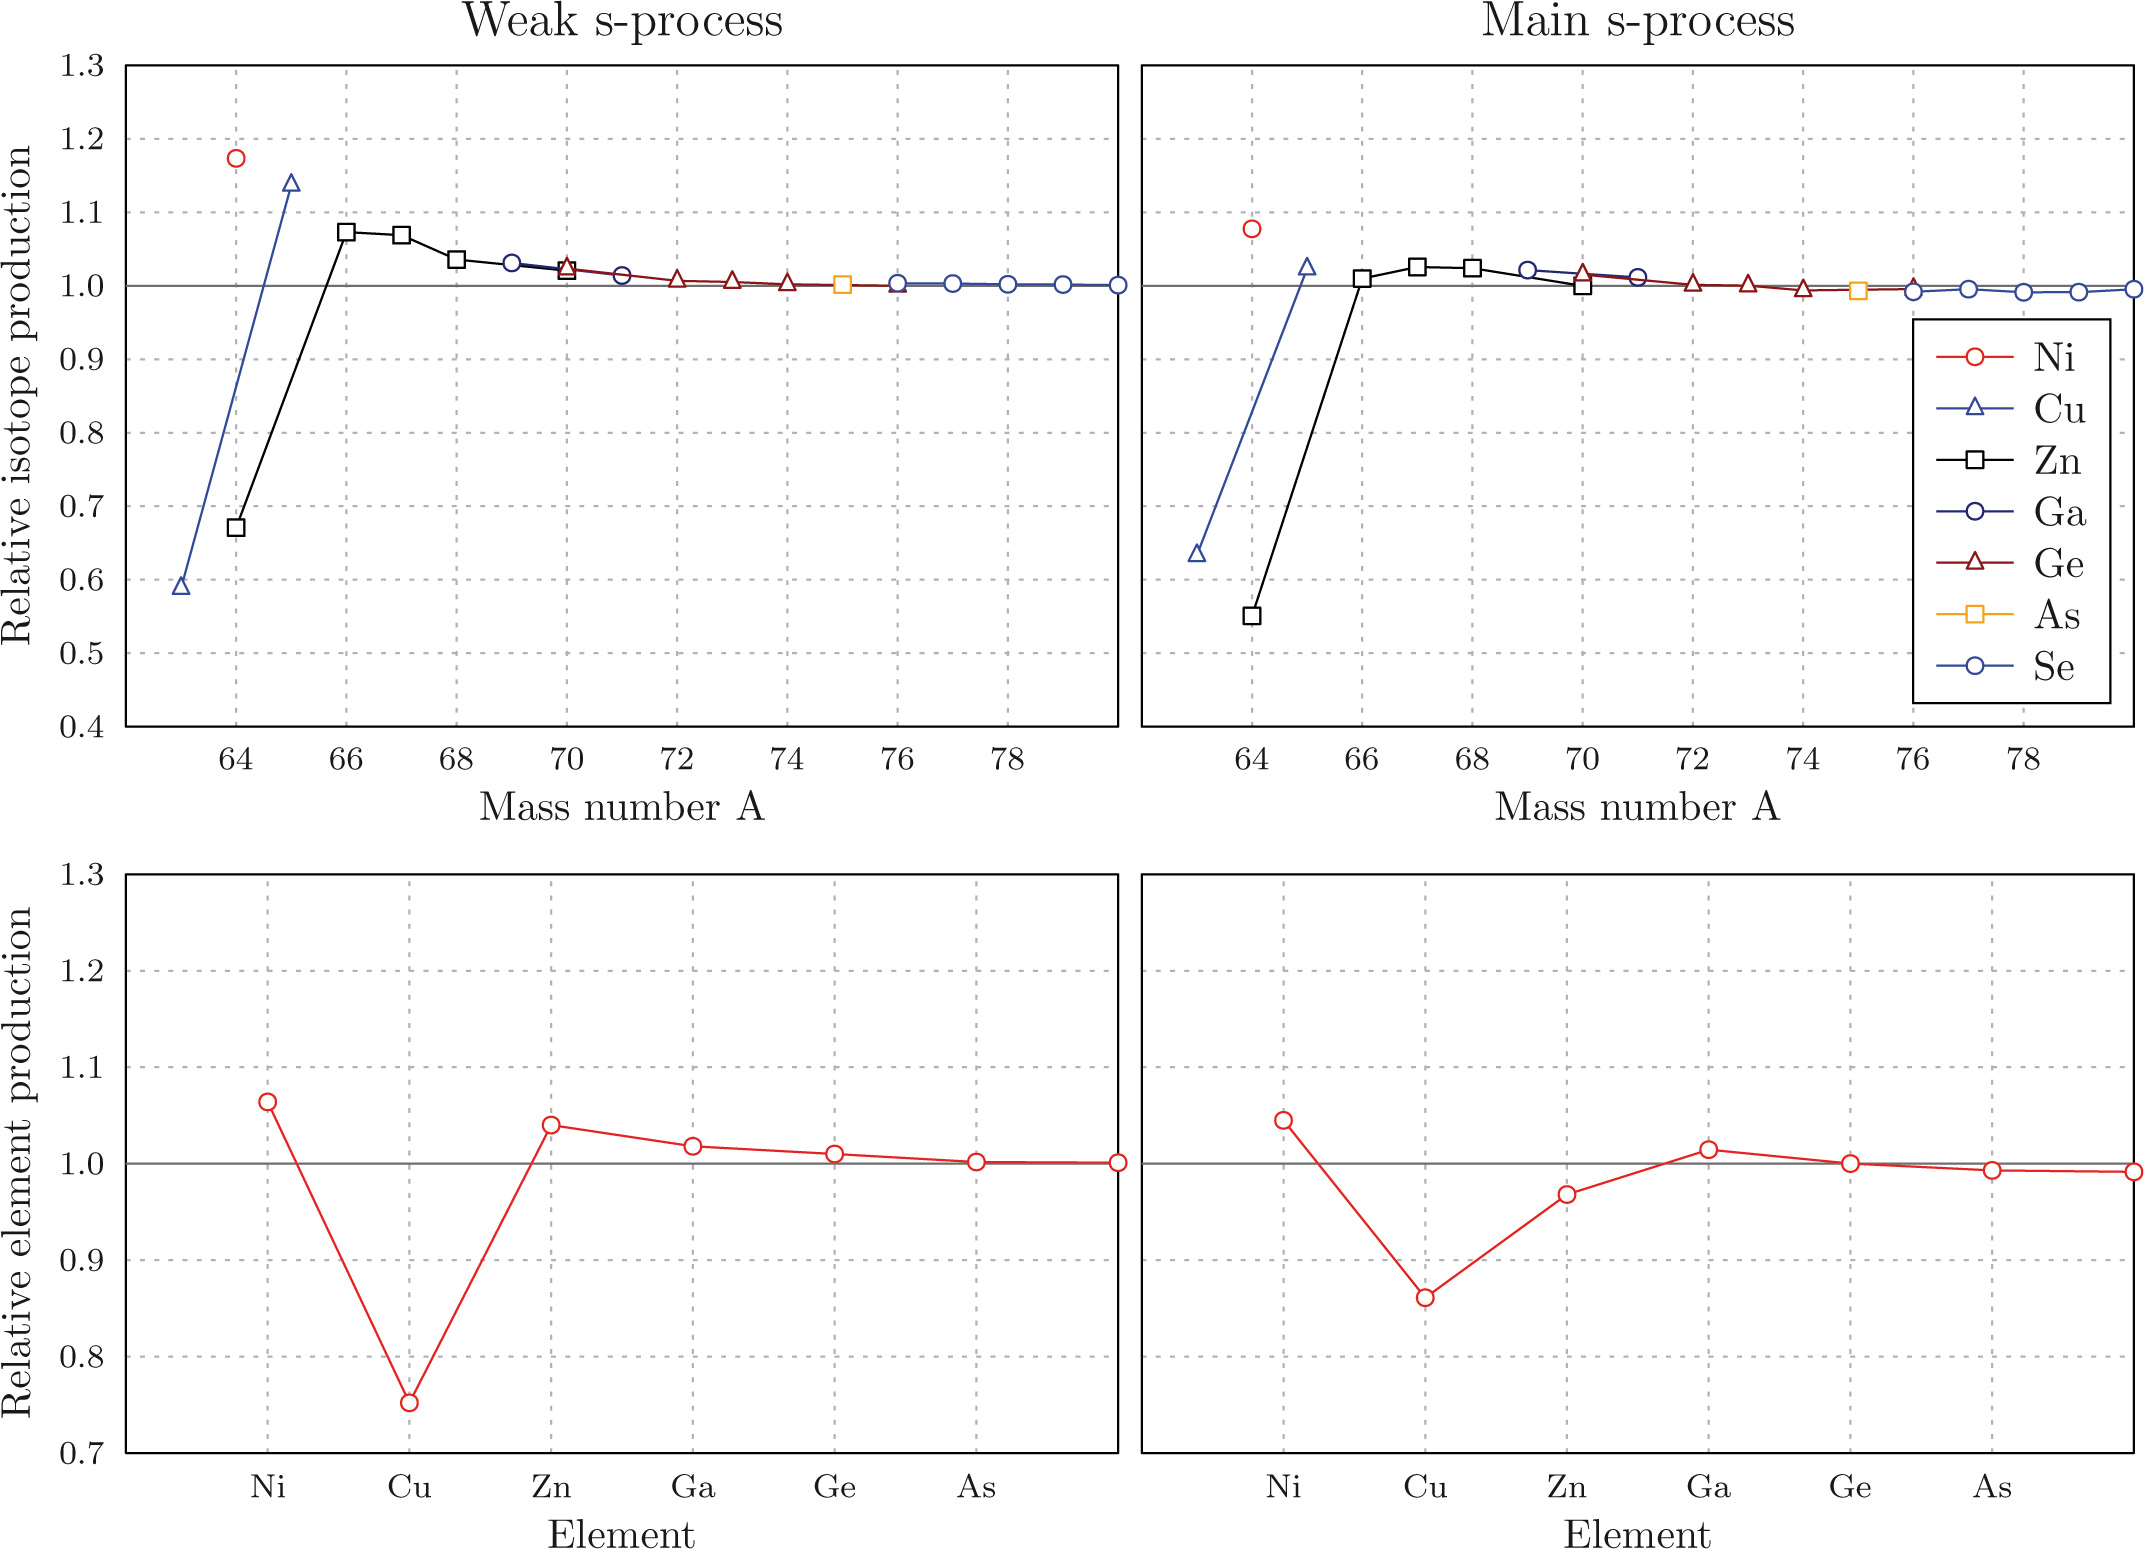
NETZ is a post-processing tool that uses predefined data for the parameters of the stellar interior and calculates the reaction yields during the given scenarios. Figures 11 and 13 show the adopted development of the neutron density and the integrated neutron exposure for the weak s-process and one thermal pulse of a TP-AGB star Raiteri et al. (1993); Gallino et al. (1998). Solar abundances from Lodders (2005) were used as seed for this study and its relative change indicates the sensitivity on the variation of a particular CS.
As result, the network calculations show a sensitivity on the 63Ni CS for some nuclei in the vicinity of Nickel. A deviation from the theoretical predictions affects the abundances of 64Ni, 64Zn that is not produced by the r-process, and the isotopic ratio of 63Cu and 65Cu. Looking at the isotope production relative to the standard case, both s-process scenarios show a similar behavior (see fig. 13). Since the 63Ni CS is a factor of 2 higher than previously recommended, the production of 63Cu and 64Zn is reduced, whereas the s-process yields of 64Ni, 65Cu and the heavier Zn isotopes are enhanced. The net yield of Cu is reduced and exhibits the largest effect, while Ni is slightly enhanced. For Zn the net yield obviously depends on the scenario. In contrast to the weak s-process scenario, the equilibrated mass flow during the s-process in TP-AGB stars allows more mass to pass Zn and reduces its relative production. For elements heavier than Zn, only marginal effects are observed. In Lederer et al. (2013) results of a full stellar model simulation for massive stars are presented, that show similar trends.
VI Summary
The neutron capture cross section of 63Ni has been measured in the energy range from 40 eV to 500 keV using the 4 BaF2 calorimeter DANCE at the Los Alamos National Lab. Additionally, 13 resonances of the 63Ni(n,) reaction were identified. As a result, we provide new experimental data to improve s-process models. The results are in good agreement with recent data measured at the CERN n_TOF experiment, published in Lederer et al. (2013). We provide new data with improved uncertainties for network calculations and the refinement of s-process models. The impact of the new CS data on the s-process nucleosynthesis was investigated with the new online tool for network calculations, NETZ. The isotopic abundances of Ni, Cu, and Zn are sensitive to the CS change in both scenarios, TP-AGB stars and massive stars. These data will be usefull to constrain the s-process models for AGB stars, when the analysis of isotopic nickel abundances in presolar SiC grains will become possible Stephan et al. (2012a, b).
Acknowledgements.
This project was supported through the Nuclear Astrophysics Virtual Institute, the Helmholtz Young Investigator project VH-NG-327, and HIC for FAIR. M. Krtička acknowledges support from Czech Science Foundation (grant No. 13-07117S).References
- Reifarth et al. (2014) R. Reifarth, C. Lederer, and F. Käppeler, Journal of Physics G: Nuclear and Particle Physics 41, 053101 (2014).
- Käppeler et al. (2011) F. Käppeler, R. Gallino, S. Bisterzo, and W. Aoki, Rev. Mod. Phys. 83, 157 (2011), URL http://link.aps.org/doi/10.1103/RevModPhys.83.157.
- Pignatari et al. (2010) M. Pignatari, R. Gallino, M. Heil, M. Wiescher, F. Käppeler, F. Herwig, and S. Bisterzo, Astrophysical Journal 710, 1557 (2010).
- Herwig (2005) F. Herwig, Annu. Rev. Astron. Astrophys. 43, 435 (2005).
- Busso et al. (1999) M. Busso, R. Gallino, and G. J. Wasserburg, Annual Review of Astronomy and Astrophysics 37, 239 (1999).
- Heil et al. (2008) M. Heil, R. Detwiler, R. E. Azuma, A. Couture, J. Daly, J. Görres, F. Käppeler, R. Reifarth, P. Tischhauser, C. Ugalde, et al., Phys. Rev. C 78, 025803 (2008), URL http://link.aps.org/doi/10.1103/PhysRevC.78.025803.
- Stephan et al. (2012a) T. Stephan, A. M. Davis, M. J. Pellin, M. R. Savina, R. Trappitsch, D. Rost, A. J. King, N. Liu, and R. Yokochi, Meteoritics and Planetary Science Supplement 75, 5290 (2012a).
- Stephan et al. (2012b) T. Stephan, A. M. Davis, M. J. Pellin, M. R. Savina, A. J. King, N. Liu, D. Rost, R. Trappitsch, and R. Yokochi, in Lunar and Planetary Institute Science Conference Abstracts (2012b), vol. 43 of Lunar and Planetary Institute Science Conference Abstracts, p. 2660.
- Lederer et al. (2013) C. Lederer, C. Massimi, S. Altstadt, J. Andrzejewski, L. Audouin, M. Barbagallo, V. Bécares, F. Bečvář, F. Belloni, E. Berthoumieux, et al. (nTOF Collaboration), Phys. Rev. Lett. 110, 022501 (2013), URL http://link.aps.org/doi/10.1103/PhysRevLett.110.022501.
- Dillmann et al. (2008) I. Dillmann, M. Heil, F. Käppeler, R. Plag, T. Rauscher, and F. . Thielemann, ArXiv e-prints (2008), eprint 0805.4749.
- Reifarth et al. (2004) R. Reifarth, T. Bredeweg, A. Alpizar-Vicente, J. Browne, E.-I. Esch, U. Greife, R. Haight, R. Hatarik, A. Kronenberg, J. O’Donnell, et al., Nuclear Instruments and Methods in Physics Research Section A: Accelerators, Spectrometers, Detectors and Associated Equipment 531, 530 (2004), ISSN 0168-9002, URL http://www.sciencedirect.com/science/article/pii/S0168900204011131.
- Esch et al. (2008) E.-I. Esch, R. Reifarth, E. Bond, T. Bredeweg, A. Couture, S. Glover, U. Greife, R. Haight, A. Hatarik, R. Hatarik, et al., Physical Review C 77, 034309 (2008).
- Wouters et al. (2006) J. Wouters, A. Vicente, T. Bredeweg, E. Esch, R. Haight, R. Hatarik, J. O’Donnell, R. Reifarth, R. Rundberg, J. Schwantes, et al., Nuclear Science, IEEE Transactions on 53, 880 (2006), ISSN 0018-9499.
- Wu et al. (2012) C. Wu, A. Chyzh, E. Kwan, R. Henderson, J. Gostic, D. Carter, T. Bredeweg, A. Couture, M. Jandel, and J. Ullmann, Nuclear Instruments and Methods in Physics Research Section A: Accelerators, Spectrometers, Detectors and Associated Equipment (2012).
- Brun and Rademakers (1997) R. Brun and F. Rademakers, Nuclear Instruments and Methods in Physics Research Section A: Accelerators, Spectrometers, Detectors and Associated Equipment 389, 81 (1997).
- Lanzan et al. (1992) G. Lanzan , A. Pagano, S. Urso, E. D. Filippo, B. Berthier, J. Charvet, R. Dayras, R. Legrain, R. Lucas, C. Mazur, et al., Nuclear Instruments and Methods in Physics Research Section A: Accelerators, Spectrometers, Detectors and Associated Equipment 312, 515 (1992), ISSN 0168-9002, URL http://www.sciencedirect.com/science/article/pii/016890029290199E.
- Muthig (1984) H. Muthig, Ph.D. thesis, Technical University of Munich (1984).
- Harder et al. (1992) A. Harder, S. Michaelsen, A. Jungclaus, K. Lieb, A. Williams, H. Börner, and M. Trautmannsheimer, Zeitschrift für Physik A Hadrons and Nuclei 343, 7 (1992).
- Trautmannsheimer (1992) M. Trautmannsheimer, Ph.D. thesis, Technical University of Munich (1992).
- Heil et al. (2004) M. Heil, R. Reifarth, F. Kaeppeler, K. Wisshak, F. Voss, J. L. Ullmann, R. C. Haight, E. H. Seabury, J. B. Wilhelmy, R. S. Rundberg, et al., ArXiv Nuclear Experiment e-prints (2004), eprint nucl-ex/0401039.
- Apostolakis (1993) J. Apostolakis, Tech. Rep., CERN, GEANT library (1993), http://wwwinfo.cern.ch/asd/geant/.
- Bečvář (1998) F. Bečvář, Nuclear Instruments and Methods in Physics Research Section A: Accelerators, Spectrometers, Detectors and Associated Equipment 417, 434 (1998), ISSN 0168-9002, URL http://www.sciencedirect.com/science/article/pii/S0168900298007876.
- Egidy and Bucurescu (2005) T. V. Egidy and D. Bucurescu, Physical Review C 72, 044311 (2005).
- von Egidy and Bucurescu (2009) T. von Egidy and D. Bucurescu, Phys. Rev. C 80, 054310 (2009), URL http://link.aps.org/doi/10.1103/PhysRevC.80.054310.
- Kadmenskij (1983) S. Kadmenskij, Sov. J. Nucl. Phys 37, 165 (1983).
- Shibata et al. (2011) K. Shibata, O. Iwamoto, T. Nakagawa, N. Iwamoto, A. Ichihara, S. Kunieda, S. Chiba, K. Furutaka, N. Otuka, T. Ohasawa, et al., Journal of Nuclear Science and Technology 48, 1 (2011).
- Macklin et al. (1979) R. Macklin, R. Ingle, and J. Halperin, Nuclear Science and Engineering 71, 205 (1979).
- Lamaze (1976) G. Lamaze, in PROCEEDINGS of the international conference on the interactions of neutrons with nuclei, held in Washington, D. C (1976), vol. 2, p. 1341.
- Rochman et al. (2006) D. Rochman, R. Haight, J. O’Donnell, S. Wender, D. Vieira, E. Bond, T. Bredeweg, J. Wilhelmy, T. Granier, T. Ethvignot, et al., Nuclear Instruments and Methods in Physics Research Section A: Accelerators, Spectrometers, Detectors and Associated Equipment 564, 400 (2006).
- Rauscher et al. (2011) T. Rauscher, P. Mohr, I. Dillmann, and R. Plag, The Astrophysical Journal 738, 143 (2011).
- Jaag et al. (2013) S. Jaag, J. Ostermöller, R. Plag, R. Reifarth, S. Schmidt, and M. Weigand, Netz - simulating s-process nucleosynthesis (2013), URL http://exp-astro.physik.uni-frankfurt.de/netz/.
- Jaag (1991) S. Jaag, Tech. Rep., Forschungszentrum Karlsruhe (1991).
- Raiteri et al. (1993) C. M. Raiteri, R. Gallino, M. Busso, D. Neuberger, and F. Kaeppeler, Astrophysical Journal 419, 207 (1993).
- Gallino et al. (1998) R. Gallino, C. Arlandini, M. Busso, M. Lugaro, C. Travaglio, O. Straniero, A. Chieffi, and M. Limongi, Astrophysical Journal 497, 388 (1998).
- Lodders (2005) K. Lodders, Chemie der Erde / Geochemistry 65, 93 (2005), eprint arXiv:astro-ph/0501430.