Origin of the DC and AC conductivity anisotropy in iron-based superconductors: scattering rate versus spectral weight effects
Abstract
To shed light on the mechanism responsible for the in-plane resistivity anisotropy in the nematic phase of the iron-based superconductors, we investigate the impact of spin fluctuations on the anisotropic AC conductivity. On the one hand, the scattering of electrons off magnetic fluctuations causes an anisotropic scattering rate. On the other hand, the accompanying Fermi velocity renormalization contributes to both the plasma frequency and the scattering rate in antagonistic ways, giving rise to anisotropies in these quantities that exactly cancel each other in the DC limit. As a result, the effective scattering rate changes its sign as function of temperature, but the DC conductivity retains the same sign, in agreement with recent experiments.
In-plane resistivity anisotropy measurements have been employed as the primary tool to investigate the nematic phase of both cuprate and iron-based superconductors Ando et al. (2002); Chu et al. (2010); Tanatar et al. (2010); Dusza et al. (2012); Cyr-Choinière et al. (2015). In these systems, the onset of electronic nematic order, characterized by an Ising order parameter , lowers the point-group symmetry from tetragonal to orthorhombic, making the two in-plane and directions inequivalent Fradkin et al. (2010); Vojta (2009); Fernandes et al. (2014). As a result, a non-zero conductivity anisotropy arises, Schütt and Fernandes (2015).
In general, the longitudinal DC conductivity along direction can be expressed in terms of the Drude form , where is the transport scattering rate (not to be confused with the inverse single-particle lifetime) and is the plasma frequency. Therefore, an anisotropy in the DC conductivity can arise from an anisotropic scattering rate, which is sensitive to impurities and to the low-energy excitations of the system, and/or from an anisotropic Drude weight, which is sensitive to the electronic structure. In the nematic phase of the iron-based superconductors, different effects contribute to these quantities. Anisotropic magnetic fluctuations triggered by nematic order Fernandes and Schmalian (2012); Lu et al. (2014) give rise to an anisotropy in the inelastic scattering rate Fernandes et al. (2011); Liang et al. (2012); Breitkreiz et al. (2014), whereas the dressing of an impurity potential by magnetic correlations promotes an anisotropy in the elastic scattering rate Allan et al. (2013); Gastiasoro et al. (2014). Conversely, the distortion of the Fermi surface caused by the ferro-orbital order triggered at the nematic transition affect the plasma frequency Chen et al. (2010); Lv and Phillips (2011); Valenzuela et al. (2010); Yin Z. P. et al. (2011). Disentangling these contributions would provide important insight into the dominant processes responsible for the nematic instability.
At first sight, a natural way to disentangle and is the AC conductivity, . Indeed, recent measurements of in detwinned BaFe2As2 reported a larger anisotropy in the plasma frequency than in the scattering rate Dusza et al. (2012); Mirri et al. (2015), which was interpreted as evidence for electronic-structure induced anisotropy. However, as we show in this paper, these two quantities are unavoidably entangled. This general result follows directly from the memory function formalism, which is valid even in the absence of quasi-particles, and yields the following form for the AC conductivity Götze and Wölfle (1972):
| (1) |
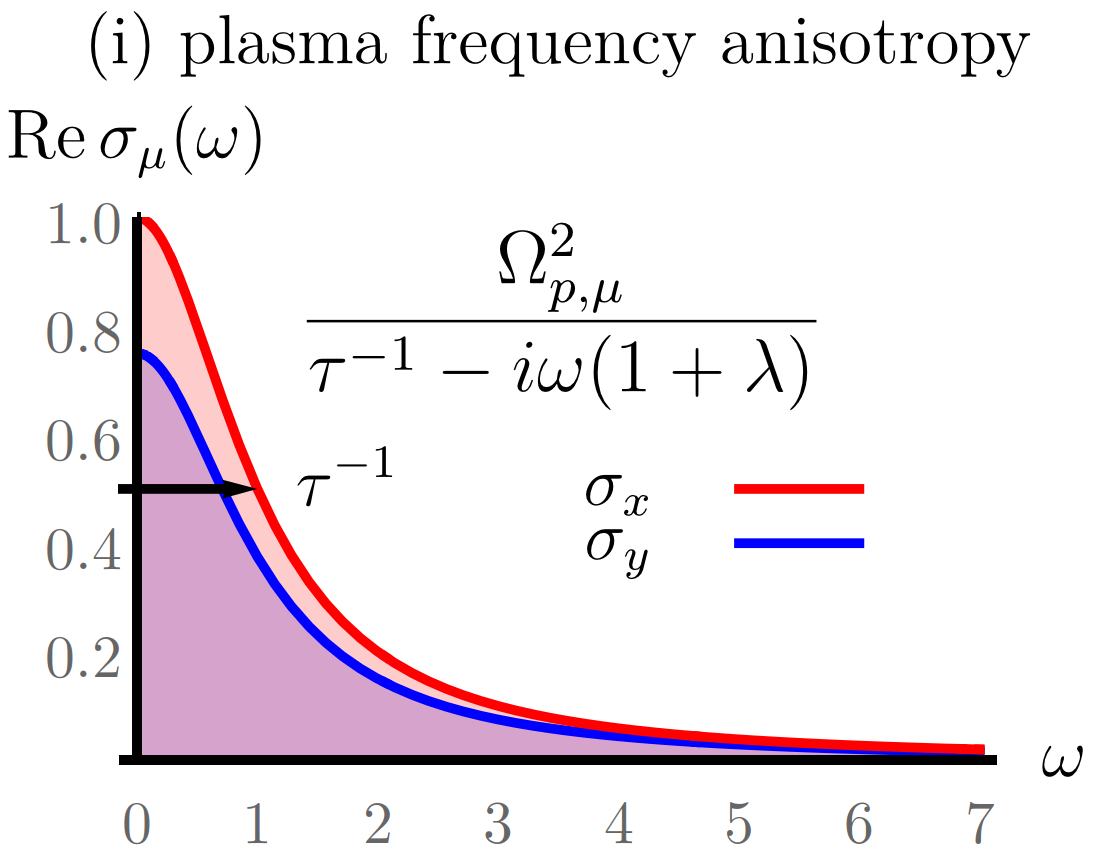
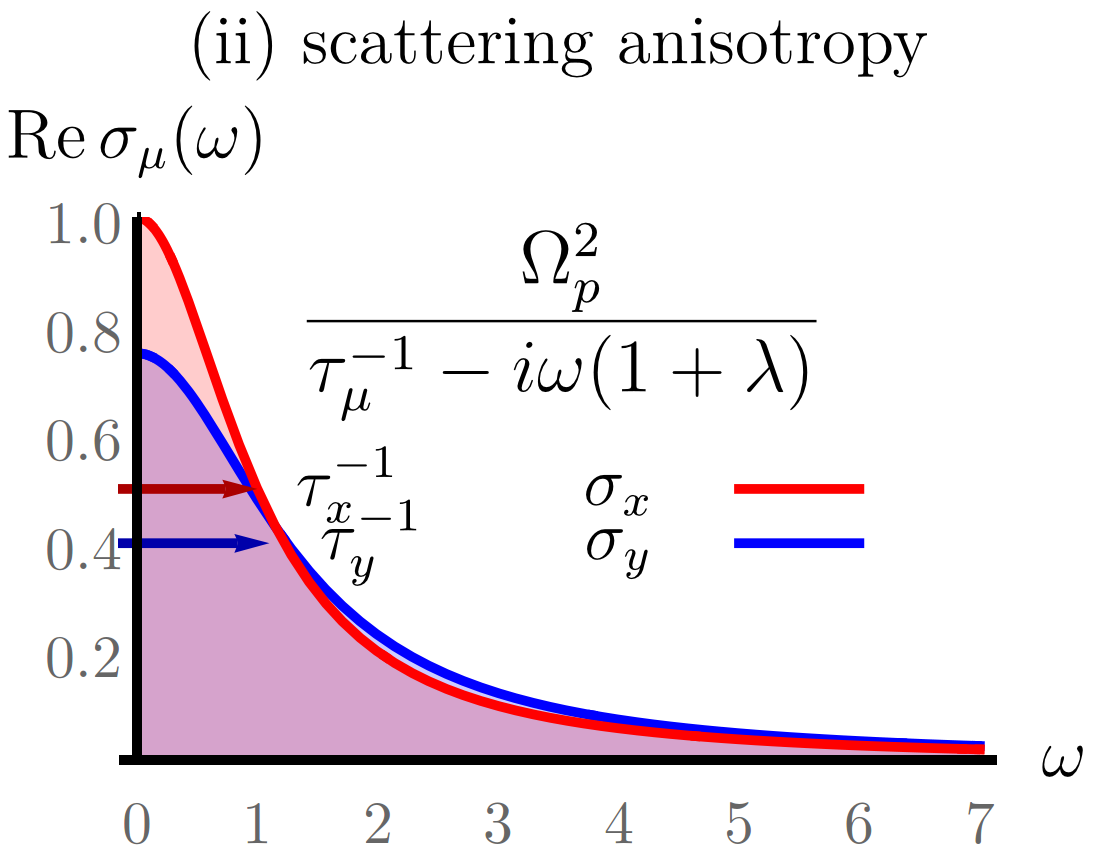
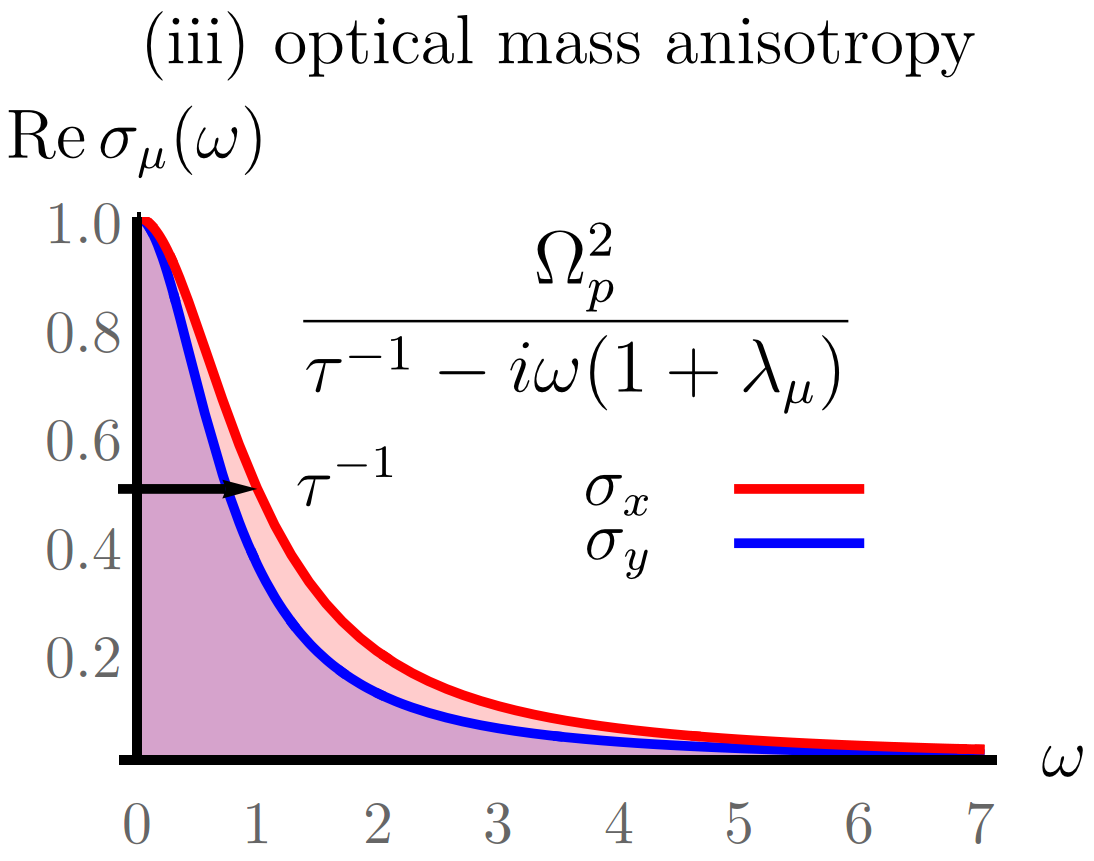
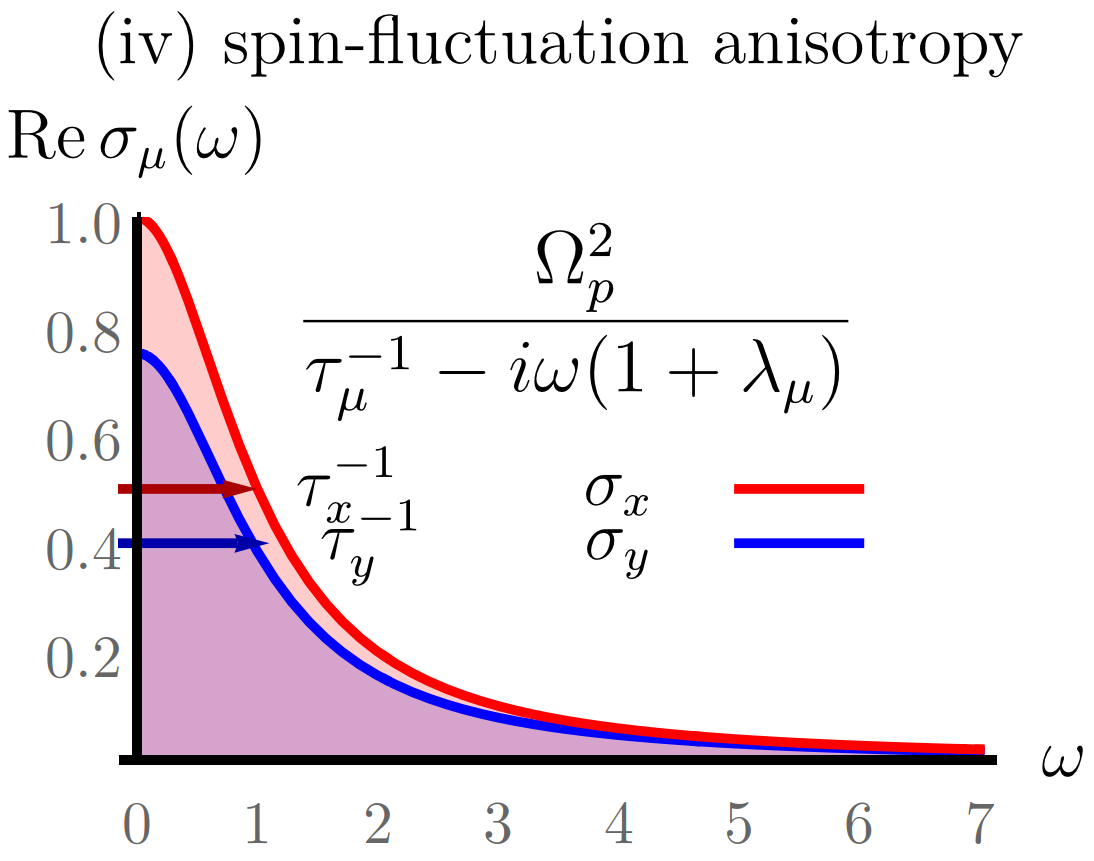
The main point is that, besides and , the AC conductivity depends additionally on the optical mass enhancement Basov and Timusk (2005). While does not contribute to the DC conductivity , it does modify the effective plasma frequency and the effective scattering rate extracted from a typical AC conductivity measurement, yielding and . To illustrate the importance of this effect for the intepretation of the experimental results of Ref. Mirri et al. (2015), in Fig. 1 we plot in Eq. (1) considering four cases: (i) anisotropy only in the plasma frequency (); (ii) anisotropy only in the scattering rate (); (iii) anisotropy only in the optical mass (); (iv) anisotropy in both scattering rate and optical mass ( and ). The system in cases (i) and (ii) have very similar DC conductivities, but rather different AC conductivities in the intermediate frequency range. In the presence of optical mass anisotropy only, case (iii), the system does not display a DC conductivity anisotropy, but in the intermediate frequency range, the AC conductivity is similar to that of case (i). The key point is that cases (ii) and (iii) are not allowed due to the causality properties of the AC conductivity, which require both and to be present. After combining these two effects, case (iv), the system displays DC and AC conductivities very similar to case (i). Thus, the AC conductivity anisotropy observed in Ref. Mirri et al. (2015) is in equally consistent with either case (i) or (iv), which have very different physical origins – electronic-structure anisotropy and scattering rate anisotropy, respectively.
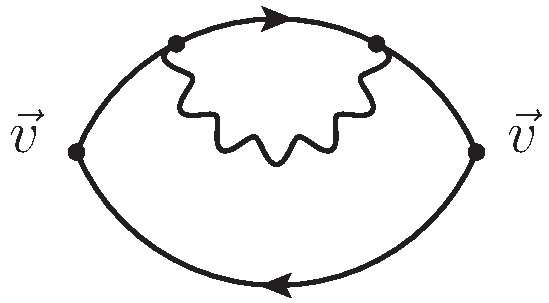
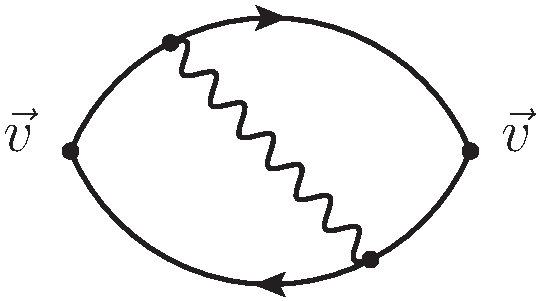
In this paper we compute the AC conductivity of a multi-band model for the iron pnictides in which the electrons interact with spin fluctuations – which become anisotropic in the nematic phase Fernandes and Schmalian (2012); Lu et al. (2014). While this interaction does not promote anisotropy in the bare plasma frequency, it causes anisotropies simultaneously in both the scattering rate, , and in the optical mass, . Physically, the first effect arises from real collisions of electrons and magnetic fluctuations, whereas the latter effect stems from the reduction of the electronic Fermi velocity (or, equivalently, the enhancement of the effective electron mass) promoted by the exchange of virtual spin fluctuations (see Fig. 2).
More importantly, our microscopic calculations reveal that while the overall signs of both quantities, and , are determined by the same prefactor that depends on the geometry of the Fermi surface Fernandes et al. (2011), the relative sign of and is always positive, similar to case (iv) in Fig. 1. Consequently, the effective scattering rate anisotropy is reduced with respect to its bare value, while the effective plasma frequency anisotropy is enhanced (here and are the bare isotropic scattering rate and plasma frequency). Interestingly, because collisions are suppressed at low temperatures, decreases as the temperature is lowered. In contrast, remains finite as , since it is proportional to the electronic mass renormalization. Consequently, one generally expects a sign-change of as function of temperature, despite the fact that retains the same sign. These behaviors agree with recent AC conductivity measurements in detwinned BaFe2As2 Dusza et al. (2012); Mirri et al. (2015), revealing the importance of anisotropic spin fluctuations to describe the nematic state of the iron pnictides.
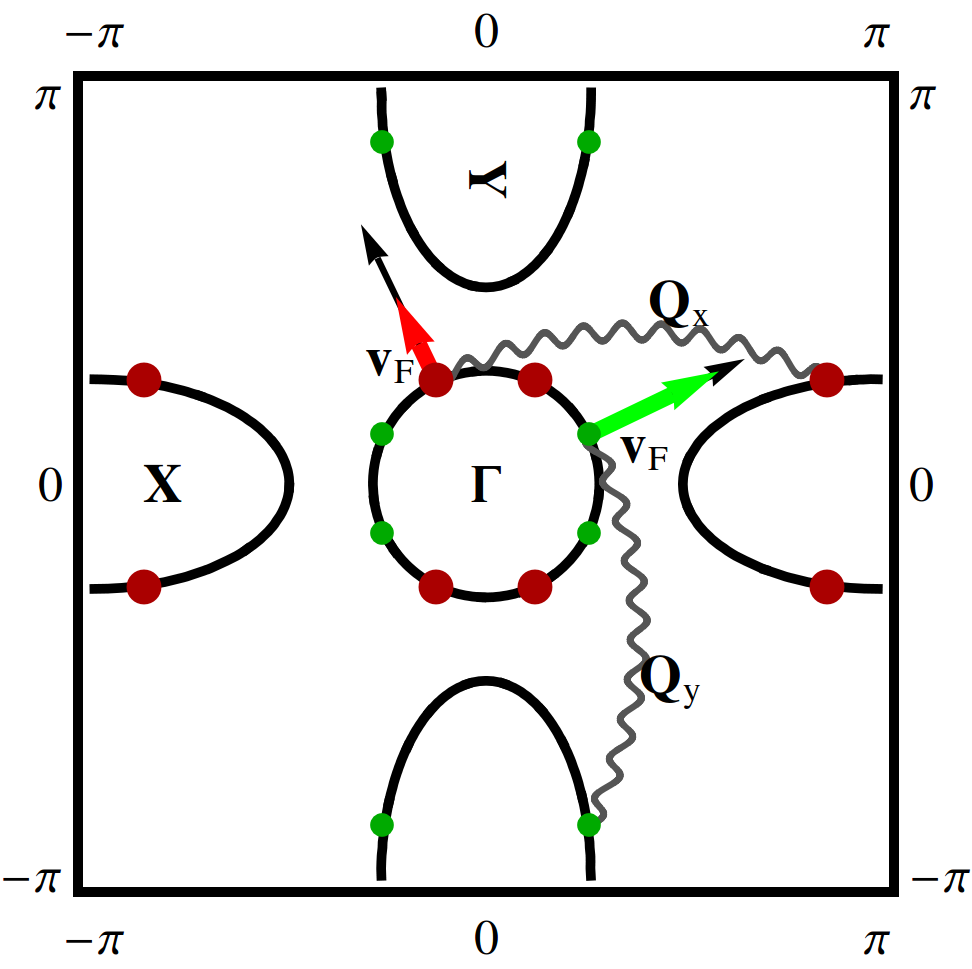
Our starting point is the minimal three band model shown in Fig. 2 Fernandes et al. (2012), and previously employed to investigate the DC conductivity anisotropy due to the scattering by spin fluctuations Fernandes et al. (2011). This model has a hole-like circular pocket centered at the point of the Fe-square lattice Brillouin zone, and two elliptical electron pockets centered at and . Hereafter, for convenience, these bands are labeled , , and , respectively. We also include in the model point-like impurities, giving rise to the isotropic band-independent elastic scattering rate .
To make the symmetry properties of the AC conductivity more evident, we consider the band-resolved conductivity for band in direction such that, . Without interactions, we have , where the subscript denotes the non-interacting system and , with density of states and averaged Fermi velocity . The tetragonal symmetry of the system implies , i.e. , yielding , as expected for a tetragonal system.
The contribution arising from the interaction with spin fluctuations is conveniently expressed in terms of the memory function , defined such that Götze and Wölfle (1972). Hence, while renormalizes the scattering rate, renormalizes the optical mass. The fact that these two quantities are related by Kramers-Kronig relations implies that an anisotropy in the scattering rate must be accompanied by an anisotropy in the optical mass, as stated in the introduction. In this framework, calculating the band-resolved AC conductivity anisotropy, , is equivalent to calculating the anisotropic memory function , since . Consequently, expansion of for small frequencies yields the anisotropic scattering rate and optical mass, .
To leading order in the interaction parameter between the electrons and the spin fluctuations, the memory function is given by the two Feynman diagrams depicted in Fig. 3 Syzranov and Schmalian (2012), where solid lines denote the electronic Green’s function and the wavy lines denote the spin fluctuation dynamic susceptibility . Here, denotes both momentum and Matsubara frequency , is the linearized dispersion of band , and is introduced in the Green’s function to incorporate the effect of impurity scattering within the Born approximation. In particular, the memory function is given by the combination of diagrams with:
| (2) | ||||
| (3) |
where is the velocity, , and . As shown by inelastic neutron scattering data Inosov D. S. et al. (2010), the magnetic susceptibility is peaked at the ordering vectors and . Therefore, the only terms that contribute to the sums above are and . At low energies and in the tetragonal phase, these susceptibilities are equal and described by , where is the magnetic energy scale, is the correlation length (in units of the lattice constant), and is the Landau damping. Indeed, this form has been widely used to fit the neutron data in pnictides Inosov D. S. et al. (2010); Diallo et al. (2010); Tucker et al. (2012). In the nematic phase, the susceptibilities become different, since magnetic fluctuations become stronger along either or . Specifically, the correlation lengths are renormalized by the nematic order parameter , yielding Fernandes and Schmalian (2012).
Such an anisotropy in the spin fluctuation spectrum, which is indeed observed experimentally Lu et al. (2014), is responsible for the anisotropy in the memory function. Consequently, it is useful to expand for small . In contrast to the isotropic contribution to the memory function Abanov et al. (2003), the behavior of is dominated by the hot spots of the Fermi surface – i.e. points of the Fermi surface connected by the magnetic ordering vectors and , (see Fig. 2). Focusing on this contribution, we find the analytical expression:
| (4) |
where we defined the dimensionless coupling constant and the complex function :
| (5) |
with denoting the digamma function. Eq. (4) naturally separates the contributions arising from the Fermi surface geometry, enconded in (see supplementary 111See Supplemental Material [url], which includes Refs.Schütt and Fernandes (2015); Johnston (2010) material for the full expression), and the contributions arising from the spin dynamics, encoded in via the two dimensionless parameters and . While is proportional to the ratio between the spin correlation length and the length scale of thermal spin fluctuations , depends explicitly on the frequency. Because we are interested in the interaction-induced corrections to the standard Drude formula, hereafter we take the limit . Terms beyond this approximation are particularly important near quantum critical points, where , and at frequencies larger than the scale set by the isotropic scattering rate , which is of the order of meV in BaFe2As2 (see supplementary material and also Johnston (2010)). Although the study of these contributions is beyond the scope of this paper, we note that for they give rise to a slower decay of than the standard Drude behavior 222A detailed study of the isotropic AC conductivity in this limit will be reported elsewhere.
In terms of the function , the anisotropies in the bare scattering rate and in the optical mass are given by and , yielding the effective scattering rate and plasma frequency anisotropies:
| (6) |
As it can be confirmed by explicit evaluation of Eq. (5), the analytical properties of the complex function enforce its real part to be positive and its imaginary part to be negative. This is because the former arises from the collision of electrons by spin fluctuations – the same process that causes a finite electronic lifetime via the imaginary part of the self-energy – whereas the latter arises from the suppression of the electronic Fermi velocity – the same process that enhances the electronic mass via the real part of the self-energy (see Fig. 1). Consequently, the two contributions to in Eq. (6) have opposite signs, resulting in a suppression of the effective scattering rate compared to the bare scattering rate . Furthermore, because of their different physical origins – inelastic collision versus Fermi velocity renormalization – the two contributions to the effective scattering rate display rather different temperature dependencies. Using Eq. (5), we find that at high temperatures () the behaviors and , whereas at low temperatures () we have and . Thus, while dominates the high-temperature regime, governs the low-temperature regime. This can be physically understood from the fact that arises from the physical collision between electrons and spin fluctuations, which are completely suppressed at , whereas arises from the suppression of the Fermi velocity, which persists down to .
Therefore, one expects that as temperature is lowered, the anisotropy of the effective scattering rate changes sign. Using characteristic values for BaFe2As2 (see supplementary material and also Johnston (2010)), meV from the residual resistivity and meV , from neutron scattering Tucker et al. (2012), we find that the two contributions become comparable at the temperature scale K. Interestingly, recent optical conductivity data in this compound Mirri et al. (2015) find such a behavior, with changing sign below the nematic transition at K. Although these compounds display also long-range magnetic order, at these temperatures the resulting reconstruction of the Fermi surface is incipient Liu et al. (2011), suggesting that the mechanism discussed here could be at play.
We emphasize that the sign change in the effective scattering rate does not cause a sign change in the DC conductivity anisotropy – also in agreement with the experiments. Indeed, as it is clear from Eq. (1), the DC conductivity anisotropy depends only on the bare scattering rate , which in turn is solely determined by , . The main consequence of the reduction of the effective scattering rate is an accompanying enhancement of the anisotropic Drude spectral weight , since depends only on , as shown in Eq. (6). Physically, this means that any suppression of the effective scattering rate is compensated by an enhancement of the effective Drude weight, keeping the DC anisotropy the same.
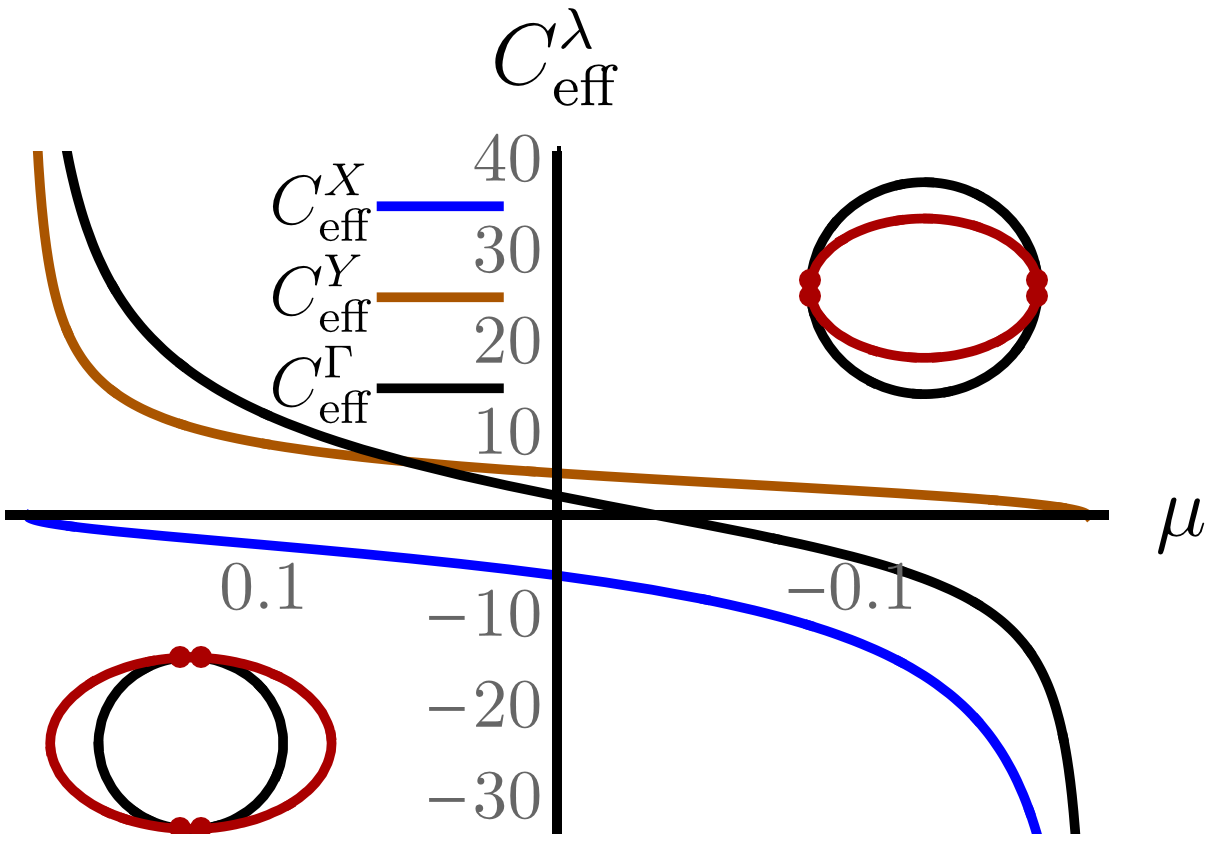
The global sign of and depend on the same parameters via Eq. (6), which are determined by the Fermi surface geometry. We calculate them explicitly in Fig. 4 for a toy model in which the hole pocket is a circle, , whereas the electron pockets are ellipses, Fernandes et al. (2011); Eremin and Chubukov (2010). By fixing the ellipticity , we find that in general the weighted sum of is positive for electron-doped compounds () and negative for hole-doped compounds (). Consequently, because for a detwinned sample with tensile strain applied along the direction Lu et al. (2014), we find and for electron-doped compounds, and and for hole-doped compounds. This agrees with previous theoretical calculations using the Boltzmann equation instead of the diagrammatic approach used here Fernandes et al. (2011); Breitkreiz et al. (2014), as well as with experiments Blomberg et al. (2013); Kuo et al. (2015).
In summary, we studied the impact of anisotropic spin fluctuations on the optical conductivity anisotropy of the nematic phase of iron-based superconductors. Our main result is that, in this case, while the DC conductivity anisotropy is determined solely by the collision of electrons and spin fluctuations, the electronic Fermi velocity renormalization induced by spin fluctuations causes opposite changes in the effective scattering rate and plasma frequencies anisotropies that exactly compensate each other in the DC limit. Our results qualitatively agree with recent optical conductivity experiments in detwinned BaFe2As2. Experimental optical studies of compounds that display nematic order without magnetic order, such as FeSe, would be desirable to further elucidate this unavoidable entanglement between scattering rate and plasma frequency anisotropies in these materials.
Acknowledgements.
We thank fruitful discussions with J. Chu, A. Chubukov, L. Degiorgi, I. Fisher, D. Maslov, and S. Syzranov. M. S. acknowledges the support from the Humboldt Foundation. J.S. acknowledges the support from Deutsche Forschungsgemeinschaft (DFG) through the Priority Program SPP 1458 “Hochtemperatur-Supraleitung in Eisenpniktiden” (project-no. SCHM 1031/5-1). R. M. F. is supported by the U.S. Department of Energy, Office of Science, Basic Energy Sciences, under Award No. DE-SC0012336.References
- Ando et al. (2002) Y. Ando, K. Segawa, S. Komiya, and A. N. Lavrov, Phys. Rev. Lett. 88, 137005 (2002).
- Chu et al. (2010) J.-H. Chu, J. G. Analytis, K. De Greve, P. L. McMahon, Z. Islam, Y. Yamamoto, and I. R. Fisher, Science 329, 824 (2010).
- Tanatar et al. (2010) M. A. Tanatar, E. C. Blomberg, A. Kreyssig, M. G. Kim, N. Ni, A. Thaler, S. L. Bud’ko, P. C. Canfield, A. I. Goldman, I. I. Mazin, and R. Prozorov, Phys. Rev. B 81, 184508 (2010).
- Dusza et al. (2012) A. Dusza, A. Lucarelli, A. Sanna, S. Massidda, J.-H. Chu, I. R. Fisher, and L. Degiorgi, New Journal of Physics 14, 023020 (2012).
- Cyr-Choinière et al. (2015) O. Cyr-Choinière, G. Grissonnanche, S. Badoux, J. Day, D. A. Bonn, W. N. Hardy, R. Liang, N. Doiron-Leyraud, and L. Taillefer, ArXiv e-prints (2015).
- Fradkin et al. (2010) E. Fradkin, S. A. Kivelson, M. J. Lawler, J. P. Eisenstein, and A. P. Mackenzie, Annual Review of Condensed Matter Physics 1, 153 (2010).
- Vojta (2009) M. Vojta, Advances in Physics 58, 699 (2009).
- Fernandes et al. (2014) R. M. Fernandes, A. V. Chubukov, and J. Schmalian, Nature Physics 10, 97 (2014).
- Schütt and Fernandes (2015) M. Schütt and R. M. Fernandes, Phys. Rev. Lett. 115, 027005 (2015).
- Fernandes and Schmalian (2012) R. M. Fernandes and J. Schmalian, Superconductor Science and Technology 25, 084005 (2012).
- Lu et al. (2014) X. Lu, J. T. Park, R. Zhang, H. Luo, A. H. Nevidomskyy, Q. Si, and P. Dai, Science 345, 657 (2014).
- Fernandes et al. (2011) R. M. Fernandes, E. Abrahams, and J. Schmalian, Phys. Rev. Lett. 107, 217002 (2011).
- Liang et al. (2012) S. Liang, G. Alvarez, C. Şen, A. Moreo, and E. Dagotto, Phys. Rev. Lett. 109, 047001 (2012).
- Breitkreiz et al. (2014) M. Breitkreiz, P. M. R. Brydon, and C. Timm, Phys. Rev. B 90, 121104 (2014).
- Allan et al. (2013) M. P. Allan, T.-M. Chuang, F. Massee, Y. Xie, N. Ni, S. L. Budḱo, G. S. Boebinger, Q. Wang, D. S. Dessau, P. C. Canfield, M. S. Golden, and J. C. Davis, Nat Phys 9, 220 (2013).
- Gastiasoro et al. (2014) M. N. Gastiasoro, I. Paul, Y. Wang, P. J. Hirschfeld, and B. M. Andersen, Phys. Rev. Lett. 113, 127001 (2014).
- Chen et al. (2010) C.-C. Chen, J. Maciejko, A. P. Sorini, B. Moritz, R. R. P. Singh, and T. P. Devereaux, Phys. Rev. B 82, 100504 (2010).
- Lv and Phillips (2011) W. Lv and P. Phillips, Phys. Rev. B 84, 174512 (2011).
- Valenzuela et al. (2010) B. Valenzuela, E. Bascones, and M. J. Calderón, Phys. Rev. Lett. 105, 207202 (2010).
- Yin Z. P. et al. (2011) Yin Z. P., Haule K., and Kotliar G., Nat Phys 7, 294 (2011).
- Mirri et al. (2015) C. Mirri, A. Dusza, S. Bastelberger, M. Chinotti, L. Degiorgi, J.-H. Chu, H.-H. Kuo, and I. R. Fisher, Phys. Rev. Lett. 115, 107001 (2015).
- Götze and Wölfle (1972) W. Götze and P. Wölfle, Phys. Rev. B 6, 1226 (1972).
- Basov and Timusk (2005) D. N. Basov and T. Timusk, Rev. Mod. Phys. 77, 721 (2005).
- Fernandes et al. (2012) R. M. Fernandes, A. V. Chubukov, J. Knolle, I. Eremin, and J. Schmalian, Phys. Rev. B 85, 024534 (2012).
- Syzranov and Schmalian (2012) S. V. Syzranov and J. Schmalian, Phys. Rev. Lett. 109, 156403 (2012).
- Inosov D. S. et al. (2010) Inosov D. S., Park J. T., Bourges P., Sun D. L., Sidis Y., Schneidewind A., Hradil K., Haug D., Lin C. T., Keimer B., and Hinkov V., Nat Phys 6, 178 (2010).
- Diallo et al. (2010) S. O. Diallo, D. K. Pratt, R. M. Fernandes, W. Tian, J. L. Zarestky, M. Lumsden, T. G. Perring, C. L. Broholm, N. Ni, S. L. Bud’ko, P. C. Canfield, H.-F. Li, D. Vaknin, A. Kreyssig, A. I. Goldman, and R. J. McQueeney, Phys. Rev. B 81, 214407 (2010).
- Tucker et al. (2012) G. S. Tucker, R. M. Fernandes, H.-F. Li, V. Thampy, N. Ni, D. L. Abernathy, S. L. Bud’ko, P. C. Canfield, D. Vaknin, J. Schmalian, and R. J. McQueeney, Phys. Rev. B 86, 024505 (2012).
- Abanov et al. (2003) A. Abanov, A. V. Chubukov, and J. Schmalian, Advances in Physics 52, 119 (2003).
- Note (1) See Supplemental Material [url], which includes Refs.Schütt and Fernandes (2015); Johnston (2010).
- Johnston (2010) D. C. Johnston, Advances in Physics 59, 803 (2010).
- Note (2) A detailed study of the isotropic AC conductivity in this limit will be reported elsewhere.
- Liu et al. (2011) C. Liu, A. D. Palczewski, R. S. Dhaka, T. Kondo, R. M. Fernandes, E. D. Mun, H. Hodovanets, A. N. Thaler, J. Schmalian, S. L. Bud’ko, P. C. Canfield, and A. Kaminski, Phys. Rev. B 84, 020509 (2011).
- Eremin and Chubukov (2010) I. Eremin and A. V. Chubukov, Phys. Rev. B 81, 024511 (2010).
- Blomberg et al. (2013) E. C. Blomberg, M. A. Tanatar, R. M. Fernandes, I. I. Mazin, B. Shen, H.-H. Wen, M. D. Johannes, J. Schmalian, and R. Prozorov, Nat Commun 4, 1914 (2013).
- Kuo et al. (2015) H.-H. Kuo, J.-H. Chu, S. A. Kivelson, and I. R. Fisher, ArXiv e-prints (2015), arXiv:1503.00402 [cond-mat.supr-con] .
I Supplementary Material: “Origin of the resistivity anisotropy in the iron pnictides: scattering rate or plasma frequency?”
I.1 Form of the Geometric Coefficient
The geometric coefficient appearing in Eq. (4) of the main text is determined using direction-resolved Fermi momentum and Fermi velocity Schütt and Fernandes (2015). Consequently this yields a direction-resolved density of states , and the density of states of a single band . Using this notation, we can express the direction-average of an arbitrary function according to . The angle here is always measured with respect to the x-axis in each pocket, as shown in Fig 5.
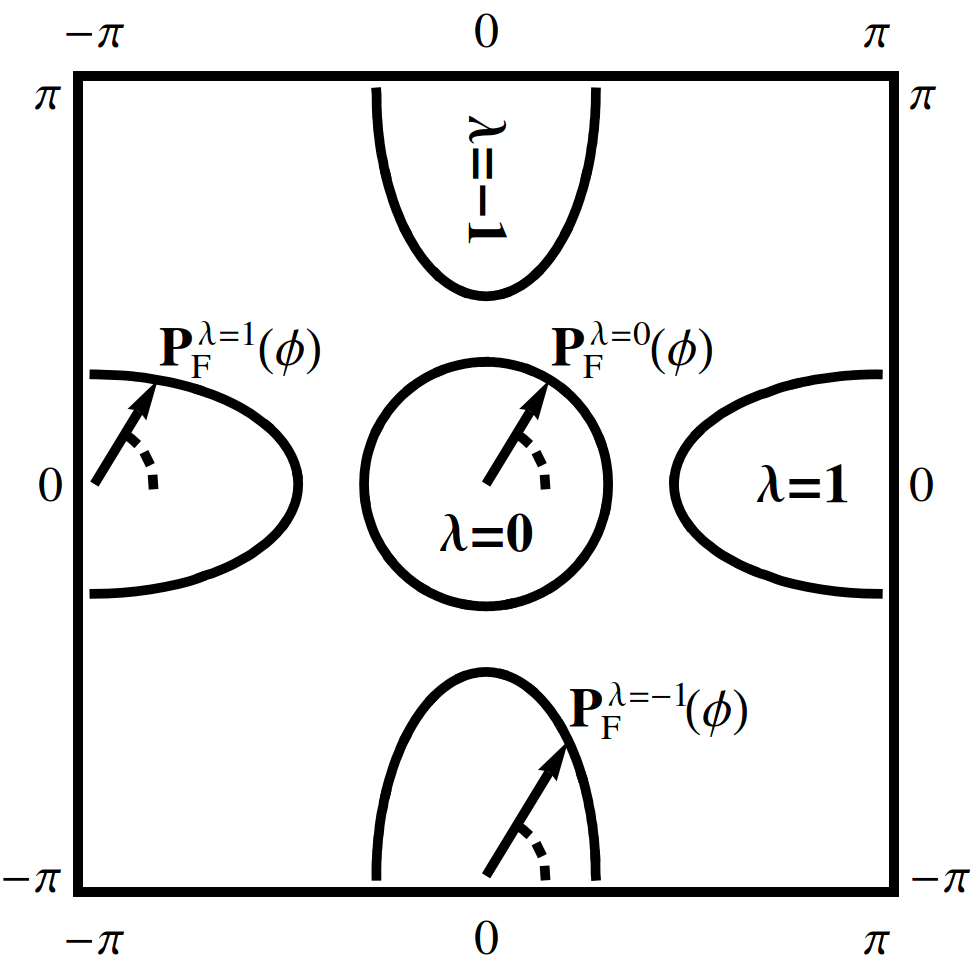
Two bands that satisfy the constraint specify which of the two electron bands is interacting with the hole band in the Brillouin center. The anisotropy arises from the hot spots, the points on the Fermi surface which upon translation by either or connect the two involved bands, i.e. . These hot spot are characterized by the hot spot angles . In terms of these quantities, the geometric coefficient is given by:
| (7) |
For the coefficient of the hole pocket , the summation includes the other two electron bands. However since the objects above obey the symmetry of the system ( and for any symmetric scalar function or vector function ), the contribution can be re-expressed in the familiar form that is proportional to .
I.2 Estimative of the impurity scattering rate
We estimated the impurity scattering rate from the residual resistivity . For simplicity, we consider the system as a cylindrical Fermi surface, such that the density can be expressed according to . Consequently the scattering rate is found to be:
| (8) |
where in the last step we measured the Fermi momentum in units of the inverse lattice constant and the unit cell volume has been used. Using typical values for the 122 pnictides Johnston (2010): we have , , , , yielding:
| (9) |