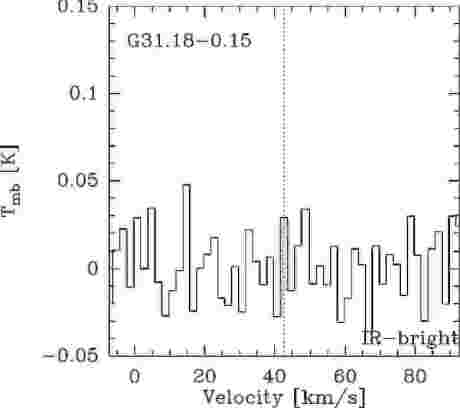
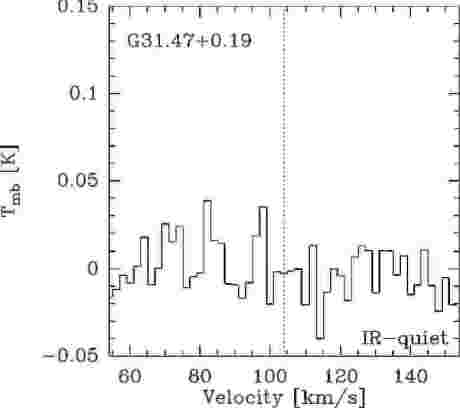
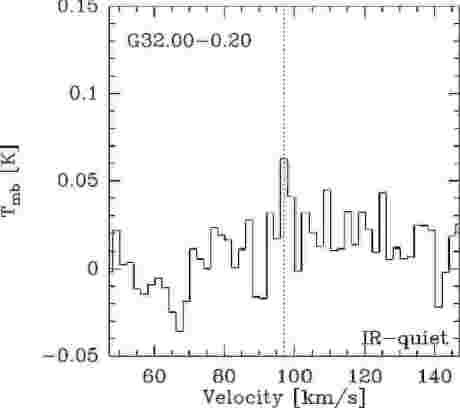
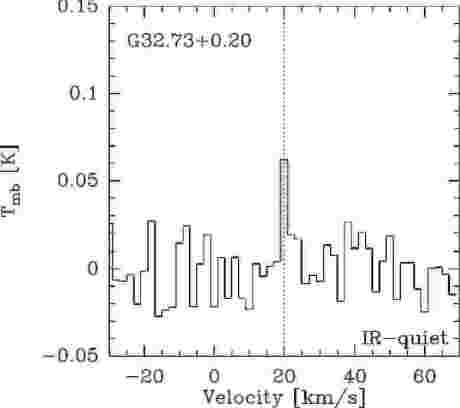
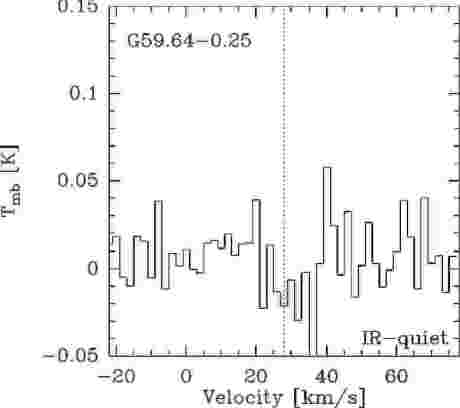
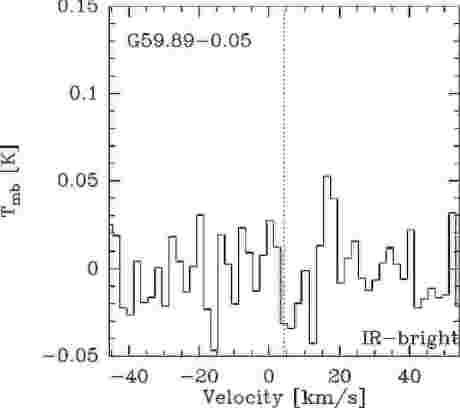
ATLASGAL-selected massive clumps in the inner Galaxy
Abstract
Context. The processes leading to the birth of high-mass stars are poorly understood. The key first step to reveal their formation processes is characterising the clumps and cores from which they form.
Aims. We define a representative sample of massive clumps in different evolutionary stages selected from the APEX Telescope Large Area Survey of the Galaxy ( and ), from which we aim to establish a census of molecular tracers of their evolution. As a first step, we study the shock tracer, SiO, mainly associated with shocks from jets probing accretion processes. In low-mass young stellar objects (YSOs), outflow and jet activity decreases with time during the star formation processes. Recently, a similar scenario was suggested for massive clumps based on SiO observations. Here we analyse observations of the SiO () and () lines in a statistically significant sample to constrain the change of SiO abundance and the excitation conditions as a function of evolutionary stage of massive star-forming clumps.
Methods. We performed an unbiased spectral line survey covering the 3-mm atmospheric window between 84117 GHz with the IRAM 30m telescope of a sample of sources of the and survey, covering various evolutionary stages of massive clumps. A smaller sample of 128 clumps has been observed in the SiO () transition with the APEX telescope to complement the () line and probe the excitation conditions of the emitting gas. We derived detection rates to assess the star formation activity of the sample, and we estimated the column density and abundance using both an LTE approximation and non-LTE calculations for a smaller subsample, where both transitions have been observed.
Results. We characterise the physical properties of the selected sources, which greatly supersedes the largest samples studied so far, and show that they are representative of different evolutionary stages. We report a high detection rate of % of the SiO () line and a % detection rate from the dedicated follow-ups in the () transition. Up to 25% of the infrared-quiet clumps exhibit high-velocity line wings, suggesting that molecular tracers are more efficient tools to determine the level of star formation activity than infrared colour criteria. We also find infrared-quiet clumps that exhibit only a low-velocity component ( km s-1) SiO emission in the () line. In the current picture, where this is attributed to low-velocity shocks from cloud-cloud collisions, this can be used to pinpoint the youngest, thus, likely prestellar massive structures. Using the optically thin isotopologue (29SiO), we estimate that the () line is optically thin towards most of the sample. Furthermore, based on the line ratio of the () to the () line, our study reveals a trend of changing excitation conditions that lead to brighter emission in the () line towards more evolved sources. Our models show that a proper treatment of non-LTE effects and beam dilution is necessary to constrain trends in the SiO column density and abundance.
Conclusions. We conclude that the SiO () line with broad line profiles and high detection rates is a powerful probe of star formation activity in the deeply embedded phase of the evolution of massive clumps. The ubiquitous detection of SiO in all evolutionary stages suggests a continuous star formation process in massive clumps. Our analysis delivers a more robust estimate of SiO column density and abundance than previous studies and questions the decrease of jet activity in massive clumps as a function of age. The observed increase of excitation conditions towards the more evolved clumps suggests a higher pressure in the shocked gas towards more evolved or more massive clumps in our sample.
Key Words.:
Surveys – Stars: massive – Stars: formation – ISM: abundances – ISM: jets and outflows1 Introduction
The origin of high-mass stars is still an enigma in modern astrophysics. To reveal the processes playing a major role in their formation, first the origin of their mass reservoir, and, thus, the origin of massive clumps, needs to be studied. The APEX Telescope Large Area Survey of the Galaxy ( and survey), covering a 420 sq. deg area of the inner Galaxy (Schuller et al., 2009; Csengeri et al., 2014), provides unprecedented statistics of massive clumps hosting various evolutionary stages of embedded high-mass (proto-)stars.
Molecular tracers are useful tools to study physical conditions such as temperature and density within massive clumps. The various species may provide zooming lenses, even if the internal structure of the clump is observationally not resolved, molecular emission probes different layers and physical components, revealing the properties of both the diffuse and dense gas. Spectral surveys have so far targeted a few selected sources in mostly distinct evolutionary stages, such as UC-H II regions, high-mass protostellar objects (HMPOs; e.g. Klaassen et al., 2012), and infrared dark clouds (IRDCs; e.g. Beuther & Sridharan, 2007; Vasyunina et al., 2011). Larger samples covering a broad range of evolutionary stages are needed for statistical analysis of their molecular properties. Examples of these studies are e.g. Codella et al. (1999); Miettinen et al. (2006); Motte et al. (2007); Sakai et al. (2010); López-Sepulcre et al. (2011); Sanhueza et al. (2012); Gerner et al. (2014) which cover and compare various evolutionary stages, with the largest sample of 159 clumps studied in 37 IRDCs by Sanhueza et al. (2012).
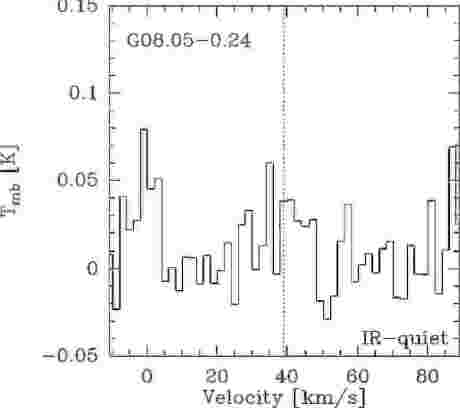
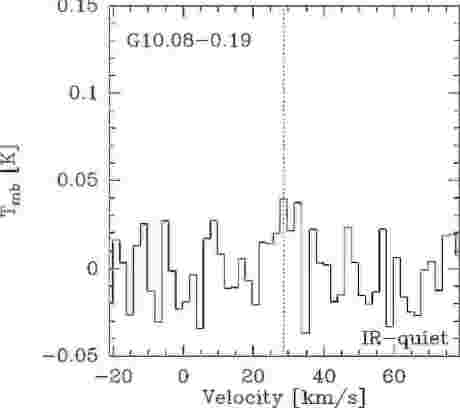
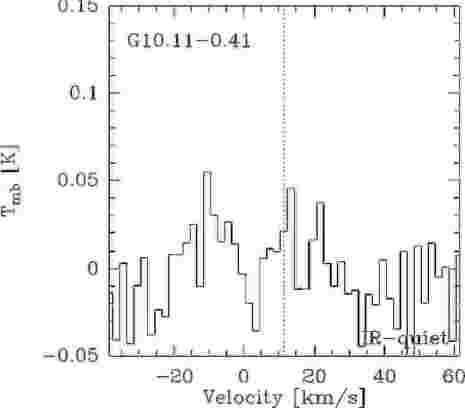
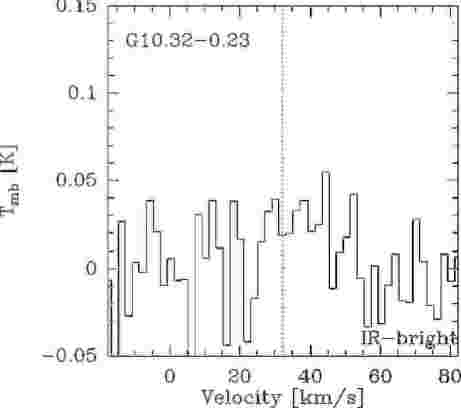
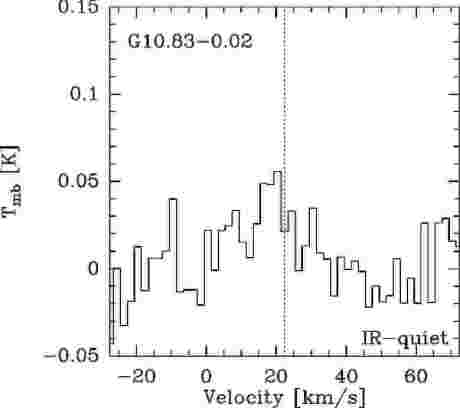
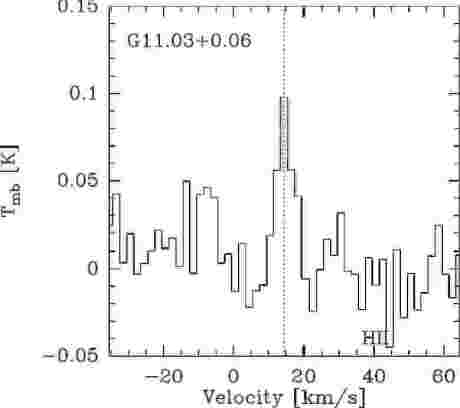
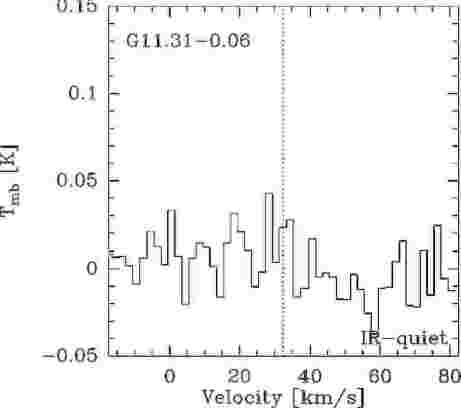
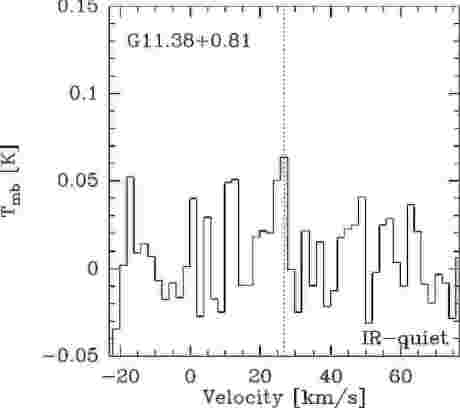
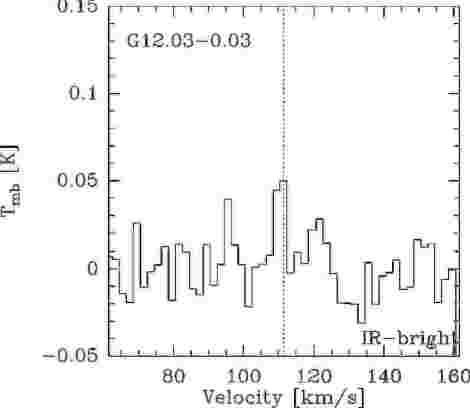
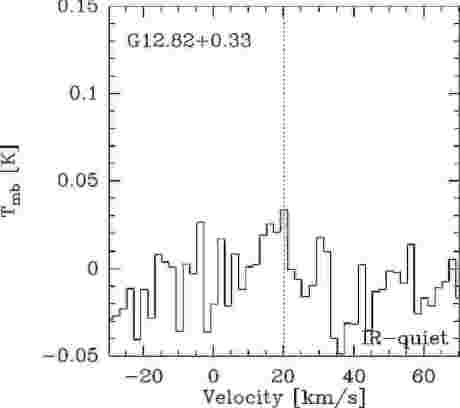
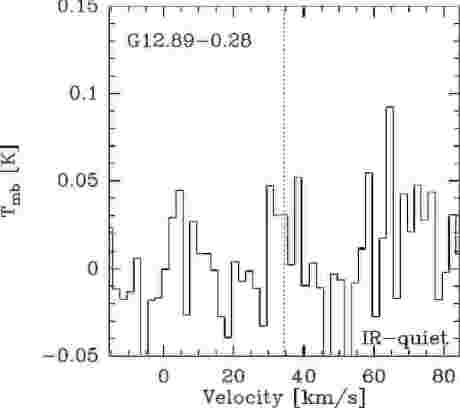
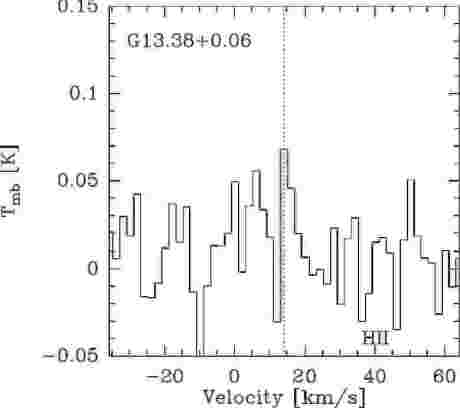
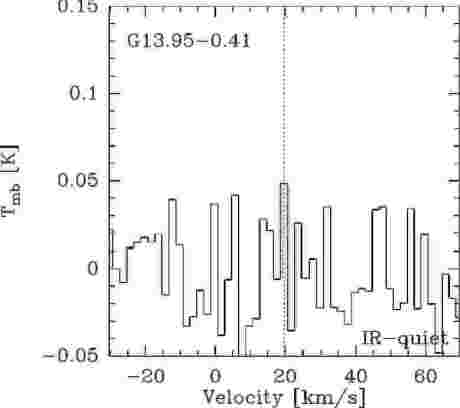
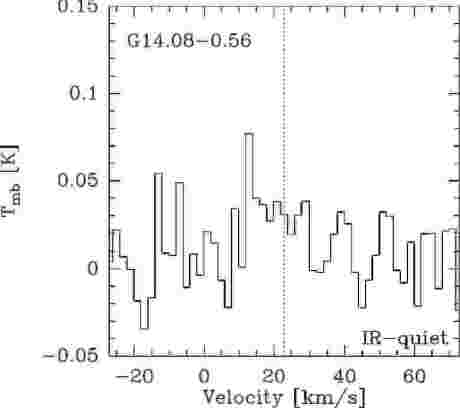
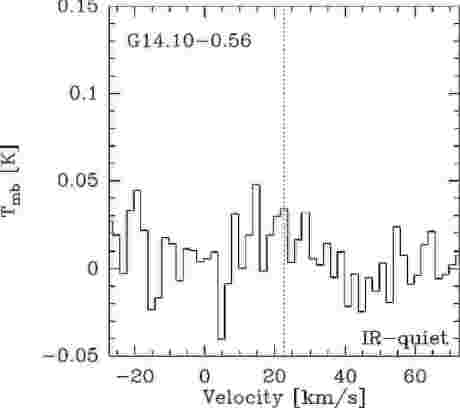
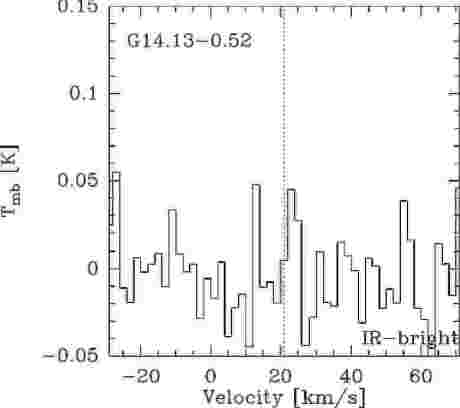
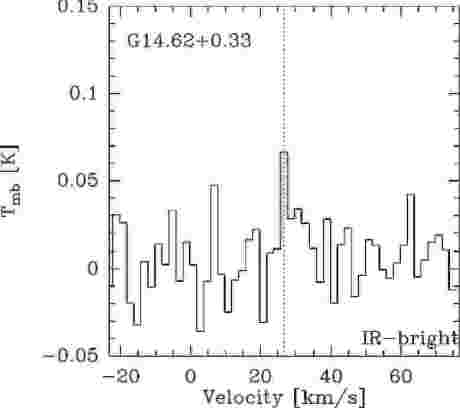
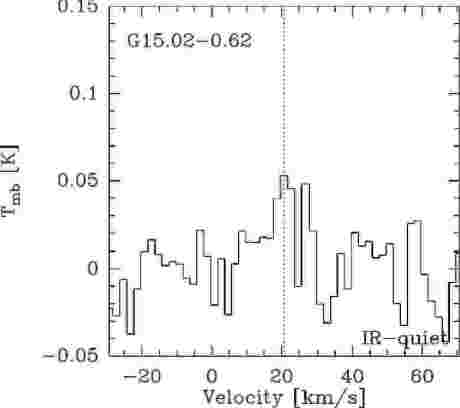
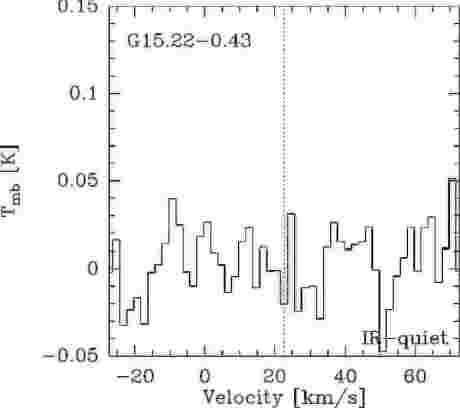
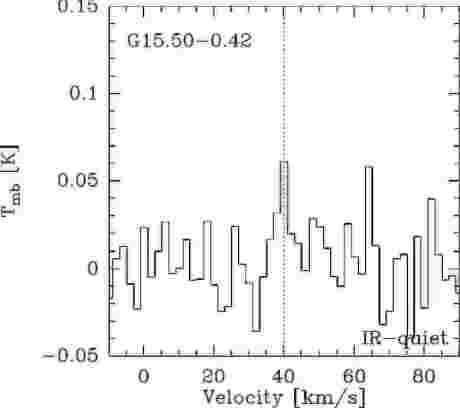
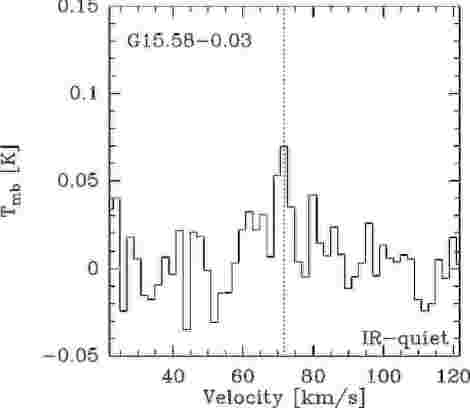
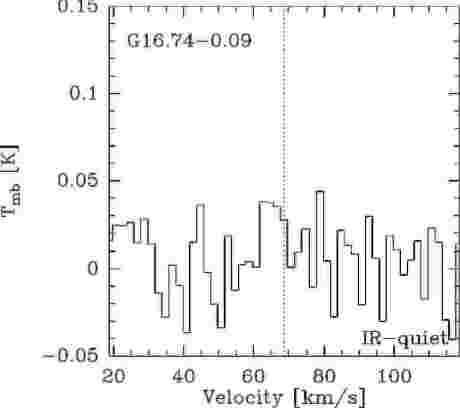
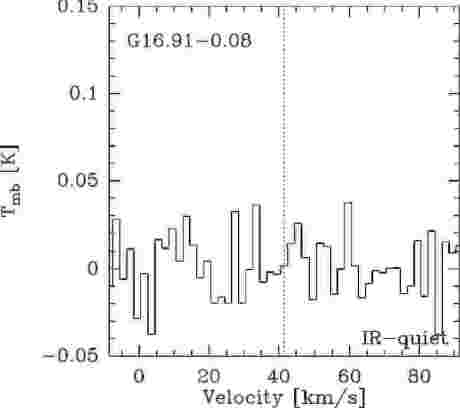
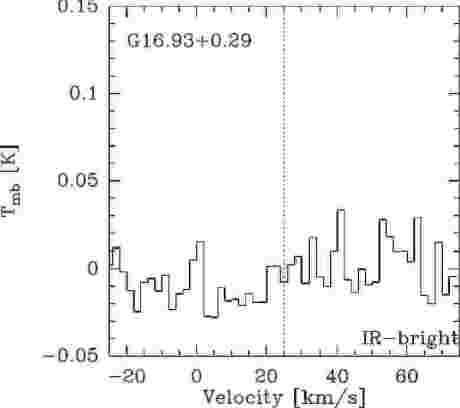
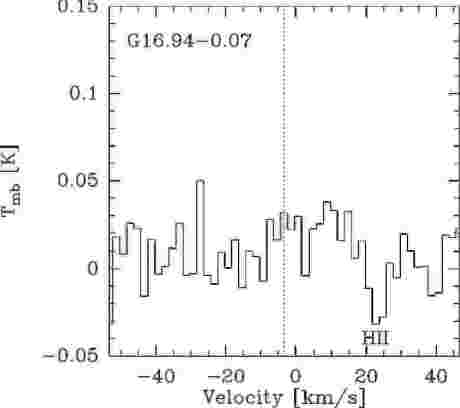
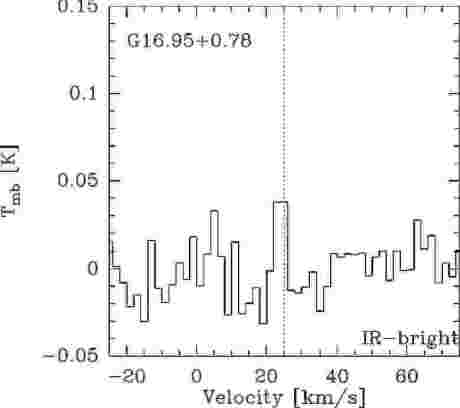
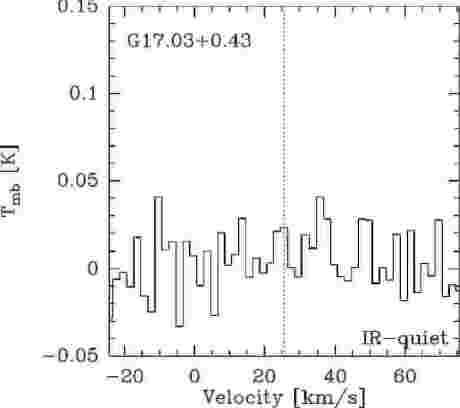
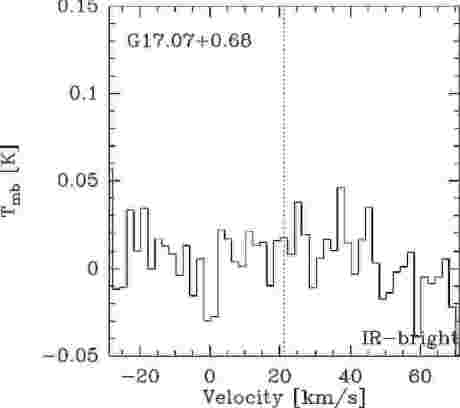
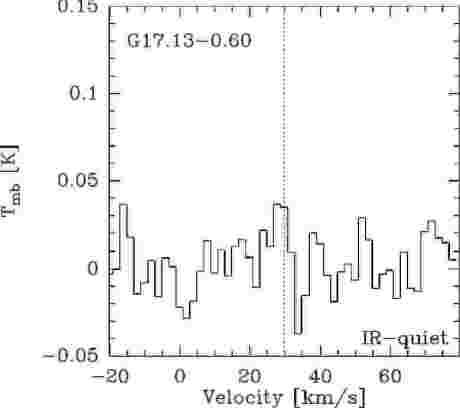
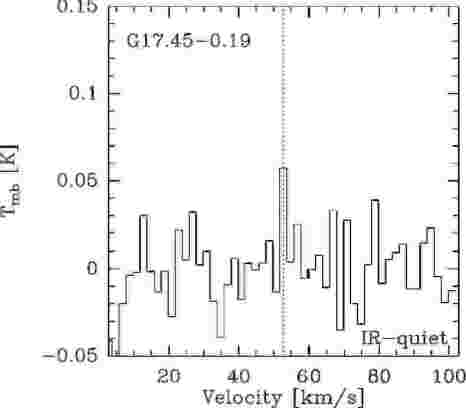
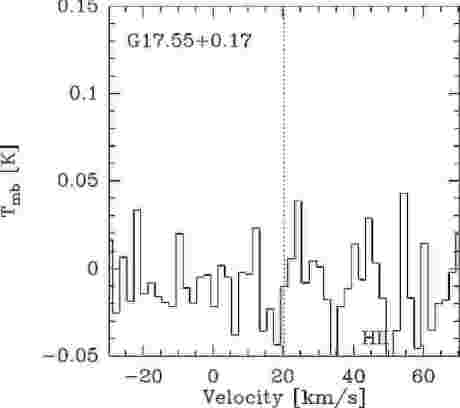
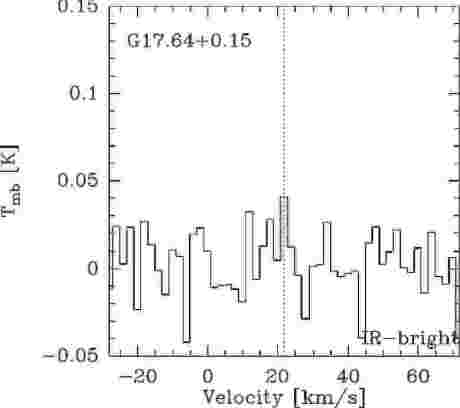
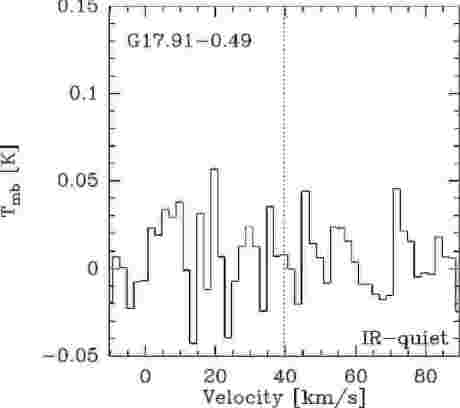
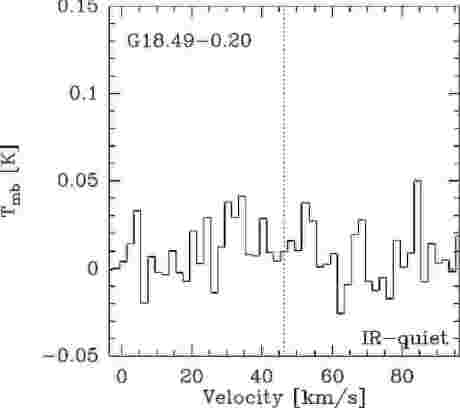
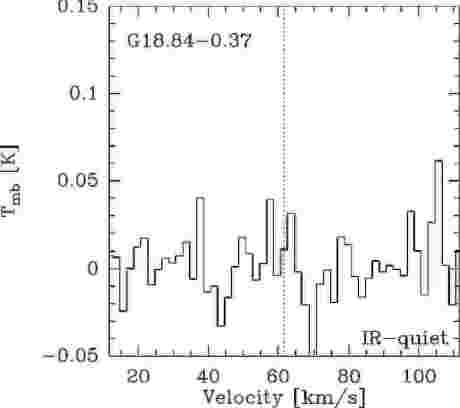
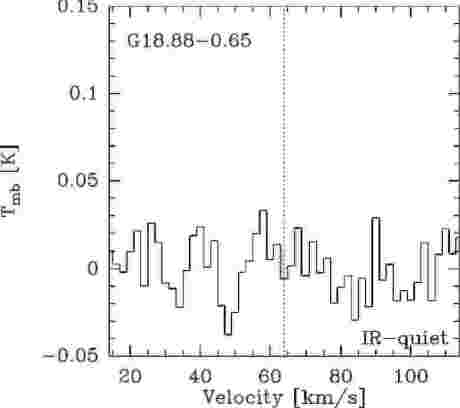
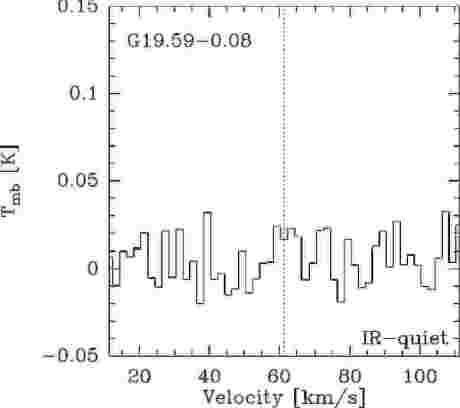
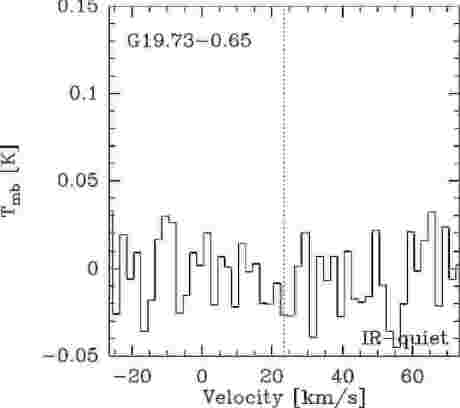
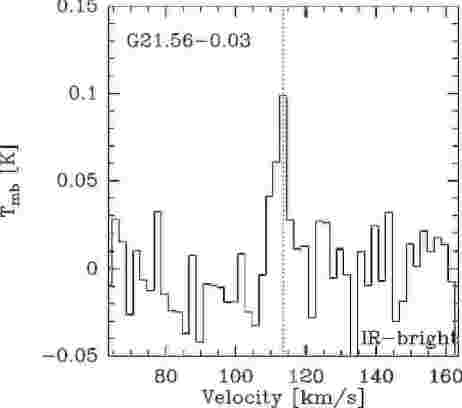
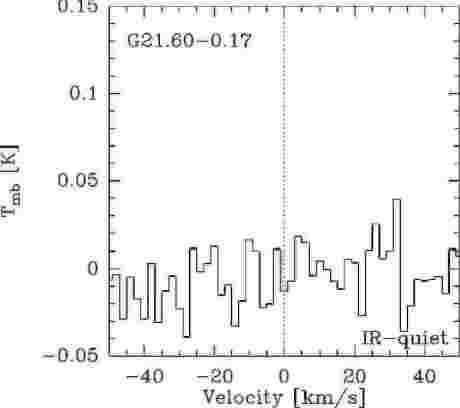
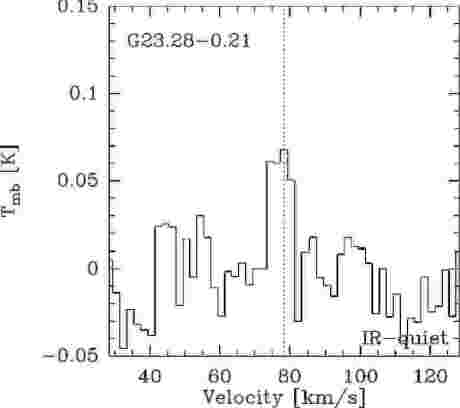
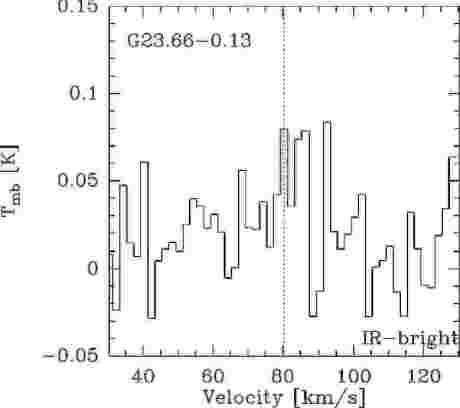
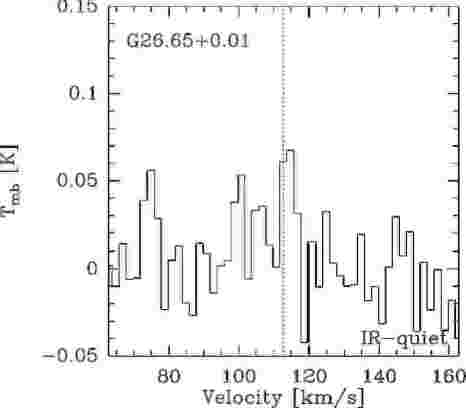
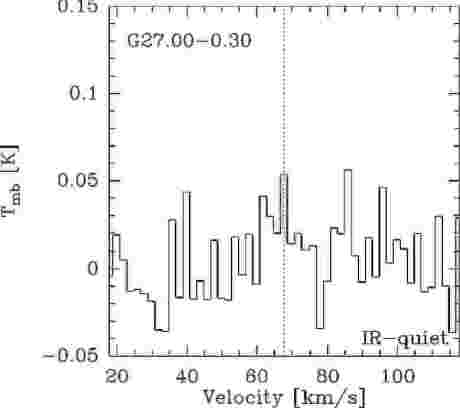
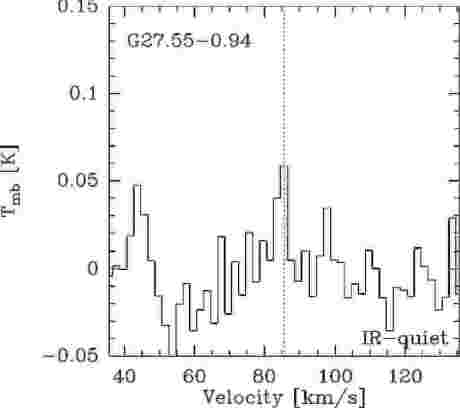
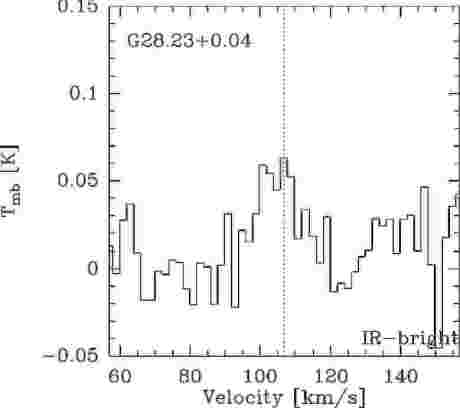
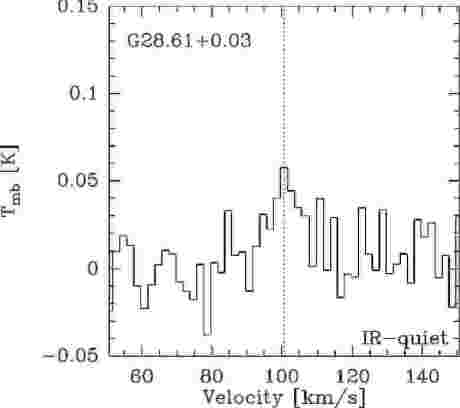
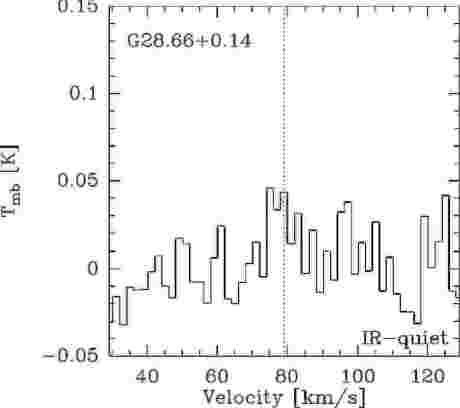
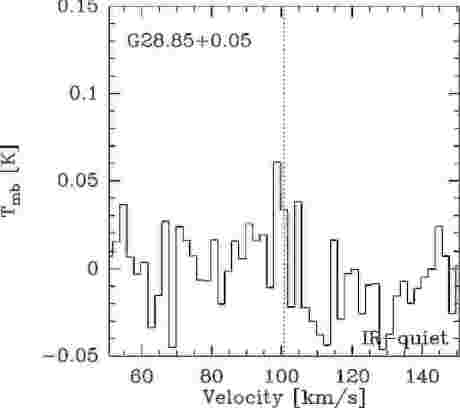
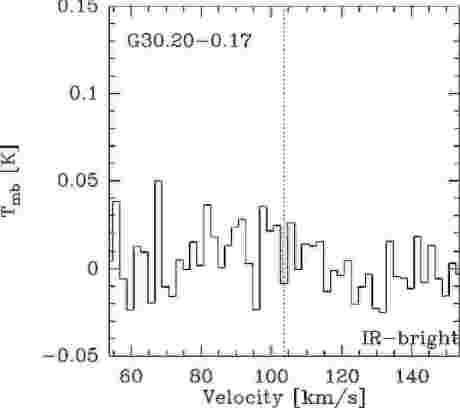
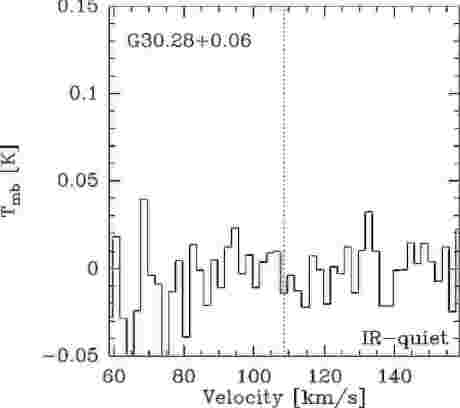
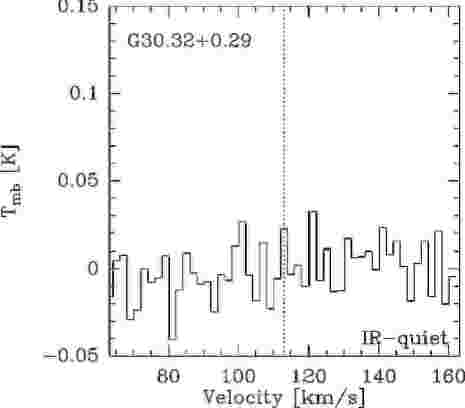
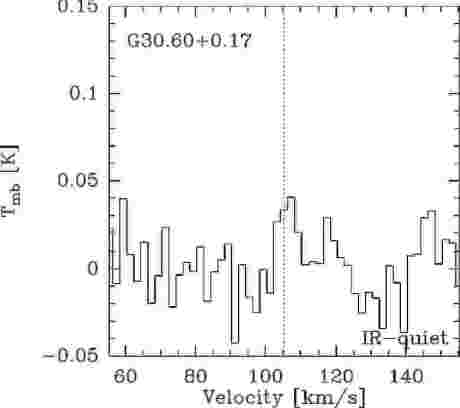
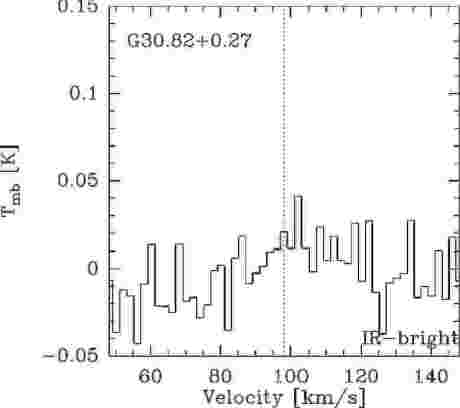
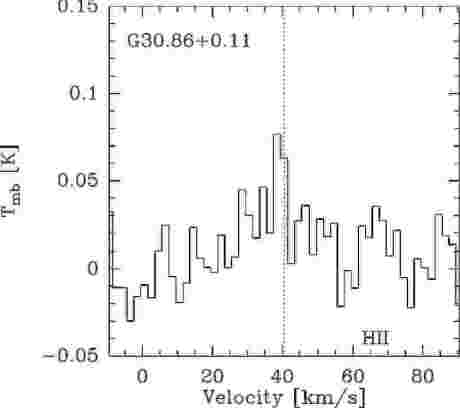
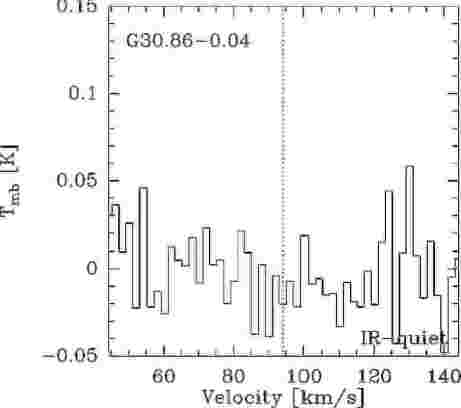
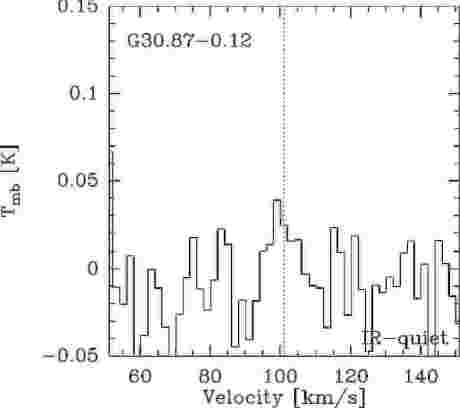
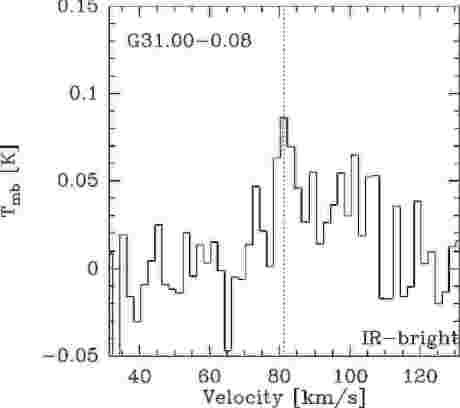
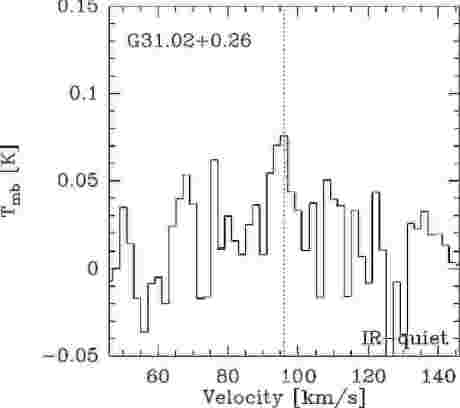
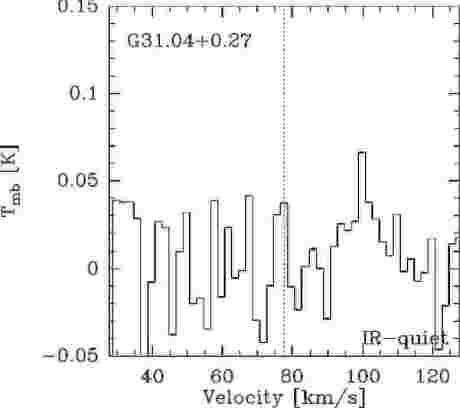
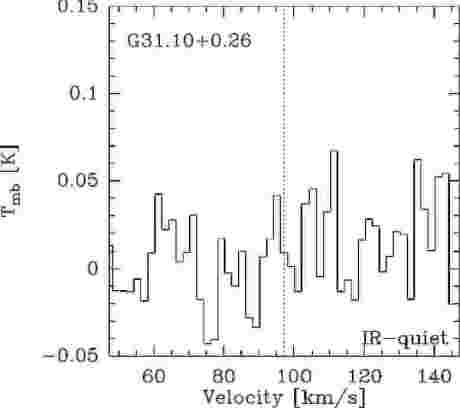
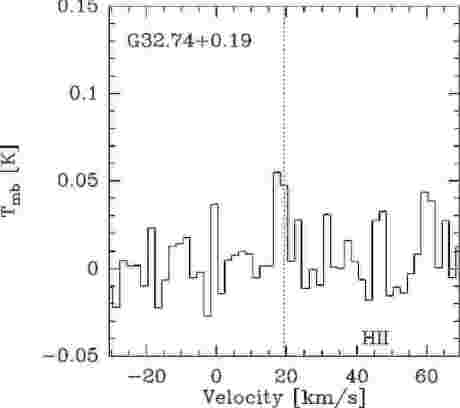
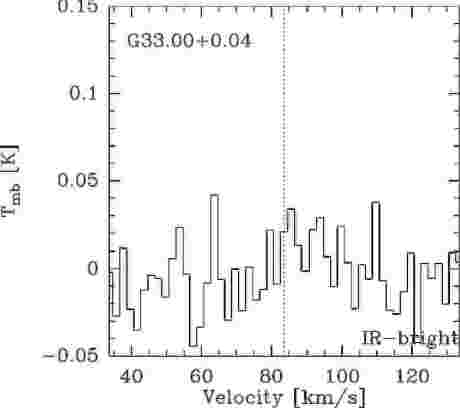
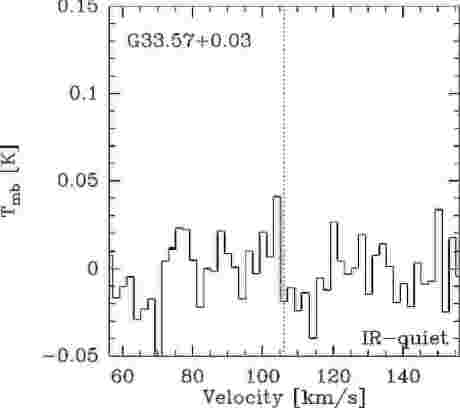
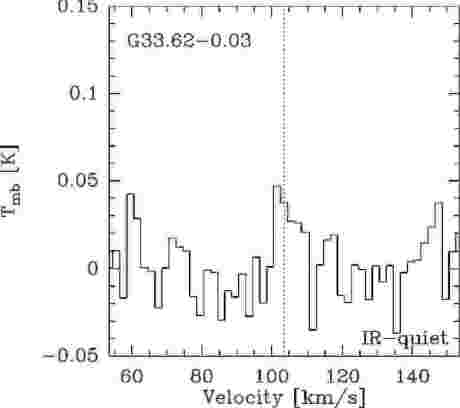
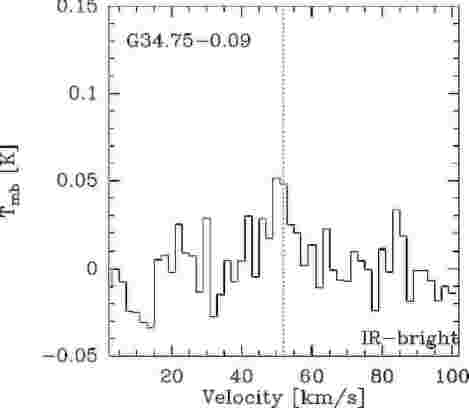
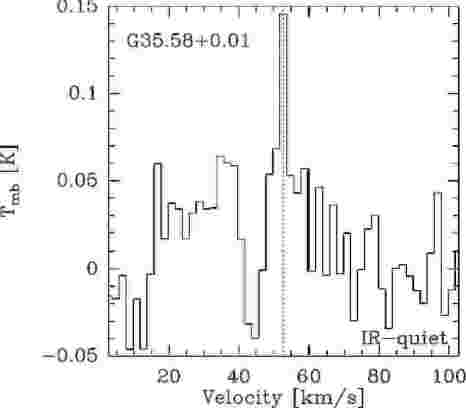
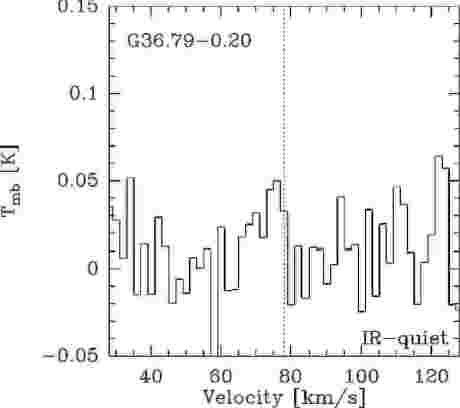
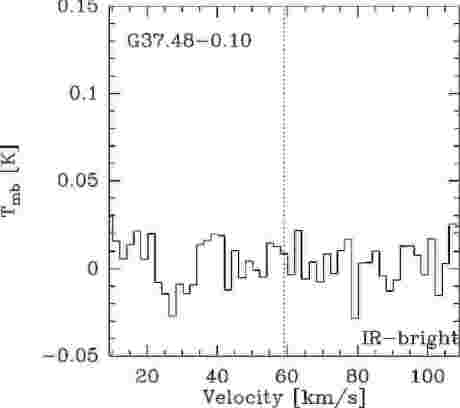
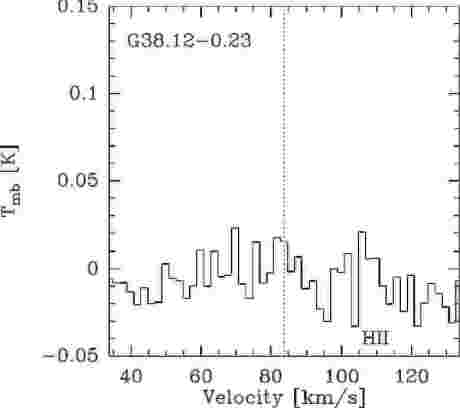
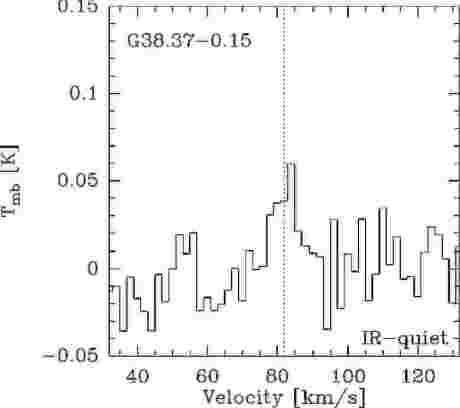
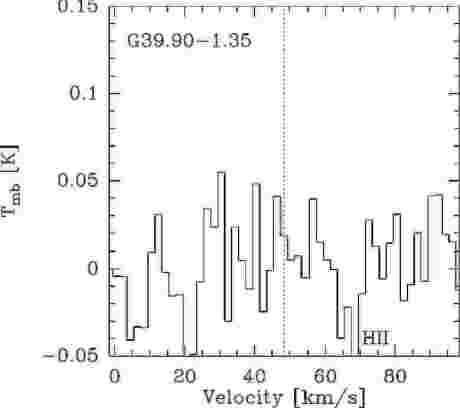
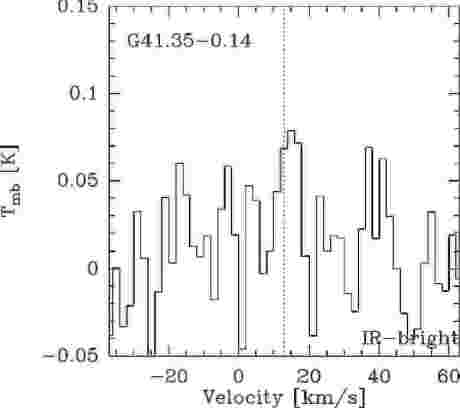
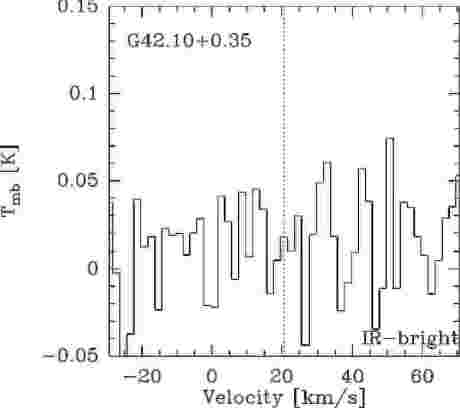
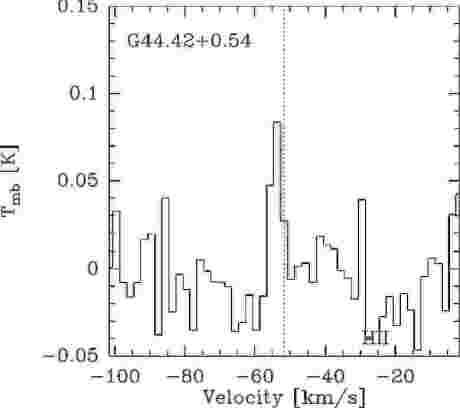
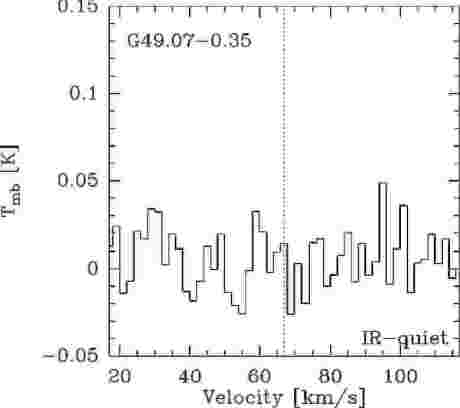
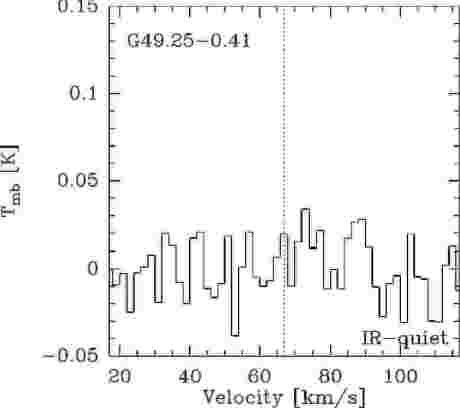
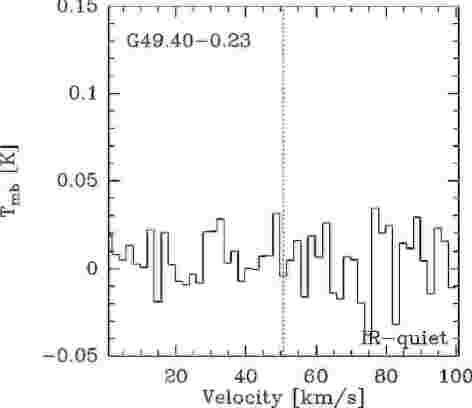
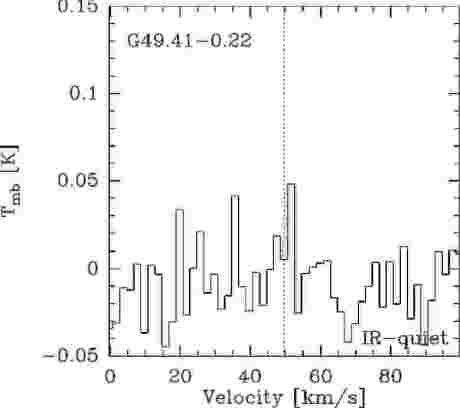
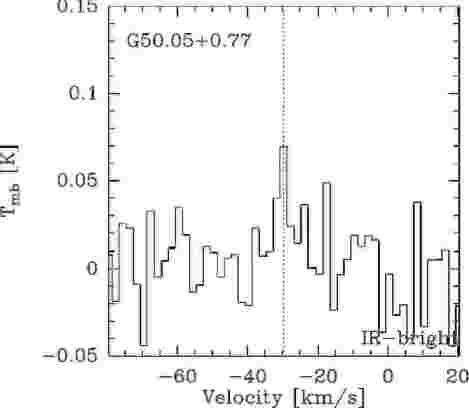
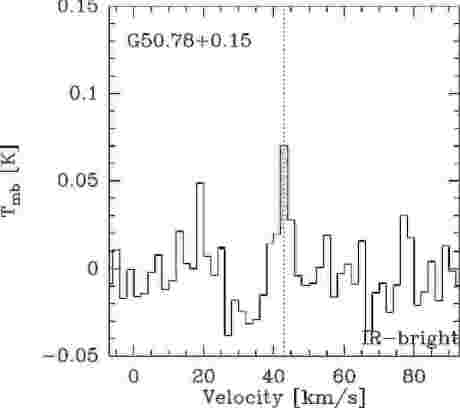
Since complete samples drawn from Galaxy-wide surveys, such as and , are now available, we have undertaken an unbiased spectral line survey with the IRAM 30m telescope. This survey covers 32 GHz of the 3-mm atmospheric transmission window towards an unprecedentedly large sample of 430 clumps selected from and representing various stages of high-mass star formation (see example in Fig. 1). Tracing the low-J transitions of several species, this survey aims to characterise the physical conditions and chemical imprints of the evolution of massive clumps while forming high-mass stars. In particular, we present here a dedicated study focusing on the low-J SiO emission of this survey to provide an observational framework to constrain shock- and clump evolution models. Based on the and survey and complementary stellar tracers, we have selected the largest, and likely most complete, sample of massive clumps ranging in evolution from the starless, infrared-quiet to the infrared-bright and UC-H II stage for which the change of SiO emission, and consequently the evolution of shocks and jets, can be addressed.
Shocks seem to be a ubiquitous phenomenon in the process of star formation. Fast shocks related to outflows have been regularly observed at sites of massive protostars (e.g. Beuther et al., 2004; Qiu et al., 2007; Duarte-Cabral et al., 2014), while the role of low-velocity shocks forming massive structures has just started to be explored (Csengeri et al., 2011a, b; Nguyen-Luong et al., 2013). A characteristic tracer of shocks is the SiO molecule, which has been observed in various conditions such as (extremely) high-velocity shocks ( up to 100 km s-1) related to powerful jets from protostars, photon-dominated regions (PDRs) and low-velocity shocks ( km s-1). Although it is commonly used as an indirect tracer of jet activity revealing the processes of material ejection from young protostars (Codella et al., 1999; Nisini et al., 2007; Duarte-Cabral et al., 2014), the mechanisms responsible for the observed complex line profiles are not well constrained by shock models (see also Lefloch et al., 1998; Jiménez-Serra et al., 2005; Anderl et al., 2013).
Previous studies targeting smaller samples report evolutionary trends seen in the abundance of shock tracers, such as SiO. Codella et al. (1999) studied SiO emission towards both low- and high-mass young stellar objects (YSOs) and found a trend of brighter SiO emission from higher luminosity sources, suggesting more powerful shocks in the vicinity of more massive YSOs. The studies of Motte et al. (2007) and Sakai et al. (2010), focusing only on massive clumps and cores, found a difference between mid-infrared dark and bright sources, suggesting an evolutionary trend of shocks from protostars in massive clumps. The colder, thus, younger sources showed brighter SiO emission in the line, while mid-infrared bright sources were found to show weaker emission. Motte et al. (2007) and Sakai et al. (2010) interpreted this result as indicating that the younger sources are associated with newly formed shocks compared to the older shocks towards the more evolved objects. Using the same transition, Miettinen et al. (2006) also reports a decrease in SiO abundance in warmer, i.e. likely more evolved sources. The study of Beuther & Sridharan (2007) targets a larger sample of 43 IRDCs in the line, and finds that it is barely detected in quiescent clumps. The largest statistical sample was studied by López-Sepulcre et al. (2011), who report a decrease of SiO () line luminosity as a function of . This finding was further supported by Sánchez-Monge et al. (2013) on a smaller sample and complemented with the transition. However, the López-Sepulcre et al. (2011) study only considers line luminosities without attempting to estimate the SiO abundance.
Other studies, however, such as Sanhueza et al. (2012), Miettinen (2014), and Leurini et al. (2014), find no trend of a decreasing SiO intensity; in particular, Miettinen (2014) reports increasing SiO abundance towards infrared-bright clumps, following the findings of Gerner et al. (2014). The aim of this study is therefore to investigate the SiO abundance and excitation variations looking for evolutionary trends and thus monitor the shock activity in a Galactic-wide sample of massive clumps. Taking this a step further, we calculate the SiO abundance and use it as an independent value to investigate the statistical trends in the sample. In addition, we complement a large fraction of the sources with the SiO () line, probing a higher energy transition and thereby allowing the investigation of excitation effects. Using a larger sample, probing more transitions and performing LTE and non-LTE abundance estimations, this study represents the most complete approach in which single-dish telescopes have been used to establish a census of SiO emission associated with massive clumps hosting a variety of evolutionary stages. Based on this large sample of massive clumps, we derive statistical trends in SiO emission and thus characterise the shock properties along the evolution of massive clumps.
The paper is summarised as follows: Sect. 2 describes the observations and Sect. 3 describes the targeted sample. In Sect. 4 we discuss the results in terms of detection rates and statistics, and we also discuss the line profiles. The analysis of the derived abundances and the excitation conditions is presented in Sect. 5, and the results are discussed in Sect. 6. The conclusions are summarised in Sect. 7.
2 Observations and data reduction
2.1 IRAM 30m observations: Molecular fingerprints of massive clumps
The present study is based on an extensive spectroscopic follow-up project of and sources carried out with the IRAM 30m telescope111IRAM is supported by INSU/CNRS (France), MPG (Germany), and IGN (Spain). and the EMIR receiver. Over 430 sources have been selected in various evolutionary stages to be observed as part of this unbiased spectral line survey covering almost the entire 3 mm atmospheric window, corresponding to a frequency range between 84 GHz GHz (Fig. 1).
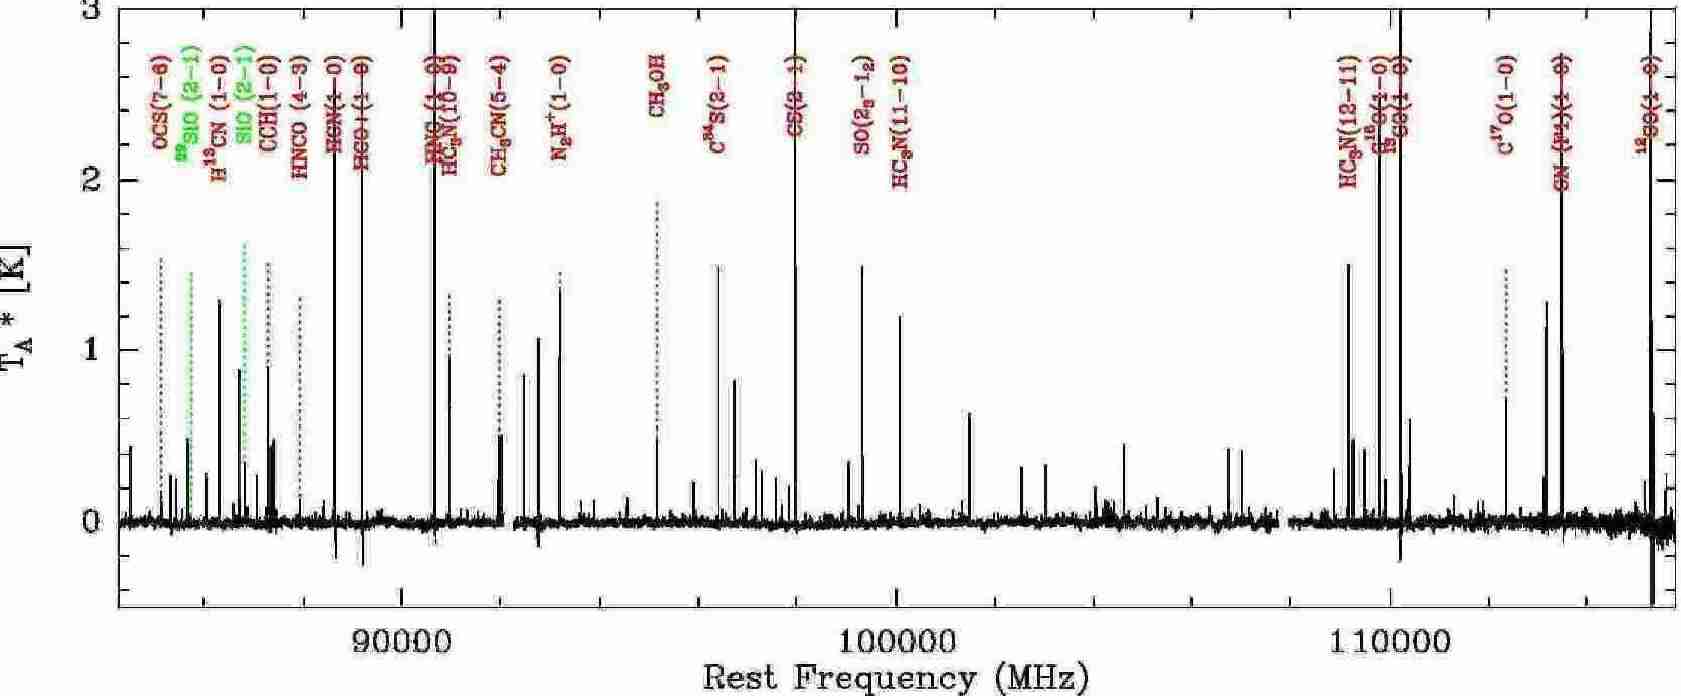
The observations have been carried out in two sessions. First, in a pilot study, we targeted a smaller sample of the 36 most extreme sources in terms of sub-millimeter peak flux density from the and survey between GHz. These observations were carried out between the and of April 2011. The Fast Fourier Transform Spectrometer (FFTS) backend was used in 200 kHz spectral resolution giving a velocity resolution between and km s-1 across the band. This frequency range was covered in 4 GHz blocks, using the actual capabilities of the receiver and backends. We also correlated the signal in eight different setups with the VESPA backend giving a velocity resolution of 0.08 km s-1.
We carried out the second part of the project on several days between the 22nd February and 13th of March in the observing pool, as well as between and 22nd of October 2012222The corresponding IRAM project ids for this set of observations are: 181-10, 049-11, 037-12, respectively., similarly in the observing pool. We used the FTS backends together with the 16 GHz instantaneous bandwidth of the EMIR receiver in dual polarisation. The frequency range between GHz was covered in two setups centred on 86 and 94 GHz, respectively, in the lower inner band of the receiver. The FTS backend was used with 200 kHz spectral resolution, giving the same velocity resolution as described above. A summary of the observations is listed in Table 1.
Both observing campaigns used the same observing strategy: pointing and focus were checked regularly and a reference spectrum was obtained at the beginning of the observations. The cross-calibration of each observing session is described in Sect. A. During the pilot study, several of the targets themselves served as reference, while in the second campaign the spectral line calibrator G34.26+0.15 was regularly observed. The observations were carried out in position switching mode with a constant offset for the reference position of 10′ in RA and DEC.
From this survey the current paper focuses only on the SiO () transition at 86.847 GHz, as well as the 29SiO () line at 85.759 GHz. Analysis of the other transitions will be presented in a subsequent series of papers. To go from to temperature scales, we applied a beam efficiency correction of 0.81. After defining a window around the lines, a baseline of order 3 was removed from the spectra over a limited velocity range of 150 km/s around the line. The varies between 97 and 222 K, and we measure an noise level of mK averaged in a 2 km s-1 velocity bin on scale. The nominal velocity resolution and beam sizes are indicated in Table 1.
2.2 APEX observations
We followed up a smaller sample of 128 sources, including all the nearby massive clumps and those exhibiting the brightest SiO () detections in the different source categories (see Sect. 3.2) with the APEX telescope333APEX is a collaboration between the Max-Planck-Institut für Radioastronomie, the European Southern Observatory, and the Onsala Space Observatory., using the APEX-1 receiver centred on 217.2 GHz. The XFFTS backends provided a 77 kHz spectral resolution. The corresponding velocity resolution and the beam size are indicated in Table 1.
Pointing and focus were checked regularly, and the same observing strategy was adopted as for the observations with the IRAM 30m telescope. A baseline of order 3 was removed from the spectra and a beam efficiency of 0.75 has been applied. The varies between 143 and 280 K, and we measure the noise between 15 and 30 mK on a scale at a velocity resolution smoothed to 2 km s-1.
| Date | No. of sources | Instruments | Frequency range | Velocity resolution | Beama𝑎aa𝑎aThe beam size is given at the frequencies of the SiO (2–1) and SiO (5–4) lines. | []b𝑏bb𝑏bThe noise per channel is given for 2 km s-1 velocity bins. |
|---|---|---|---|---|---|---|
| – April 2011 | 36 | IRAM 30m/EMIR | 84–117 GHz | to km s-1 | 29″ | 20 mK |
| February, October 2012 | 395 | IRAM 30m/EMIR | 84–117 GHz | to km s-1 | 29″ | 20 mK |
| July – October 2013 | 128 | APEX/SheFI | 215.2–219.2 GHz | km s-1 | 28″ | 15–30 mK |
3 A sample of massive clumps from the and survey
The targeted sources have been selected from the and survey (Schuller et al., 2009; Csengeri et al., 2014), where flux limited samples corresponding to various evolutionary stages of star formation have been identified. In the following, we describe the physical properties of the sample starting with a discussion of their distances (Sect. 3.1), and then, we characterise their evolutionary stage using ancillary tracers (Sect. 3.2). We then estimate their evolutionary stage assessing their mid-infrared monochromatic luminosity (Sect. 3.3). We discuss the dust properties obtained from the and survey (Sect. 3.4), and finally describe a mass- and distance-limited sample (Sect. 3.5), which is used for a part of the analysis.
3.1 Distances
Over 1000 sources from the and survey have been surveyed in the NH3 (1,1) transition to determine kinematic distances (Wienen et al., 2012, 2015). We used H I absorption against the background continuum and H I emission spectra to distinguish between the near and far distance solution. Towards young sources, where no background continuum is observed (i.e. prior to the appearance of ionizing emission associated with expanding H II regions) and the source is seen in absorption at 22 m with WISE, we systematically consider the source to be at the near distance. Since several of our sources have been studied in detail as part of the Red MSX survey (RMS; Lumsden et al., 2013), we adopted their distance estimate where available (Urquhart et al., 2014).
The distance distribution of the sample is shown in Fig. 2. We have a small fraction (%) of sources at large distances ( kpc), which are mainly clumps with embedded H II regions and/or bright massive young stellar objects (MYSOs) identified by the RMS survey. Massive clumps with H II regions are more evenly distributed in distance, while both the infrared-bright and infrared-quiet clumps peak at kpc (for a description of source classification, see Sect. 3.2). This is a selection effect, since nearby sources appear brighter and have therefore been preferred in the initially flux-limited sample selection (see also Giannetti et al., 2014). Infrared-quiet clumps seem to have a similar distribution as a function of distance as clumps hosting MYSOs. The mean and median values of the adopted distances of the sample (5.0 and 4.6 kpc, respectively) show that on average clumps associated with embedded UC-H II regions are more distant with a broader distribution, while star-forming clumps without radio emission are on average at a closer distance and show a smaller scatter. Infrared-quiet clumps are the most nearby sources with an even smaller scatter. The statistical properties of the sample are summarised in Table 2.

3.2 Classification of the sources
The sources have been selected to represent various evolutionary stages of high-mass star formation (see also Giannetti et al., 2014). After the original sample selection, new catalogues became available and therefore we refine this classification to reflect the physical properties of the dominating embedded source in distinct evolutionary stages better. Below we provide the details of the classification:
-
(1)
Clumps hosting (UC-)H II regions have been identified by cross-correlating the dust peaks with the CORNISH catalogue (Hoare et al., 2012; Purcell et al., 2013), which were then further classified as (UC-)H II regions by Urquhart et al. (2013), and the extensive follow-up observations by the RMS Survey (Lumsden et al., 2013). This category therefore consists of genuine sources showing free-free emission from already formed high-mass star(s) (MM⊙).
-
(2)
Clumps with embedded protostars and/or YSOs have been identified by cross-matching the dust peaks with the WISE point source catalogue (see also Sect. 3.3). These infrared-bright, star-forming clumps host a point source in the 22 m band of WISE, but lack detectable free-free emission at radio wavelengths. Part of this sample consists of genuine MYSOs, which have also been identified in the RMS Survey, while the rest of the sample host likely a low- or intermediate-mass protostar at this, mid-infrared bright stage of its evolution. The embedding clump is, however, in several cases massive enough to form high-mass stars, and therefore even the weaker sources are likely to be precursors of massive protostars.
-
(3)
Infrared-quiet clumps have no embedded point source associated with the dust peak in the 22 m band in the WISE point source catalogue. These sources show no mid-infrared signatures of an embedded protostar or protocluster coinciding with the dust peak. They are expected to be the youngest in the sample, either hosting deeply embedded Class 0-like high-mass protostars (Bontemps et al., 2010), or an even earlier stage of gravitationally bound structures on the verge of collapse, i.e. prestellar or starless clumps. Several of these clumps appear in absorption against the mid-infrared background and are associated with IRDCs. We term these sources to be infrared-quiet, similar to the terminology used by, for example Motte et al. (2007); Bontemps et al. (2010); Csengeri et al. (2011a) for massive dense cores.
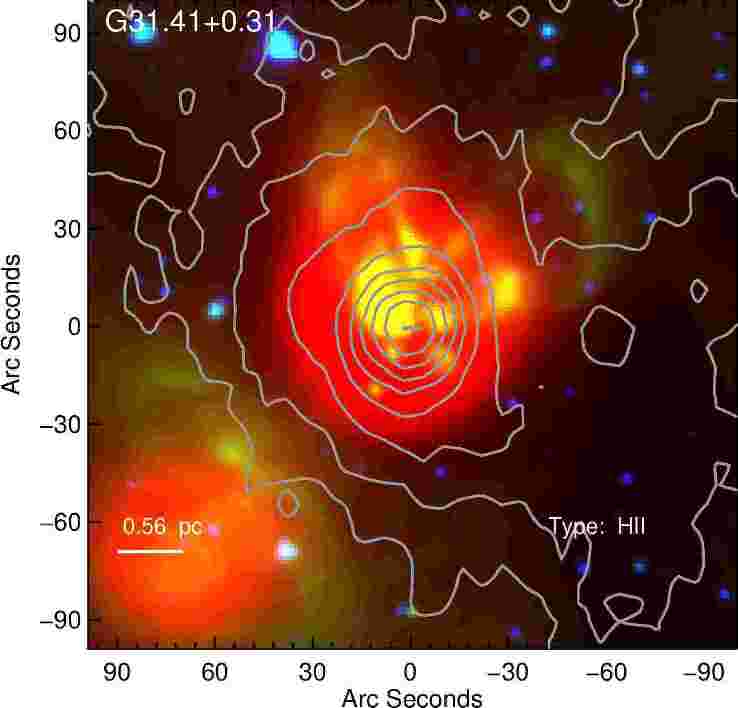
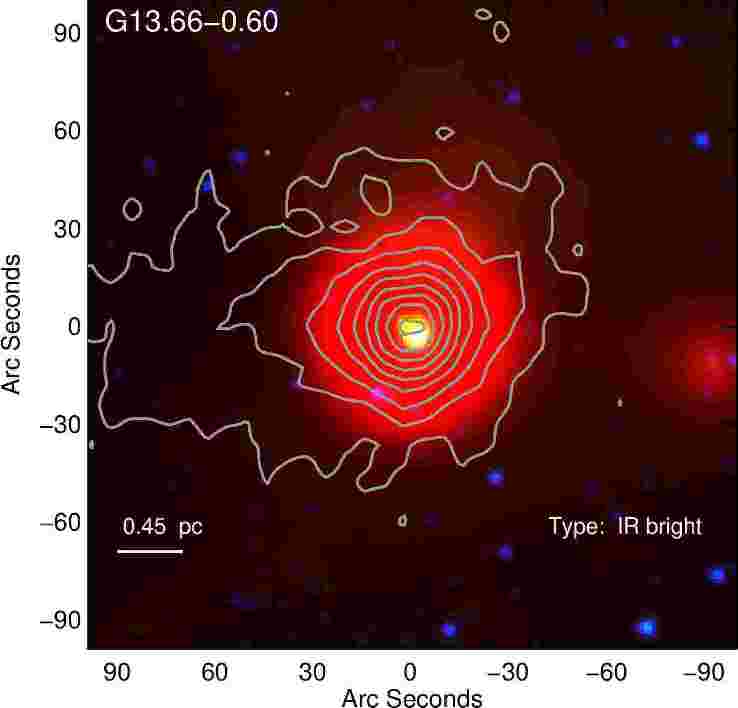
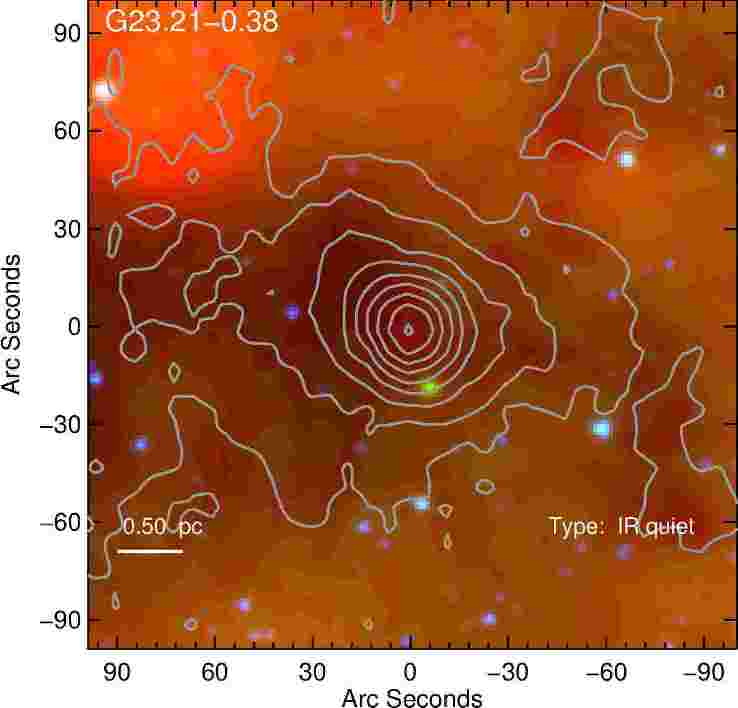
The first category with UC-H II regions clearly corresponds to the latest stage of the formation of high-mass stars when the objects have reached the main sequence while still accreting material from their surrounding clump. The (M)YSOs are in a stage prior to that when a massive and luminous central object has formed already. The infrared-quiet clumps represent the earliest stages at the onset of collapse, when the protostar is so deeply embedded that it remains hidden at mid-infrared wavelengths and only the high dust column density suggests the capability of the clump to form high-mass stars. In fact, not all of these clumps may have high enough density to potentially form high-mass stars. We investigate this aspect in more detail in Sect. 3.5. Examples of sources according to this classification are shown in Fig. 3.
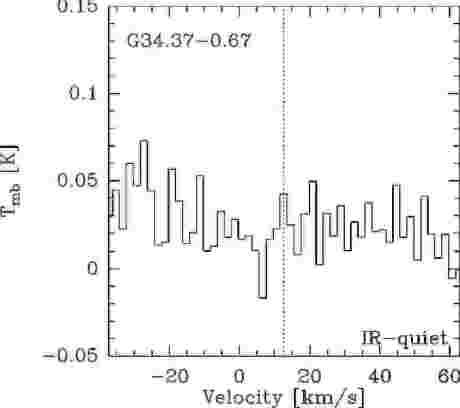
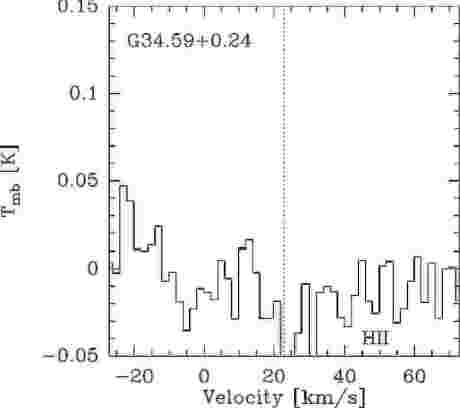
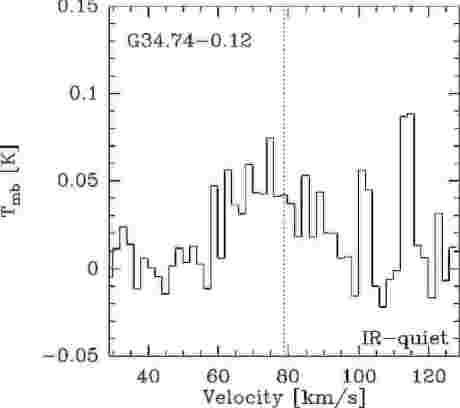
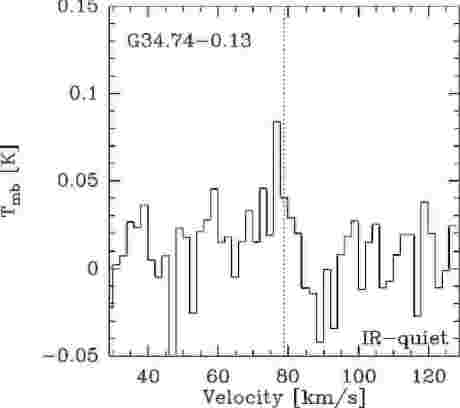
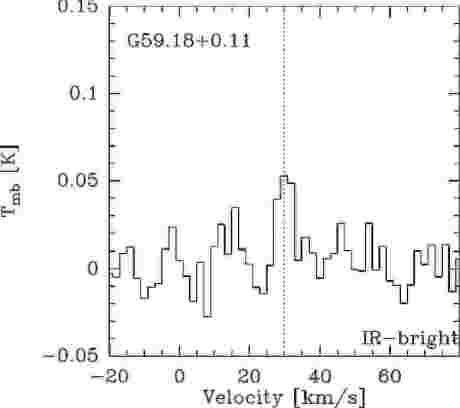
Altogether out of the 430 selected sources, 78 sources host embedded H II regions, 135 sources embedded protostars, and 217 sources are infrared-quiet, or starless. Two sources turned out to be not related to star formation: the RMS survey identifies the source G50.05+0.77 as a planetary nebula and G59.18+0.11 as an evolved star (Lumsden et al., 2013). Therefore, these two sources are not be considered in the following analysis.


3.3 Mid-infrared monochromatic luminosity
We calculate a monochromatic luminosity from the m flux densities as
| (1) |
where is flux per unit frequency and corresponds to the distance to the source. The flux is taken from the band 4 magnitude values from the WISE point source catalogue and converted to magnitudes555 The 22 m fluxes were taken from the WISE point source catalogue (Wright et al., 2010). We considered an embedded mid-infrared source to be associated with the dust, when the angular offset was small (″) and required a good quality flag measurement for the 22 m band footnote, and a maximum fraction of saturated pixels of 25%. (Objects flagged as ”D”, ”H”, ”O”, or ”P” are likely to be spurious sources according to the WISE catalogue description). The magnitudes were then converted to fluxes using a zero point magnitude of 8.2839 at 22 m (Wright et al., 2010), a colour correction factor of 1.0 and an additional correction factor of 0.9 from Cutri et al. (2012).. Where such measurements from the WISE catalogue were not available because of saturation, we used the MSX point source catalogue. In a consecutive step we visually inspected our positions with the and maps for the dust, as well as Spitzer-GLIMPSE images ( m), Spitzer-MIPSGAL images (24 m) and the WISE images (22 m) to check for spurious matching with foreground stars. We compare the m flux measurements between MSX and WISE in Appendix B.
For sources without any embedded mid-infrared source, we estimate an upper limit from the publicly available 22 m WISE images. The files have been reprojected with the Montage tool (Jacob et al., 2010) and the flux corresponding to the position of the continuum peak has been extracted. No correction for the background has been applied. The map units from DN666http://wise2.ipac.caltech.edu/docs/release/allsky/expsup/ have been converted to Jy using a conversion factor of (Cutri et al., 2012). The 22 m band is sensitive not only to emission from point sources, but also to bright and extended structures associated with PAH emission. In particular, the typically complex sites of massive star formation can cause signicant confusion due to extended PAH emission, and the actual detection limit is higher than in fields with rather isolated embedded sources.
The remaining sources have been visually inspected and were found to be associated with very bright saturated emission in the 22 m band of WISE and were likely also saturated in the MSX catalogue. We adopt a lower limit for these sources of 330 Jy (Cutri et al., 2012). The left panel of Fig. 4 shows the monochromatic luminosity distribution of the sample. There is a trend for the more evolved clumps to be more luminous at mid-infrared wavelengths, while the infrared-quiet clumps are likely less evolved than clumps hosting UC-H II regions or (M)YSOs.
From the monochromatic flux densities, we estimated the bolometric luminosity of the sources by applying a scaling factor derived in Mottram et al. (2011). We used the respective filter widths for both MSX and WISE and scaled the WISE fluxes at 22 m to the 21 m wavelength of the MSX E-band assuming . Towards the infrared-quiet clumps these estimates are based on upper limits (see Sect. 3.3). Although these estimates are only good to an order of magnitude, we see a clear shift in the peak luminosity of the different classes with the infrared-quiet clumps showing up as the lowest luminosity sources.


| Class | No. (%) | kpc kpc | M⊙ |
|---|---|---|---|
| kpc kpc | |||
| all | 430 | 310 | 75 |
| H II | 78 (18%) | 42 (14%) | 29 (40%) |
| infrared-bright | 135 (31%) | 99 (32%) | 28 (36%) |
| infrared-quiet | 217 (51%) | 169 (54%) | 18 (24%) |
| Parameter | Min. | Max. | Mean | Median | Standard deviation | |
|---|---|---|---|---|---|---|
| Mass [M⊙]: | all | 4 | 9.13 | 1555 | 408 | 5240 |
| H II | 110 | 9.13 | 5363 | 2709 | 11273 | |
| infrared-bright | 17 | 7735 | 866 | 534 | 1138 | |
| infrared-quiet | 4 | 8260 | 577 | 260 | 990 | |
| Distance [kpc]: | all | 0.8 | 16.9 | 5.5 | 4.8 | 3.4 |
| H II | 1.12 | 16.5 | 7.5 | 6.5 | 4.2 | |
| infrared-bright | 0.9 | 13.8 | 5.2 | 4.2 | 3.4 | |
| infrared-quiet | 0.8 | 16.9 | 5.0 | 4.6 | 2.7 | |
| [g cm-3]: | all | 0.10 | 33.84 | 1.18 | 0.43 | 3.01 |
| H II | 0.19 | 33.84 | 3.78 | 1.68 | 6.27 | |
| infrared-bright | 0.11 | 4.83 | 0.92 | 0.64 | 0.83 | |
| infrared-quiet | 0.10 | 3.90 | 0.38 | 0.22 | 0.52 |
3.4 Mass estimates
We estimate the gas mass of the clumps using the same formula and numerical values as in Schuller et al. (2009) and Csengeri et al. (2014), i.e.
| (2) |
where is the integrated flux from the and survey from Csengeri et al. (2014), and corresponds to the heliocentric distance. To be consistent with our previous studies (e.g. Csengeri et al., 2014), we use a gas-to-dust mass ratio (R) of 100 and cm2 g-1. We derived the numerical factor with the constants given above, GHz, and a typical dust temperature dominated by the interstellar radiation field of K (Bernard et al., 2010). This is close to the average gas kinetic temperature determined from NH3 measurements on large samples of massive clumps (Dunham et al., 2011; Wienen et al., 2012).
The middle panel of Fig. 4 shows the mass distribution of the sources with the different classifications indicated. Clumps hosting embedded H II regions are the most massive in the sample, which is also due to their larger distances (see Sect 3.1). Star-forming clumps exhibit a peak mass higher than that of infrared-quiet clumps. Infrared-quiet clumps are on average a factor of more than two less massive than star-forming clumps and an order of magnitude less massive than clumps with embedded H II regions. We note that the mass estimates are subject to uncertainties due to variations in the dust temperature. Massive protostars heat up their environment, which would lead to overestimating the mass, while the dust temperature may be lower towards the infrared-quiet sources. Taking K, we would underestimate the masses by a factor of three, while with K, we would measure 15% less mass. The uncertainty due to the dust temperature is, however, unlikely to introduce a significant bias because sources at larger distances cover larger physical regions as well, where the dust temperature is expected to be in equilibrium with the interstellar radiation field (Bernard et al., 2010).
The right panel of Fig. 4 shows the distribution of the surface density of the clumps calculated by
| (3) |
where corresponds to the beam-deconvolved size of the Gaussian fits to the sources from Csengeri et al. (2014). As this histogram shows, a substantial fraction (25%) of all the sources lie above the conservative, theoretical limit of 1 g cm-2 for massive cores to form stars by Krumholz & McKee (2008), suggesting that our sample selection is robust enough to study the properties of massive clumps. The derived physical parameters of the sources are listed in Table 4.
| Source namea𝑎aa𝑎aWe provide here the source names used for the observations. | Ra | Dec | ATLASGAL sourceb𝑏bb𝑏bThe corresponding ATLASGAL source name from Csengeri et al. (2014). | Offset c𝑐cc𝑐cOffset in arcseconds from the ATLASGAL dust peak from the catalog of Csengeri et al. (2014). | Distance | Mass | d𝑑dd𝑑dThe estimate corresponds to the peak column density and is calculated from Eq. 6 in Sect. 5.3. | Classification | ||
|---|---|---|---|---|---|---|---|---|---|---|
| J2000 [∘] | J2000 [∘] | [″] | [kpc] | [M⊙] | [cm-2] | [g cm-2] | ||||
| G06.22-0.61 | 270.5120 | -23.8869 | G006.2159-0.6098 | 3.8 | 3.78 | 446 | 6.7 | 0.79 | infrared-bright | |
| G08.05-0.24 | 271.1470 | -22.1112 | G008.0495-0.2433 | 3.4 | – | – | 2.9 | 0.45 | infrared-quiet | |
| G08.68-0.37 | 271.5974 | -21.6189 | G008.6834-0.3675 | 0.0 | 12.0 | 7592 | 13.4 | 1.84 | infrared-bright | |
| G08.71-0.41 | 271.6528 | -21.6213 | G008.7064-0.4136 | 0.0 | 11.9 | 3249 | 3.0 | 0.26 | infrared-quiet | |
| G11.35+0.80 | 271.8970 | -18.7276 | G011.3441+0.7961 | 4.7 | – | – | 1.8 | 0.19 | infrared-bright | |
| G11.38+0.81 | 271.9020 | -18.6882 | G011.3811+0.8103 | 3.6 | 3.37 | 90 | 1.9 | 0.25 | infrared-quiet | |
| G10.47+0.03 | 272.1588 | -19.8638 | G010.4722+0.0277 | 0.0 | 11.0 | 32316 | 97.8 | 28.57 | HII region | |
| G10.08-0.19 | 272.1610 | -20.3155 | G010.0791-0.1951 | 6.7 | 3.76 | 117 | 2.1 | 0.28 | infrared-quiet | |
| G10.45-0.02 | 272.1869 | -19.9100 | G010.4446-0.0178 | 0.0 | 10.7 | 2730 | 6.2 | 0.87 | infrared-quiet | |
| G10.28-0.12 | 272.1940 | -20.0978 | G010.2841-0.1134 | 5.2 | 2.20 | 269 | 8.8 | 0.82 | infrared-quiet | |
| G10.29-0.12 | 272.2010 | -20.0984 | G010.2863-0.1240 | 10.1 | 2.20 | 280 | 9.9 | 0.97 | infrared-quiet | |
| G10.66+0.08 | 272.2070 | -19.6731 | G010.6627+0.0811 | 7.3 | 2.96 | 112 | 1.7 | 0.15 | infrared-quiet | |
| G10.34-0.14 | 272.2500 | -20.0599 | G010.3420-0.1426 | 1.1 | 2.00 | 191 | 13.1 | 1.99 | infrared-quiet | |
| G10.32-0.14 | 272.2560 | -20.0867 | G010.3225-0.1611 | 5.2 | 3.55 | 747 | 10.3 | 1.03 | infrared-bright | |
| G10.33-0.16 | 272.2580 | -20.0834 | G010.3225-0.1611 | 10.6 | 3.55 | 747 | 10.3 | 1.03 | infrared-bright | |
| G10.62-0.03 | 272.2860 | -19.7654 | G010.6174-0.0304 | 5.2 | 5.53 | 219 | 1.6 | 0.19 | infrared-quiet | |
| G10.75+0.02 | 272.3100 | -19.6288 | G010.7471+0.0161 | 5.1 | 2.88 | 91 | 1.6 | 0.14 | infrared-quiet | |
| G10.32-0.23 | 272.3220 | -20.1205 | G010.3221-0.2304 | 1.4 | – | – | 2.1 | 0.20 | infrared-bright | |
| G10.21-0.30 | 272.3350 | -20.2506 | G010.2144-0.3051 | 1.8 | 1.90 | 34 | 4.0 | 2.52 | infrared-quiet | |
| G10.15-0.34 | 272.3380 | -20.3244 | G010.1506-0.3434 | 2.4 | 1.60 | 129 | 8.0 | 0.75 | infrared-bright | |
| G10.21-0.32 | 272.3520 | -20.2607 | G010.2130-0.3234 | 0.4 | 3.55 | 814 | 10.8 | 1.05 | infrared-bright | |
| G10.17-0.36A | 272.3610 | -20.3175 | G010.1672-0.3624 | 17.0 | 3.55 | 1032 | 8.2 | 0.65 | infrared-bright | |
| G10.17-0.36B | 272.3650 | -20.3181 | G010.1672-0.3624 | 5.7 | 3.55 | 1032 | 8.2 | 0.65 | infrared-bright | |
| G10.11-0.41 | 272.3820 | -20.3994 | G010.1065-0.4168 | 10.3 | 2.00 | 43 | 1.7 | 0.15 | infrared-quiet | |
| G10.83-0.02 | 272.3860 | -19.5746 | G010.8276-0.0207 | 6.4 | 3.70 | 157 | 1.6 | 0.14 | infrared-quiet | |
| G10.96+0.02 | 272.4140 | -19.4412 | G010.9576+0.0223 | 2.5 | 13.6 | 5911 | 8.1 | 1.12 | HII region | |
| G11.03+0.06 | 272.4160 | -19.3557 | G011.0335+0.0615 | 2.8 | 14.2 | 4188 | 4.9 | 0.61 | HII region | |
| G10.74-0.13 | 272.4400 | -19.7021 | G010.7418-0.1255 | 1.7 | 3.60 | 239 | 3.2 | 0.32 | infrared-quiet | |
| G10.67-0.22 | 272.4920 | -19.8111 | G010.6700-0.2211 | 1.7 | 3.70 | 205 | 2.5 | 0.25 | infrared-quiet | |
| G10.75-0.20 | 272.5130 | -19.7275 | G010.7528-0.1975 | 1.9 | 3.87 | 208 | 1.6 | 0.14 | infrared-quiet | |
| G10.99-0.08 | 272.5270 | -19.4628 | G010.9916-0.0815 | 2.8 | 3.70 | 408 | 2.7 | 0.21 | infrared-quiet |
3.5 A distance- and mass-limited subsample
Both the IRAM 30m and the APEX telescope have a beam of 29″ at the frequency of the SiO () and () transitions, respectively, which translates to physical scales of pc at the distance range of kpc. SiO emission has been claimed to be extended in IRDCs, as well as towards massive ridges on these scales (e.g. Jiménez-Serra et al., 2010; Nguyen-Luong et al., 2013). Sánchez-Monge et al. (2013) resolved the spatial distribution of some of their sources, although with a nearly three-times smaller beam. It is therefore reasonable to assume here that the extension of bipolar outflows is likely to be smaller than the beam, which may be particularly true for the more distant sources. Comparing the whole sample at different distances may consequently introduce a bias due to different filling factors. To obtain more robust statistical results, we define a distance-limited subsample with sources located between kpc, where the angular resolution corresponds to 1 pc and a potential distance bias is minimised.
In order to investigate the properties of strictly massive clumps, we consider clumps above a threshold of M⊙ ( g cm-2, for a of 0.4 pc, derived from the average beam-convolved angular size of 25″ at 5 kpc), which is taken as a rough criterion for massive clumps to form high-mass stars (Csengeri et al., 2014). As a comparison, this limit corresponds to that proposed by Krumholz & McKee (2008), and it is more conservative than that used by Tackenberg et al. (2012) as well as in the study of López-Sepulcre et al. (2011), where all clumps above 100 M⊙ at distances of several kilo-parsecs were considered capable of forming high-mass stars. A total of 161 sources (37%) fulfil our mass threshold, which makes this a significantly richer sample of more massive clumps compared to other spectral line studies. As a comparison, only five of the López-Sepulcre et al. (2011) sources are above this mass threshold.
Combining these criteria, we find 310 sources (72% of the complete sample) to fall within the distance limit of kpc, from which 75 sources (14%) also fulfil the M⊙ limit. The latter are the most extreme sources of the sample. Among these extreme sources, we find 18 infrared-quiet clumps (i.e. 25%, as in Csengeri et al., 2014), thus potential sites to study the initial conditions for high-mass star formation.
Even putting such a conservative limit to restrict the sample to the most massive sources, our initial selection is rich enough to provide better statistics compared to precedent studies and is a representative sample of different evolutionary stages (Table 2). The corresponding distribution of surface density and luminosity to mass ratio () of these subsamples is shown in Fig. 5 (upper and middle panels, respectively). The statistics of the physical properties of the different source classes are summarised in Table 3.
To demonstrate that the sources are likely to form stars, we calculated the ratio of the mass estimate from dust versus the virial mass of the sources to investigate the stability of the clumps in Fig. 5 (lower panel). We used the following equation from (Bertoldi & McKee, 1992), where corresponds to the radius of a sphere, is the velocity dispersion, and is the gravitational constant. Assuming an inverse square density profile
| (4) |
where corresponds to the velocity dispersion of the gas derived from a fit considering the hyperfine structure of the N2H+ () line extracted from this spectral survey with the IRAM 30m telescope, and to the beam-deconvolved sizes of the source. As Fig. 5 lower panel shows, the mass and distance-limited selection very likely corresponds to unstable, self-gravitating clumps. We therefore consider this subsample statistically significant and free from distance or selection biases. Furthermore, it has a representative fraction of sources in different evolutionary stages (see also Table 2). We show their distribution of in Fig. 6, which is used later in Sect. 4 and 5.
In summary, in the following analysis in Sect. 4, we first analyse the statistical properties of the entire sample of 430 sources, out of which 427 were observed in the SiO () transition. To study the line profiles, we minimise the distance bias by using the distance-limited sample, and investigate evolutionary trends in the line profile for a distance- and mass-limited sample. In Sect. 5 we again derive first statistics on the full sample, and then compare these results to the mass- and distance-limited subsample.
4 Results: SiO detection rates and line profiles
Based on the and survey, we identified a representative sample of massive clumps located throughout the inner Galaxy. Here we focus on the properties of SiO emission. In Sect. 4.1 we investigate first the detection rates to reveal the statistics of the presence of shocked gas. We report the typical line profiles and the velocity integrated emission in Sect. 4.2. In Sect. 4.3 we study the stacked SiO line profiles in the distance- and mass-limited sample, and then investigate the statistical properties of the velocity structure of the 2–1 line in Sect. 4.4.
4.1 Detection rates
4.1.1 The SiO () line
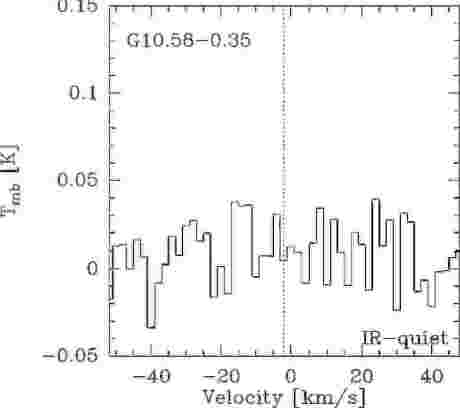
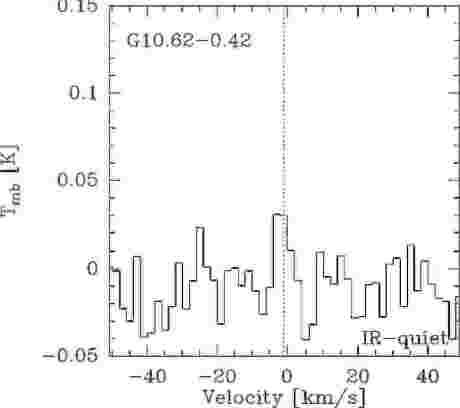
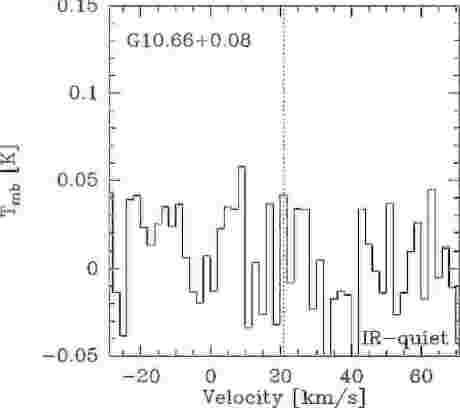
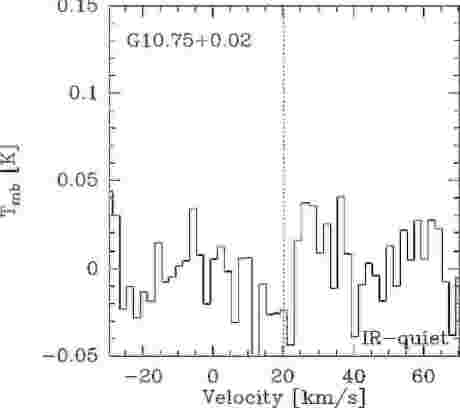
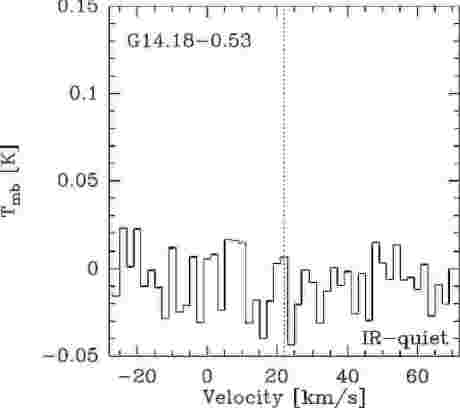
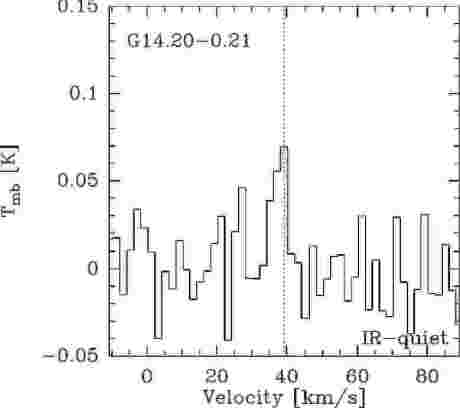
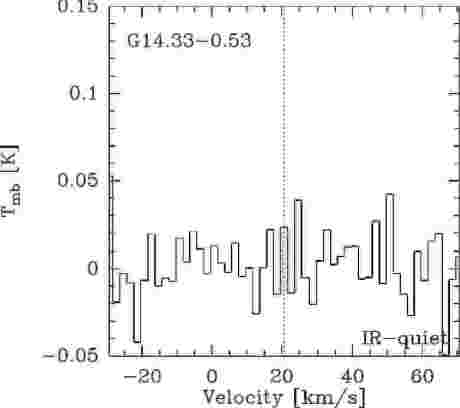
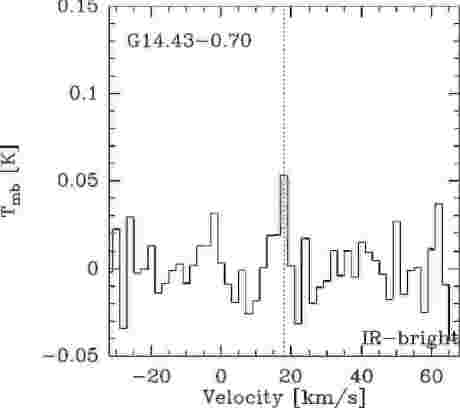
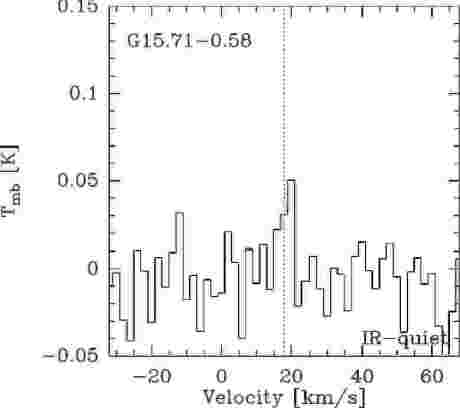
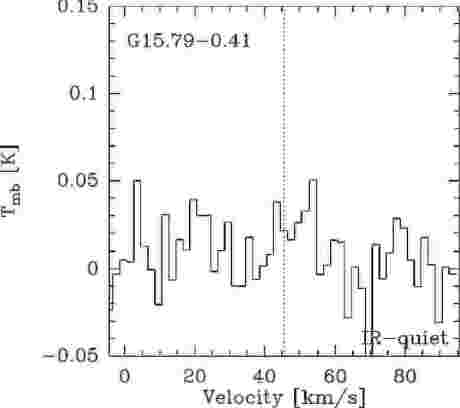
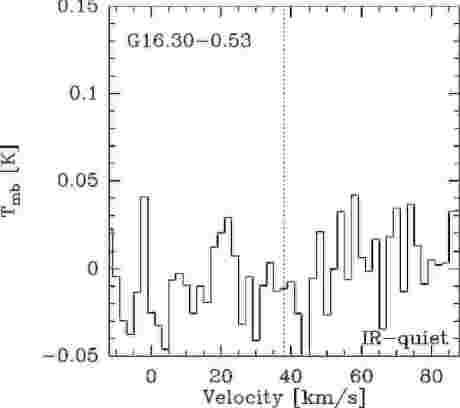
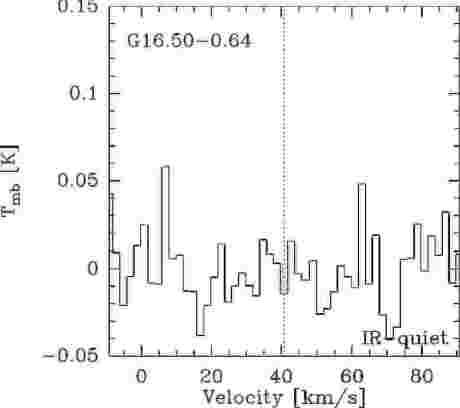
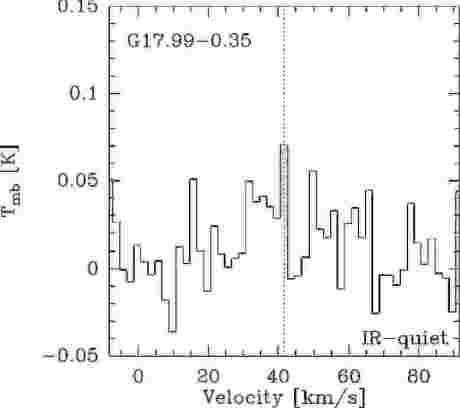
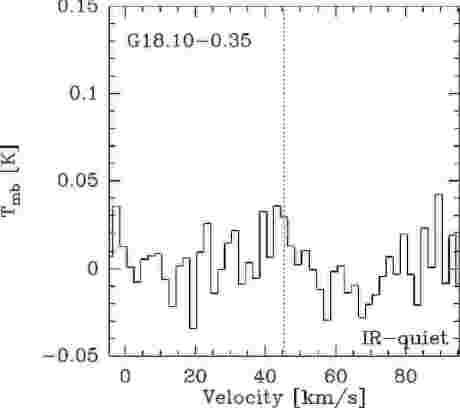
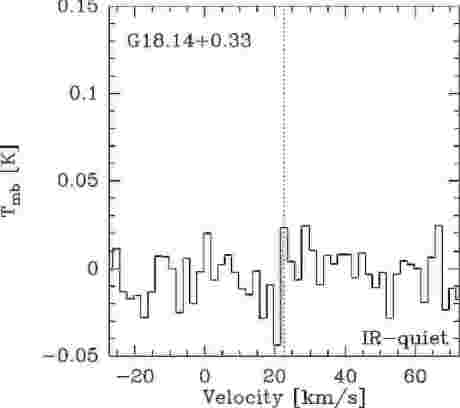
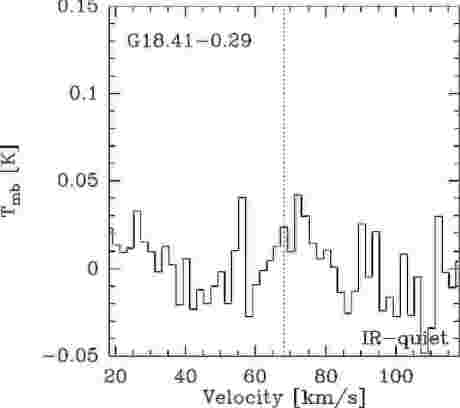
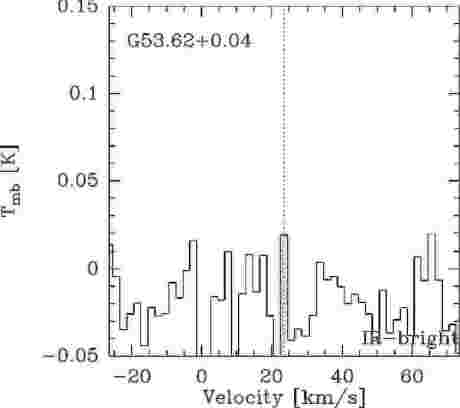
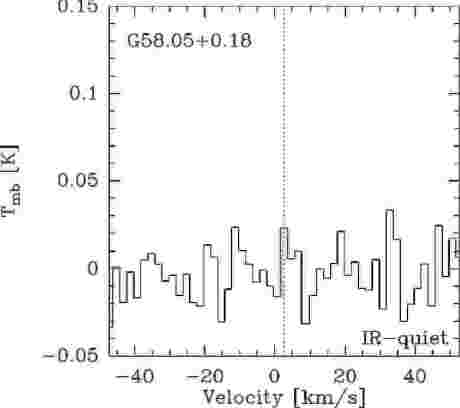
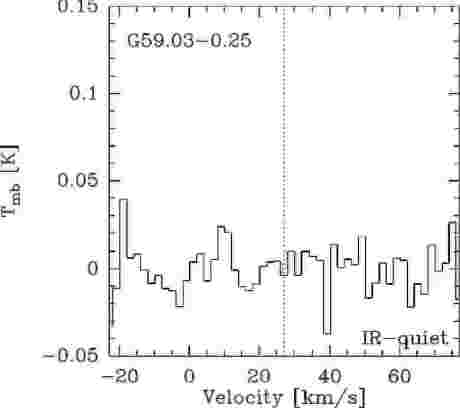
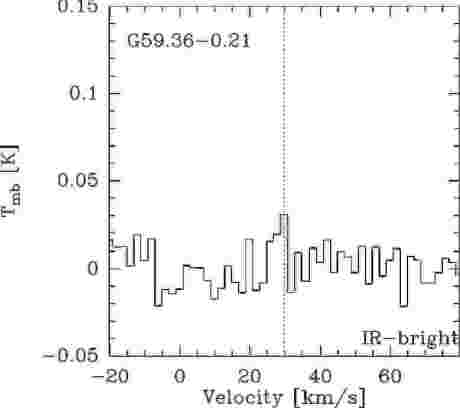
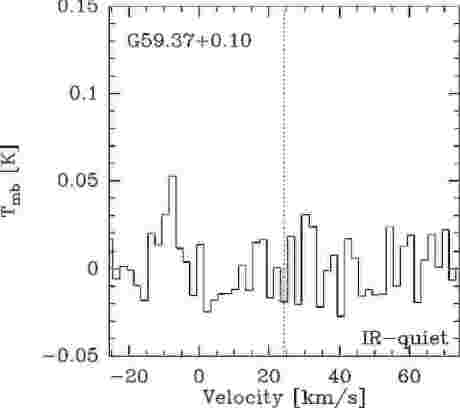
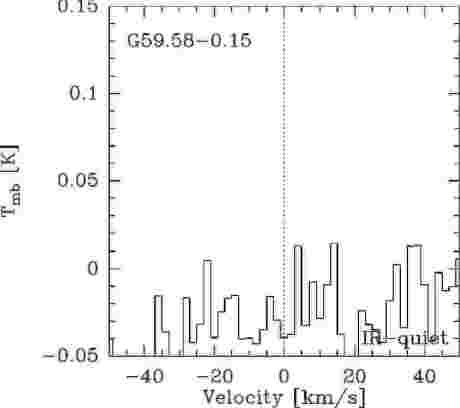
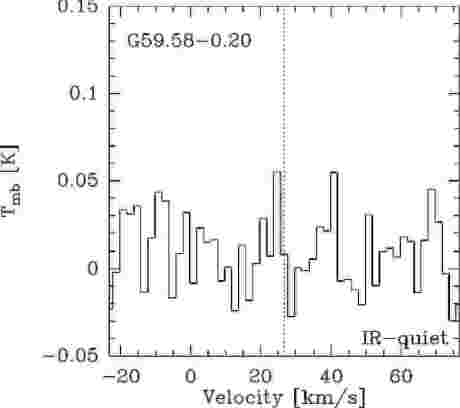
From the total of 427 observed sources, our spectral line survey detects molecular emission in all but one source. In the SiO () line, 301 sources (70%) show peak line intensities above , where corresponds to the noise per velocity bin. The detection rates according to source type are summarised in Table 5, and we note that the relative detection rate increases with sub-millimeter flux. The SiO () line is most frequently detected towards clumps hosting H II regions, and a substantial fraction (61%) of the infrared-quiet clumps also exhibit SiO emission. Although with much higher sensitivity, already Motte et al. (2007) found a high detection rate of SiO towards infrared-quiet massive cores in the Cygnus-X molecular complex. However, such a high detection rate towards a large number of more distant and infrared-quiet massive clumps is intriguing since SiO is considered a typical tracer of shocks (Schilke et al., 1997), mostly related to protostellar activity. Our overall detection rate is similar to that of López-Sepulcre et al. (2011), who had at most two times better sensitivity. As shown in Table 5, the detection rates are similar for the distance-limited (1–7 kpc) subsample as for the entire sample (see Sect. 3.5). Towards the mass and distance limited sample the detection rates in each source type are similar, however, the overall detection rate is higher: out of the total of 75 sources SiO (), emission is detected towards 70 sources (93%). The spectra of this subsample are shown in Fig. 7. In Fig. 8 we show the histogram of the SiO detections and non-detections for the different type of sources. While the detections are equally distributed in all categories for the whole sample, in the mass- and distance-limited sample practically all non-detections (5) are associated with infrared-bright embedded protostars or H II regions that may have already started to disrupt their natal cloud and where outflow activity may have ceased. The only infrared-quiet source with non-detection, G49.21-0.34, also shows a weak SiO emission, but below our detection threshold. All massive infrared-quiet clumps show evidence for emission from shocked gas. Considering the full sample, the distribution of non-detections is clearly shifted to the lower mass regime below the threshold for massive star formation. These non-detections may therefore reflect the more diffuse clumps without star formation.
For the reported detection rates, given the 3 limit, we expect sources to be spurious detections due to the statistical noise, which does not influence our results. The resulting spectra, along with a three-colour image of the targeted clumps with 870 m contours from and , are shown as Online Material in Appendix E.1. The sources where only the line has been observed are shown in Appendix E.2.
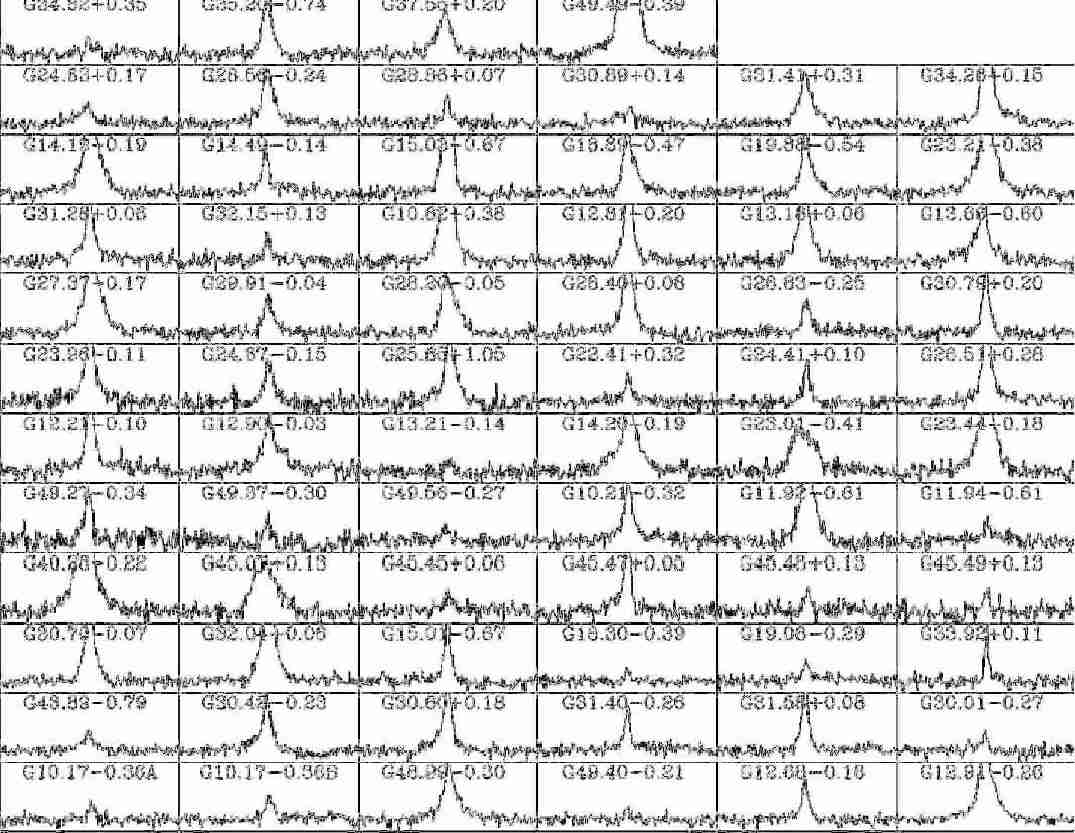
Because of the non-Gaussian line profiles, we first visually determined the velocity range where the emission reaches the noise level. We used this velocity range () to calculate the integrated intensity (). We calculated the errors on the line area from the standard formula of , where is the number of channels with emission, is the velocity resolution and is the noise per channel of each spectrum. The extracted line properties, such as the of the sources, the full width at zero power (), integrated intensity, noise level, presence of wings and SiO column density estimates (see also Sect. 4.2, and Sect. 5.2 ) are summarised in Table 6.
| Source type | SiO () | SiO () | ||||
| detection | detection | |||||
| All distances | kpc kpc | kpc kpc | All distances | kpc kpc | kpc kpc | |
| M M⊙ | M M⊙ | |||||
| All sources | 301 (70%) | 226 (73%) | 70 (93%) | 117 | 95 | 56 |
| H II regions | 63 (80%) | 36 (85%) | 27 (93%) | 40 | 30 | 23 |
| infrared-bright sources | 106 (79%) | 83 (84%) | 26 (93%) | 42 | 38 | 23 |
| infrared-quiet sources | 132 (61%) | 106 (63%) | 17 (94%) | 35 | 27 | 10 |


4.1.2 The SiO () line
From the spectroscopic survey of the 430 sources targeted with the IRAM 30m telescope, we followed up 128 sources with the APEX telescope in the SiO () transition. Out of these sources 117 are detected with peak intensities above and 114 detections are above 5. The line parameters of the SiO (5–4) emission are summarised in Table 7. Altogether we have 112 sources with detection in both transitions. The statistics of the SiO (5–4) detection rates is shown in Table 5.
| Source namea𝑎aa𝑎aAbbreviated source names used for the observations. | Ra | Dec | b𝑏bb𝑏bThe of the sources is determined from optically thin tracers in the survey, such as N2H+ (1–0) and H13CO+ (1–0). | c𝑐cc𝑐cThe velocity range corresponding to the . | T | d𝑑dd𝑑dError in the integrated intensity of the SiO (2–1) transition. | Wings | e𝑒ee𝑒eThe estimate based on Eq. 5 and LTE assumption. |
|---|---|---|---|---|---|---|---|---|
| J2000 [∘] | J2000 [∘] | [km/s] | [km/s] | [K km/s] | [K km/s] | [cm-2] | ||
| G06.22-0.61 | 270.5120 | -23.8869 | 18.46 | [ 0; 27] | 2.84 | 0.25 | y | 5.08 |
| G08.68-0.37 | 271.5974 | -21.6189 | 38.03 | [ 32; 54] | 8.68 | 0.24 | y | 15.52 |
| G08.71-0.41 | 271.6528 | -21.6213 | 39.64 | [ 28; 52] | 4.14 | 0.16 | y | 7.41 |
| G11.35+0.80 | 271.8970 | -18.7276 | 27.59 | [ 12; 41] | 1.36 | 0.25 | n | 2.43 |
| G10.47+0.03 | 272.1588 | -19.8638 | 67.05 | [ 56; 83] | 12.12 | 0.22 | n | 21.68 |
| G10.45-0.02 | 272.1869 | -19.9100 | 76.06 | [ 66; 85] | 2.10 | 0.11 | n | 3.75 |
| G10.28-0.12 | 272.1940 | -20.0978 | 14.29 | [ -9; 47] | 6.67 | 0.25 | y | 11.92 |
| G10.29-0.12 | 272.2010 | -20.0984 | 14.37 | [ 4; 29] | 2.84 | 0.12 | y | 5.08 |
| G10.34-0.14 | 272.2500 | -20.0599 | 11.97 | [ -9; 39] | 9.63 | 0.37 | y | 17.22 |
| G10.62-0.03 | 272.2860 | -19.7654 | 64.19 | [ 59; 76] | 0.62 | 0.12 | n | 1.10 |
| G10.21-0.30 | 272.3350 | -20.2506 | 12.50 | [ -9; 47] | 3.58 | 0.25 | y | 6.40 |
| G10.15-0.34 | 272.3380 | -20.3244 | 9.81 | [ -1; 23] | 1.36 | 0.12 | y | 2.43 |
| G10.21-0.32 | 272.3520 | -20.2607 | 10.19 | [ -17; 25] | 5.43 | 0.25 | y | 9.72 |
| G10.17-0.36A | 272.3610 | -20.3175 | 14.02 | [ -5; 23] | 1.48 | 0.12 | n | 2.65 |
| G10.17-0.36B | 272.3650 | -20.3181 | 15.21 | [ 8; 21] | 1.11 | 0.12 | y | 1.99 |
| G10.96+0.02 | 272.4140 | -19.4412 | 21.36 | [ 8; 35] | 2.84 | 0.25 | y | 5.08 |
| G10.74-0.13 | 272.4400 | -19.7021 | 29.00 | [ 4; 61] | 4.94 | 0.37 | y | 8.83 |
| G10.67-0.22 | 272.4920 | -19.8111 | 29.78 | [ 20; 47] | 1.85 | 0.12 | y | 3.31 |
| G10.75-0.20 | 272.5130 | -19.7275 | 31.86 | [ 18; 35] | 1.11 | 0.25 | y | 1.99 |
| G10.99-0.08 | 272.5270 | -19.4628 | 29.36 | [ 20; 37] | 0.86 | 0.25 | n | 1.55 |
| Source namea𝑎aa𝑎aAbbreviated source names used for the observations. | Ra | Dec | b𝑏bb𝑏bThe velocity range corresponding to the determined from the SiO (2–1) observations. | T | c𝑐cc𝑐cError in the integrated intensity of the SiO (5–4) transition. | ||
|---|---|---|---|---|---|---|---|
| J2000 [∘] | J2000 [∘] | [km/s] | [K km/s] | [K km/s] | |||
| G08.68-0.37 | 271.5974 | -21.6189 | [ 25; 46] | 1.31 | 1.27 | ||
| G08.71-0.41 | 271.6528 | -21.6213 | [ 36; 41] | 0.28 | 0.01 | ||
| G10.47+0.03 | 272.1588 | -19.8638 | [ 58; 81] | 4.77 | 0.01 | ||
| G10.45-0.02 | 272.1869 | -19.9100 | [ 71; 84] | 0.27 | 0.01 | ||
| G10.28-0.12 | 272.1940 | -20.0978 | [ -3; 45] | 2.14 | 0.22 | ||
| G10.29-0.12 | 272.2010 | -20.0984 | [ 6; 21] | 0.78 | 0.06 | ||
| G10.34-0.14 | 272.2500 | -20.0599 | [ -7; 49] | 3.85 | 0.13 | ||
| G10.21-0.32 | 272.3520 | -20.2607 | [ -17; 25] | 0.75 | 0.18 | ||
| G10.74-0.13 | 272.4400 | -19.7021 | [ 16; 32] | 0.59 | 0.08 | ||
| G10.62-0.38 | 272.6193 | -19.9300 | [ -17; 12] | 8.79 | 0.07 | ||
| G12.42+0.51 | 272.7110 | -17.9292 | [ 2; 31] | 0.37 | 0.07 | ||
| G11.08-0.53 | 272.9950 | -19.6004 | [ 23; 46] | 1.17 | 0.10 | ||
| G11.90-0.14 | 273.0460 | -18.6918 | [ 38; 46] | 0.16 | 0.19 | ||
| G12.20-0.03 | 273.0980 | -18.3801 | [ 38; 58] | 1.38 | 0.19 | ||
| G12.21-0.10 | 273.1650 | -18.4040 | [ 8; 43] | 1.84 | 0.01 | ||
| G12.90-0.03 | 273.4500 | -17.7595 | [ 34; 83] | 1.48 | 0.10 | ||
| G12.68-0.18 | 273.4760 | -18.0294 | [ 40; 63] | 0.31 | 0.11 | ||
| G11.92-0.61 | 273.4920 | -18.9052 | [ 10; 57] | 8.80 | 0.10 | ||
| G11.94-0.61 | 273.5030 | -18.8899 | [ 28; 51] | 0.50 | 0.08 |
4.2 Line shape and velocity integrated emission
In both observed lines, towards the majority of the sources we detect nearly Gaussian emission profiles centred on the rest velocity (). Towards several sources sources, we detected additional emission in the high-velocity line wings. Altogether we detect such wings in the SiO () transition in 160 sources, which is 50% of the total number of detections. The sources exhibit large variations in the wing profiles, however, in most of the cases we find a symmetric broad component centred on the line, while in a few cases we detect asymmetric line profiles. We find altogether 63 of the infrared-quiet sources to exhibit high-velocity wings; these likely indicate deeply embedded high-mass protostars in a Class 0-like phase (Bontemps et al., 2010; Duarte-Cabral et al., 2013). They correspond to 30% of the detections in this category of sources, which are higher than for the more evolved objects in agreement with the earlier findings of Motte et al. (2007).
4.3 Averaged line profiles
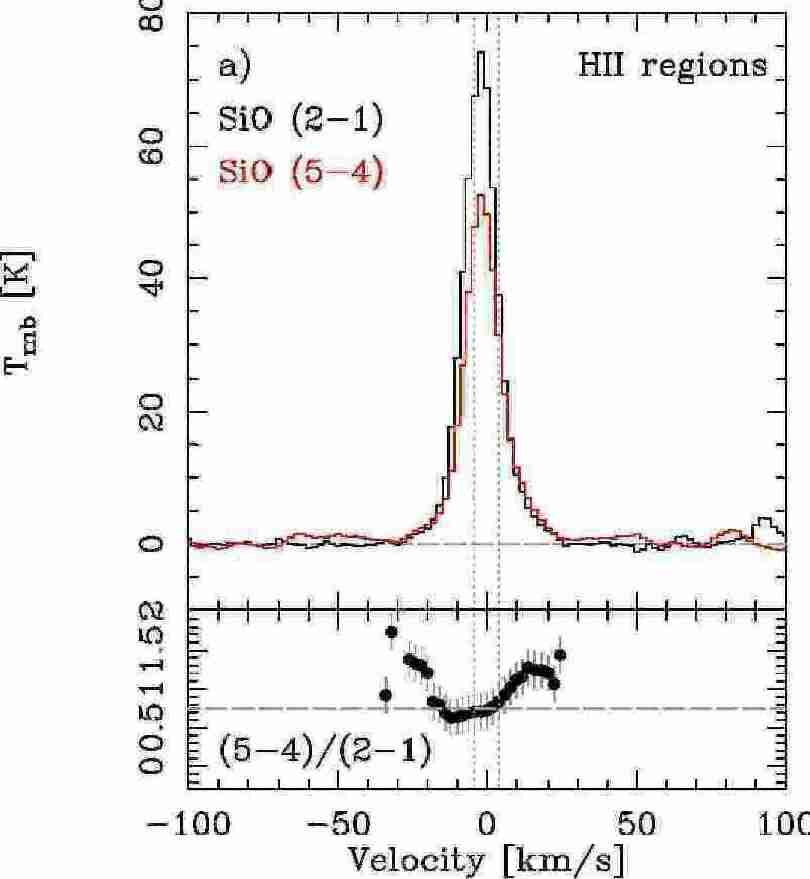
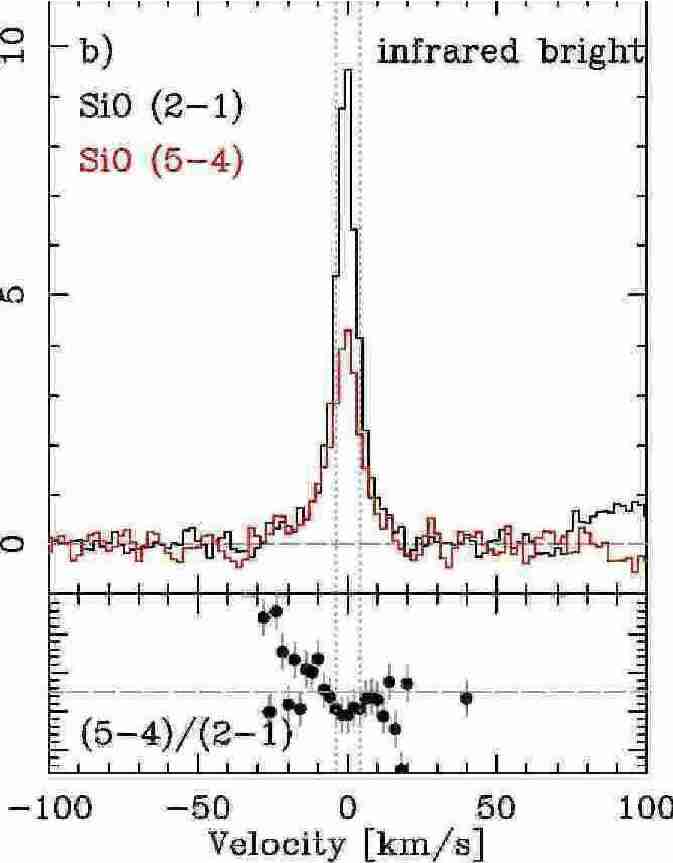
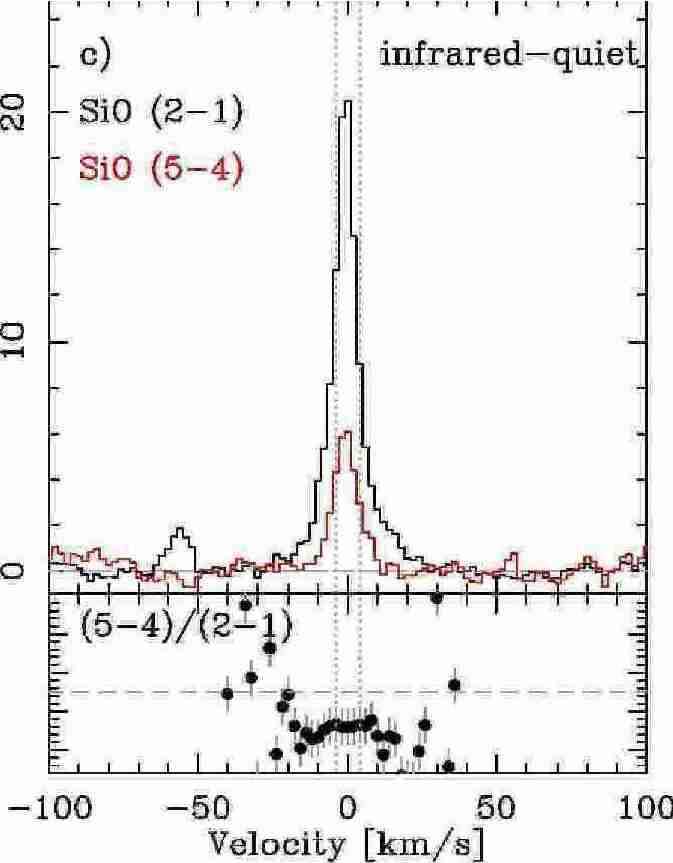
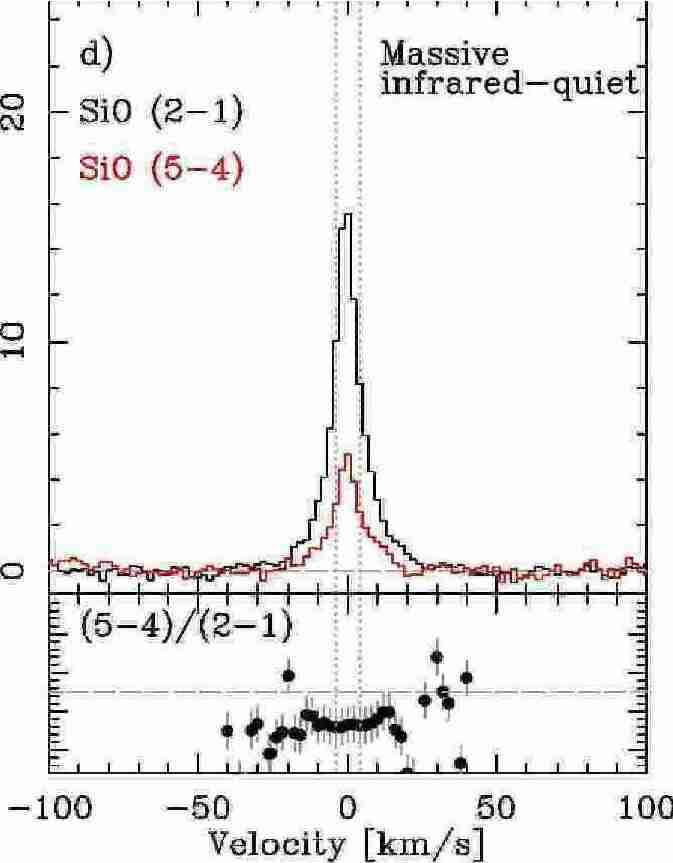
In Fig. 9 we show the averaged line profiles of both transitions from the different source classes scaled to a common distance of 1 kpc. Since the beam sizes are similar for both lines, we assume that the emission originates from the same volume of gas and the excitation conditions are the same.
We find that the ratio of the (5–4) to the (2–1) line intensities clearly change with the respective evolutionary phase. The smallest ratios are observed towards the infrared-quiet clumps. High-velocity wings with emission broader than 8 km s-1 are observed towards all of these classes. For a detailed description of the velocity structure of the line, see Sect. 4.4. We find equally high-velocity gas in the sample of massive infrared-quiet clumps as towards the clumps with embedded H II regions, which is similar to the findings of Motte et al. (2007). These high-velocity wings are, therefore, confirmed in the early stage of massive clumps on a Galactic scale statistics.
The signal-to-noise ratio of the individual spectra does not allow us to study the excitation conditions in the high-velocity wings, therefore, the averaged line profiles are used here for a qualitative description. In the lower panel of Fig. 9, we show the ratio of the (5–4/2–1) lines. We find that the line ratio is larger in the high-velocity wings compared to the low-velocity Gaussian component, suggesting a change in the excitation conditions for the low- versus the high-velocity components, and, therefore, a different origin for the low- and high-velocity component, as also noted by Nisini et al. (2007); Leurini et al. (2013). This trend is, however, less clear for the intermediate velocities, in particular towards the infrared-quiet sample. Using the line ratios, in Sect. 5 we provide a quantitative analysis of the velocity averaged excitation conditions for individual sources with the highest signal-to-noise detections in the low-velocity component.
4.4 The velocity structure of the SiO () line
Since we have a representative sample of the different evolutionary stages, i.e. clumps with H II regions, star-forming, and infrared-quiet clumps, here we use the higher signal-to-noise ratio () transition to statistically investigate the SiO line profiles over its entire velocity extent across the sample and different categories. In Sect. 4.4.1 we therefore first analyse the velocity extent of the flow with the of the distance-limited subsample to avoid bias due to lower sensitivity for the high-velocity wings towards more distant sources.
Emission in high-velocity wings, corresponding to emission from shocked gas due to fast material ejection, is commonly observed in the SiO lines (e.g. Gueth et al., 1998; Codella et al., 1999; Nisini et al., 2007). However, there is no clear definition to distinguish the high-velocity component from a Gaussian profile commonly observed at the systemic velocity of the source. Various definitions have been used so far in the literature. Nguyen-Luong et al. (2013) refer to a broad component with km s-1, while other studies are more conservative. For example, Duarte-Cabral et al. (2014) refer to emission with km s-1 as a broad component, and define a low-velocity component with of km s-1. Jiménez-Serra et al. (2010) refer to a low-velocity component with line-widths up to 3 km s-1, and consider as a high-velocity component widths between 4–7 km s-1. In low-mass protostars Lefloch et al. (1998) report weak low-velocity components with of 0.4-1.2 km s-1, while Codella et al. (1999) identify low-velocity components with up to 3 km s-1 line width. In Sect. 4.4.2, we use a Gaussian fit to statistically disentangle the low- and high-velocity component. We stress at this point that throughout the sample the low-velocity component always peaks at the ambient velocity of the clump.
4.4.1 The high-velocity component
We have looked for trends as a function of the evolutionary stage and velocity of the flow. To accomplish this, we analyse the statistical properties of the , which also accounts for the wings of the lines and was used for determining the total integrated emission. Broad velocity ranges up to km s-1 are observed towards clumps hosting several embedded H II-regions, such as W51 Main, W49A, as well as other mid-infrared bright clumps hosting YSOs. The broadest infrared-quiet source shows high-velocity wings up to a total velocity range of 65 km s-1 associated with the star-forming complexes of W43 Main and South as well as W33. To study the statistical properties of the highest velocities observed, we show the histogram of the of the distance-limited subsample in Fig. 10. We find no significant difference as a function of source type.
In Fig. 11 we show the SiO (2–1) line area and the line luminosity as a function of the , following Nguyen-Luong et al. (2013), for the distance- and mass-limited subsample. We find several sources that have high SiO luminosity comparable to the mean K km s-1 kpc2 found by Nguyen-Luong et al. (2013) towards the ridges of W43-Main. On panel b) we show their relations and find that most of our sources fall close to their fit. For comparison, we show two examples of SiO line luminosities from shocks at low velocities, which are possibly a fingerprint of small-scale converging flows (see also Csengeri et al., 2011a, b). An example of a nearby massive dense core (Cyg-X N40) from Duarte-Cabral et al. (2014) exhibits K km s-1 kpc2 SiO (2–1), which is much lower compared to the more distant and massive ridge associated with W43-MM1. Compared to the example of Cyg-X N40 our sample probes on average more distant, thus larger scale structures, where higher line luminosities from low-velocity shocks are expected, as high as that of the W43 ridge.


We correlated the velocity extent of the flow of the distance- and mass-limited sample with , but find no clear trend (Fig. 12), which is similar to what we qualitatively derived in Sect. 4.3. We find no significant difference between the flow velocity associated with infrared-bright and infrared-quiet clumps, only the dispersion of the observed velocities increases with evolutionary stage. This could possibly hint at a more confused underlying origin of the observed shocks driven by several protostars forming in a clustered environment.
4.4.2 Two-component Gaussian fit
To distinguish between the low- and high-velocity regimes, we use a two-component Gaussian fit: one centred on the ambient velocity with a narrower line width ( km s-1, see below) compared to the second component characterised by high-velocity line wings. These wings often show asymmetries in which case the Gaussian fit does not reproduce the line profile well. For a statistical study, this approach is, however, a powerful tool that allows a systematic analysis, while this method is also commonly used in the literature (e.g. Duarte-Cabral et al., 2013).
To obtain more robust results, for the two-component Gaussian fitting, we only consider detections with a peak intensity above 5. From the entire sample, 76 sources can be fitted with two components. Only a broad component centred on the ambient velocity was fitted to 34, while only a low-velocity component was fitted to 122 sources. From these, 61 (50%) are classified as infrared-quiet clumps. To exclude sensitivity limitation as a possible reason for the lack of detection of the high-velocity component, we checked the distance distribution of the sample with detection of the high-velocity component and find a relatively homogenous distribution as a function of distance up to 14 kpc. Similarly, we find a homogenous distance distribution for the sources where only the low-velocity component is detected. This suggests that the lack of detection in the high-velocity regime is rather the intrinsic property of the shock in these sources.
On average, we find 5–6 km s-1 width for the low-velocity component centred at the ambient velocity. The high-velocity component is fitted on average with 19 km s-1 towards the younger sources and we find that it decreases to 14 km s-1 for the more evolved clumps where the two components could be fitted. The values show, however, a large scatter and do not show statistically robust trends, as also seen in Sect 4.4.1.
The maximum for the broad component is found to be 69 km s-1 with a mean of 18.4 km s-1 towards the entire sample. The broad line profiles suggest already on-going star formation with significant high-velocity gas likely associated with the jets emanating from young protostars.
From the distance- and mass-limited subsample , 34 sources show both a low- ( km s-1) and a high-velocity component, while 25 are fitted with only a low-velocity component roughly equally distributed in each category of sources. We find four sources that are fitted with only a high-velocity component ( km s-1). As a comparison, our statistically derived line-width for the low-velocity regime is a factor of at most ten larger than found by Jiménez-Serra et al. (2010) for spatially extended SiO emission (see Sect. 4.4 for more details), but are comparable to the findings of Duarte-Cabral et al. (2014). Our definition of narrow-velocity component is, however, more conservative than Nguyen-Luong et al. (2013).
To look for trends in the properties of the two components, we investigate their ratio in Fig. 13 (upper panel) towards the distance-limited subsample, where both components are detected with a high signal-to-noise ratio. We find a weak trend that the contribution of the high-velocity component decreases with an increasing width of the low-velocity component. This may simply mean that the distinction between the two components becomes less clear towards these sources, or that the high-velocity component has a more important contribution in integrated emission for the sources exhibiting a low-velocity component. We find three massive clumps (G10.62-0.38, G34.26+0.15, G49.49-0.39), where the high-velocity component may dominate the emission over the low-velocity component.
In the lower panel of Fig. 13, we show the ratio of the of the two components as a function of . We find a weak trend that the width of the high-velocity component decreases with . This may reflect the evolution of the shocks, where the high-velocity component is more associated with the jets emanating from the youngest protostars, although our results are statistically not robust enough to draw further conclusions.
Overall, we do not find robust trends for the properties of the line width as a function of evolution. This is further supported by Fig. 10, which shows the histogram of the velocity range determined from the SiO () emission in Sect. 4.4.1. The peak of the distribution falls between km s-1, and there is no significant difference between different source categories confirming that high-velocity shocks are present in all evolutionary stages.
To understand the origin of the SiO low-velocity, and relatively narrow component, we correlated the line width with that of the N2H+ (1–0) transition and found no correlation. This suggests that the origin of the SiO narrow component is not related to the turbulent gas of the clump, and is likely to have a different origin.
Finally, we note that the detectability of the broad component depends not only on the signal-to-noise of the spectra (and therefore its distance), but also on the inclination angle. We have not considered this potential bias in the analysis because in cluster forming clumps the picture is even more complicated because of a distribution in number and strength of outflows and their orientation.


5 SiO emission and excitation conditions in massive clumps
In this section, using the two SiO transitions of (2–1) and (5–4), we investigate the excitation conditions of the gas emitting these lines and quantify the properties of the shocked gas towards this large sample of massive clumps with well-characterised physical properties. First, we derive the optical depth of the SiO (2–1) line (Sect. 5.1). To estimate the SiO column densities, we first use a non-LTE approach for the subsample with observed 5–4 transitions consisting of the most massive sources and the highest signal-to-noise detections of the 2–1 line. Based on these results we then extend the column density estimates to the full sample based on LTE assumption (Sect. 5.2). We then use these results to estimate SiO abundances (Sect. 5.3) and investigate possible trends in the different evolutionary phases. However, the larger statistics and observations of the two transitions with an energy difference of K allows us to go a step further than previous works (e.g. López-Sepulcre et al., 2011; Sánchez-Monge et al., 2013; Leurini et al., 2014). The ratio of the SiO () to SiO () line is not affected by beam dilution under the assumption that the transitions originate in the same gas, while other quantities such as the SiO column density and abundance are affected by crude assumptions needed in the analysis of such a large sample (LTE conditions and a beam dilution factor of one, for example). Therefore we base our discussion on the properties of SiO as a function of evolution in the trends derived from the ratio of the two lines (Sect. 5.4).
5.1 Optical depth
Since the IRAM spectral survey (Sect. 2.1) covers the () transition of the 29SiO line at 85.759 GHz, we use this information to estimate the optical depth of the main isotopologue. Although the survey has not been designed for such weak lines, we still find detections above . While this is a significantly lower detection rate compared to the main isotopologue, it still provides useful upper limits of the optical depth of the main line.
The terrestrial ratio of SiO)/SiO) is 19.6 and in the interstellar medium values between have been measured (Penzias, 1981), hence, we adopt an isotopologue ratio of 20. The ratio of the peak intensity of the two lines suggests that only in a few cases (, corresponding to , Fig. 14) the 28SiO () transition becomes saturated suggesting moderately optically thick emission. Therefore, we conclude that towards the majority of the sample the emission is optically thin.

5.2 SiO column density
Although the critical density of SiO transitions is high and LTE conditions may not apply at typical conditions in shocks, it is a commonly used approach to estimate the SiO column density assuming LTE. (e.g. Sánchez-Monge et al., 2013; Nguyen-Luong et al., 2013). Based on the subsample of 112 sources where both the () and () lines are detected (see Sect. 4.1.2), in the following we compare the column density estimates using a non-LTE (Sect 5.2.1) and LTE approach (Sect 5.2.2). We show that within an order of magnitude the LTE approach gives a relatively good estimate for the column density considering the uncertainties such as the unknown source size.
5.2.1 Column density estimates from RADEX
We first show column density estimates for the subsample of sources where both the (2–1) and (5–4) transitions are detected with a high signal-to-noise. We used RADEX (van der Tak et al., 2007) with a plane parallel slab geometry to constrain the SiO column density from the ratio of these two lines. We use these results to show the general trends of the SiO column density and abundance in non-LTE conditions (Sect. 5.3), and then use the LTE approach to extend our statistics of column density and abundance to the full sample.
We measure the line properties with a single-component Gaussian fit to both the (5–4) and (2–1) lines, and then normalised the line area to a typical width of 5 km s-1 (see Sect. 4.4.2)121212In total, 225 sources are well fitted with the single Gaussian component corresponding to 75% of the total detections, where the average line width is close to 5 km/s.. Typical line ratios of the SiO (5–4) and (2–1) lines are found between , with a mean of 0.4. This is compared to non-LTE calculations with RADEX in Fig. 15, which shows the () and () line ratio for a typical range of cm-3 and cm-2 for and K. We find typical values for to K (see also Sect. 5.2.2 and Appendix C). The upper panel shows the observed values of the line ratios in solid lines, and the line temperatures in dashed lines.
From the upper panel of Fig. 15, we first establish that the different kinetic temperatures do not have a significant impact on the resulting column density, only a factor of up to 20-25%. Therefore, in the subsequent analysis we rely on models with a single value of K. We then estimated the column densities of SiO for each source with RADEX using the ratio of the peak line intensity normalised to a common line width of 5 km s-1. Assuming a beam filling factor of unity, we find between cm-2 (see Fig. 15, lower panel). However, as pointed out earlier, owing to the large dispersion in the distance of the sample, beam dilution may play an important role. We therefore tested this effect by assuming a common 8 ″ angular size for the emission at 1 kpc and scaled the measured line temperatures with the distance of the source. This gives a factor of few higher between cm-2. In Fig. 23, we compare the result of this test with the SiO column density estimates without beam dilution.
In the lower panel of Fig. 15, we compare these calculations with the observed line parameters normalised to a line width of 5 km s-1. The plotted lines show the model results for fixed column density and H2 density for K. The observed values correspond to an H2 density range of cm-3.
5.2.2 Column density estimates from LTE
To estimate column densities for the whole sample, we can only rely on the () transition. We therefore have to assume LTE conditions, optically thin emission, and that the source fills the main beam. An additional assumption is that the bulk emission originates from the low-velocity component of the spectra (see also Sect. 4.4.2), therefore, including the high-velocity wings, we can still use a single excitation temperature (). The total column density is then estimated by
| (5) |
where is the statistical weight, Debye is the electric dipole moment, GHz and we used K. To justify the choice of for the LTE calculations, we implicitly assumed optically thin emission for both transitions, which is a commonly used approximation and is valid in our large statistics as shown in Sect. 5.1. First, based on the LTE approach and similar to the results of Sánchez-Monge et al. (2013), from the ratio of the two transitions we find that the sources have on average of K with extreme cases reaching K (Appendix C). In the following, for the LTE calculations we use a single value for the whole sample, since larger uncertainties are introduced by relying on velocity and beam averaged estimates. We adopt K for all sources, which is similar to what is used by Sánchez-Monge et al. (2013), and also Leurini et al. (2014) show that this excitation temperature is a good assumption for the typical densities and temperatures for such clumps. Using K would increase the estimated column densities by a factor of two, while using a lower value of K, we would only obtain less than ten per cent lower column densities.
We derive SiO column densities between cm-2 for the whole sample based on the total integrated intensity derived in Sect. 4.2. The highest column densities are observed towards the massive clumps hosting UC-H II regions, and we do not find significant differences between the derived column densities for the infrared-quiet and infrared-bright clumps.
Comparing the column densities from the LTE assumption with the non-LTE RADEX calculations with a beam filling factor of unity, we find that the LTE column densities are on average a factor of two higher. In comparison with RADEX results, corrected for a source size and different distances, we find that these estimates are within a factor of eight, and the LTE estimates give on average a factor of three lower column densities. Given the uncertainties in the assumptions, these tests show that on average the column density estimates from the LTE assumption are within an order of magnitude comparable to that of the non-LTE models. However, systematic biases may be introduced in large samples, and therefore this simple analysis may give misleading results due to the combination of non-LTE effects and varying source size, which may scale with the distance.


5.3 SiO abundance
To estimate the SiO abundance, we use the peak flux densities from Csengeri et al. (2014) and estimate the H2 column density from the dust
| (6) |
where is the peak flux density, the beam solid angle, the mean molecular weight of the interstellar medium with respect to hydrogen molecules, which is equal to 2.8, and is the mass of an hydrogen atom. We adopt here the same assumptions as Schuller et al. (2009): a gas-to-dust mass ratio (R) of 100 and cm2 g-1, which is interpolated to 870 m from Table 1, Col. 5 of Ossenkopf & Henning (1994). A more precise estimation of the H2 column density would be given using a different molecular tracer with a similar line profile and a well-constrained abundance with respect to H2. Other species, such as HCO+ (Sánchez-Monge et al., 2013), 13CO , or high- CO lines (Leurini et al., 2014) have been commonly used to estimate the H2 column density in the high-velocity regime corresponding to the line wings. In our survey the signal-to-noise ratio in the wings of the 13CO and HCO+ () lines is typically low, therefore, we do not attempt to estimate the , and SiO column densities strictly arising from the high-velocity wings, but estimate the velocity integrated column density. To test this, we selected the H13CO+ () line at 86.754 GHz from the line survey (see Sect. 2.1), which is expected to be an optically thin tracer of the gas. Given the variation in the line profiles we selected a handful of sources and estimated the H2 column density from the integrated emission in the same velocity range as used for the SiO line, and using the formula from Schneider et al. (2010). This results at the order of magnitude similar H2 column density values based on the dust, between to . For the whole sample we therefore only provide abundance estimates based on the dust emission, and point out that other studies, such as Miettinen et al. (2006); Sanhueza et al. (2013); Gerner et al. (2014), also rely on the dust to estimate . As SiO may not strictly follow the distribution of dust, our results of abundance estimates are lower limits from which local deviations within the beam may be large.
First, in Fig. 16 we show the SiO column density calculated based on the LTE approximation from the () transition in Sect 5.2.2 versus the H2 column density () calculated from the 870 m integrated flux densities from the and survey, assuming a dust temperature (Td) of 18 K131313 We use the equations of Schuller et al. (2009) and Csengeri et al. (2014).. We perform a Spearman-rank correlation test to see if there is a monotonic relationship between the two variables. The rank correlation coefficient () indicates the strength of the correlation and we also determine its significance level. We find a significant correlation between the SiO and H2 column density with a high significance (¿99%) for sources above a detection. We performed the same tests for the distance- and mass-limited subsample and find a very similar correlation. More distant sources may be too small in angular scale to fill the beam, while the dust emission is always found to be extended, therefore, a different beam dilution may affect the more distant sources. To account for this, we have also performed a partial Spearman-rank correlation test against the distance and found practically the same correlation coefficients, suggesting that distance bias does not influence the determined correlations. This result is in agreement with our findings in Sect. 4.4, where we did not find any difference in the full and the distance-limited sample. We performed the same test for the subsample with non-LTE column density estimates and find a similar trend, but with a weaker correlation coefficient (see also Sect. D). This suggests a correlation with an increasing trend between and in our sample.
Despite the uncertainties in the SiO column density estimations, we estimate here a beam and velocity averaged SiO abundance from the column density calculated from the SiO () transition above, and the column density of the clump derived from dust emission using . The estimated SiO abundances do not exhibit large variations in the sample, ranging between with a median of . This compares well with other studies in the literature, which find variations in the SiO abundance by several orders of magnitude between to (e.g. Bachiller & Perez Gutierrez, 1997; Garay et al., 1998; Codella et al., 2005; Nisini et al., 2007; Gerner et al., 2014). In contrast to the column densities, this simple analysis suggests higher SiO abundance towards the infrared-quiet clumps, and similarly high abundances towards the infrared-bright sample. The lowest SiO abundance is seen towards the clumps associated with H II regions. These results are in agreement with the findings of Gerner et al. (2014). We caution again that we derive here beam averaged abundances, and local deviations from the reported values can be very large. Because of the uncertainties of the abundance estimations, we investigate this in more detail in the next section.

| Source groups | Min. N(SiO) | Max. N(SiO) | Median N(SiO) | Average N(SiO) | Average X(SiO) |
|---|---|---|---|---|---|
| [cm-2] | [cm-2] | [cm-2] | [cm-2] | ||
| All sources | |||||
| H II regions | |||||
| infrared-bright sources | |||||
| infrared-quiet sources |
5.4 Variation in SiO emission as a function of
Based on a sample of 47 massive clumps, the study of López-Sepulcre et al. (2011) revealed a correlation between the SiO (2–1) line luminosity of clumps and their evolutionary stage (see also Motte et al., 2007). In particular, they find a decrease between with , that is interpreted as a decrease in the SiO outflow energetics or a decrease of SiO abundance with time. To further test this scenario, Sánchez-Monge et al. (2013) extended this study using small maps and the SiO () transition and confirmed the previous findings of López-Sepulcre et al. (2011).
Compared to these previous studies, we present a richer statistics in terms of the number of observed sources but also covering a much larger range of . Furthermore, we attempt to provide column density estimates with both non-LTE and LTE methods. As a comparison, in Appendix D we show the same correlations as López-Sepulcre et al. (2011), which reveals a strong correlation between and , similar to the study of Sánchez-Monge et al. (2013). These parameters are, however, not independent as appears on both axes. Therefore, in the following we base our analysis on correlations of independent variables to obtain statistically robust trends.
We first use our SiO column density estimation and correlate it with in Fig. 17 (panel a), where is an LTE estimate from the (2–1) transition calculated using the total integrated intensity of the line. We find no correlation between the two variables and the same holds for the subsample of sources analysed with RADEX. On panel b we also show the LTE-estimated abundances as a function of , which in turn show a correlation with a coefficient of . This negative correlation is a robust, statistically significant result with a significance of . To derive the abundances, we carried out a similar test, assuming a uniform, 8″ source size at 1 kpc and derive a significantly lower correlation coefficient of . Abundance estimates based on non-LTE calculations similarly show a much weaker correlation (see also Appendix D, Fig. 23). Although the first correlation is consistent with López-Sepulcre et al. (2011) and Sánchez-Monge et al. (2013), who also interpret their results as a decreasing trend between versus , our additional tests suggest that both non-LTE effects and beam filling at various distances decreased the correlation between these parameters.


The results of these tests of abundance estimations are similar to that obtained by Leurini et al. (2014), who used a more reliable estimation of the SiO abundance based on the SiO () and lines and on a dust independent estimate of ; they do not find a correlation between and . That study, however, focuses on a much smaller sample and consequently covers a considerably smaller range of , covering a range of only a factor of 50.
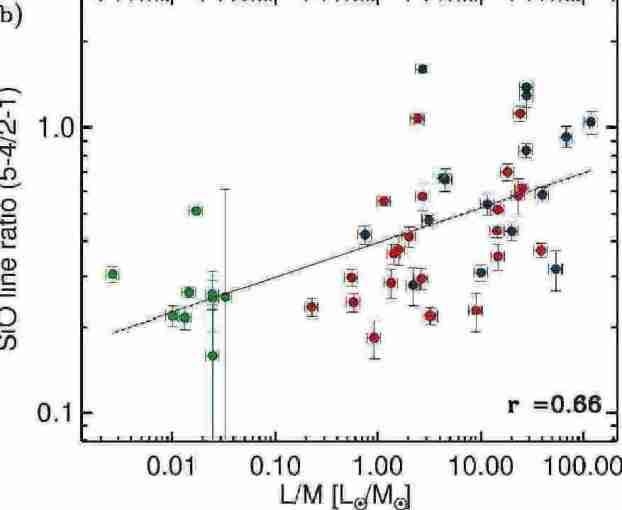
As pointed out earlier, more robust results are obtained when using the ratio between the SiO () to () transition to probe excitation effects. Since the APEX and IRAM 30m telescopes have the same beam size at these frequencies, uncertainties due to the beam filling and source size affect both lines the same way, assuming that they originate from the same gas. Therefore, we investigate the change in the ratio of the integrated intensity of the two transitions as a function of column density (see Fig. 18) and (Fig. 19).
In Fig. 18 the colour coding of the different classes suggests that a significantly higher ratio is measured towards more evolved sources with higher H2 column density, suggesting that the emission in the transition is increasing as a function of H2 column density. We derive a correlation coefficient of 0.49 with a significance of , corresponding to the probability that a random distribution would reproduce the observed coefficient. This suggests a moderate, but robust correlation. The correlation coefficient becomes slightly higher when considering only the distance- and mass-limited sample.
Considering the highest signal-to-noise detections () we find a robust, statistically significant positive correlation with () (Fig. 19). This correlation gets considerably stronger () when taking the distance- and mass-limited subsample. The increasing trend of line ratios with the distance independent measure of age clearly points towards an evolutionary trend of changing excitation conditions favouring the excitation of the 5–4 transition.


6 Discussion
We obtained SiO emission in two transitions (J) with K difference in energy levels of a statistically significant sample of massive clumps in various evolutionary stages. In the previous sections, we derived the statistical properties of this sample in terms of detection rates, line profiles, SiO column densities, abundances, and line ratios of the two transitions as a function of evolutionary stages. Here we discuss the implications of these statistical results in light of what is currently known about the astrochemical origin of the SiO molecule (Sect. 6.1), and then we report on the most recent observational results (Sect. 6.2) and compare our results to the reported evolutionary trends in the literature (Sect. 6.3). Finally, we discuss the implication of the observed trends in SiO chemistry as a function of evolution (Sect. 6.4).
6.1 How well do we understand the origin of SiO emission?
After many years of theoretical and observational studies, the astrochemical origin of SiO in the gas phase is still not fully constrained, mainly because of a poor understanding of the Si chemistry (e.g. Mackay, 1996; Walmsley et al., 1999). SiO is efficiently formed from Si atoms in the gas phase via the reactions of and (e.g. Hartquist et al., 1980; Herbst et al., 1989). Theoretical studies conclude that, in fact, most of the gas-phase Si ends up in SiO (Herbst et al., 1989), hence, it is a good tracer of Si in the gas phase. Si atoms may be brought to the gas phase by various physical processes, such as dust destruction by sputtering (Schilke et al., 1997) or direct photodesorption (Walmsley et al., 1999), the latter of which is a very inefficient process. In shocks, other processes, such as vaporisation and shattering from grain-grain collisions, may also bring Si and SiO directly to the gas phase (Guillet et al., 2009, 2011; Anderl et al., 2013). These processes are more important when the density is above cm-3, which is typical for shocks in dense clumps. Alternatively, SiO may also be directly present mixed with the grain mantel ices and get released to the gas phase via sputtering (e.g. Jiménez-Serra et al., 2009).
From an observational point of view, SiO has been detected in various astrophysical conditions with abundances of towards translucent clouds (e.g. Turner, 1998) in the Orion Bar PDR (e.g. Schilke et al., 2001) with . In nearby dense clouds, however, the SiO abundance is very low with upper limits of (e.g. Ziurys et al., 1989). While it generally shows a low abundance in the cold dense gas, in high-velocity gas from shocks ( km s-1) the SiO abundance increases by orders of magnitudes up to (e.g. Neufeld & Dalgarno, 1989; Caselli et al., 1997; Schilke et al., 1997, for theory; and, Bachiller & Perez Gutierrez, 1997; Garay et al., 1998; Nisini et al., 2007, for observations). Recent observations report low-velocity SiO emission towards IRDCs (Beuther & Sridharan, 2007), high-mass, star-forming clumps (Miettinen et al., 2006; Sanhueza et al., 2013), and widespread, low-velocity emission towards IRDCs (Jiménez-Serra et al., 2010) as well as young massive ridges (Nguyen-Luong et al., 2013), where typical abundances of have been reported.
While classical shock models explain the observed high abundances and the high-velocity emission ( ) by fast ( km s-1) shocks, the observed abundances of in the low-velocity component pose more of a challenge to models. Having SiO only in the grain cores, fast shock velocities of km s-1 are needed to produce the observed abundances. However, Jiménez-Serra et al. (2008) show that an Si abundance as low as 10-4 with respect to water in the mantles can produce narrow, low-velocity SiO line profiles with abundances of by sputtering with shock velocities as low as km s-1. Towards massive ridges other authors find that a larger fraction, up to 10% (Nguyen-Luong et al., 2013; Anderl et al., 2013), of SiO in the grain mantels is needed to explain its bright and extended emission.
Alternatively, photo-evaporation by an external UV field could also lead to SiO emission at the ambient velocities (Schilke et al., 2001). We find no clear evidence for a PDR origin for these detections because it is mostly observed towards the youngest, infrared-quiet category sources without a strong external UV field, and we find no correlation between the velocity extent of the SiO emission and tracers of the ambient gas. This suggests an upper limit on the amount of Si to be present in the grain mantle ices. To unambiguously show that low-velocity shocks releasing ice mantles are the origin of narrow, low-velocity SiO emission, SiO would be expected to show a correlation with bona-fide ice tracers, such as water (e.g. van Dishoeck et al., 2011) and methanol (Menten et al., 1986; van der Tak et al., 2000), which are beyond the scope of the current paper.
Based on these considerations and comparing the typical abundances estimated for the sample, we attribute the high-velocity line component to fast shocks related to outflows driven by embedded protostars. We detect, however, a large number of sources with only the low-velocity component with similar abundances as derived from other studies of massive clumps (Miettinen et al., 2006; Sanhueza et al., 2013). Towards low-mass protostars, the line profile and abundance of the low-velocity component of the SiO emission is found to be consistent with a magnetic precursor of C-type shocks (Jiménez-Serra et al., 2004, 2009). However, to explain the extended low-velocity SiO emission reported towards massive clumps, slow shocks related to cloud formation processes through collision are invoked (e.g. Jiménez-Serra et al., 2010; Kauffmann et al., 2013; Nguyen-Luong et al., 2013; Miettinen, 2014). Alternatively, a population of outflows from low-mass stars, or decelerated gas from high-velocity shocks, could also explain the narrow, low-velocity SiO emission peaking at ambient velocities (Lefloch et al., 1998; Jiménez-Serra et al., 2010). To put in context our observations with these studies, the low-velocity component of our sample exhibits similar, or a factor of at most two larger line widths compared to the high angular resolution observations of Duarte-Cabral et al. (2014), but a factor of ten broader as typically observed in the vicinity of low-mass protostars and in the IRDC G035.39-00.33 by Lefloch et al. (1998); Jiménez-Serra et al. (2004, 2010). The low-velocity component is, however, smaller compared to the observations of Nguyen-Luong et al. (2013) of the W43 Main star-forming complex, where its origin is explained by large-scale cloud collision.
6.2 SiO as a tracer of protostellar activity and shocks
Our sample is large enough to address the characteristic properties of SiO emission in massive clumps as well as to put constraints on evolutionary trends of these shocks. The high-velocity wings are excellent probes of fast shocks associated with protostellar jets (e.g. Schilke et al., 1997). Our finding of a high detection rate of the broad component in the SiO () line suggests the presence of fast shocks. Line wings are also detected in the most evolved stages of massive clumps, where UC-H II regions are already formed. Although infall with high accretion rates has been reported towards these types of sources (e.g. Klaassen et al., 2012), the detection of the broad outflow component suggests that there is accretion ongoing not only from the envelope, but also onto the (proto)stars leading to jets. Considering that most of our clumps eventually form not only a single star, but a protocluster, these jets may originate from younger protostars nearby UC-H II regions, which have been frequently observed with high angular resolution data (e.g. Leurini et al., 2009; Csengeri et al., 2011b). If so, the observed omni-presence of the broad component implies a continuous star formation within massive protoclusters. Clearly, high angular resolution studies would be required to pinpoint the origin of jet activity and its relation to the UC-H II region.
We also find a large fraction of the infrared-quiet clumps exhibiting a broad velocity component. Similar findings have been reported from case studies, such as a sample of massive dense cores in Cygnus-X by Motte et al. (2007), who reveal particularly bright SiO (2–1) emission towards their infrared-quiet sample. Here we also find some extreme examples, which show the broad component despite being classified as infrared-quiet sources, and being completely dark at 22 m. The detection of fast-shocks towards these sources suggests that they host deeply embedded Class 0-like protostars (Bontemps et al., 2010; Duarte-Cabral et al., 2013), and also imply that molecular tracers are more efficient tools to determine the level of star formation activity than the infrared colour criteria due to large extinction.
Other detections towards the infrared-quiet class originate from a low-velocity component SiO emission. The non-detection of the wings may be due to sensitivity limitations in the survey. However, since SiO is depleted towards low-mass dense cores (with typical abundances of , Ziurys et al., 1989), it is intriguing that SiO is detected towards massive clumps with at least an order of magnitude higher abundance (see also e.g. Miettinen et al., 2006; Sanhueza et al., 2013; Gerner et al., 2014). More recent models explain its presence by low-velocity shocks with km s-1(Jiménez-Serra et al., 2010; Nguyen-Luong et al., 2013) due to cloud-cloud collisions, which are expected to lead to a narrow ( km s-1), low-velocity component at the ambient cloud velocity. As also discussed in Sect. 6.1, the most likely origin for this emission is related to low-velocity shocks and cloud formation processes. If so, only a low-velocity SiO emission towards massive clumps lacking any star formation activity may be an indicator of youth and could pinpoint the earliest, likely prestellar phase of their evolution.
In particular, high angular resolution studies by Duarte-Cabral et al. (2014) show that up to 90% of the SiO emission could be associated with the ambient gas, produced by cloud-cloud collision at the origin of dense structures, also claimed by Csengeri et al. (2011b). They find SiO (2–1) line luminosities of the order of [K km/s kpc2] for the narrow, low-velocity component at the ambient velocity with a km s-1. We indeed find several sources with similar line luminosity, however, they exhibit on average larger line-widths up to 10 km s-1. However, since our observations provide beam-averaged information on the shocked gas in a forming cluster, we are not able to disentangle the contribution of the low-velocity component produced by the high-velocity outflow shocks and only low-velocity shocks not related to outflow activity.
Shock models predict a rapid decrease of the SiO intensity and the line width as the shock passed (Gusdorf et al., 2008a). This is also supported by observations in a sample of low- to high-mass cores in Codella et al. (1999), as well as observations in a sample of massive clumps by Sakai et al. (2010), who report decreasing line width as a function of age. The latter sample is comparable to our distance-limited sample with sources between 1.7–4.6 kpc. It is therefore intriguing, that in our large sample we do not find any robust trend in the line width of the SiO emission as a function of evolutionary stage. This could either be due to beam confusion from nearby sources, blending of different evolutionary stages in the beam, or simply a limited sensitivity for the high-velocity component.
A contribution from an additional, low-velocity shock component to the high-velocity shocks produced by protostellar jets may explain why in this large sample we find no evidence for any robust trend between the line width and age of the clumps.
6.3 SiO chemistry as a function of evolution
One of the motivations for this study is to extend previous works to investigate the trends between the SiO emission and the evolutionary stage. To accomplish this, either mid-infrared flux, or more recently was used to distinguish between young and/or evolved sources. The ratio is commonly used as a tracer of evolutionary stage (e.g. Molinari et al., 2008; Ma et al., 2013; Urquhart et al., 2014; Leurini et al., 2014); low values correspond to young cores, where the ratio is still dominated by the envelope mass, while higher values are dominated by high dominated by an accretion luminosity consuming the envelope mass. It is not clear how this value characterises massive clumps forming a cluster, however, following previous studies we also rely on this value as an indicator of evolution. Using extrapolated from monochromatic luminosity at 22 m, our estimates here are good to an order of magnitude and are sensitive to varying dust extinction along the line of sight and inclination angle. Nevertheless, since they have been derived systematically, we can rely on this measure to study the statistical properties of the sample. Given the large number of objects, in particular, that of massive clumps, our study increases the statistics of massive clumps in the SiO line by a factor of six compared to previous surveys (e.g. López-Sepulcre et al., 2011). Therefore, our study represents to date the most extensive study of SiO emission in massive clumps.
Sakai et al. (2010) studies a sample of massive clumps and distinguishes between MSX bright and dark sources, while more recent studies on larger samples by López-Sepulcre et al. (2011) and Sánchez-Monge et al. (2013) use the quantity derived from Herschel to distinguish between young and more evolved sources. Both of these studies suggest a decrease of SiO line luminosity with age. These findings were interpreted as SiO being largely enhanced in the earliest evolutionary phases due to an excess in the release of the grains from powerful jets emanating from young protostars. As such, shocks are related to the jet activity age, and the SiO line intensity decreases on short timescales (Gusdorf et al., 2008b) leading to lower line luminosities. This explanation is particularly interesting because it suggests that the intensity of the shocks and consequently the jet activity decreases with time. This would imply a picture very similar to low-mass protostars, where a decrease with jet and outflow activity with time has been shown by several studies (e.g. Bontemps et al., 1996).
More recently, Sanhueza et al. (2013) and Miettinen (2014) studied the SiO () line in samples of IRDCs and found no trend of decreasing SiO abundance. Although this may be due to a small range of evolutionary sequence covered or a different contribution of low- and high-velocity shocks in IRDCs (see Duarte-Cabral et al. (2014) for a discussion), similar results are found by Leurini et al. (2014) for a subset of sources from López-Sepulcre et al. (2011). This study is also affected by a limited range of . However, for the first time the authors investigated the effects of excitation by studying high-J SiO lines and derived the SiO abundance directly through comparison with high-J CO transitions. Clearly, a statistically significant sample covering a larger range of is essential, and we cover at least four orders of magnitude of from infrared-quiet sources to the luminous latest evolutionary stages of star formation in two SiO transitions.
In Sect. 5.4, we derive a crude estimation of the SiO abundance from the () transition, which is subject to large uncertainties due to the LTE assumption, the unknown beam dilution factor, and the fact that the was estimated from the dust. Using the LTE approximation, we find a decreasing trend between and . Although this result is similar to that found by Miettinen et al. (2006); López-Sepulcre et al. (2011); Sánchez-Monge et al. (2013), it is statistically not robust. This is because these variables are not entirely independent as both quantities are derived from the dust. On the other hand, using the non-LTE column density estimates this trend becomes even weaker (Fig. 23), suggesting that the trend is an observational bias due to the LTE approximation. This is further supported by the fact that plotting the SiO line luminosity as a function of , following López-Sepulcre et al. (2011), we do not find any trend in our sample (Fig. 24). Further supported by more recent studies, such as Leurini et al. (2014), who find no decreasing trend as a function of age, and that of Gerner et al. (2014), who report smaller abundances for the youngest sources in their sample than for the more evolved sources, our results dispute an evolutionary trend in the SiO column density or abundance as a function of age.
To overcome the limitations set by the approximations for the SiO column density and abundance calculations, the strength of our study is that we can go a step further to investigate the excitation effects towards an unprecedentedly large sample. These results in Fig. 19 clearly reveal a robust trend of increasing ratio of the area of the () and the () transitions as a function of . This implies that towards sources with larger , the higher energy levels are more populated. This implicitly suggests a change in the excitation conditions with increasing , which we interpret here as an evolutionary tracer. This explains why the SiO abundance derived only from the () transition in previous studies suffers from a systematic underestimation of the column density towards the more evolved sources. This is the case because the excitation conditions have not been properly accounted for. Furthermore, the effects of beam dilution are more important when comparing lines with different beam sizes such as in the study of López-Sepulcre et al. (2011). Even if López-Sepulcre et al. (2011) used the transition to probe the conditions of the gas, the difference in the upper state energy is larger for line and, consequently, the line ratio is more sensitive to different conditions, and although Sánchez-Monge et al. (2013) extended this initial study of with the () transition, they suffered from poor statistics.
Using the and the transitions, which have a larger difference of 62.5 K in their upper energy levels, Leurini et al. (2014) also find a weak trend for which the more evolved sources exhibit larger line ratios pointing to an increased population of the higher J transition. Our study confirms this trend with a much larger statistical sample.
Based on our statistically robust results, we therefore conclude that the excitation conditions change due to increasing temperature and/or density towards massive clumps as a function of , which reflects different evolutionary stages. In cluster-forming clumps, the high detection rate of SiO and broad wings together with the continuously increasing excitation effects suggests a continuously on-going star formation process.
6.4 Shock evolution in massive clumps
The origin of this change in excitation conditions, however, needs to be understood. SiO is sensitive to the radiative pumping via its vibrational and bound electronic states. In PDR environments, at low densities already weak near-infrared, optical, and UV-radiation field can be sufficient to modify the rotational level populations (Godard & Cernicharo, 2013), hence, the interpretation of the origin of low- and high- emission of the SiO in the vicinity of young massive stars may pose a more complex problem than previously thought (see also Leurini et al., 2014). According to Godard & Cernicharo (2013), the higher J transitions in the vicinity of bright protostars may be affected by radiative pumping. Although we have these kinds of objects among the sources classified as star-forming and clumps associated with UC-H II regions, this effect on transitions is marginal.
We find that the observed correlation of the SiO (5–4)/(2–1) integrated intensity ratio with is stronger for considering only the distance- and mass-limited sample, however, the fact that the correlation is still statistically significant including all sources suggests that radiative pumping does not significantly influence our results. Based on non-LTE calculations with RADEX (van der Tak et al., 2007), we see that the line ratios are more sensitive to a change in density rather than temperature. This has already been suggested by Schilke et al. (2001), who find that the ratio of the (5–4)/(2–1) line is more sensitive to the thermal pressure, i.e. the product of . Here we find typical line area ratios of , which are well reproduced by non-LTE calculations with a pressure term of K cm-3. Therefore, we arrive at the conclusion that the observed trend is likely either due to an increase of pre-shock gas density or is a signature of higher thermal pressure for the more evolved clumps.
The former could be explained by the fact that jets impact the already compressed material along the outflow cavity or by an increasing mass accretion rate, as observed by e.g. Klaassen et al. (2012). Numerical simulations of a collapsing massive core forming a M⊙ star report increasing mass accretion rate in the early evolution of the protostar-core system (Kuiper & Yorke, 2013). Collective effects and the strong gravitational potential in massive clumps may also explain such an increasing ambient gas density (Peters et al., 2014).
Alternatively, the reported trend of change in excitation may simply reflect the type of the central object forming. Faúndez et al. (2004) proposes an alternative scenario for the being an indicator of the most massive object forming in the clump. Csengeri et al. (2014) also finds a hint that there is a correlation between the 22 m flux and the sub-millimeter emission, further suggesting that this ratio may be rather determined by the most massive object forming in the clump. This kind of trend would then imply that the SiO emission is dominated by the central, most massive object forming in a clump, and, consequently, the observed trend would reflect that the more massive the clumps are, the more massive central object (see also Urquhart et al., 2014). As also discussed in Leurini et al. (2014), the , the properties of the central object and the age of the protocluster are not independent, and, hence, this value could be used as an indicator of the evolutionary stage of the clump. Our results in this context would imply that more massive stars would form in a higher density and higher thermal pressure environment on a clump scale.
7 Conclusions
We present here a statistically significant, representative sample of massive clumps in different evolutionary stages selected from the and survey. Towards these sources, an unbiased spectral line survey covering 32 GHz from the 3mm atmospheric window has been carried out with the IRAM 30m telescope. We focus here on the shock tracer, SiO, where the () line has been complemented with observations of the () transition with the APEX telescope. The presented study is the richest and most extensive statistical study of the properties of shocked gas towards massive clumps. The main results are as follows:
-
•
We constrain the physical properties of a sample of massive clumps and classify the sources by assessing the presence of embedded UC-H II regions, infrared-bright sources, while the rest of the sources are classified as infrared-quiet clumps. In particular, we show that the distance- and mass-limited sample is a representative sample of massive clumps in all evolutionary stages.
-
•
SiO () emission has a high detection rate of 77% above 3 in the complete sample. From these detections, we find a high detection rate, over 50%, in the SiO () line towards infrared-quiet clumps. Furthermore, we find 34 infrared-quiet sources that exhibit emission in the higher energy, () transition. All infrared-quiet sources in the mass- and distance-limited sample exhibit evidence for emission from shocked gas traced by SiO.
-
•
The line profiles often show two components, one centred at the ambient velocity (low-velocity component) and high-velocity line wings. Towards the largest fraction of all infrared-quiet sources, we only detect the low-velocity component. This may originate from fast shocks from deeply embedded, thus undetectable population of low-mass stars or low-velocity shocks originating from cloud-cloud collisions.
-
•
The high-velocity SiO emission with broad component is seen through all evolutionary stages, suggesting that jet activity is present throughout the evolution of massive clumps, likely indicating a continuously on-going star formation in a clustered environment.
-
•
We find a weak hint that the broad component is less dominant for more evolved sources, however, we do not find any evidence for a robust trend between the line width and source type, which could be due to source confusion in clusters.
-
•
Using the 29SiO isotopologue, we estimate that towards most of the sources the () emission is optically thin.
-
•
Non-LTE models towards a subsample of sources with both the and the transitions observed, indicate SiO column densities between cm-2 in a density range of cm-3 and K.
-
•
We show that the commonly used LTE estimates of the SiO column density are biased due to a varying, distance dependent beam dilution and non-LTE effects. This questions the results of previous studies claiming a decrease of SiO abundance as a function of evolutionary stage and thus a decrease of jet activity.
-
•
Instead, we find a significant correlation between the ratio of the SiO () and () lines with increasing , which are independent quantities. This is interpreted as a change in excitation conditions, with an increasing product of , i.e. pressure as a function of evolutionary stage. Our study rather suggests that the shock conditions change with either the age of the clump or as a function of the most massive object already formed in the clumps.
The origin of this trend remains, however, unclear. To further pin down the origin of the SiO emission, multi-transition studies constraining shock models are the next step. In addition, sensitive high-angular resolution observations with ALMA will unambiguously reveal the morphology of the SiO emission and thereby allow us to distinguish between the proposed explanation if the observed shocks originate from a single jet or a multiple system of material ejections.
Acknowledgements.
We thank the referee for a careful reading of the manuscript. This work was partially funded by the ERC Advanced Investigator Grant GLOSTAR (247078) and was partially carried out within the Collaborative Research Council 956, sub-project A6, funded by the Deutsche Forschungsgemeinschaft (DFG). This paper is based on data acquired with the Atacama Pathfinder EXperiment (APEX). APEX is a collaboration between the Max Planck Institute for Radioastronomy, the European Southern Observatory, and the Onsala Space Observatory. This research made use of data products from the Midcourse Space Experiment. Processing of the data was funded by the Ballistic Missile Defense Organization with additional support from NASA Office of Space Science. This research has also made use of the NASA/ IPAC Infrared Science Archive, which is operated by the Jet Propulsion Laboratory, California Institute of Technology, under contract with the National Aeronautics and Space Administration. This publication makes use of data products from the Wide-field Infrared Survey Explorer, which is a joint project of the University of California, Los Angeles, and the Jet Propulsion Laboratory/California Institute of Technology, funded by the National Aeronautics and Space Administration. This research made use of Montage, funded by the National Aeronautics and Space Administration’s Earth Science Technology Office, Computation Technologies Project, under Cooperative Agreement Number NCC5-626 between NASA and the California Institute of Technology. Montage is maintained by the NASA/IPAC Infrared Science Archive.References
- Anderl et al. (2013) Anderl, S., Guillet, V., Pineau des Forêts, G., & Flower, D. R. 2013, A&A, 556, A69
- Bachiller & Perez Gutierrez (1997) Bachiller, R. & Perez Gutierrez, M. 1997, ApJ, 487, L93
- Bernard et al. (2010) Bernard, J.-P., Paradis, D., Marshall, D. J., et al. 2010, A&A, 518, L88
- Bertoldi & McKee (1992) Bertoldi, F. & McKee, C. F. 1992, ApJ, 395, 140
- Beuther & Sridharan (2007) Beuther, H. & Sridharan, T. K. 2007, ApJ, 668, 348
- Beuther et al. (2004) Beuther, H., Zhang, Q., Greenhill, L. J., et al. 2004, ApJ, 616, L31
- Bontemps et al. (1996) Bontemps, S., Andre, P., Terebey, S., & Cabrit, S. 1996, A&A, 311, 858
- Bontemps et al. (2010) Bontemps, S., Motte, F., Csengeri, T., & Schneider, N. 2010, A&A, 524, A18
- Caselli et al. (1997) Caselli, P., Hartquist, T. W., & Havnes, O. 1997, A&A, 322, 296
- Codella et al. (2005) Codella, C., Bachiller, R., Benedettini, M., et al. 2005, MNRAS, 361, 244
- Codella et al. (1999) Codella, C., Bachiller, R., & Reipurth, B. 1999, A&A, 343, 585
- Csengeri et al. (2011a) Csengeri, T., Bontemps, S., Schneider, N., Motte, F., & Dib, S. 2011a, A&A, 527, A135
- Csengeri et al. (2011b) Csengeri, T., Bontemps, S., Schneider, N., et al. 2011b, ApJ, 740, L5
- Csengeri et al. (2014) Csengeri, T., Urquhart, J. S., Schuller, F., et al. 2014, A&A, 565, A75
- Cutri et al. (2012) Cutri, R. M., Wright, E. L., Conrow, T., et al. 2012, Explanatory Supplement to the WISE All-Sky Data Release Products, Tech. rep.
- Duarte-Cabral et al. (2014) Duarte-Cabral, A., Bontemps, S., Motte, F., et al. 2014, A&A, 570, A1
- Duarte-Cabral et al. (2013) Duarte-Cabral, A., Bontemps, S., Motte, F., et al. 2013, A&A, 558, A125
- Dunham et al. (2011) Dunham, M. K., Robitaille, T. P., Evans, II, N. J., et al. 2011, ApJ, 731, 90
- Faúndez et al. (2004) Faúndez, S., Bronfman, L., Garay, G., et al. 2004, A&A, 426, 97
- Garay et al. (1998) Garay, G., Köhnenkamp, I., Bourke, T. L., Rodríguez, L. F., & Lehtinen, K. K. 1998, ApJ, 509, 768
- Gerner et al. (2014) Gerner, T., Beuther, H., Semenov, D., et al. 2014, A&A, 563, A97
- Giannetti et al. (2014) Giannetti, A., Wyrowski, F., Brand, J., et al. 2014, A&A, 570, A65
- Godard & Cernicharo (2013) Godard, B. & Cernicharo, J. 2013, A&A, 550, A8
- Gueth et al. (1998) Gueth, F., Guilloteau, S., & Bachiller, R. 1998, A&A, 333, 287
- Guillet et al. (2009) Guillet, V., Jones, A. P., & Pineau Des Forêts, G. 2009, A&A, 497, 145
- Guillet et al. (2011) Guillet, V., Pineau Des Forêts, G., & Jones, A. P. 2011, A&A, 527, A123
- Gusdorf et al. (2008a) Gusdorf, A., Cabrit, S., Flower, D. R., & Pineau Des Forêts, G. 2008a, A&A, 482, 809
- Gusdorf et al. (2008b) Gusdorf, A., Pineau Des Forêts, G., Cabrit, S., & Flower, D. R. 2008b, A&A, 490, 695
- Hartquist et al. (1980) Hartquist, T. W., Dalgarno, A., & Oppenheimer, M. 1980, ApJ, 236, 182
- Herbst et al. (1989) Herbst, E., Millar, T. J., Wlodek, S., & Bohme, D. K. 1989, A&A, 222, 205
- Hoare et al. (2012) Hoare, M. G., Purcell, C. R., Churchwell, E. B., et al. 2012, PASP, 124, 939
- Jacob et al. (2010) Jacob, J. C., Katz, D. S., Berriman, G. B., et al. 2010, ArXiv e-prints
- Jiménez-Serra et al. (2008) Jiménez-Serra, I., Caselli, P., Martín-Pintado, J., & Hartquist, T. W. 2008, A&A, 482, 549
- Jiménez-Serra et al. (2010) Jiménez-Serra, I., Caselli, P., Tan, J. C., et al. 2010, MNRAS, 406, 187
- Jiménez-Serra et al. (2009) Jiménez-Serra, I., Martín-Pintado, J., Caselli, P., Viti, S., & Rodríguez-Franco, A. 2009, ApJ, 695, 149
- Jiménez-Serra et al. (2004) Jiménez-Serra, I., Martín-Pintado, J., Rodríguez-Franco, A., & Marcelino, N. 2004, ApJ, 603, L49
- Jiménez-Serra et al. (2005) Jiménez-Serra, I., Martín-Pintado, J., Rodríguez-Franco, A., & Martín, S. 2005, ApJ, 627, L121
- Kauffmann et al. (2013) Kauffmann, J., Pillai, T., & Zhang, Q. 2013, ApJ, 765, L35
- Klaassen et al. (2012) Klaassen, P. D., Testi, L., & Beuther, H. 2012, A&A, 538, A140
- Krumholz & McKee (2008) Krumholz, M. R. & McKee, C. F. 2008, Nature, 451, 1082
- Kuiper & Yorke (2013) Kuiper, R. & Yorke, H. W. 2013, ApJ, 772, 61
- Lefloch et al. (1998) Lefloch, B., Castets, A., Cernicharo, J., & Loinard, L. 1998, ApJ, 504, L109
- Leurini et al. (2013) Leurini, S., Codella, C., Gusdorf, A., et al. 2013, A&A, 554, A35
- Leurini et al. (2014) Leurini, S., Codella, C., López-Sepulcre, A., et al. 2014, A&A, 570, A49
- Leurini et al. (2009) Leurini, S., Codella, C., Zapata, L. A., et al. 2009, A&A, 507, 1443
- López-Sepulcre et al. (2011) López-Sepulcre, A., Walmsley, C. M., Cesaroni, R., et al. 2011, A&A, 526, L2
- Lumsden et al. (2013) Lumsden, S. L., Hoare, M. G., Urquhart, J. S., et al. 2013, ApJS, 208, 11
- Ma et al. (2013) Ma, B., Tan, J. C., & Barnes, P. J. 2013, ApJ, 779, 79
- Mackay (1996) Mackay, D. D. S. 1996, MNRAS, 278, 62
- Menten et al. (1986) Menten, K. M., Walmsley, C. M., Henkel, C., & Wilson, T. L. 1986, A&A, 157, 318
- Miettinen (2014) Miettinen, O. 2014, A&A, 562, A3
- Miettinen et al. (2006) Miettinen, O., Harju, J., Haikala, L. K., & Pomrén, C. 2006, A&A, 460, 721
- Molinari et al. (2008) Molinari, S., Pezzuto, S., Cesaroni, R., et al. 2008, A&A, 481, 345
- Motte et al. (2007) Motte, F., Bontemps, S., Schilke, P., et al. 2007, A&A, 476, 1243
- Mottram et al. (2011) Mottram, J. C., Hoare, M. G., Urquhart, J. S., et al. 2011, A&A, 525, A149
- Neufeld & Dalgarno (1989) Neufeld, D. A. & Dalgarno, A. 1989, ApJ, 340, 869
- Nguyen-Luong et al. (2013) Nguyen-Luong, Q., Motte, F., Carlhoff, P., et al. 2013, ApJ, 775, 88
- Nisini et al. (2007) Nisini, B., Codella, C., Giannini, T., et al. 2007, A&A, 462, 163
- Ossenkopf & Henning (1994) Ossenkopf, V. & Henning, T. 1994, A&A, 291, 943
- Penzias (1981) Penzias, A. A. 1981, ApJ, 249, 513
- Peters et al. (2014) Peters, T., Klaassen, P. D., Mac Low, M.-M., et al. 2014, ApJ, 788, 14
- Purcell et al. (2013) Purcell, C. R., Hoare, M. G., Cotton, W. D., et al. 2013, ApJS, 205, 1
- Qiu et al. (2007) Qiu, K., Zhang, Q., Beuther, H., & Yang, J. 2007, ApJ, 654, 361
- Sakai et al. (2010) Sakai, T., Sakai, N., Hirota, T., & Yamamoto, S. 2010, ApJ, 714, 1658
- Sánchez-Monge et al. (2013) Sánchez-Monge, Á., López-Sepulcre, A., Cesaroni, R., et al. 2013, A&A, 557, A94
- Sanhueza et al. (2012) Sanhueza, P., Jackson, J. M., Foster, J. B., et al. 2012, ApJ, 756, 60
- Sanhueza et al. (2013) Sanhueza, P., Jackson, J. M., Foster, J. B., et al. 2013, ApJ, 773, 123
- Schilke et al. (2001) Schilke, P., Pineau des Forêts, G., Walmsley, C. M., & Martín-Pintado, J. 2001, A&A, 372, 291
- Schilke et al. (1997) Schilke, P., Walmsley, C. M., Pineau des Forets, G., & Flower, D. R. 1997, A&A, 321, 293
- Schneider et al. (2010) Schneider, N., Csengeri, T., Bontemps, S., et al. 2010, A&A, 520, A49
- Schuller et al. (2009) Schuller, F., Menten, K. M., Contreras, Y., et al. 2009, A&A, 504, 415
- Tackenberg et al. (2012) Tackenberg, J., Beuther, H., Henning, T., et al. 2012, A&A, 540, A113
- Turner (1998) Turner, B. E. 1998, ApJ, 495, 804
- Urquhart et al. (2014) Urquhart, J. S., Moore, T. J. T., Csengeri, T., et al. 2014, MNRAS, 443, 1555
- Urquhart et al. (2013) Urquhart, J. S., Thompson, M. A., Moore, T. J. T., et al. 2013, MNRAS, 435, 400
- van der Tak et al. (2007) van der Tak, F. F. S., Black, J. H., Schöier, F. L., Jansen, D. J., & van Dishoeck, E. F. 2007, A&A, 468, 627
- van der Tak et al. (2000) van der Tak, F. F. S., van Dishoeck, E. F., & Caselli, P. 2000, A&A, 361, 327
- van Dishoeck et al. (2011) van Dishoeck, E. F., Kristensen, L. E., Benz, A. O., et al. 2011, PASP, 123, 138
- Vasyunina et al. (2011) Vasyunina, T., Linz, H., Henning, T., et al. 2011, A&A, 527, A88
- Walmsley et al. (1999) Walmsley, C. M., Pineau des Forêts, G., & Flower, D. R. 1999, A&A, 342, 542
- Wienen et al. (2015) Wienen, M., Wyrowski, F., Menten, K. M., et al. 2015, A&A, 579, A91
- Wienen et al. (2012) Wienen, M., Wyrowski, F., Schuller, F., et al. 2012, A&A, 544, A146
- Wright et al. (2010) Wright, E. L., Eisenhardt, P. R. M., Mainzer, A. K., et al. 2010, AJ, 140, 1868
- Ziurys et al. (1989) Ziurys, L. M., Friberg, P., & Irvine, W. M. 1989, ApJ, 343, 201
Appendix A Calibration
To monitor the system’s performance on different days, we observed a reference source, mostly G34.26+0.15, at the beginning of each observing session and each frequency setup. We then performed a Gaussian fit to the brightest lines, e.g. H13CO+ (1–0), SiO (2–1), OCS (7-6), HC3N (7–6) lines. Figure 20 shows the variation in the peak intensity obtained from N2H+ line of the reference source. We monitor an variation between the different observing days of 7%. The derived line intensities are therefore comparable between the different set of observations.
Appendix B The 22 m flux density
We check the consistency of the various datasets used for determining the luminosity of the sources. First we cross-correlate the used 21 m fluxes from the MSX E-band with the WISE W4 band photometry at 22 m. In Fig. 21, we show the correlation between the extracted flux densities from the two catalogues. There is a substantial overlap in the sensitivity of the two detectors and there is a good agreement between the two measurements, as already discussed in Csengeri et al. (2014); see also Lumsden et al. 2013. In Fig. 21, we show the comparison between the MSX and WISE fluxes.
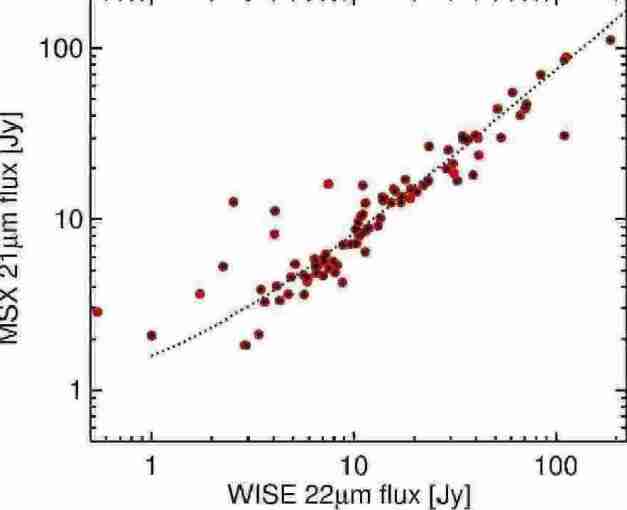
Appendix C Excitation temperature
Fig. 22 shows line ratio estimations from LTE calculations.
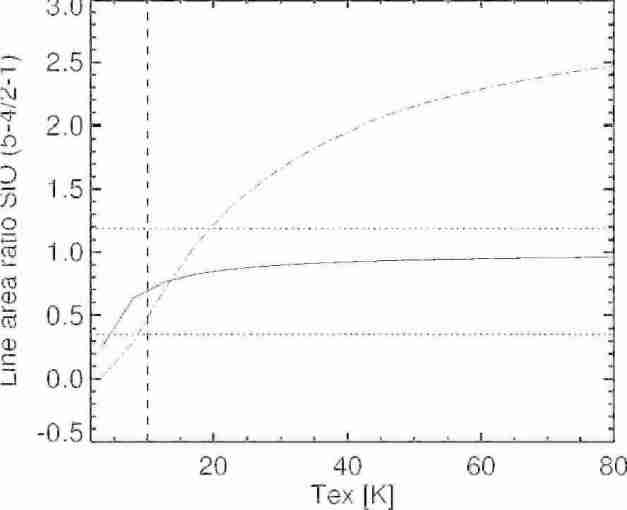
Appendix D Additional correlations
We show here the same correlations as in Fig. 23 a panel, but for the non-LTE SiO column density estimates with RADEX. Figure 23 shows the SiO column densities from two tests: the filled symbols and black labels correspond to calculations with a beam filling factor of unity, which show a similar, although weaker, correlation as the abundances estimated from the LTE assumption. Open circles with grey labels show models where the distance effect is taken into account with a fixed source size. The correlation coefficient is smaller in this case.
As a comparison, in the Fig. 23 b panel we show the correlation between (SiO) and for the non-LTE models. This plot shows that in taking the distance effect into account, the decrease of the SiO abundance as a function of age indicators becomes less significant.
Finally, to compare our statistical results with that of López-Sepulcre et al. (2011), we show the plots of the same quantities as in their paper. For simplicity we show the sources presented in Sánchez-Monge et al. (2013) with revised distances. As Fig. 24 lower panel shows, there is a strong correlation when plotting the L(SiO )/Lbol against , while we find no correlation between the SiO (2–1) line luminosity and .
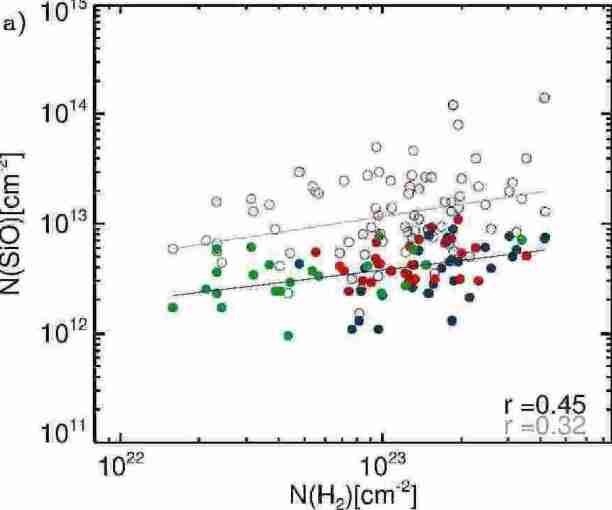
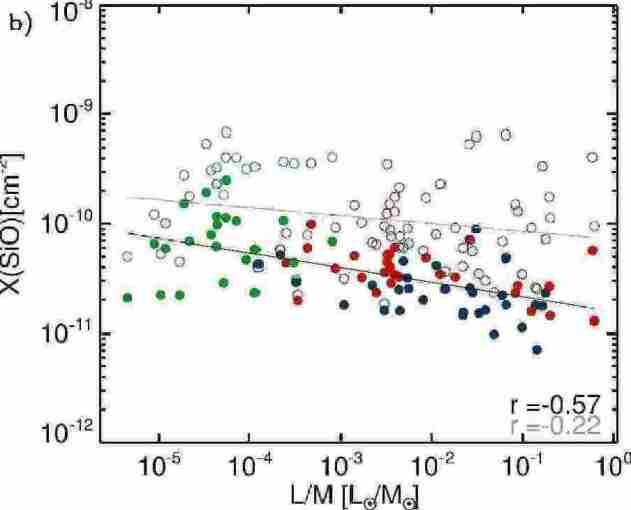
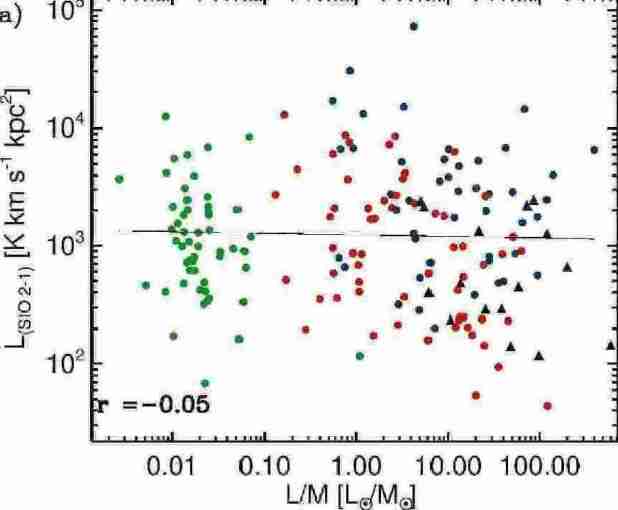
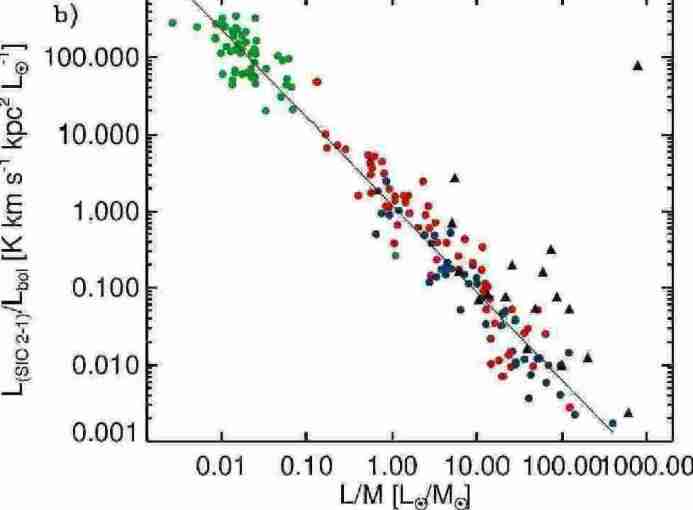
Appendix E The SiO () and () lines of the sample
E.1 Spectra of sources observed in both the SiO () and () lines
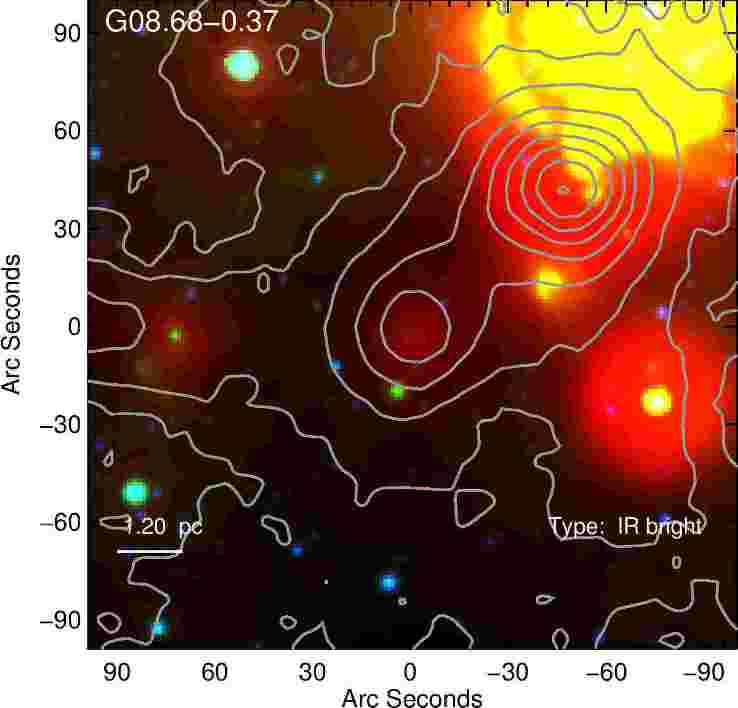
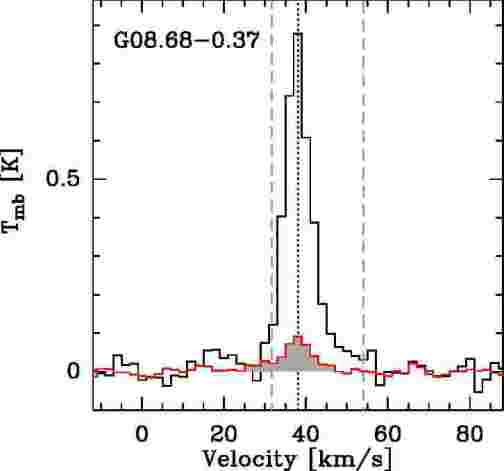
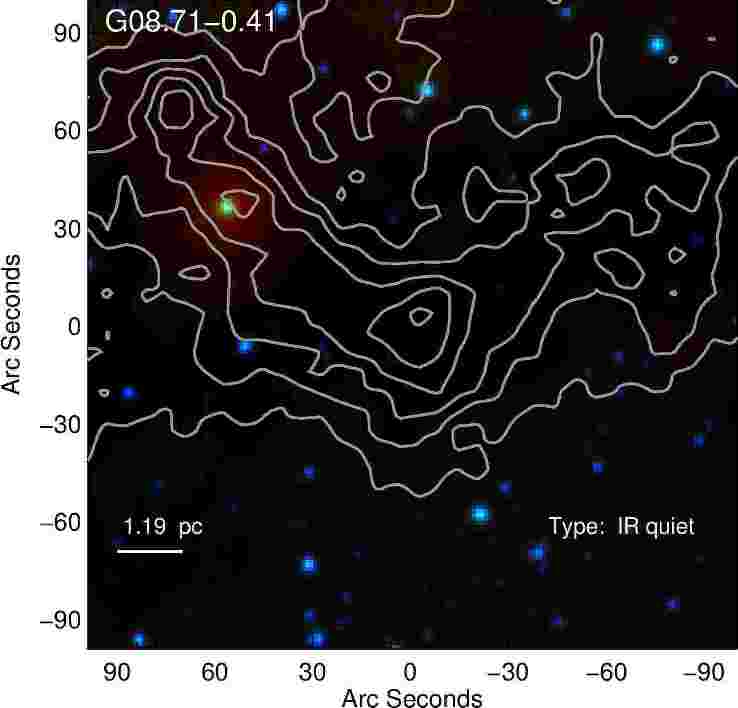
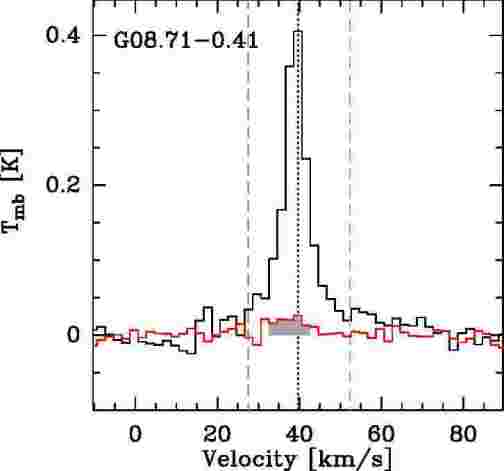
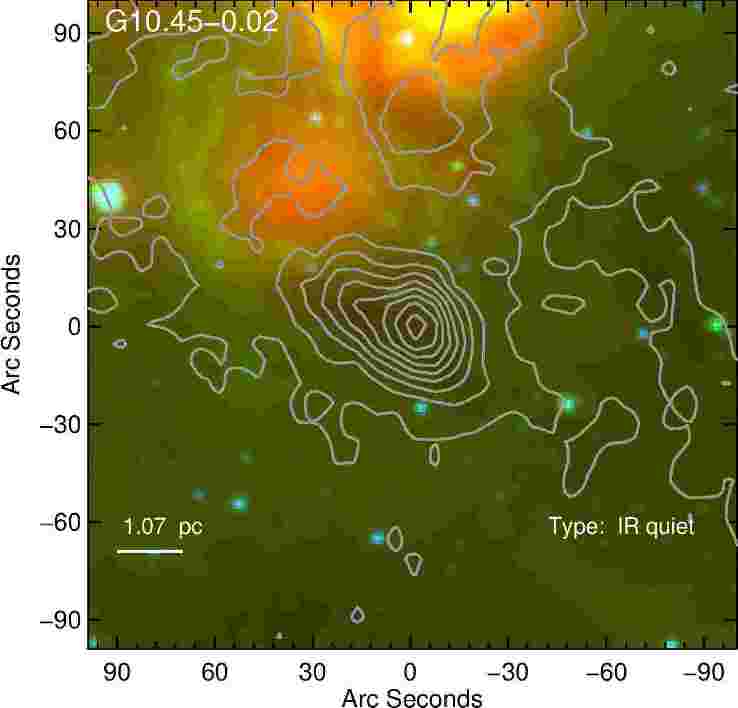
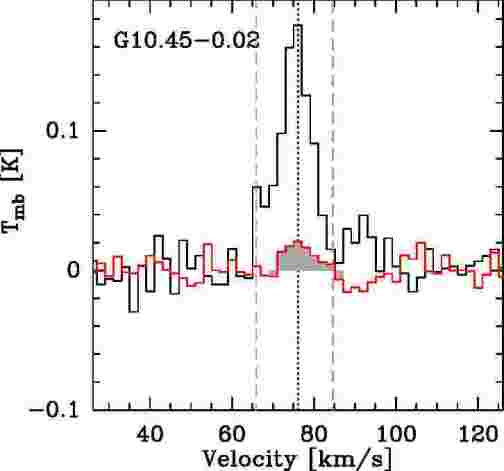
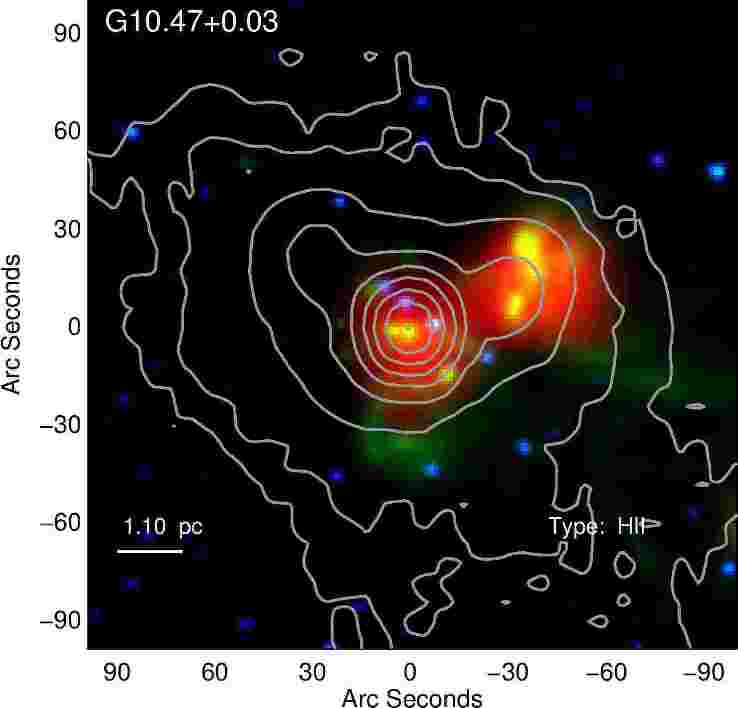
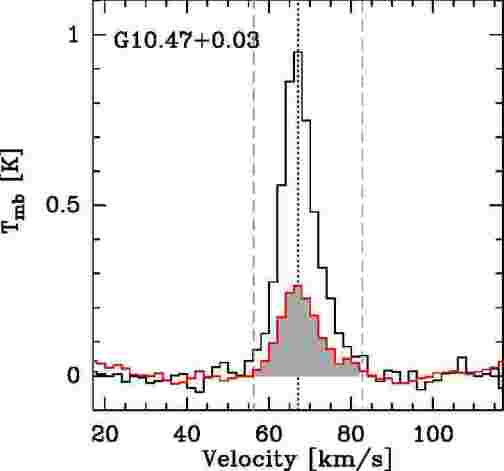
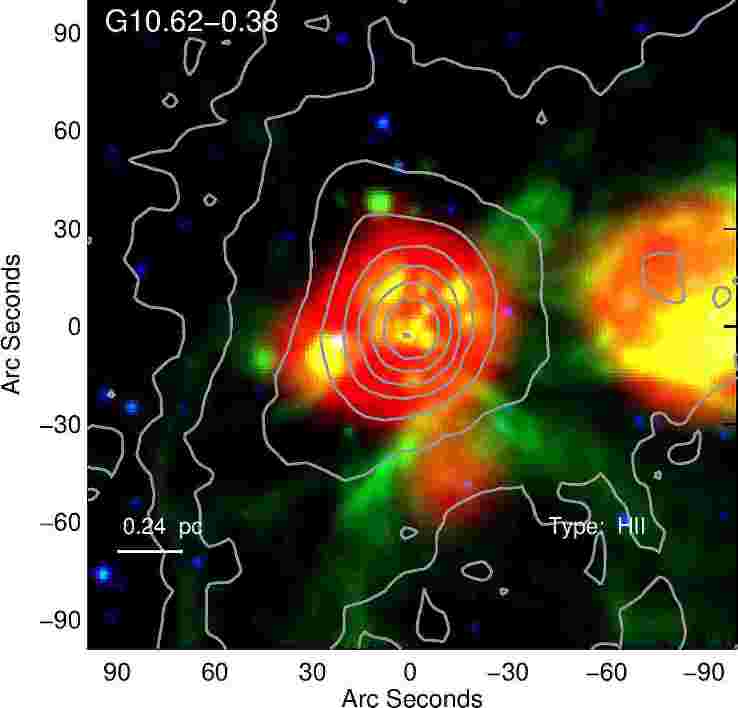
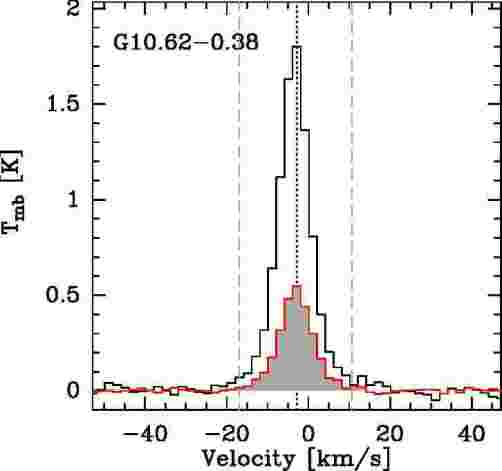
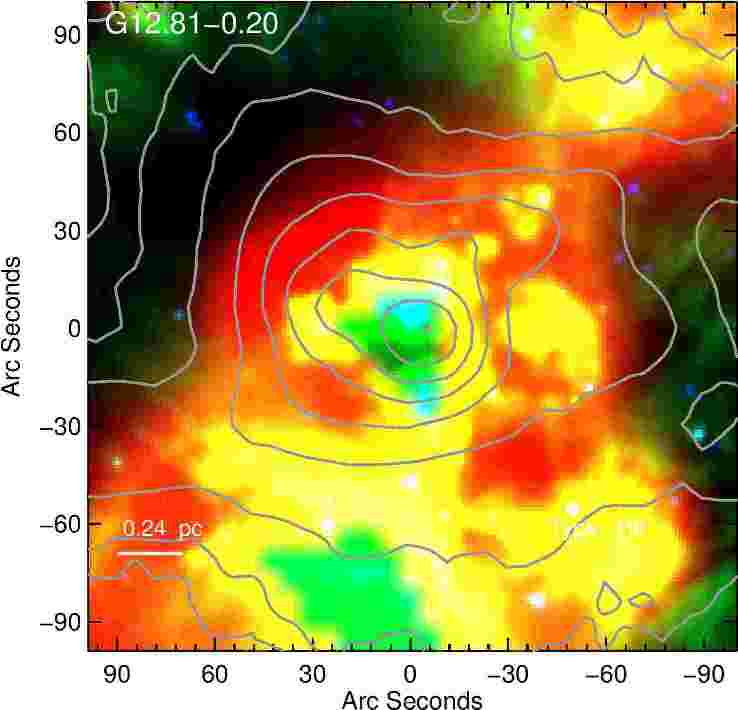
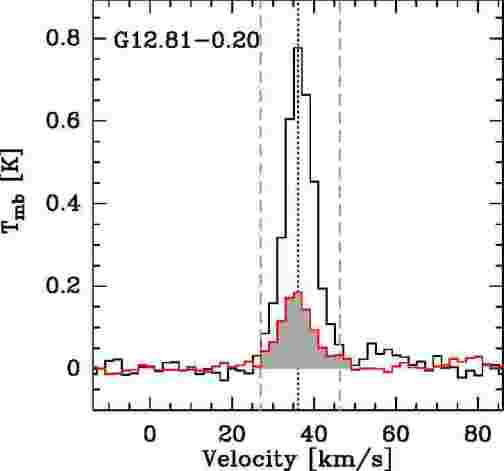
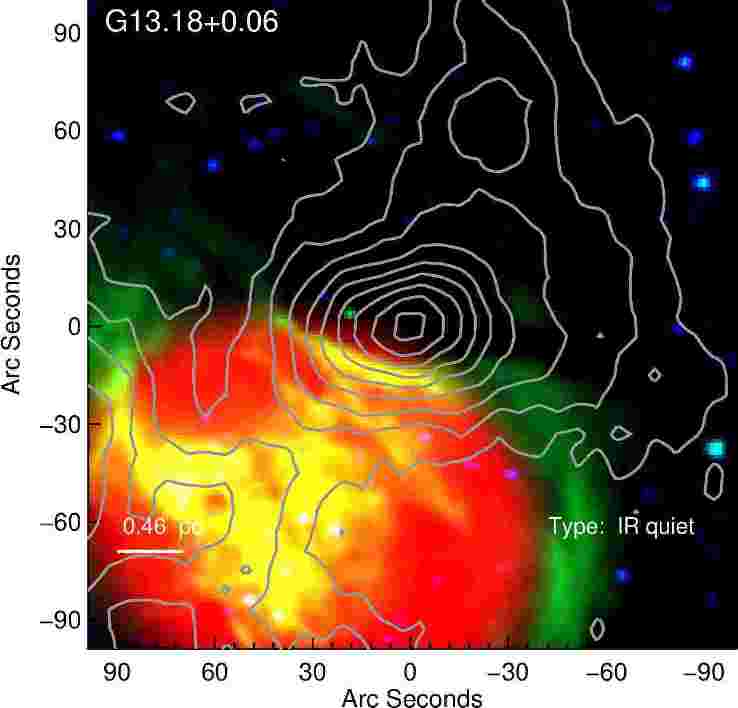
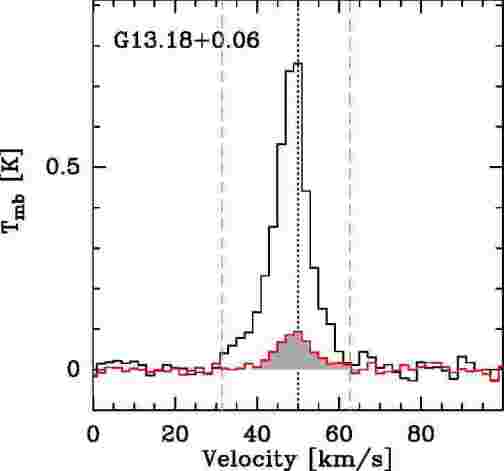

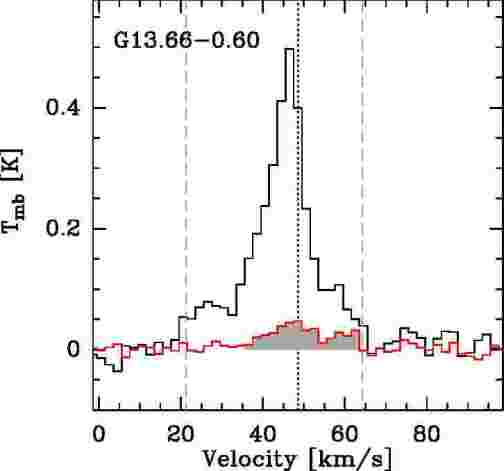
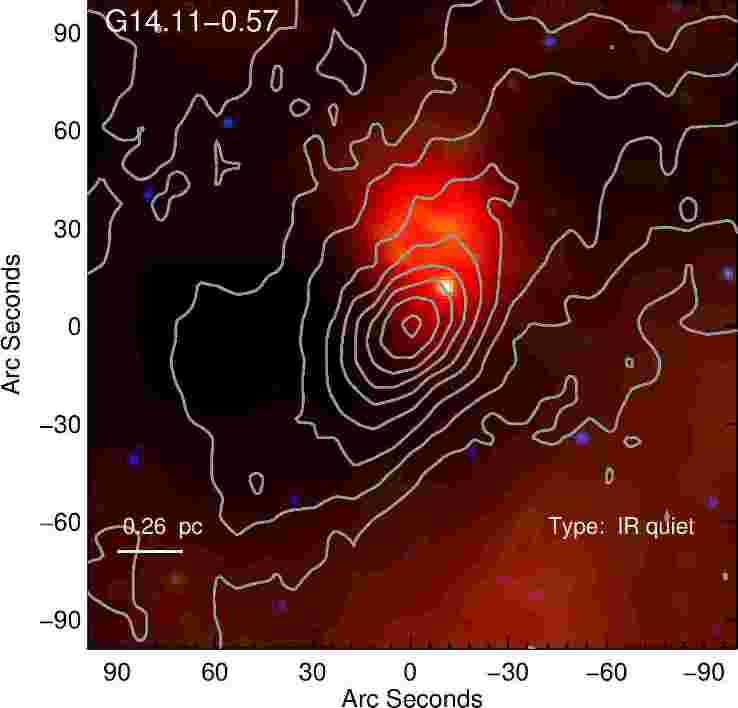
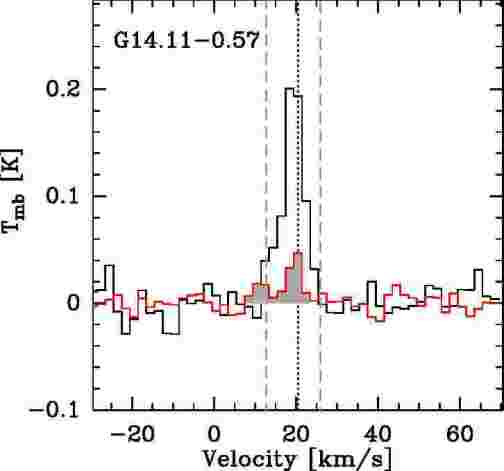
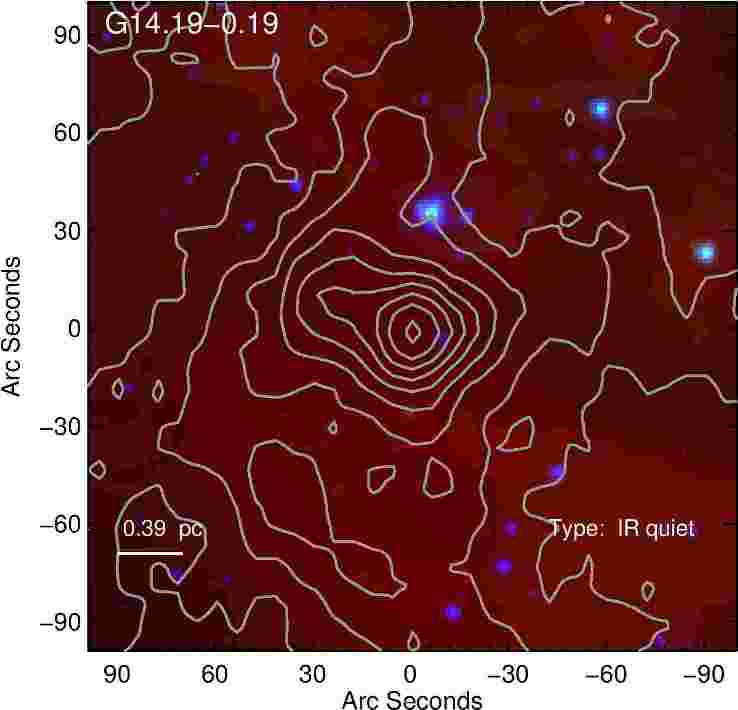
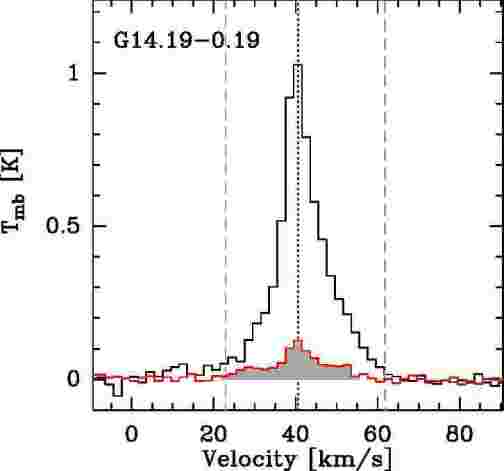
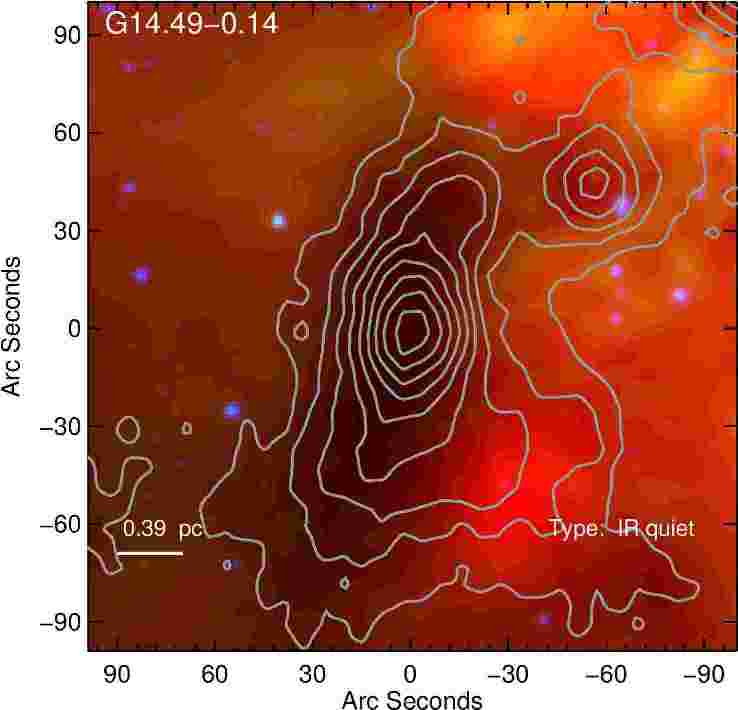
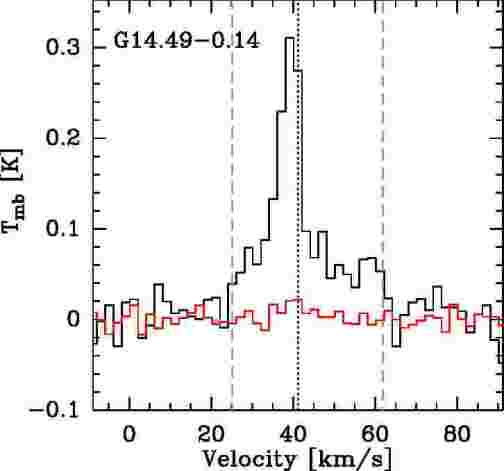
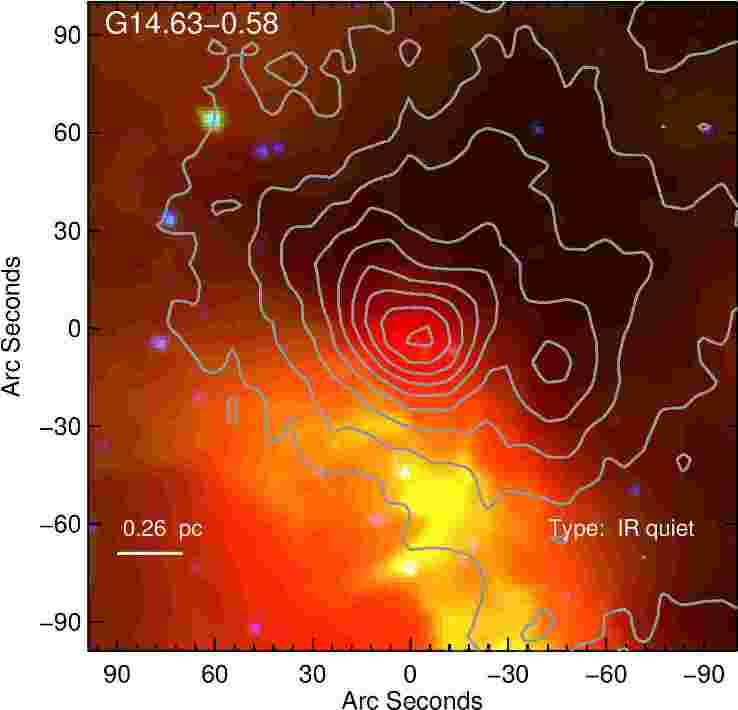
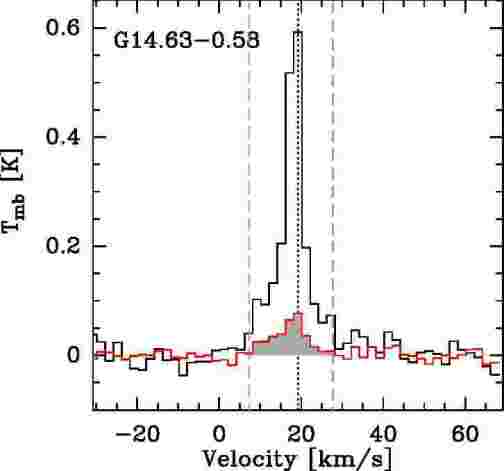
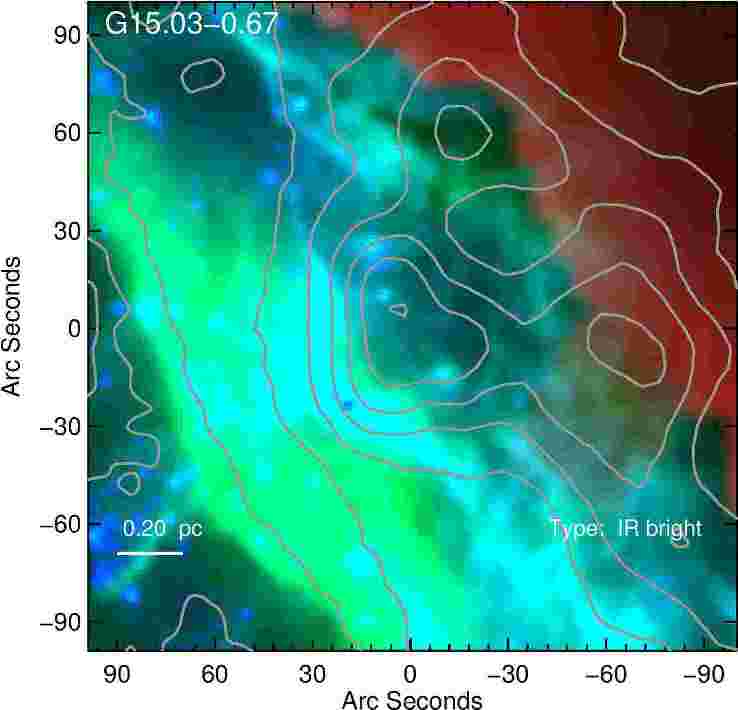
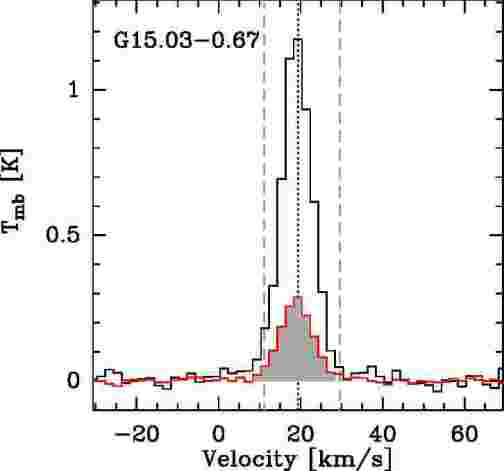
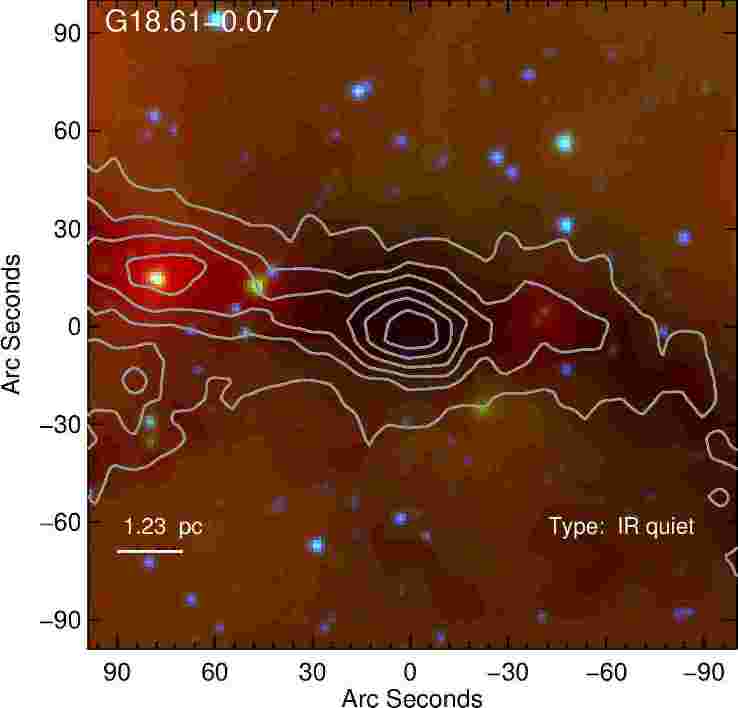
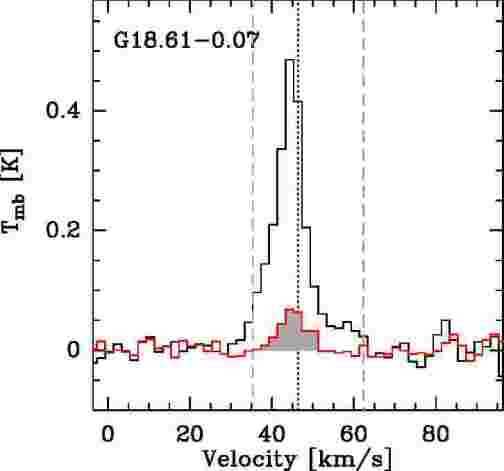
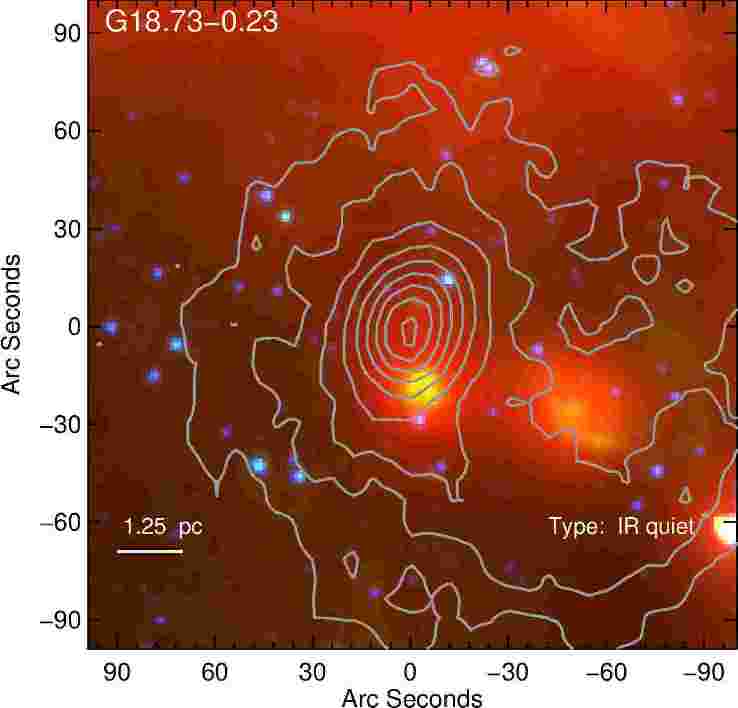
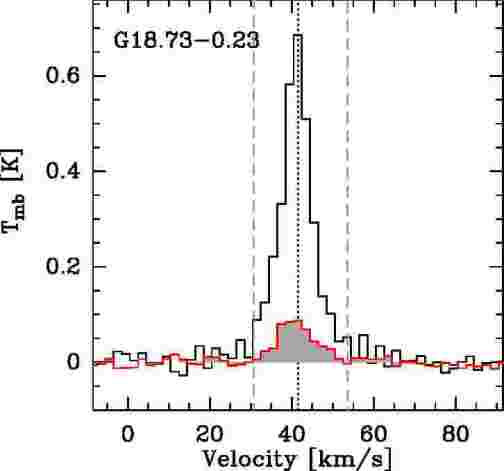
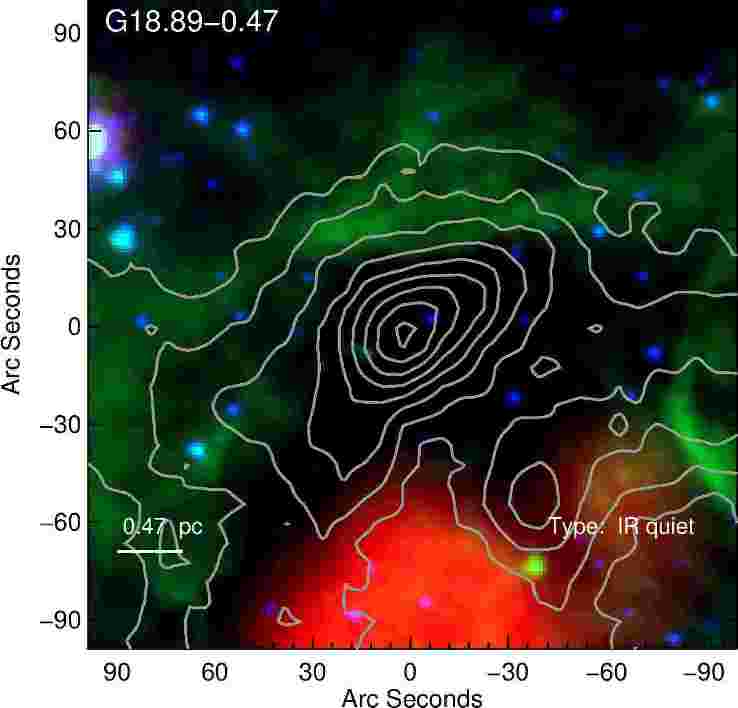
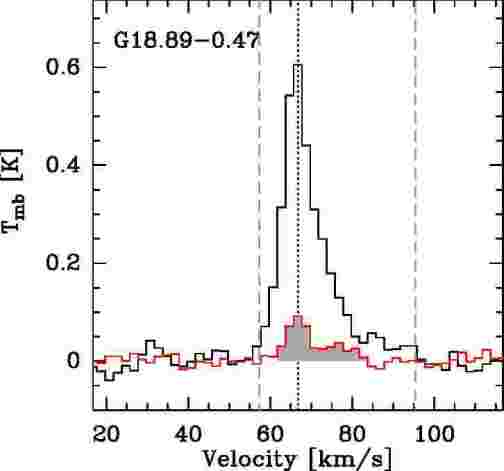
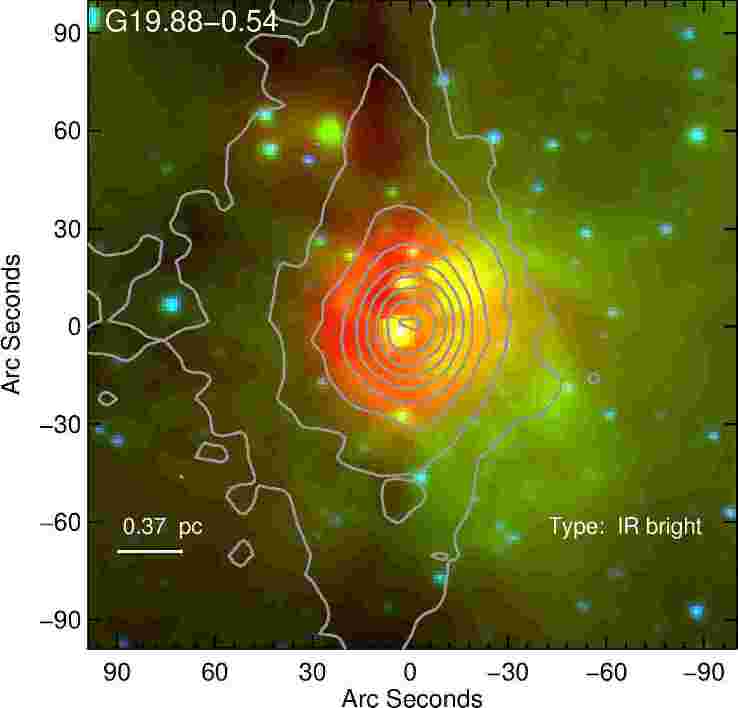
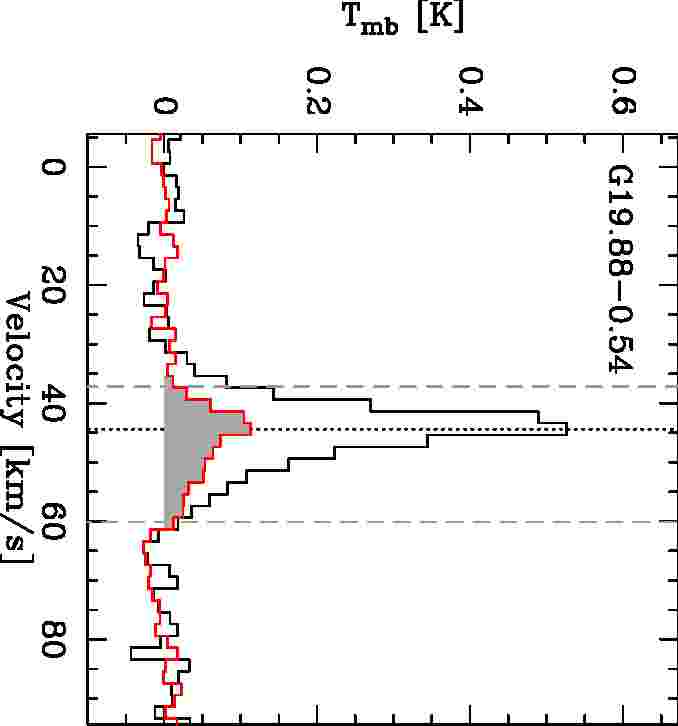
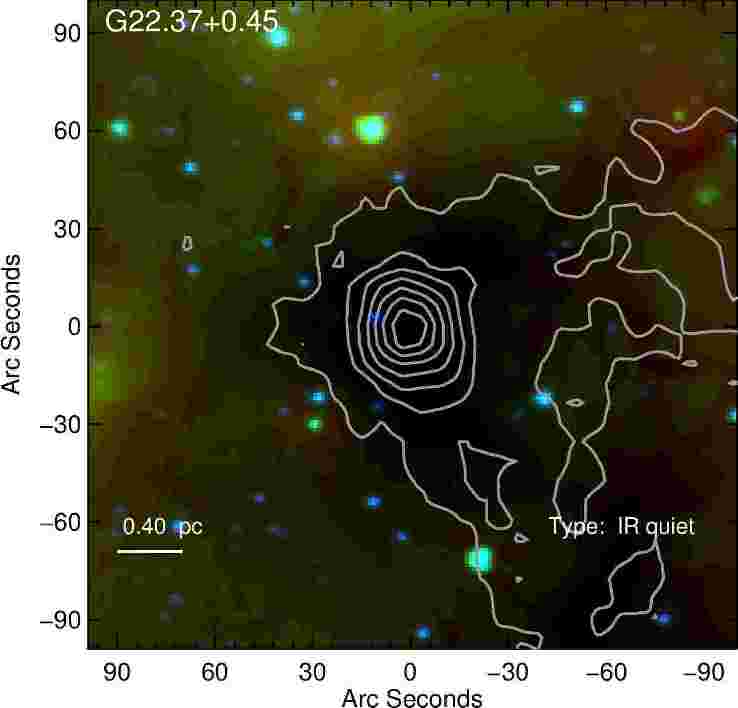
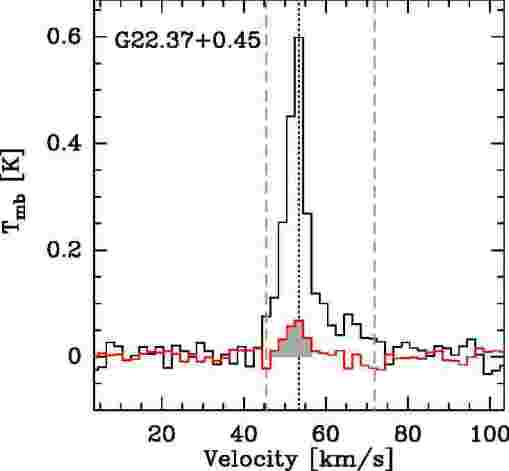

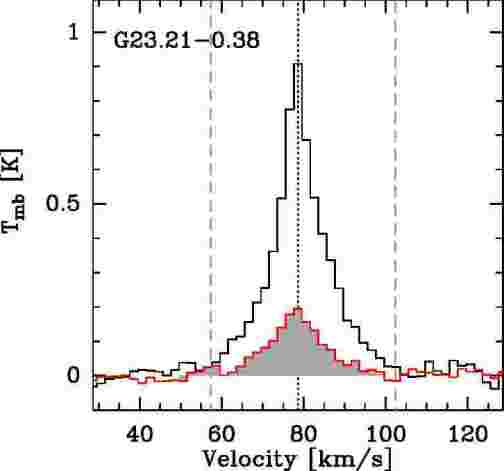
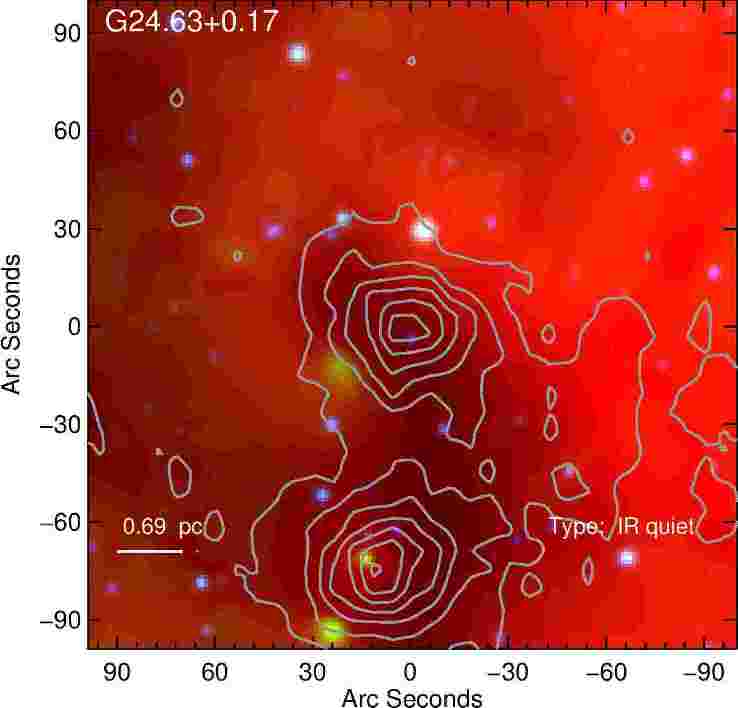
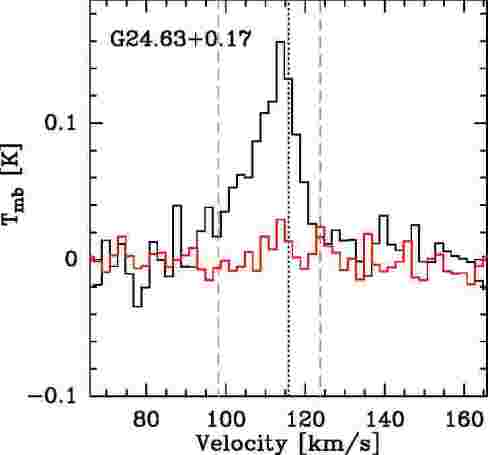
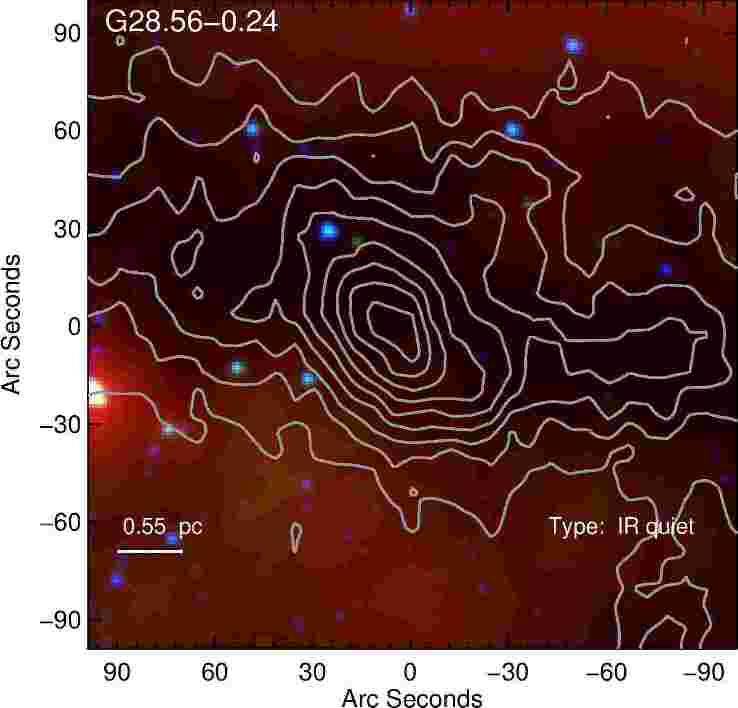
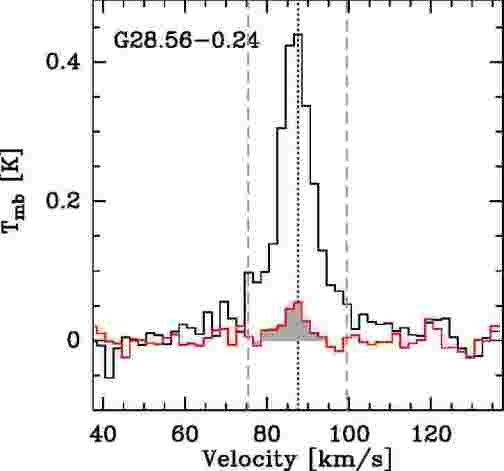
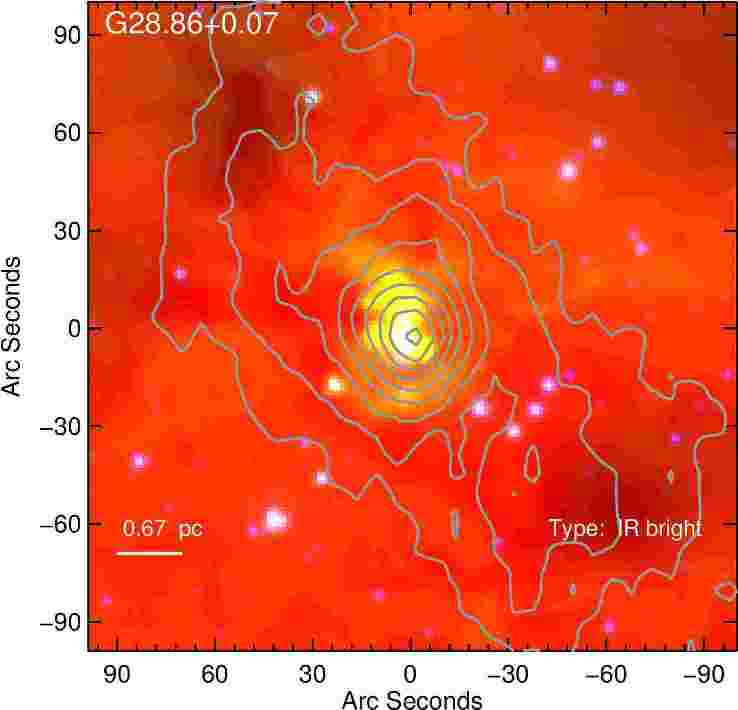
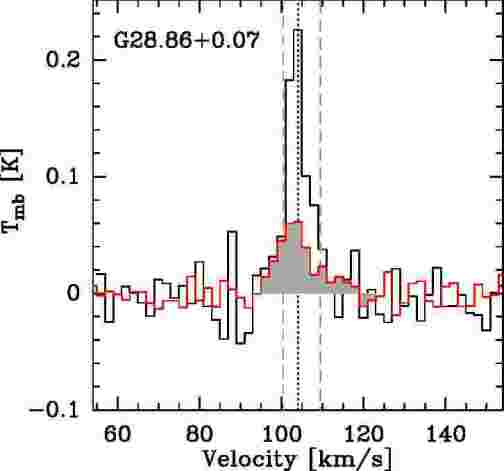
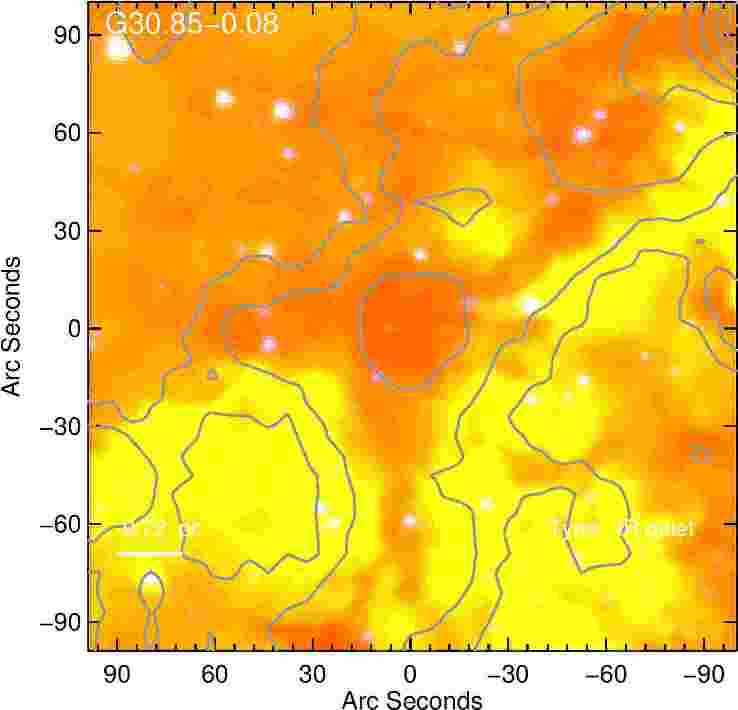
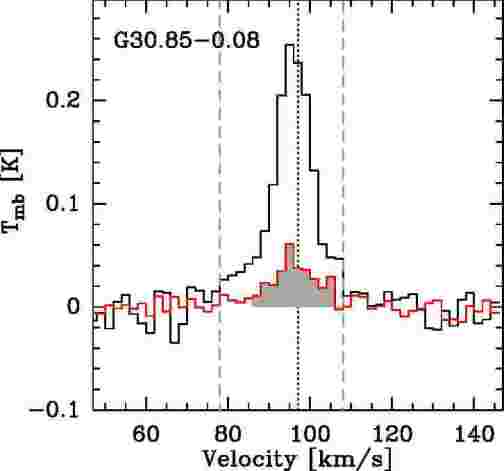
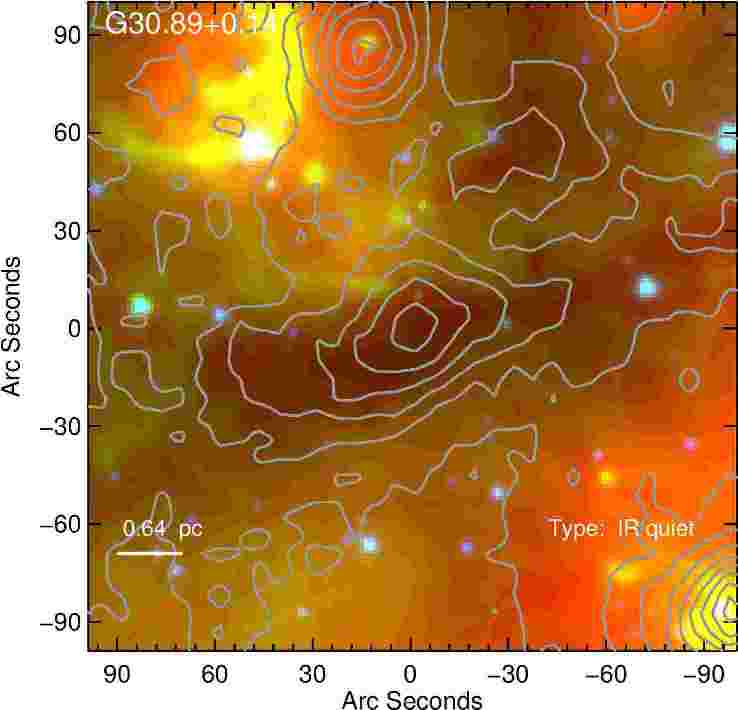
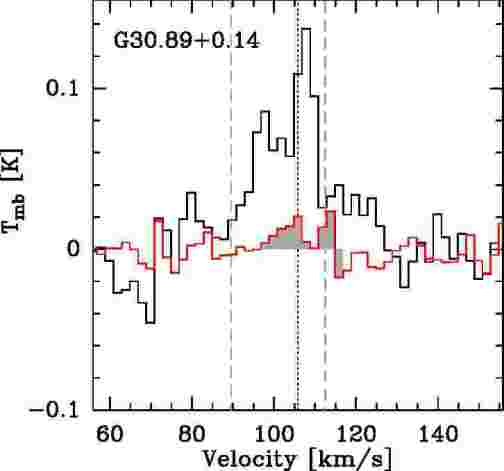

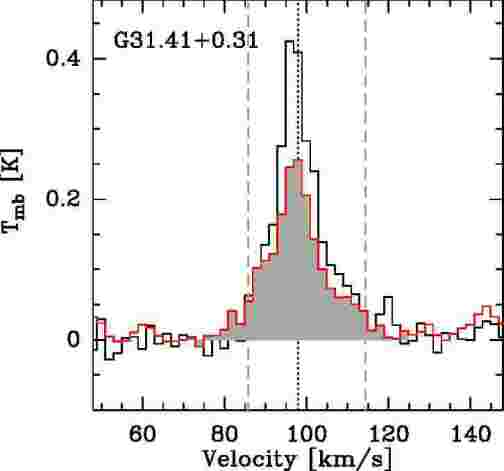
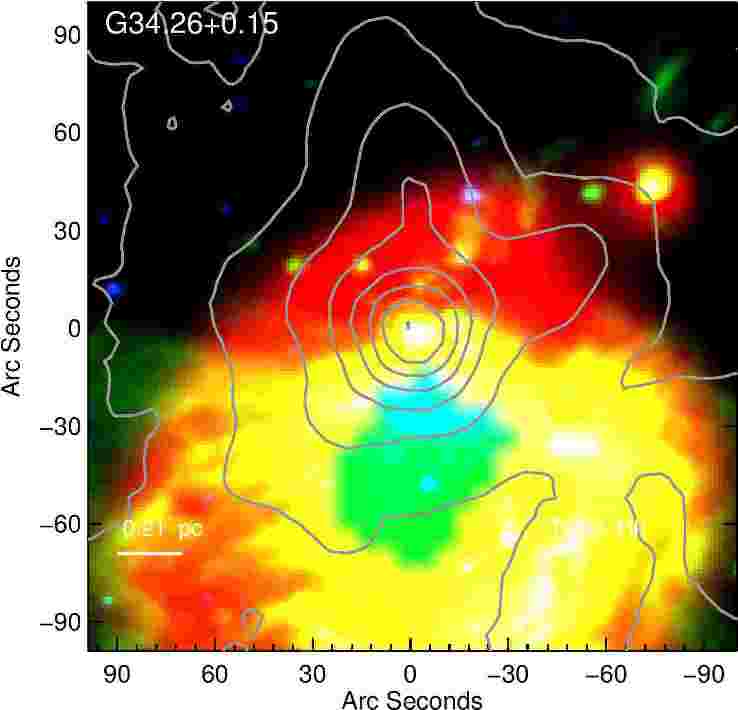
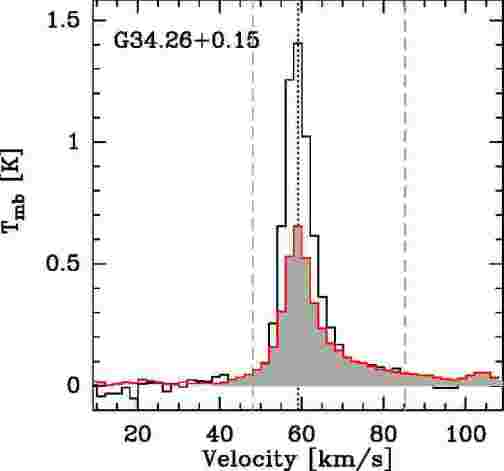
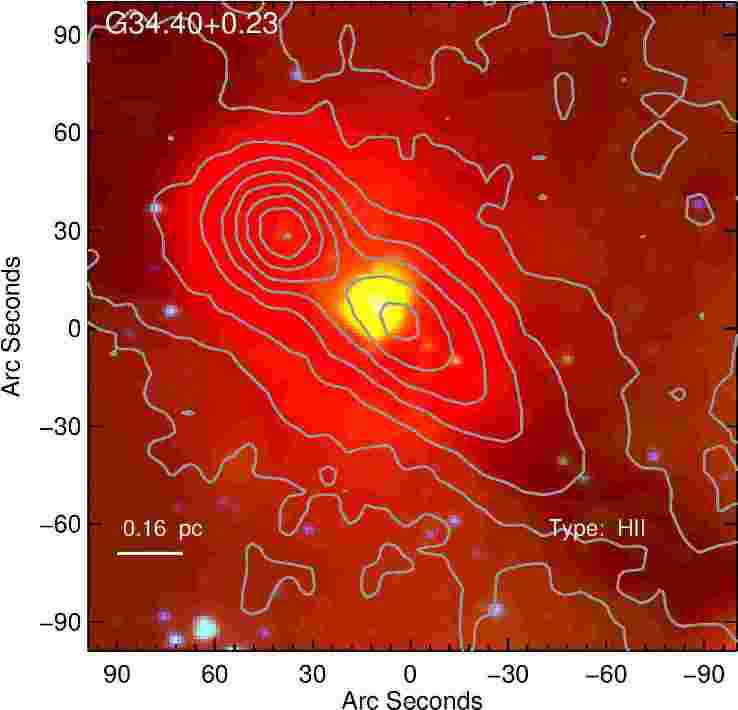
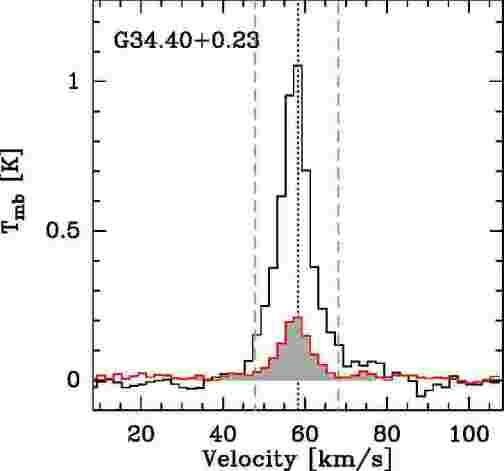
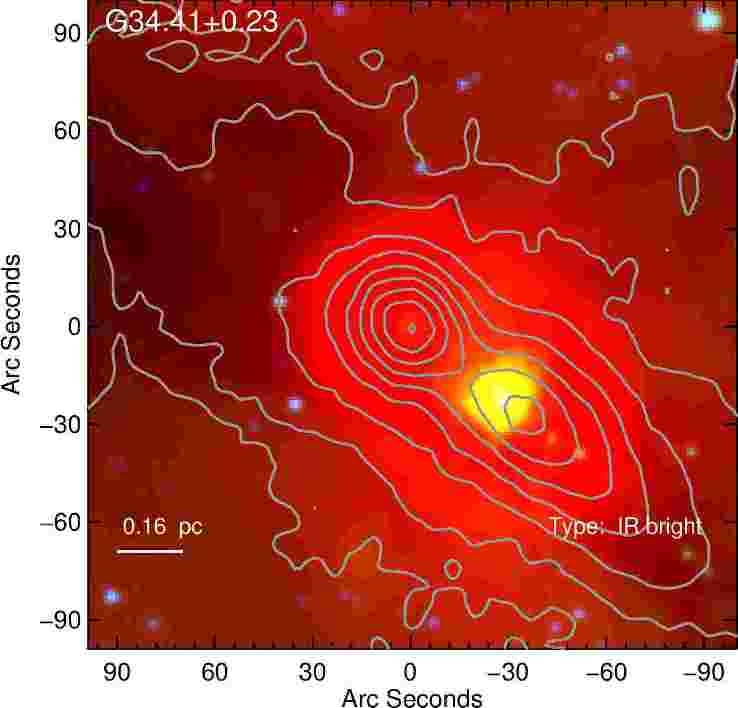
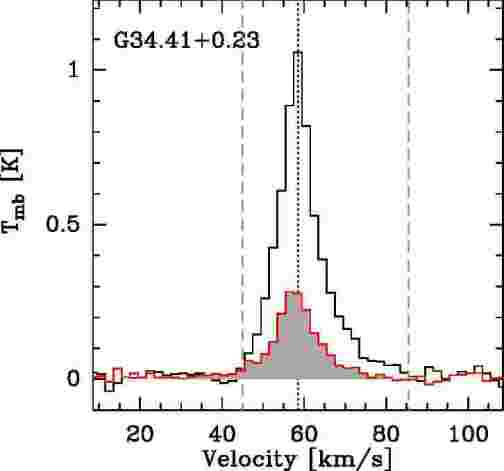
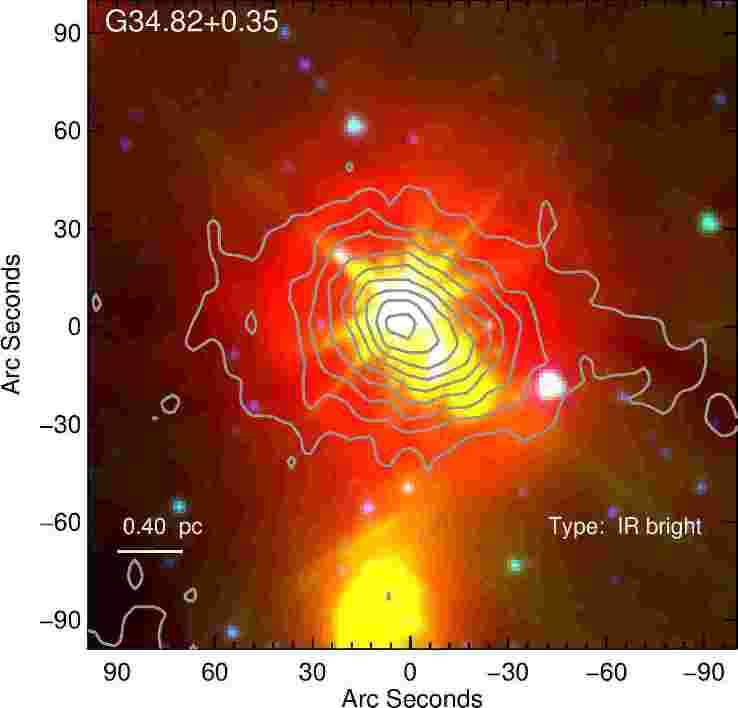
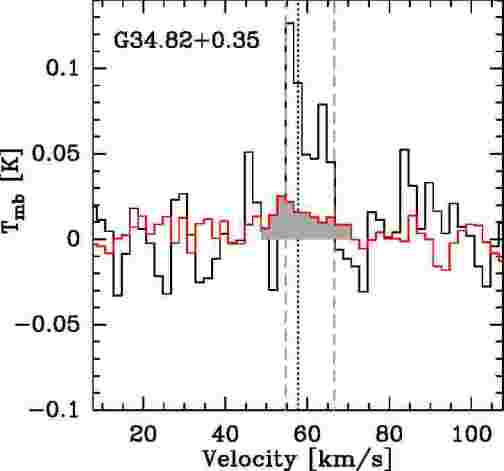
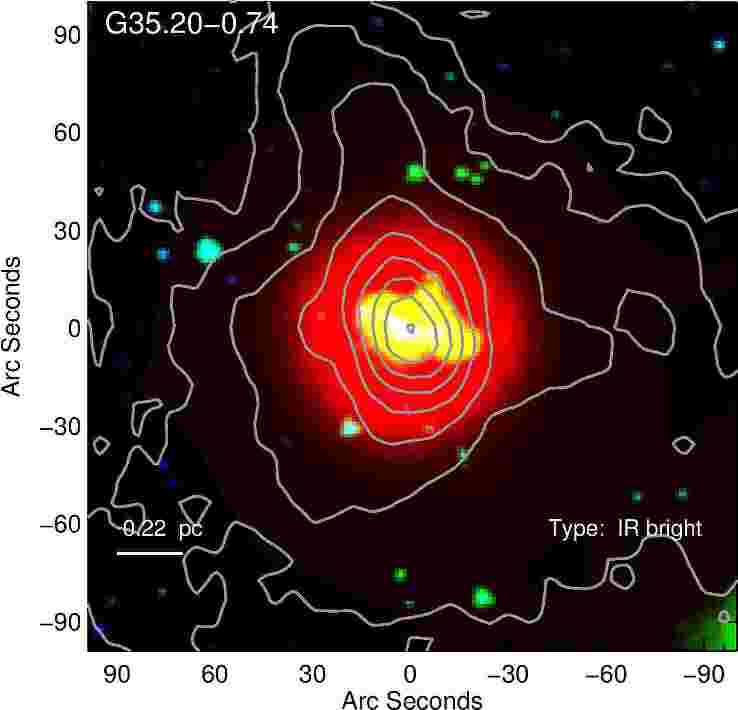
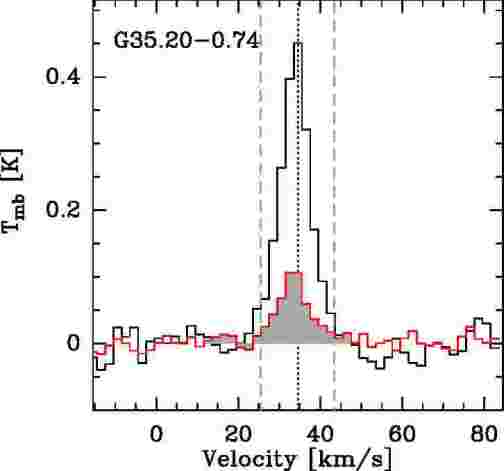
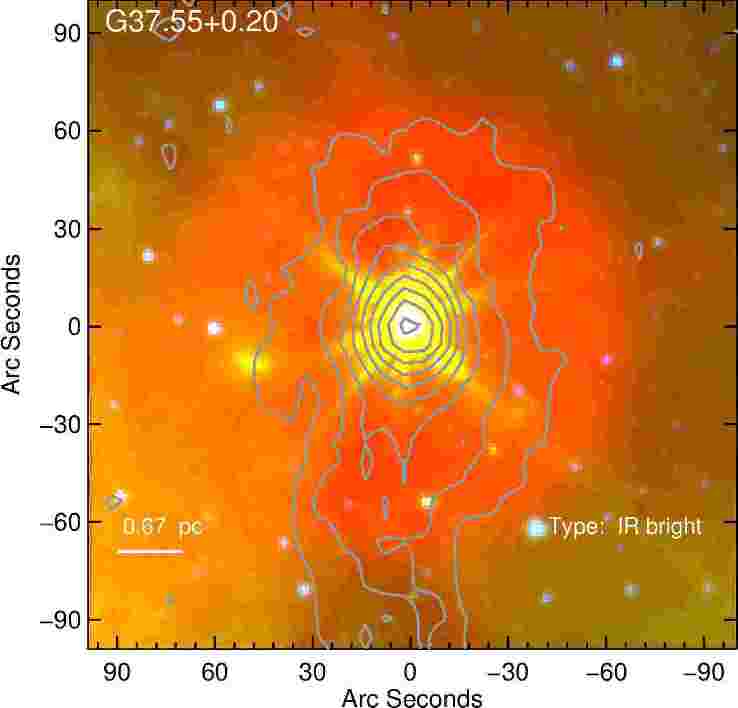
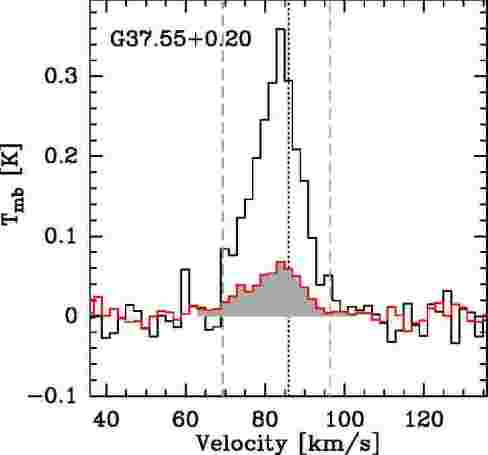
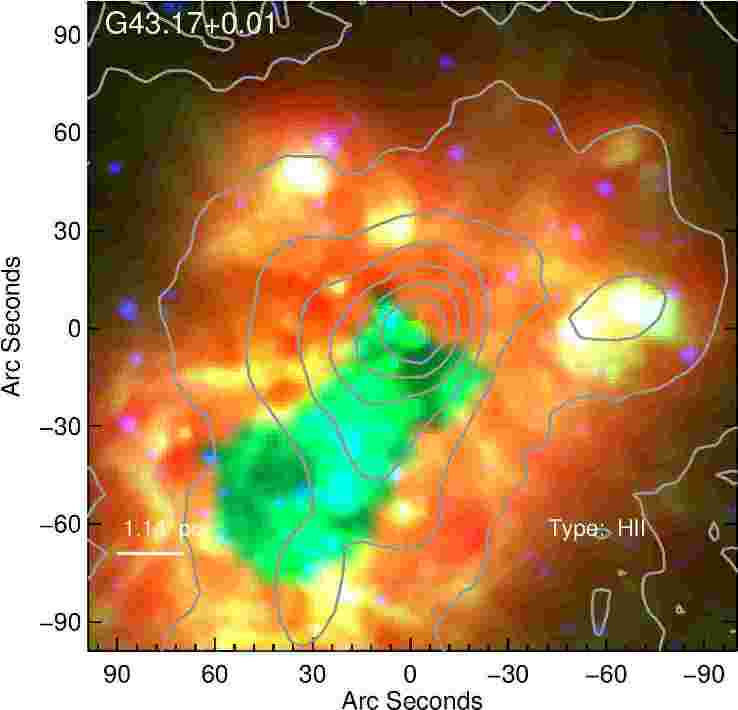
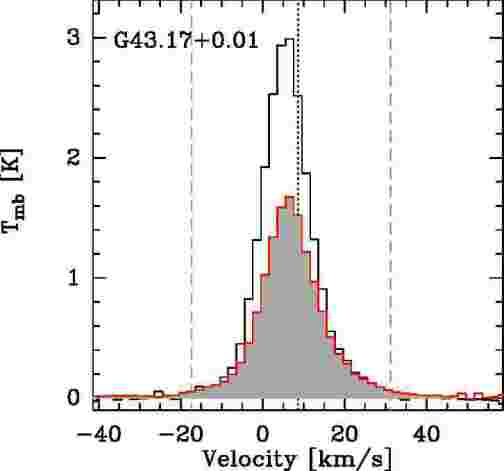
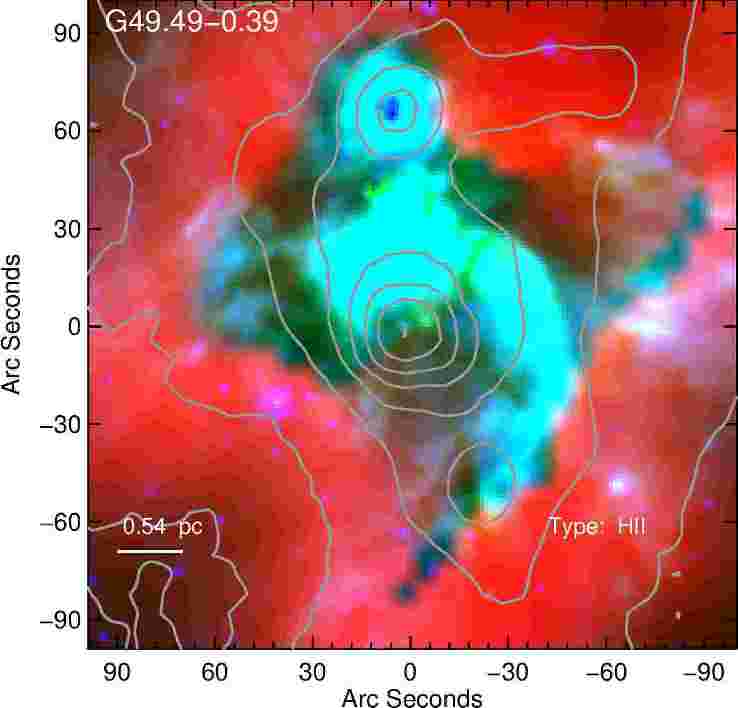
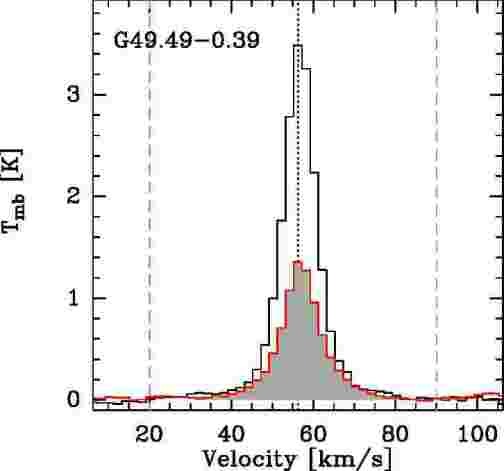
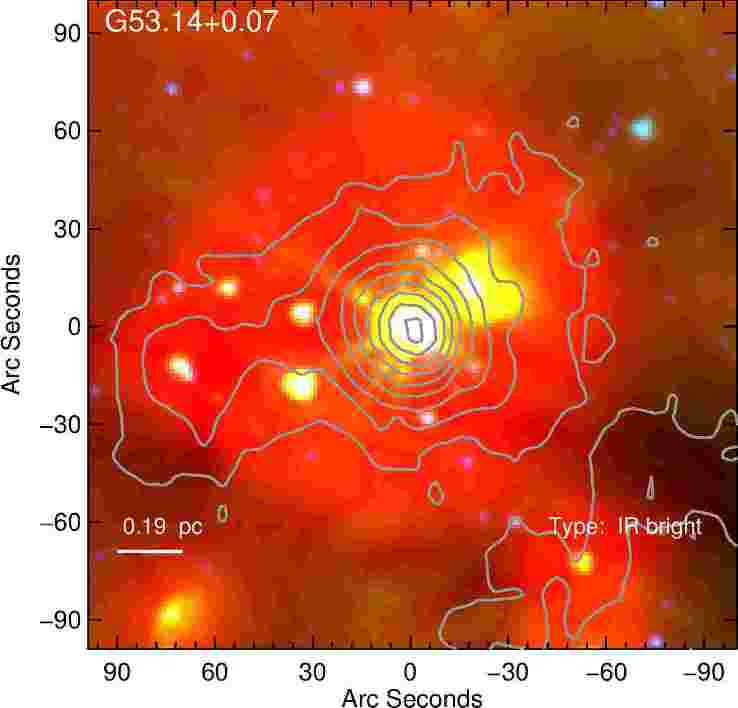
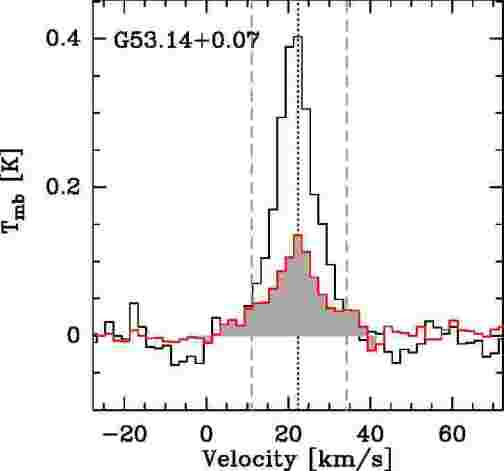
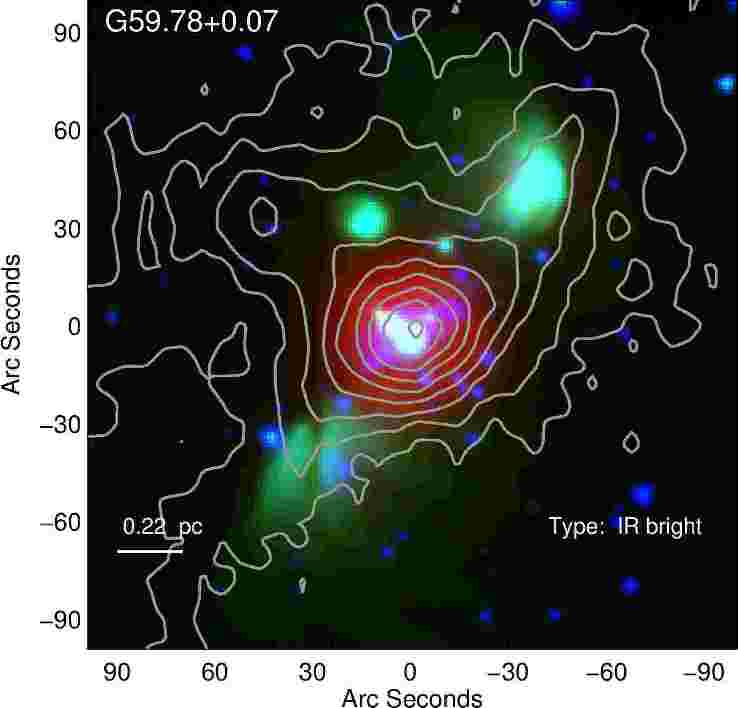
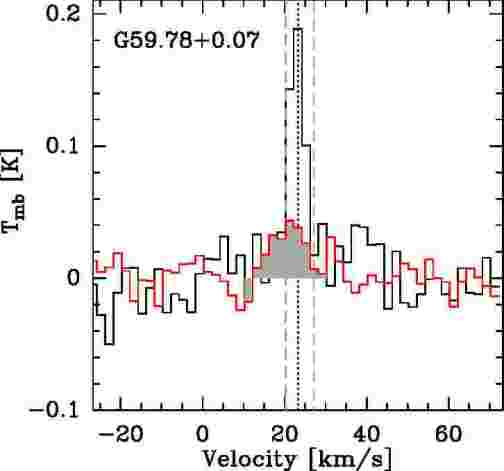
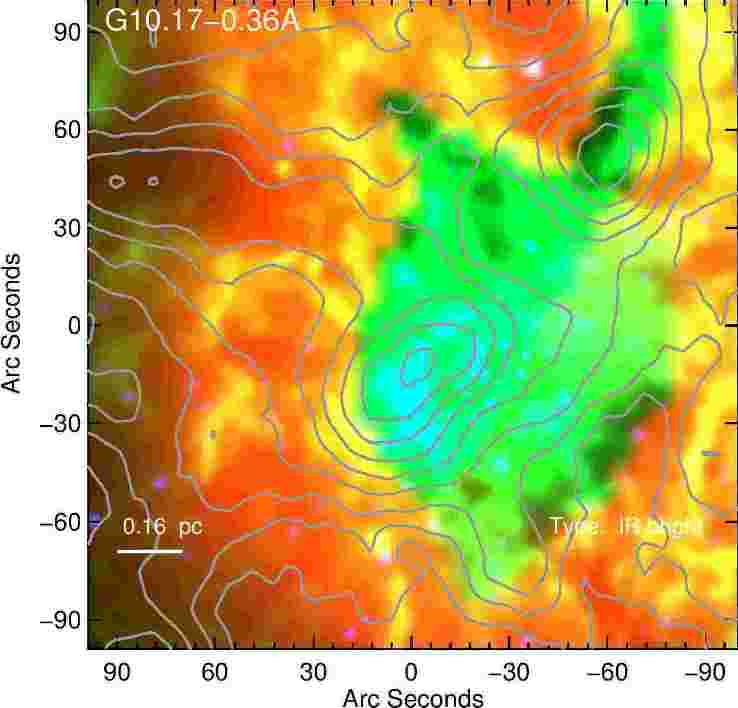
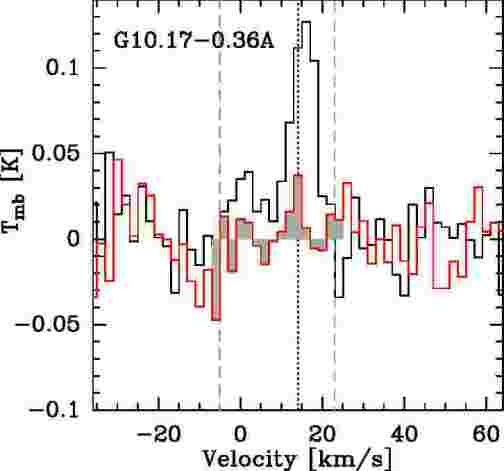
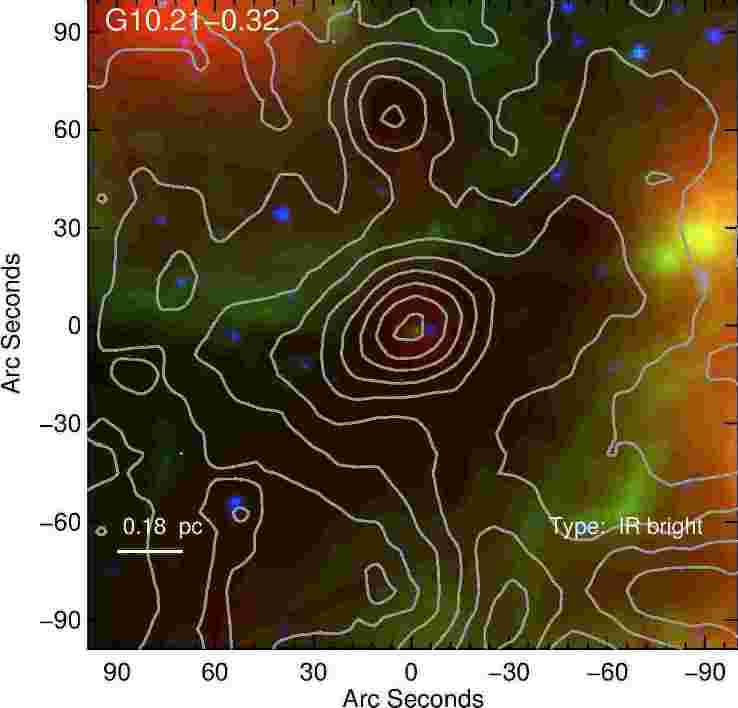
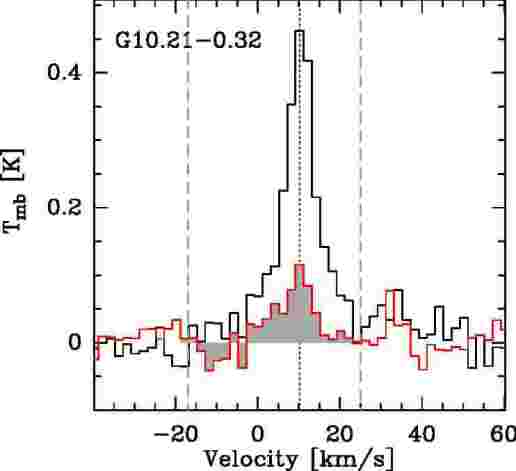
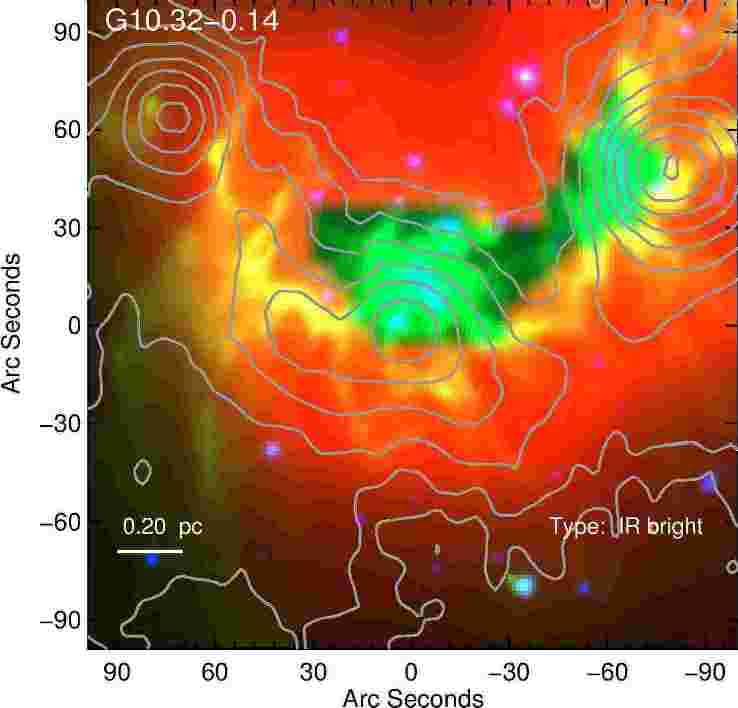
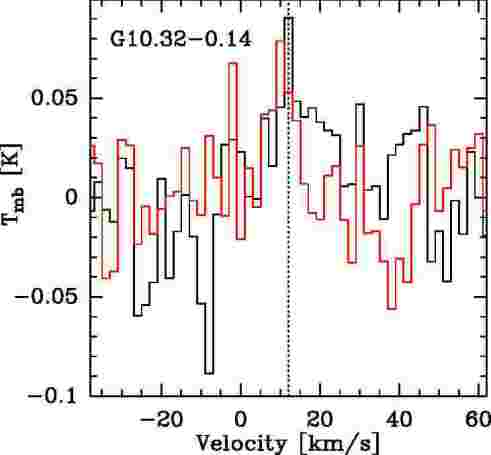
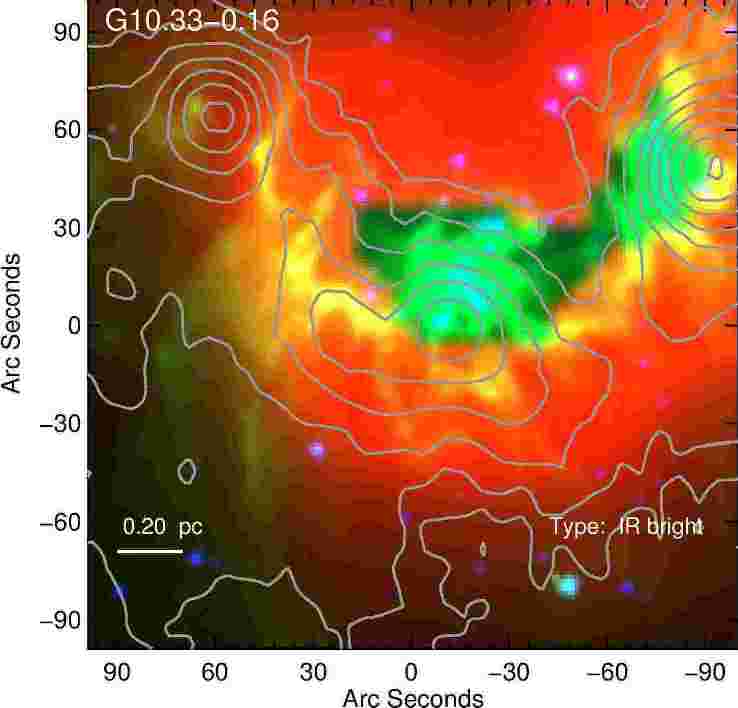
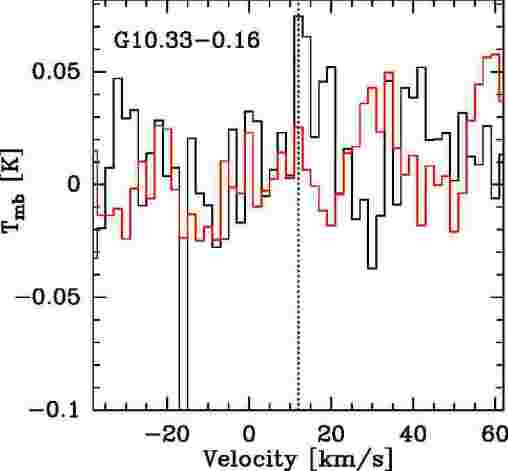
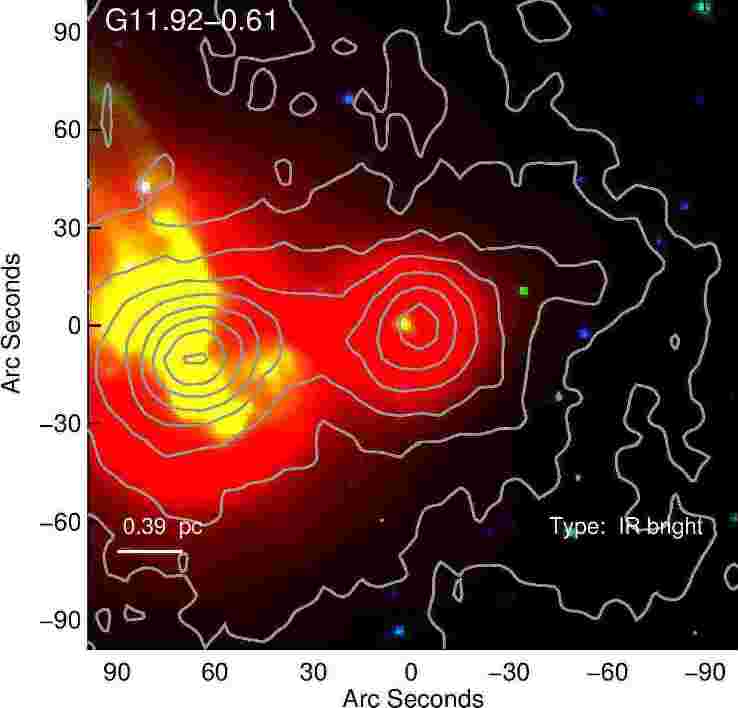
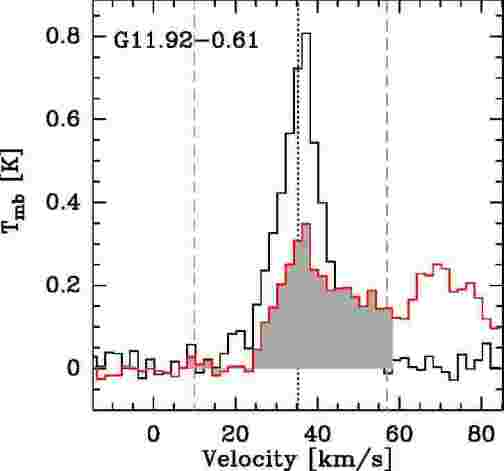
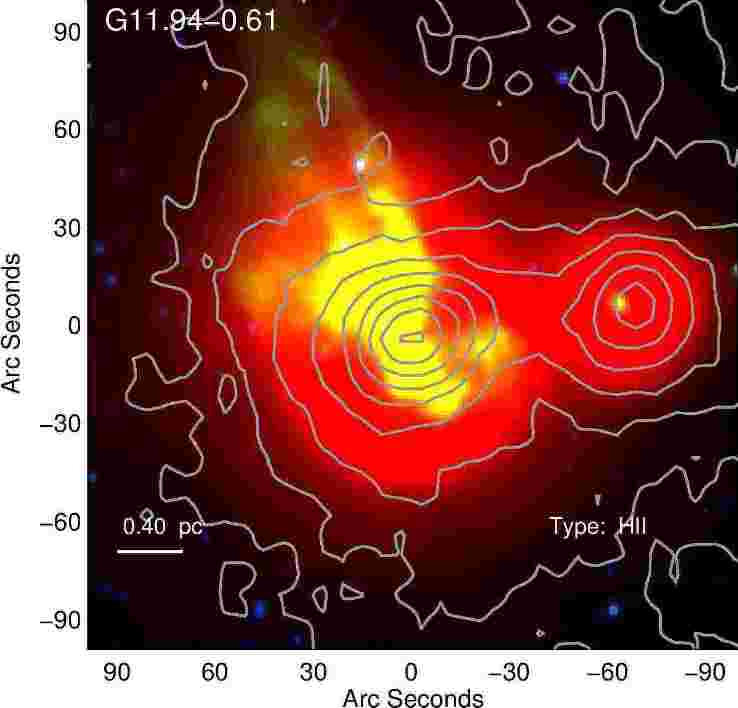
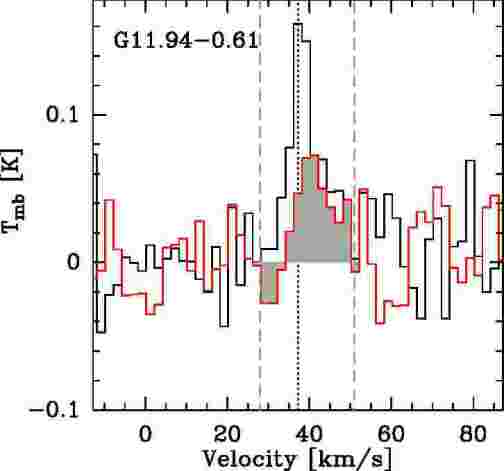
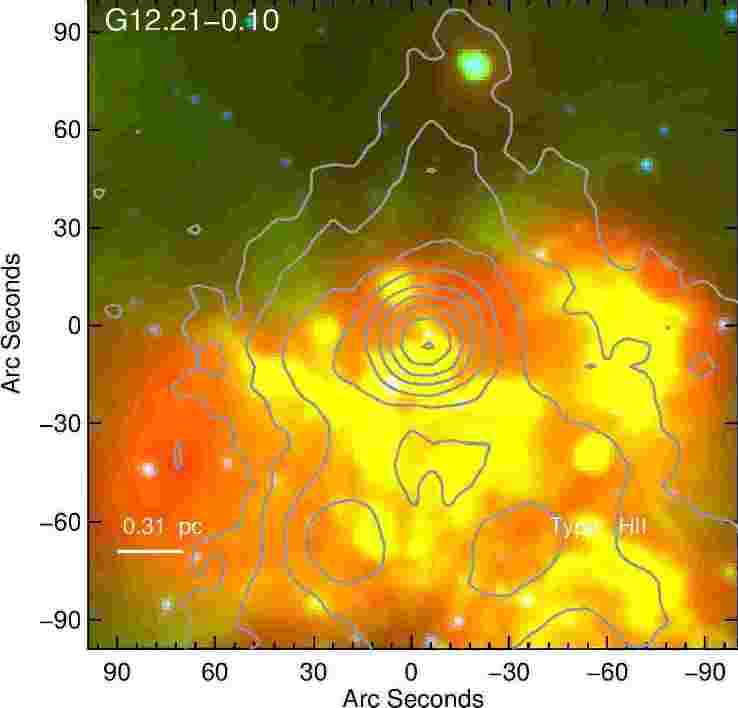
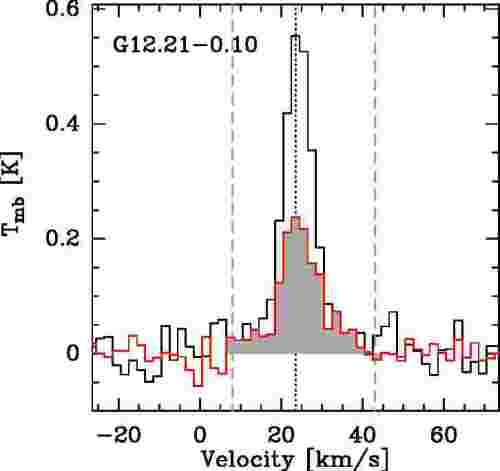
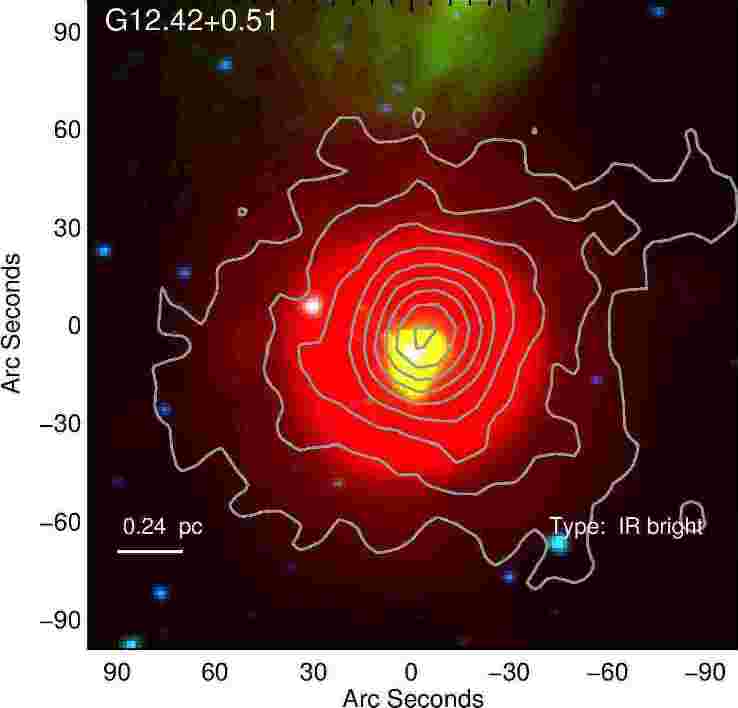
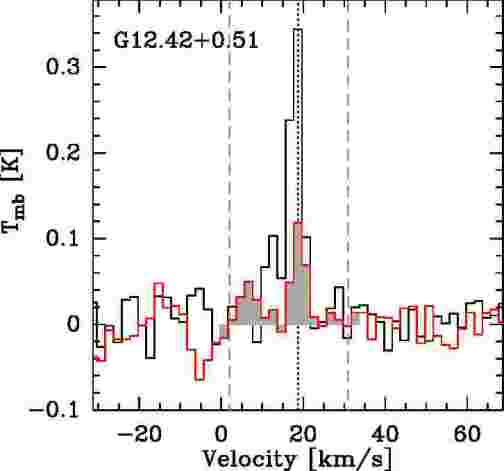
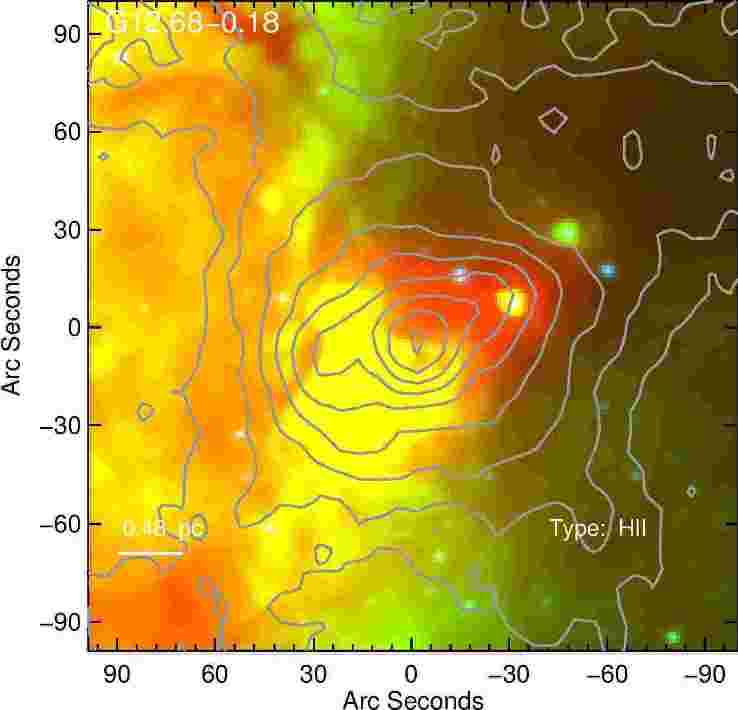
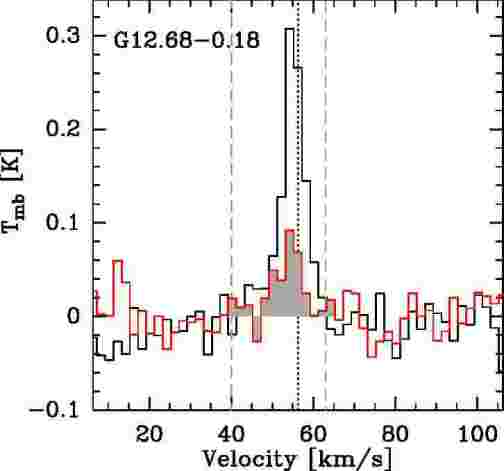
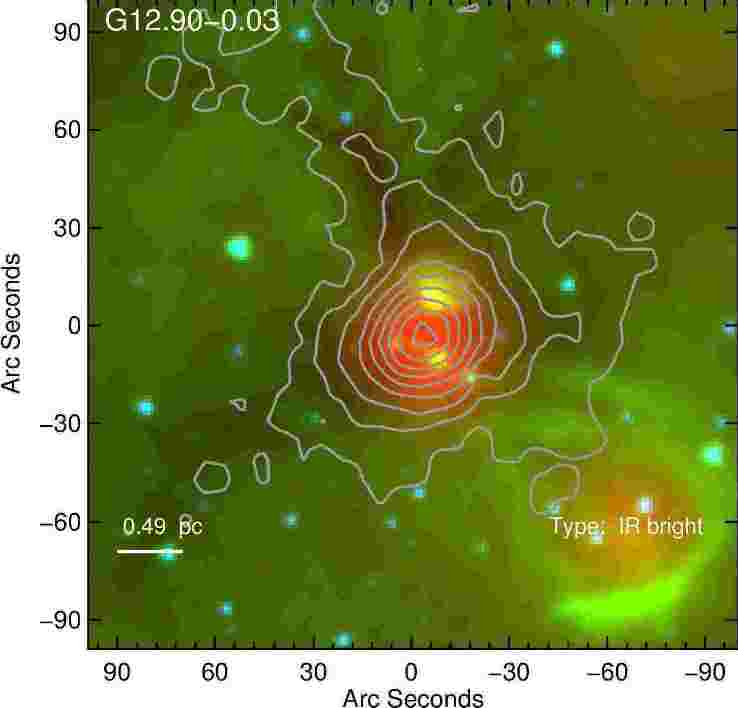
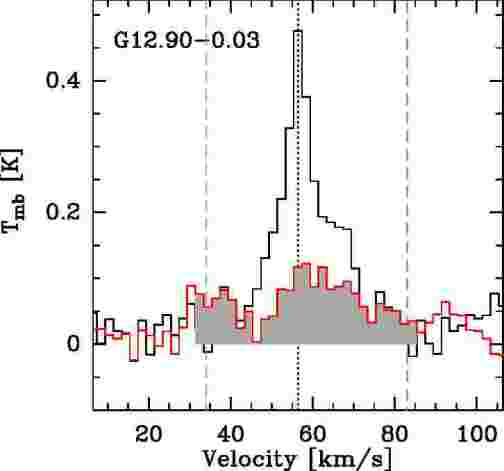
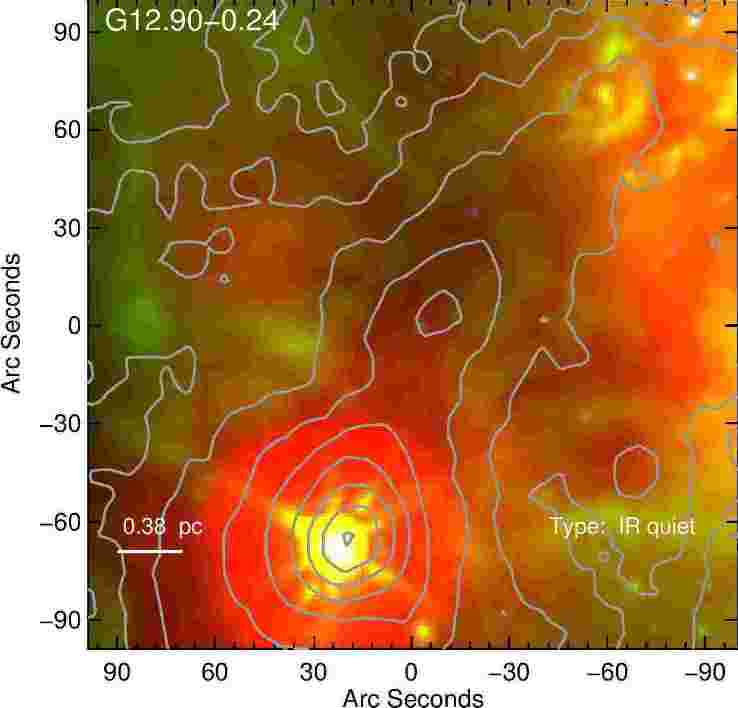
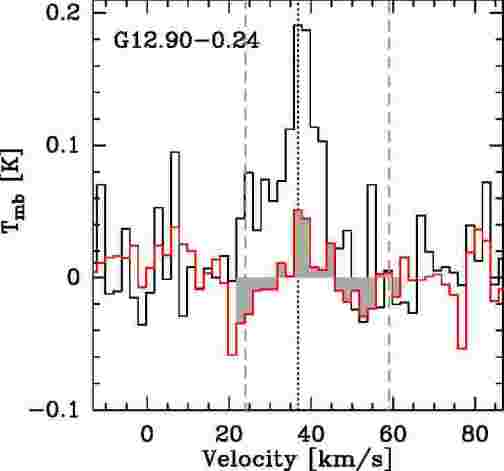
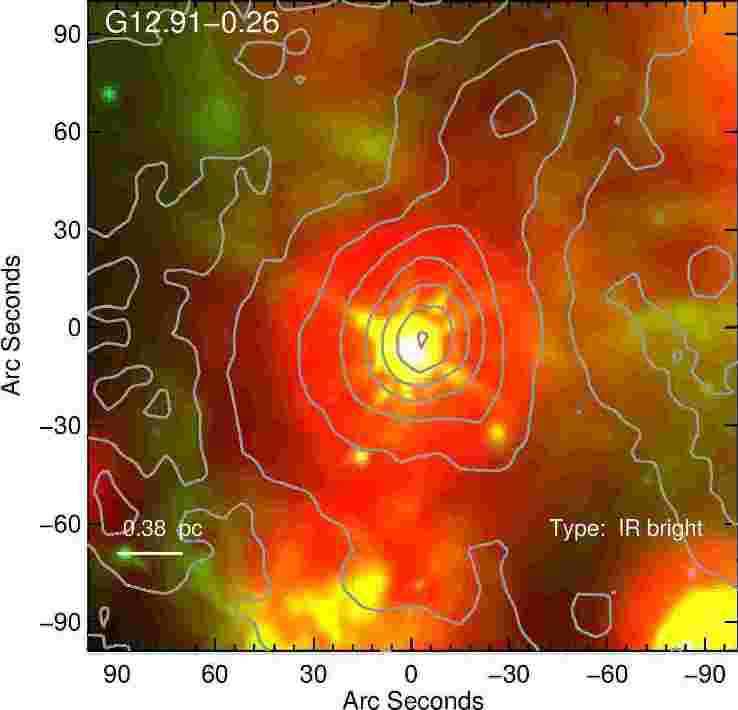
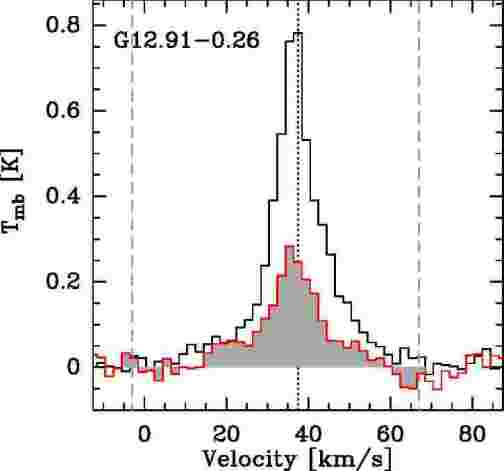
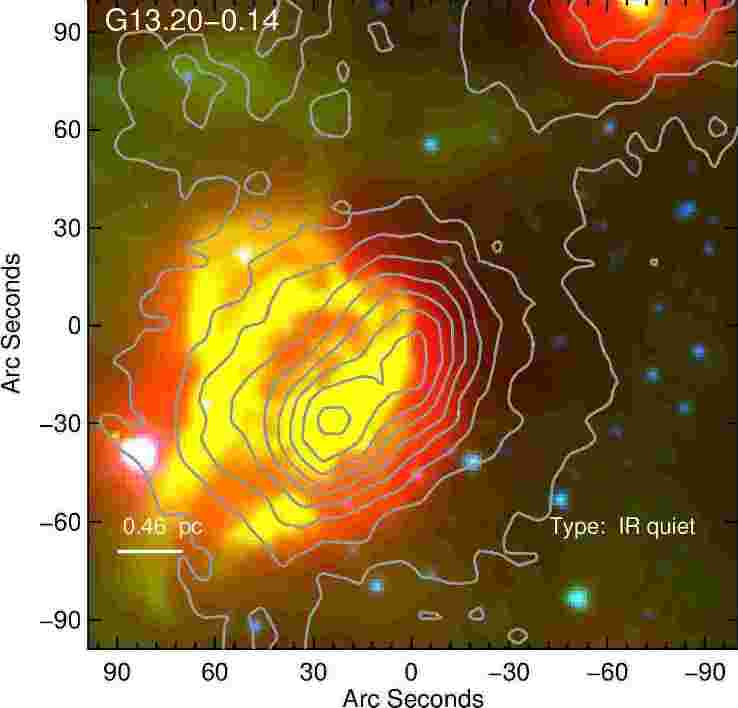
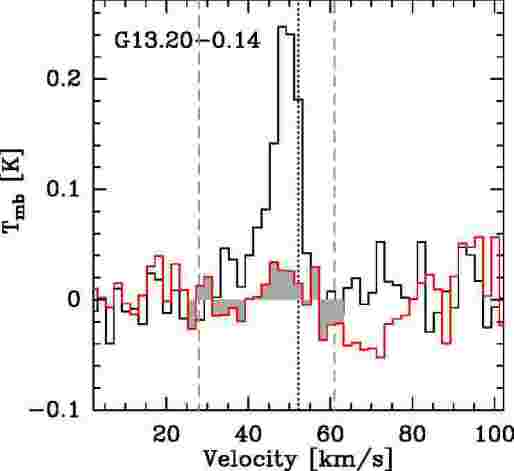
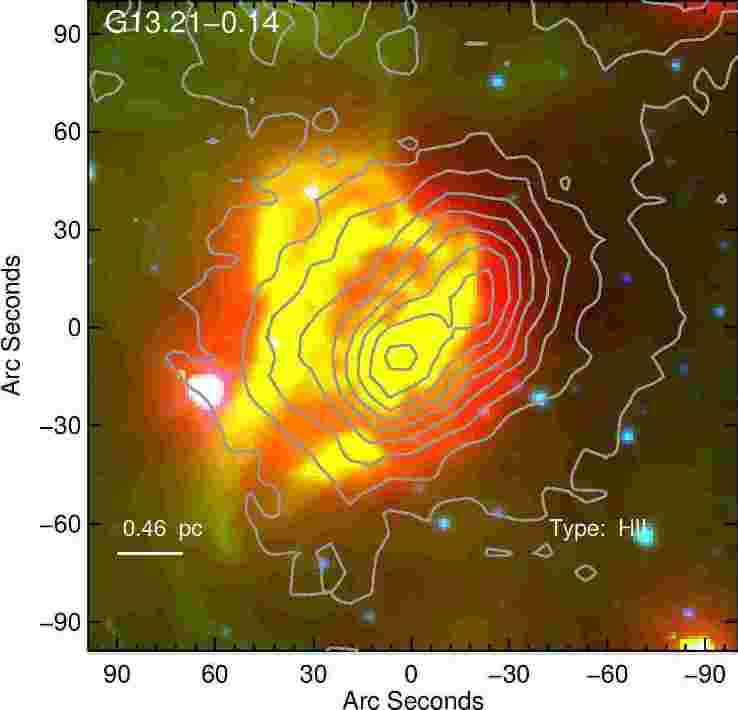
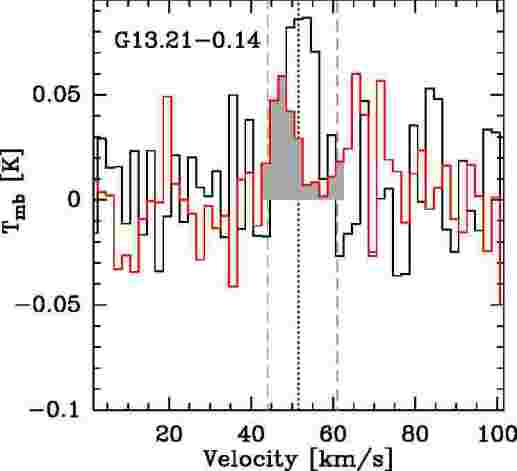
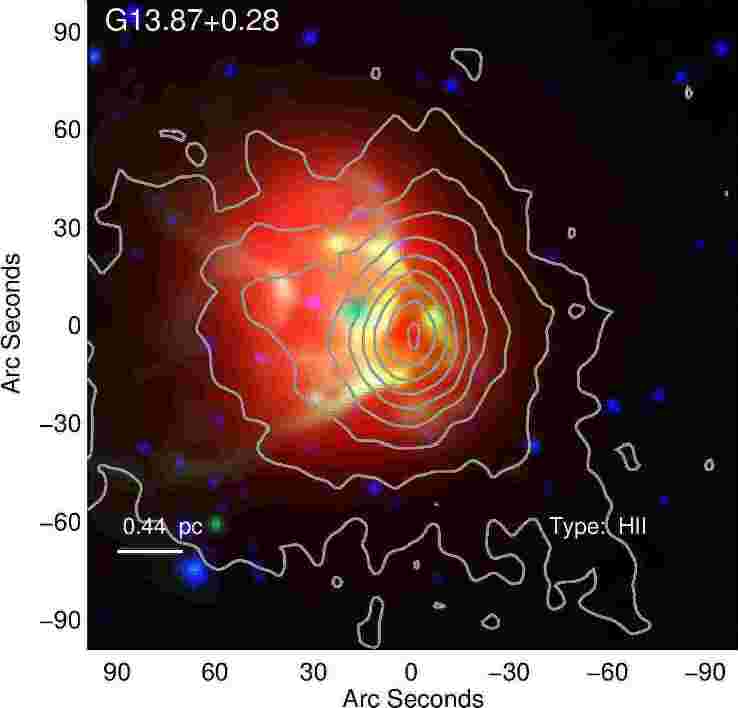
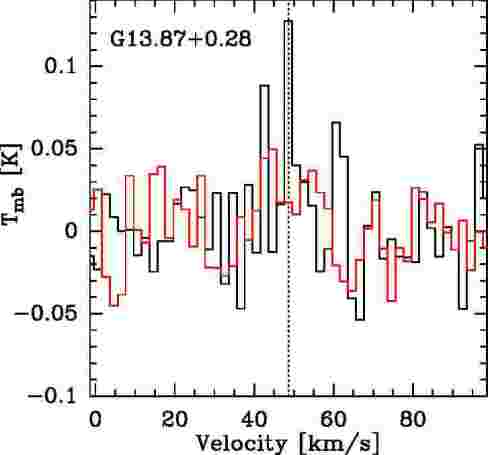
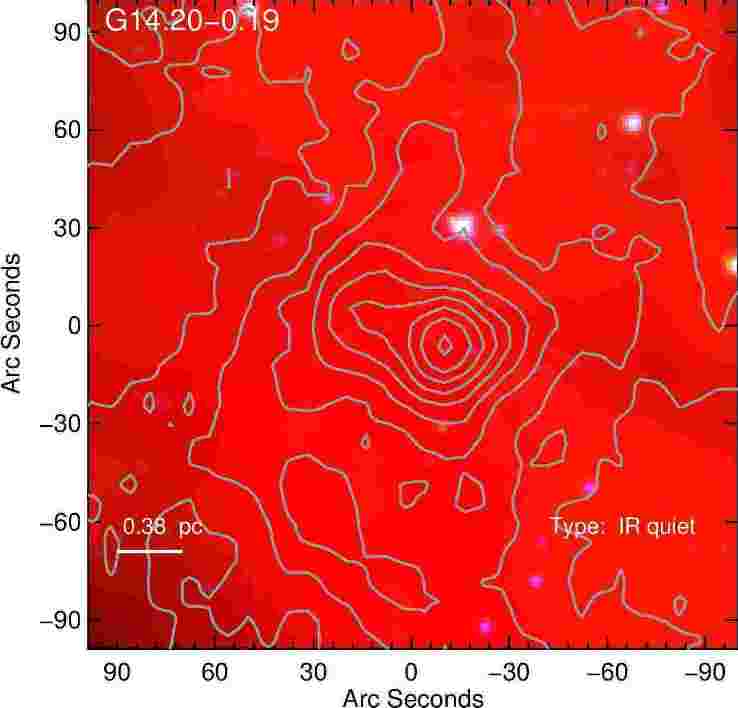
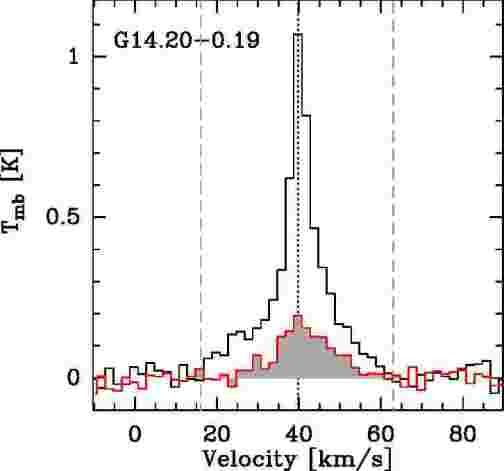
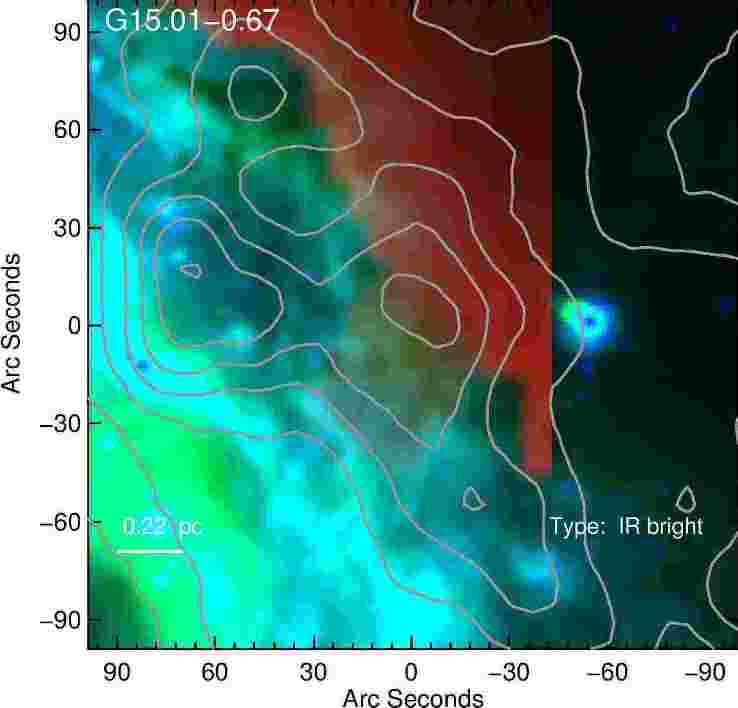
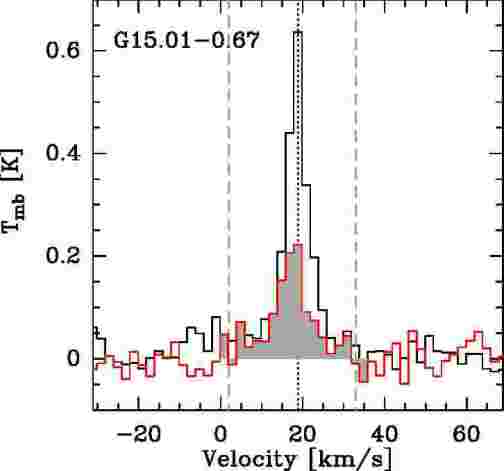
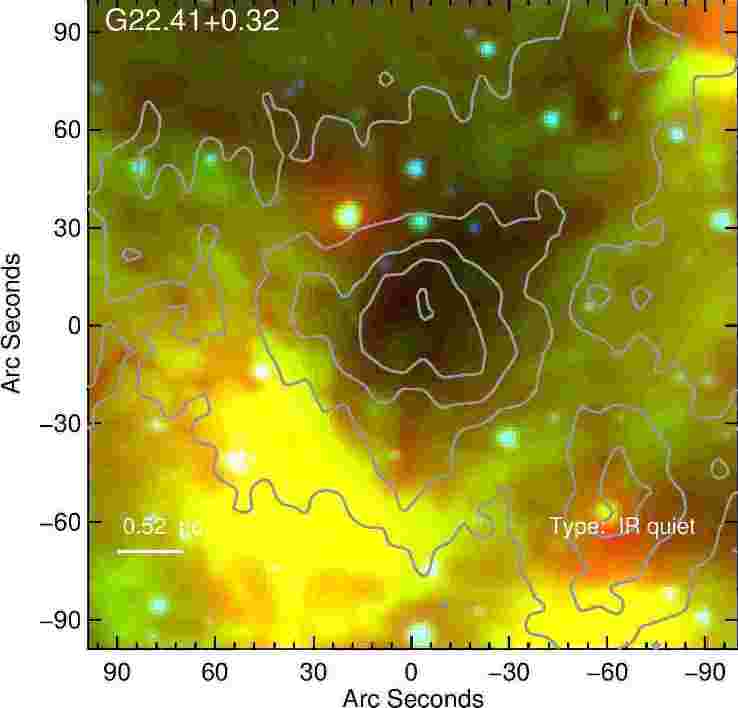
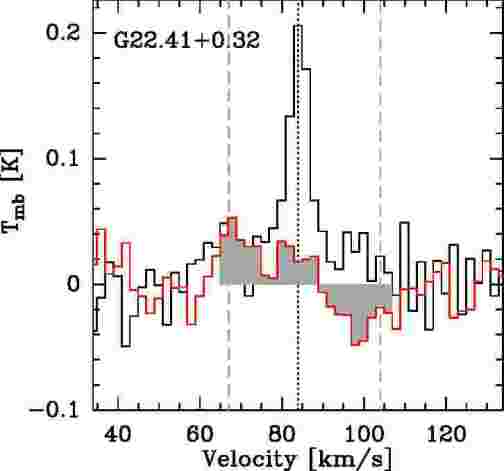
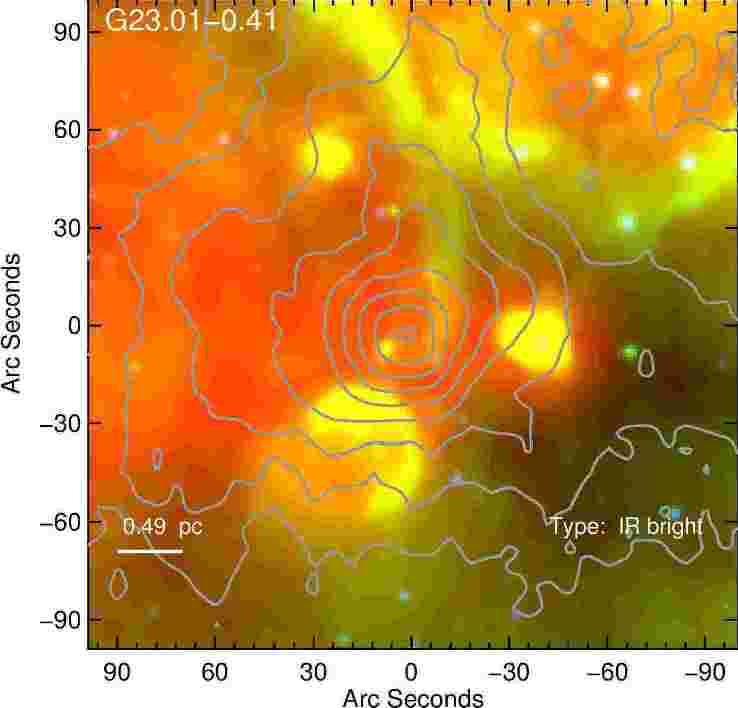
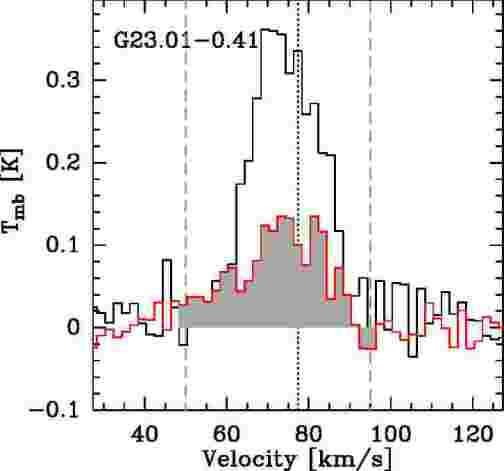
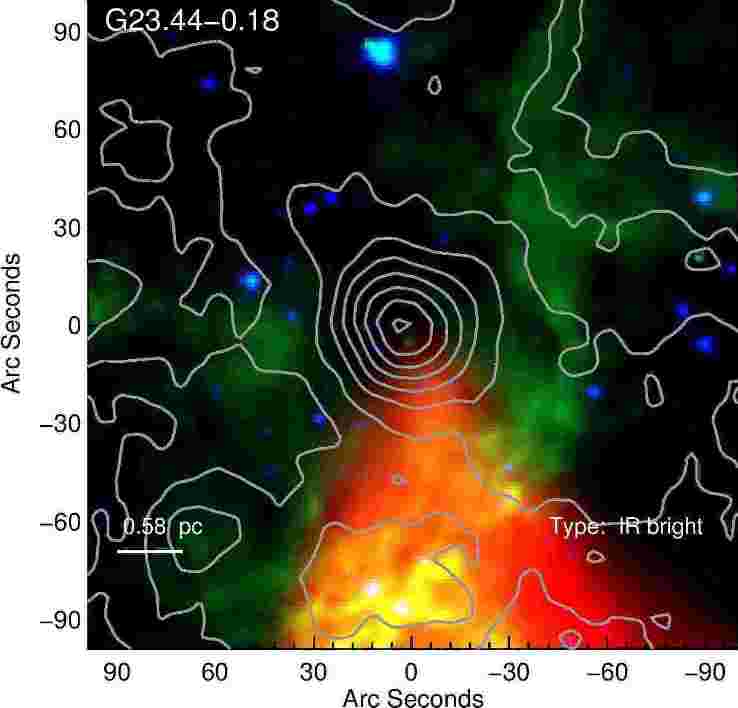
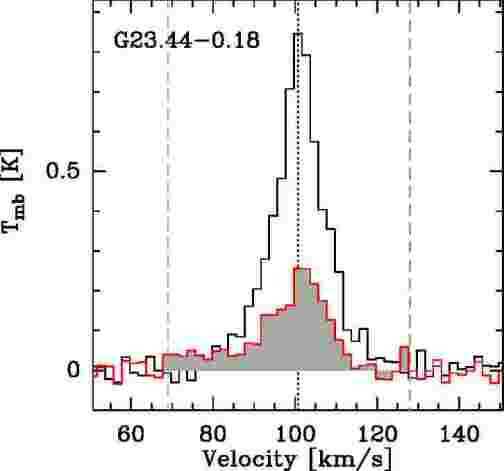
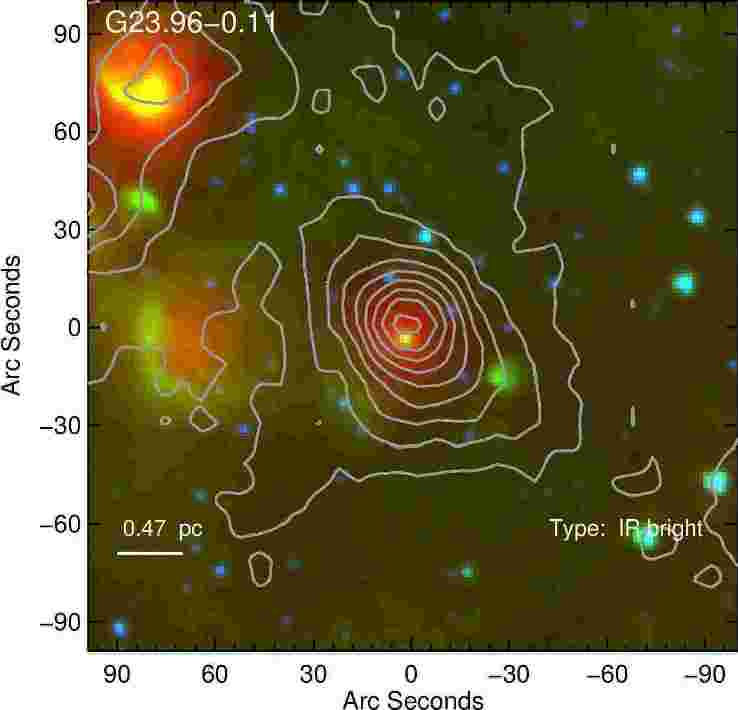
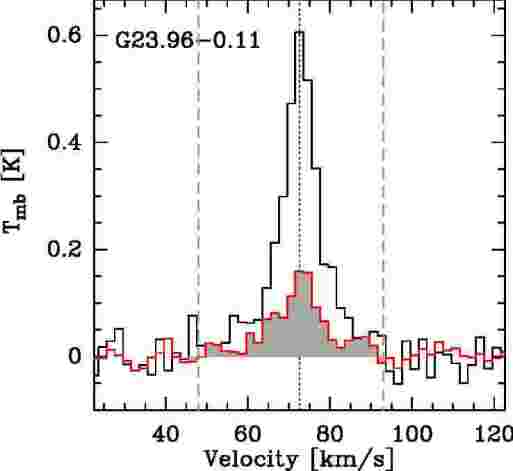
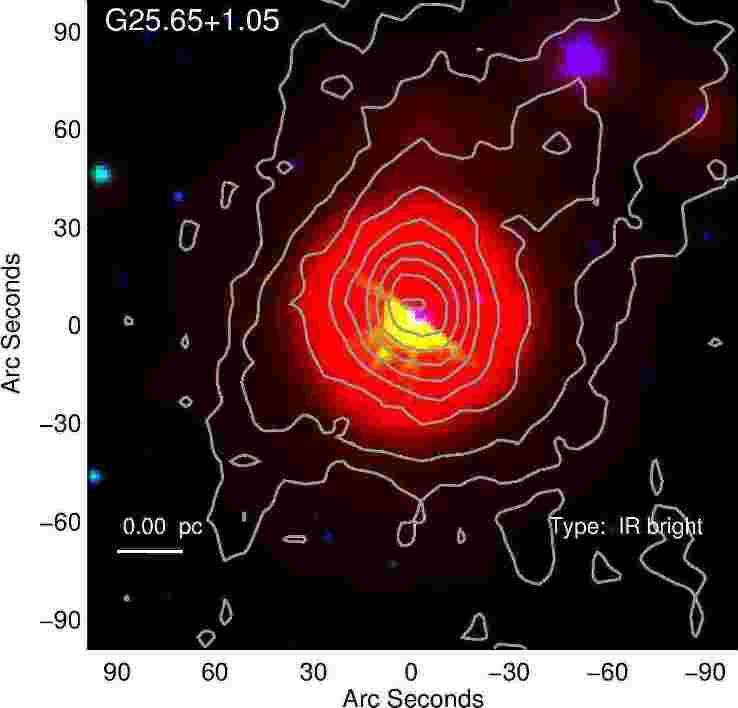
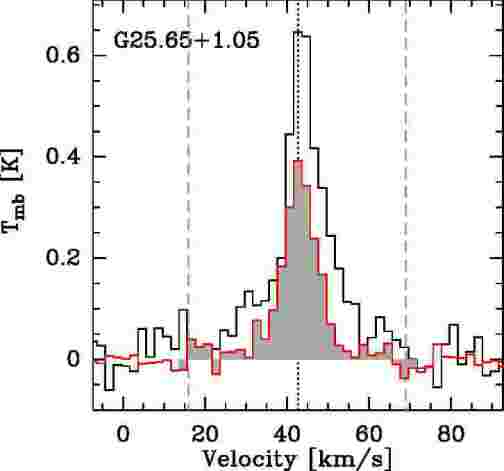
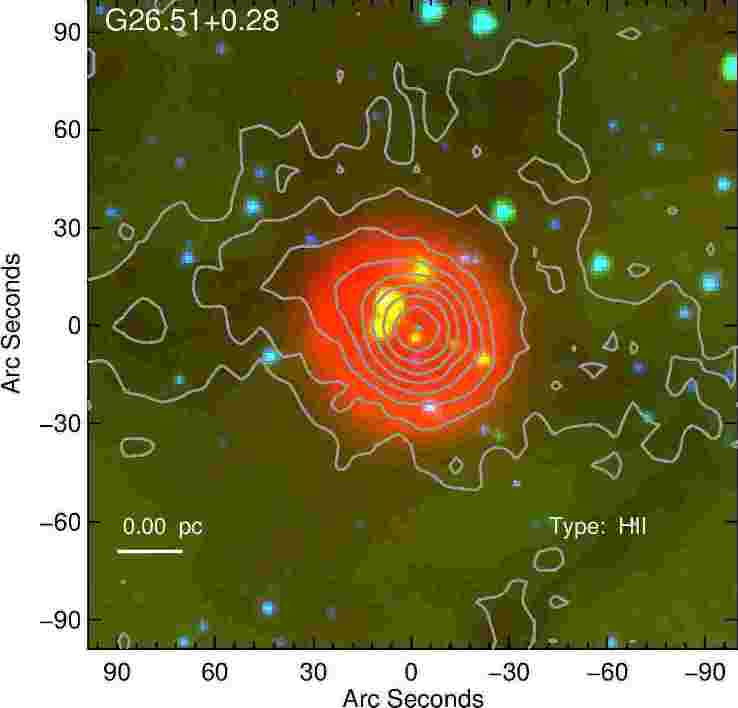
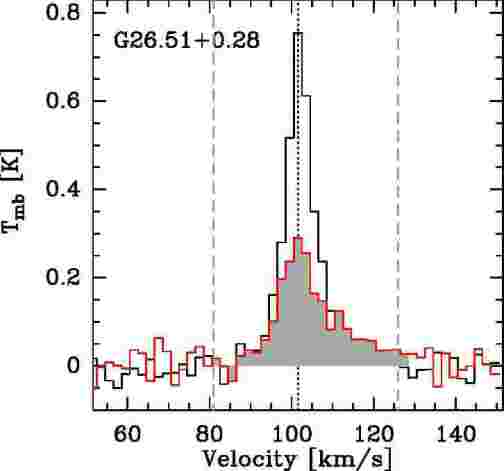
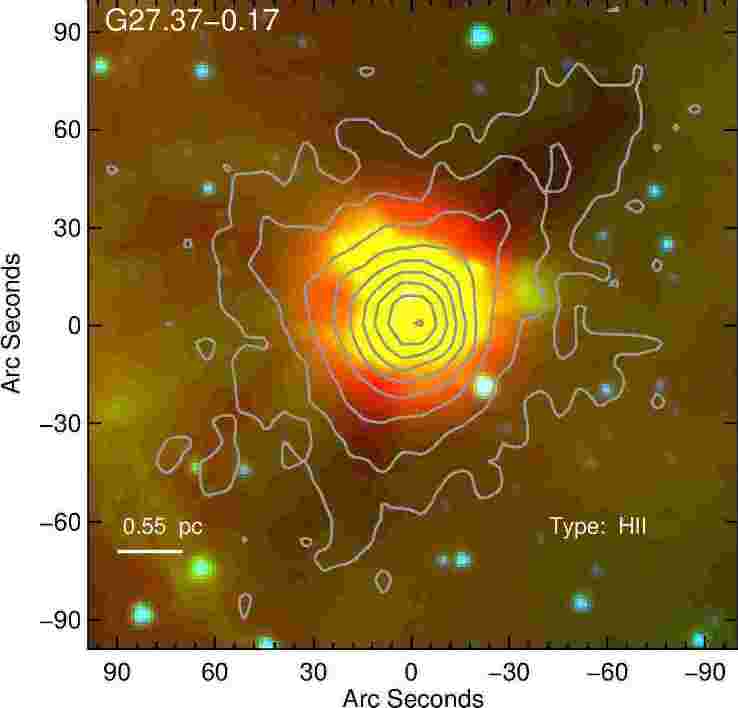
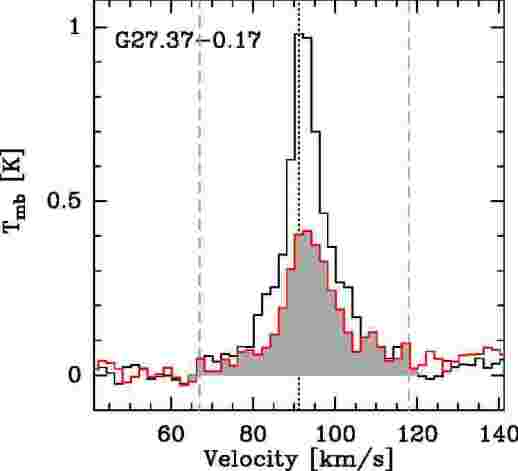
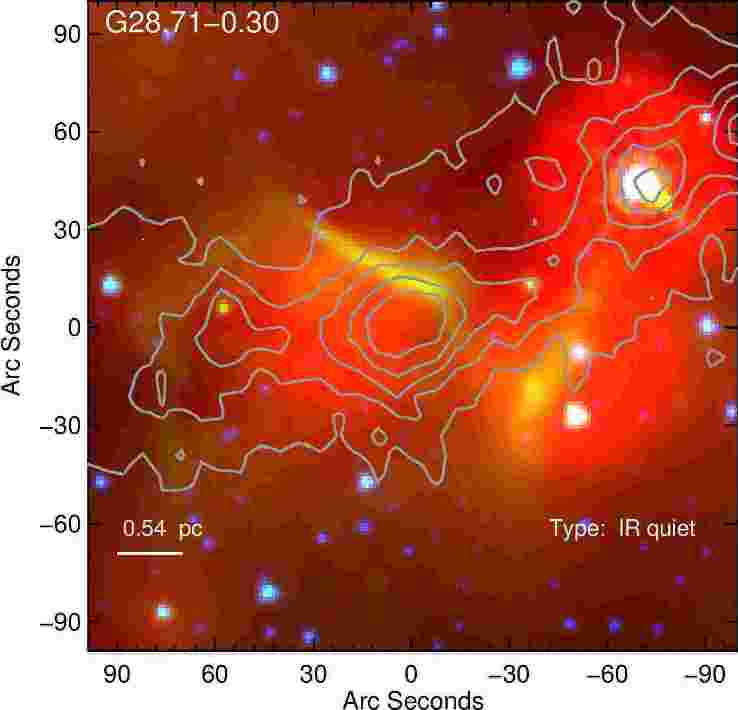
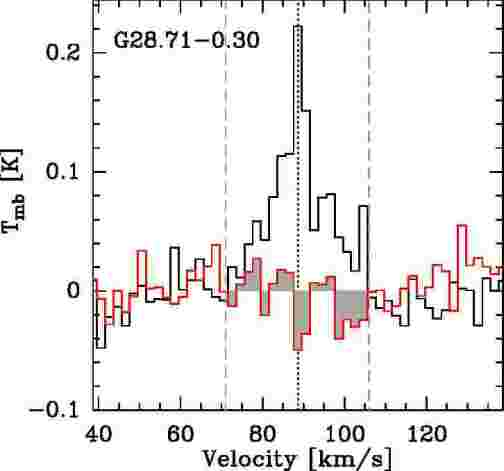
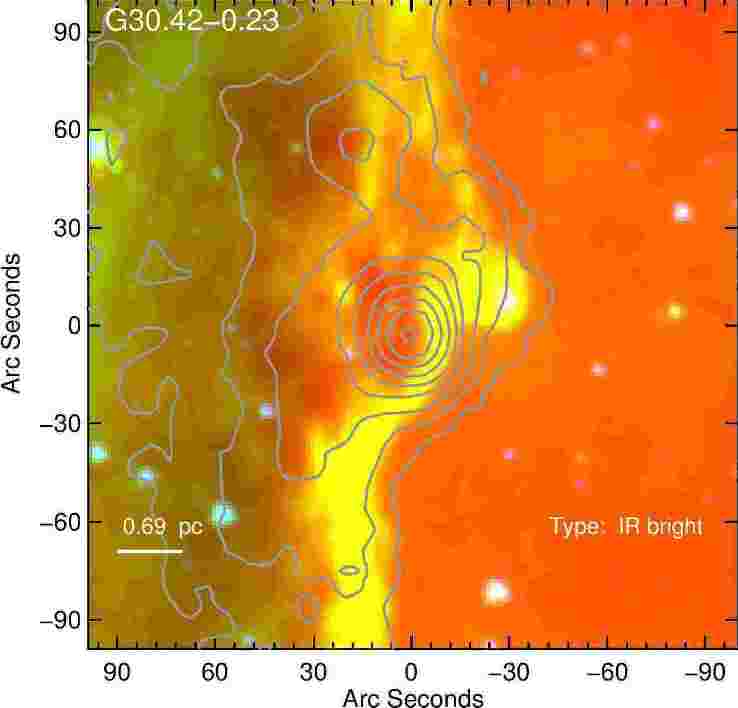
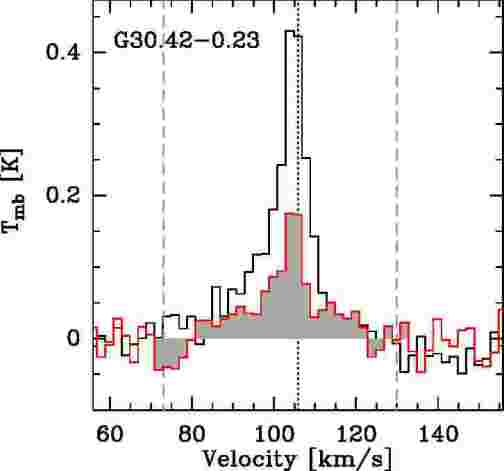
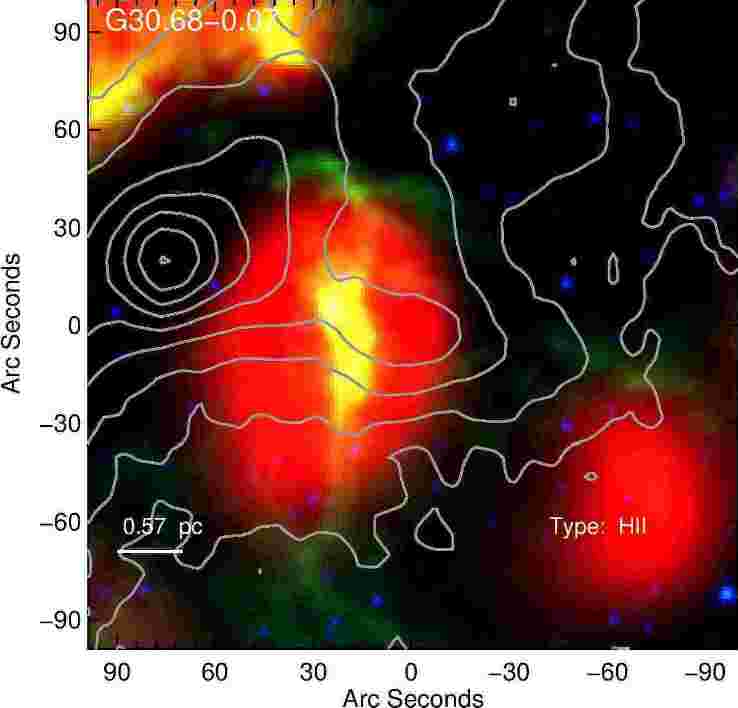
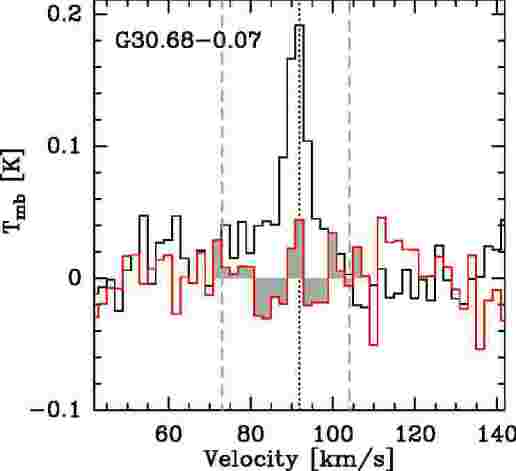
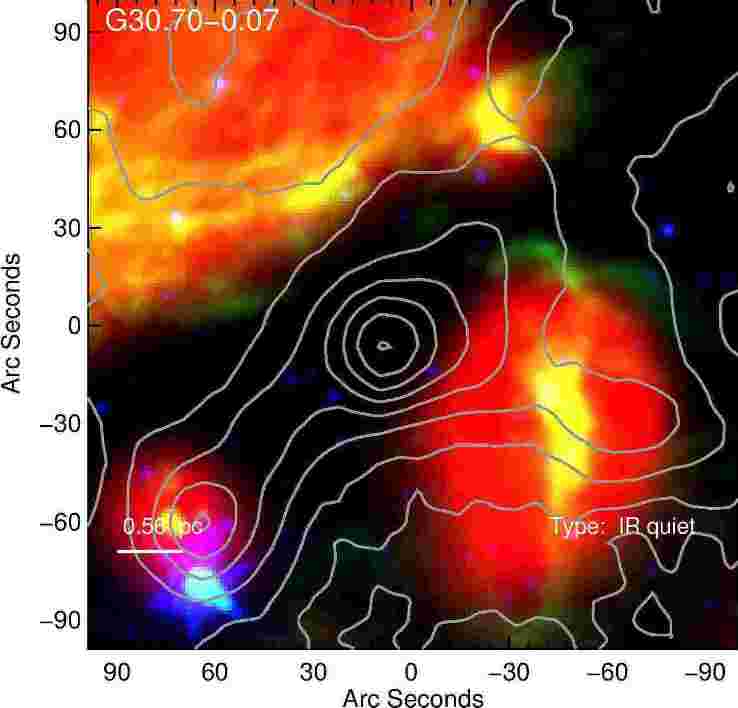
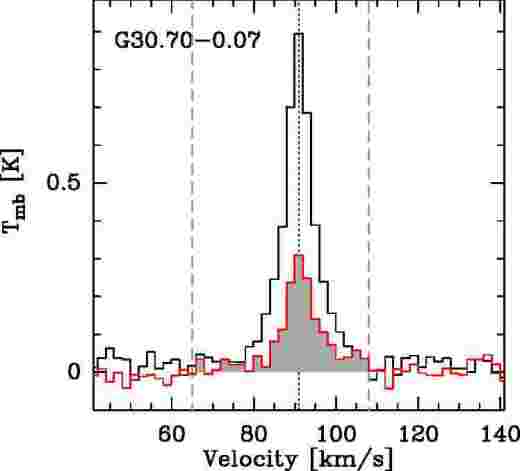
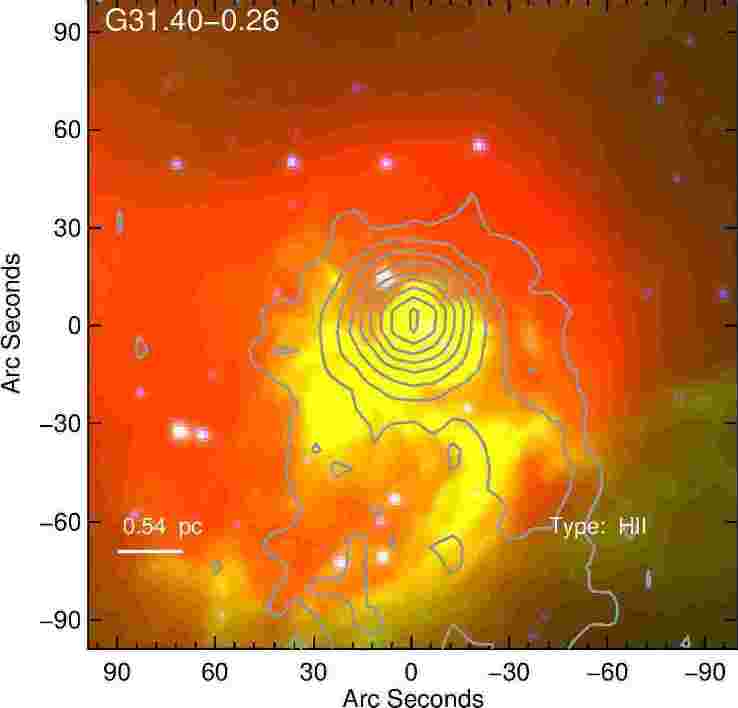
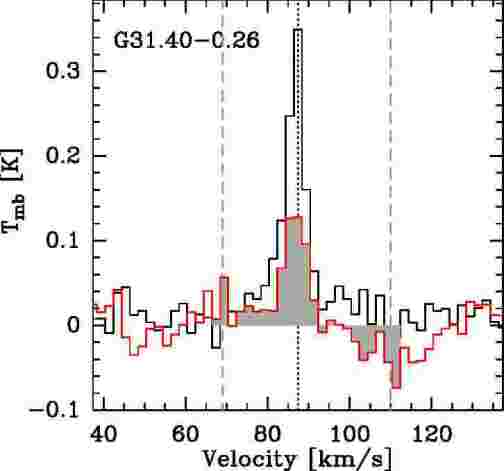
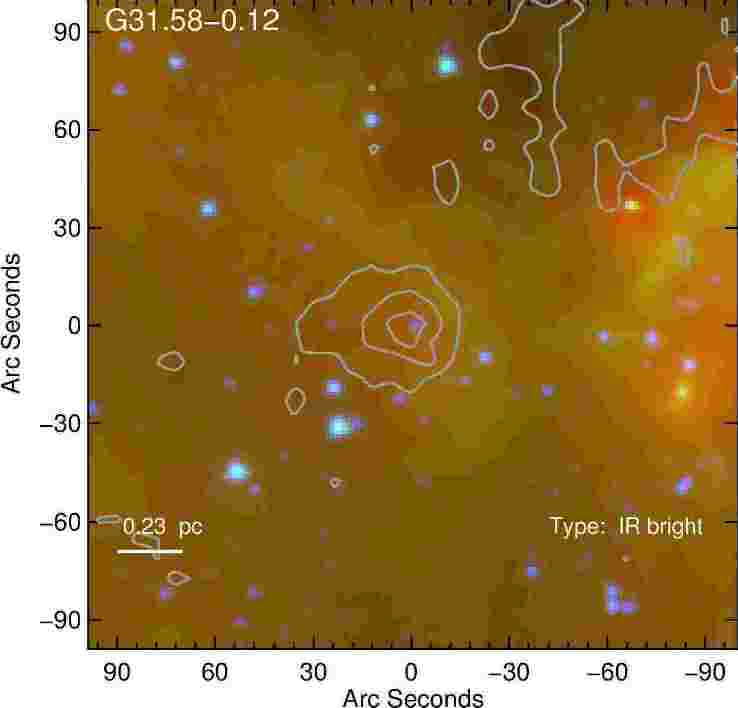
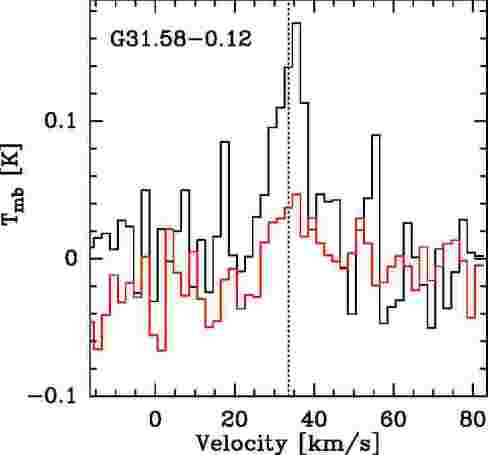
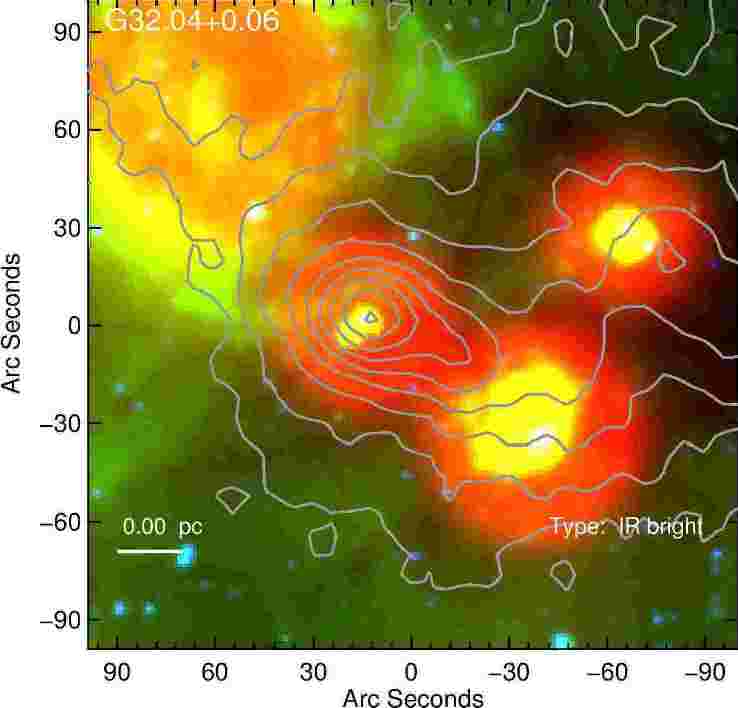
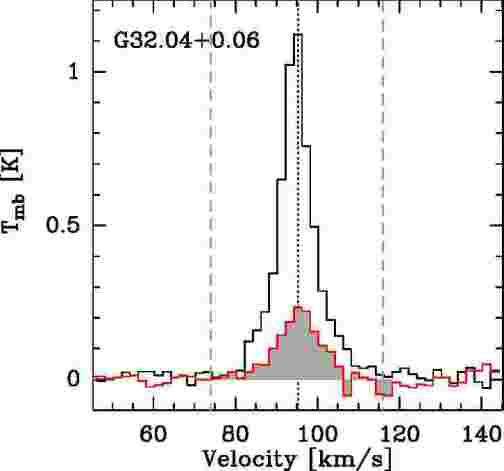
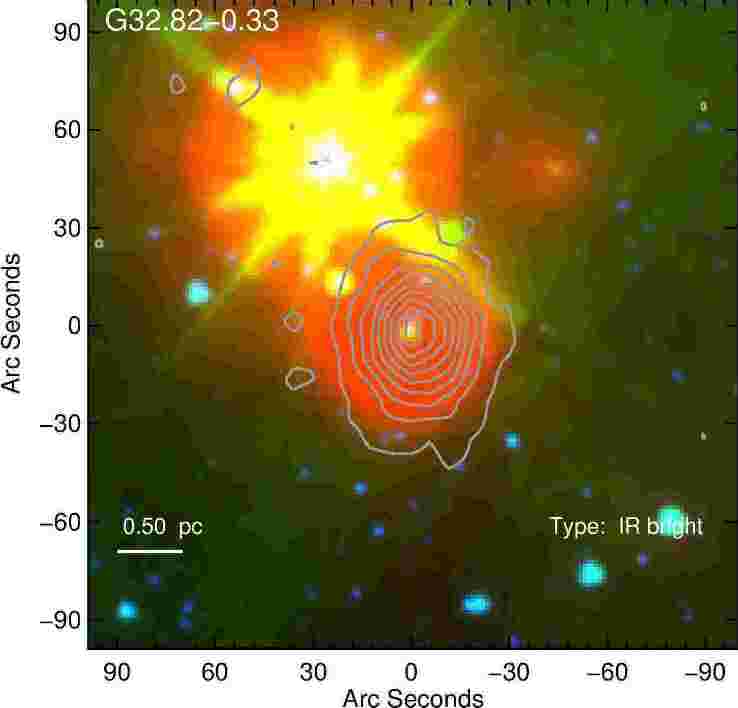
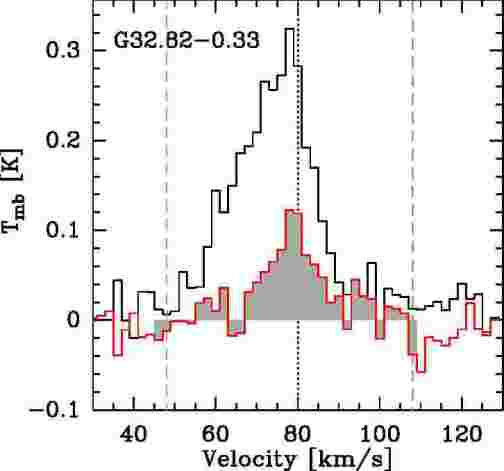
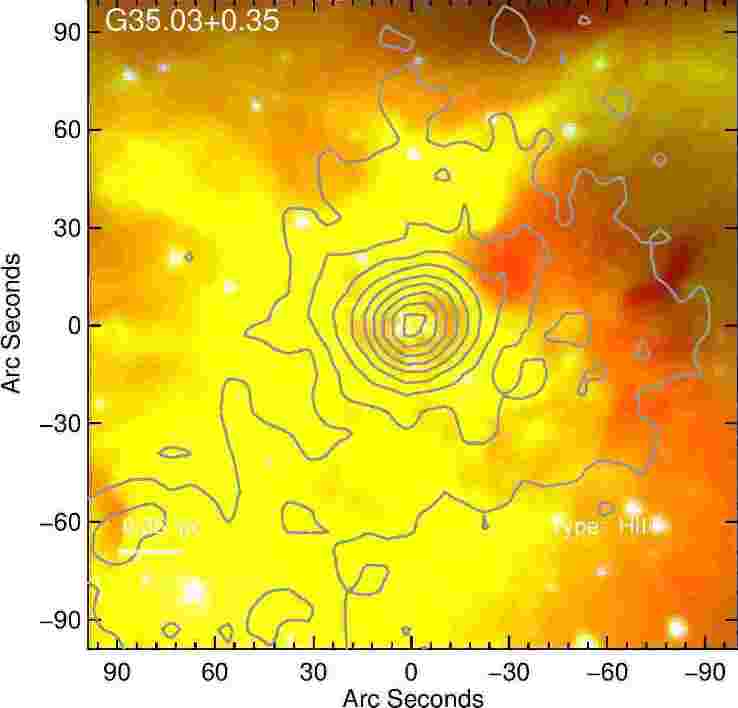
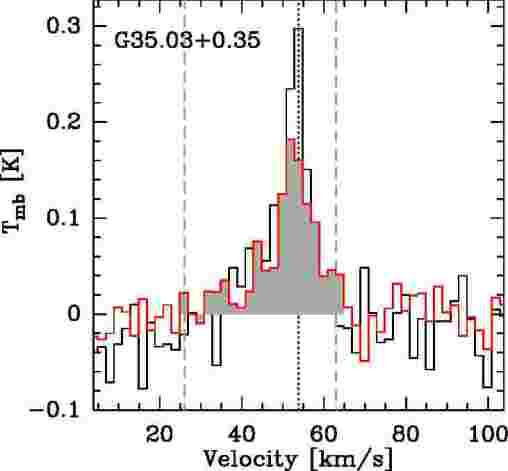
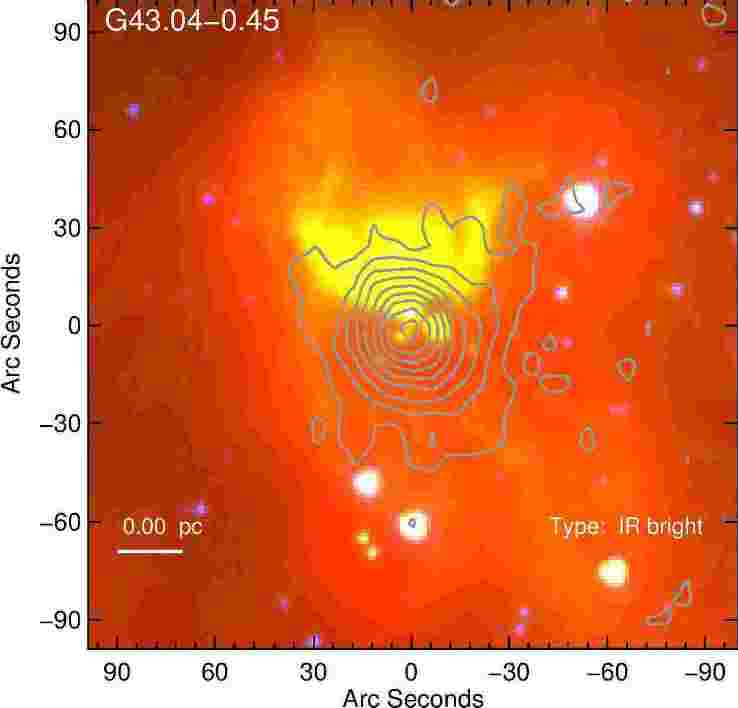
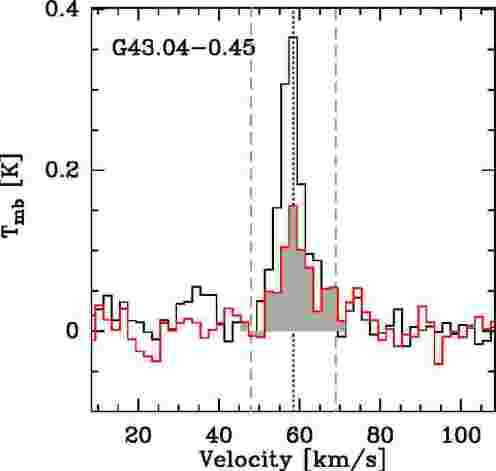
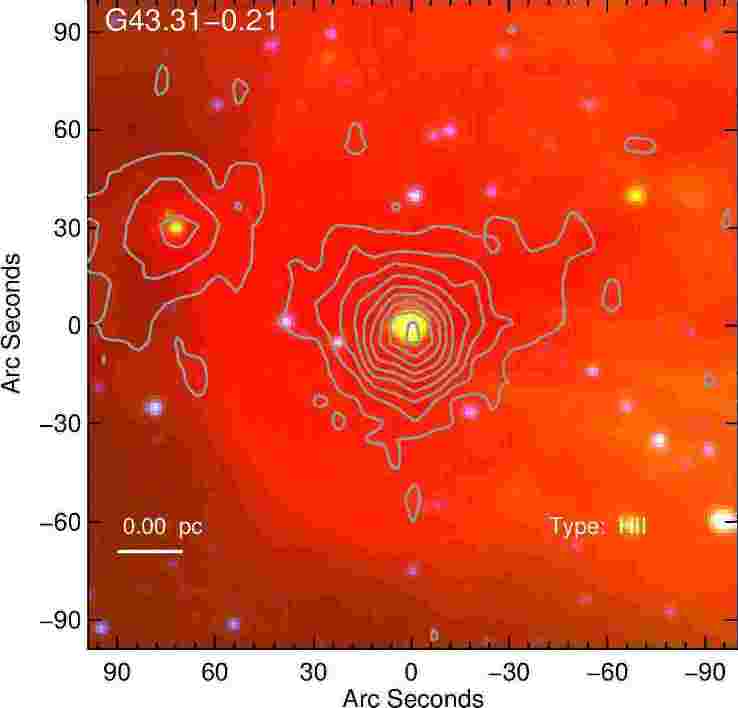
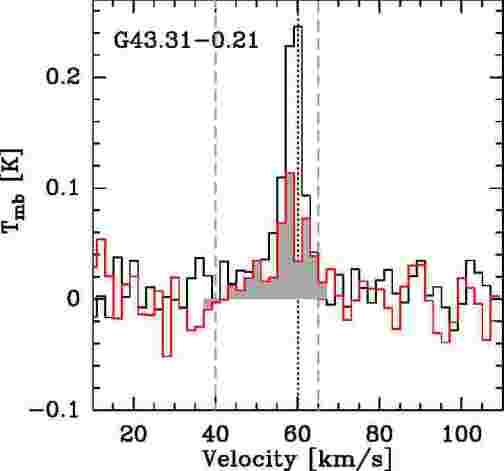
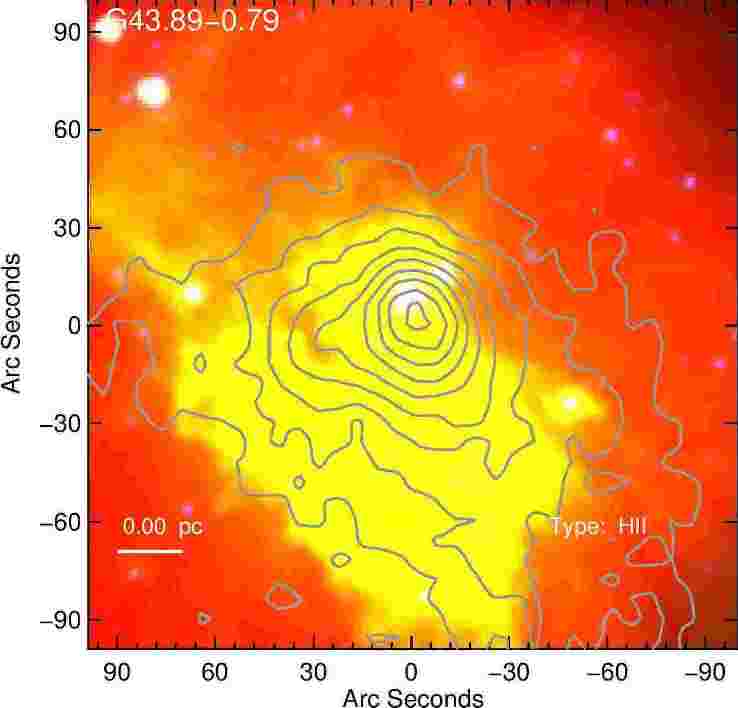
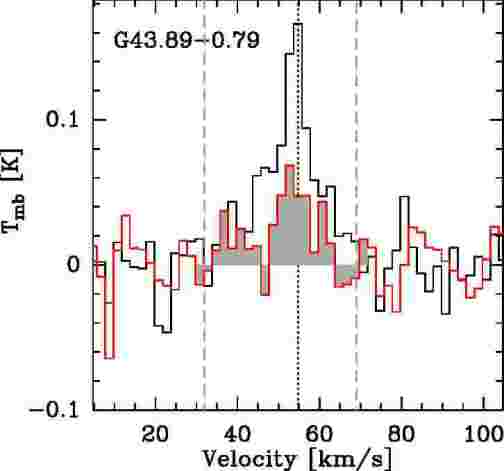
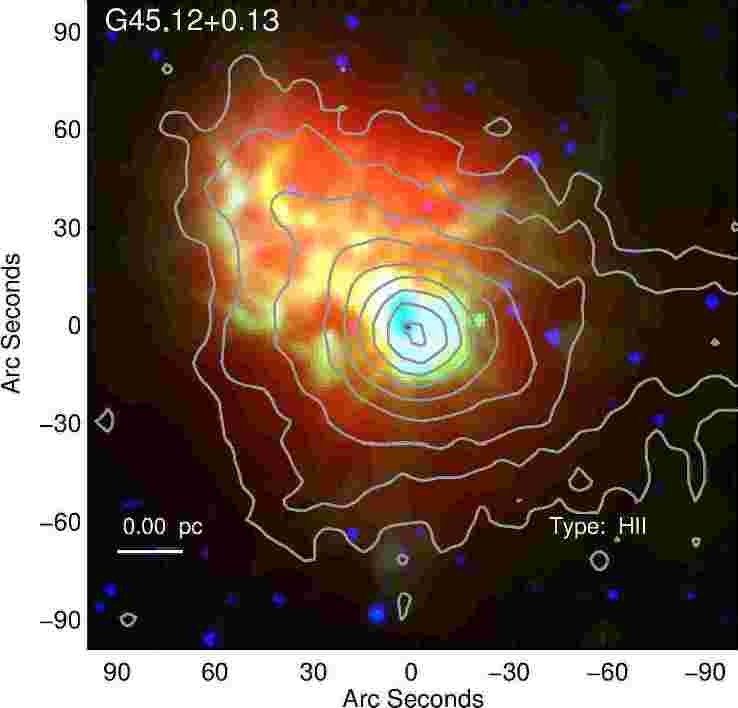
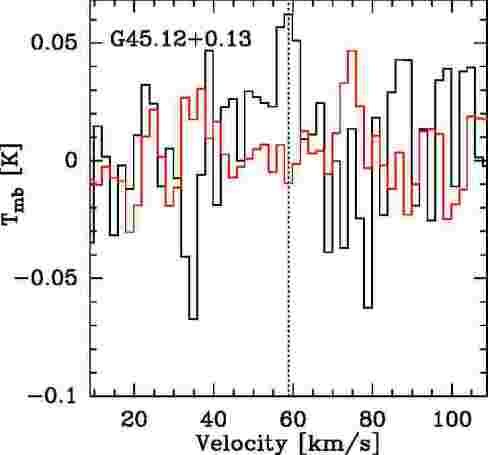
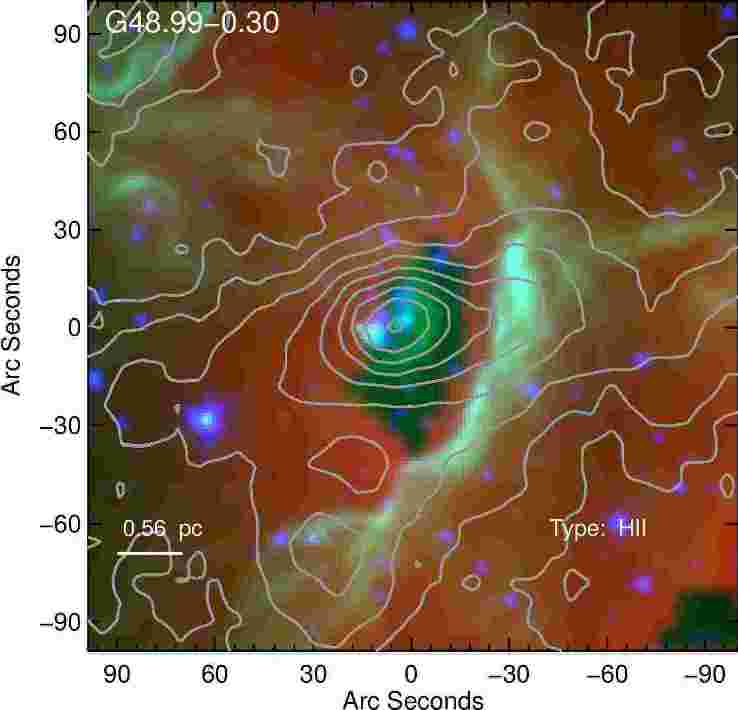
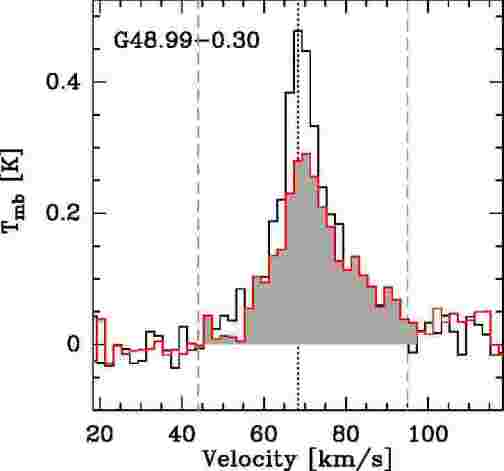
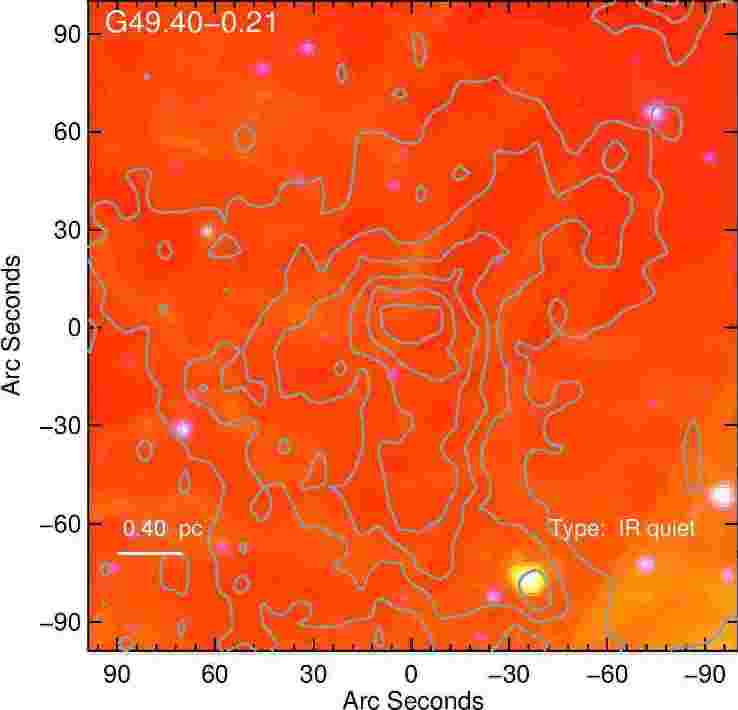
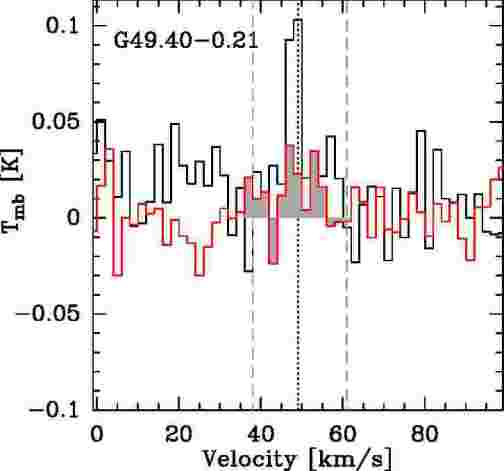
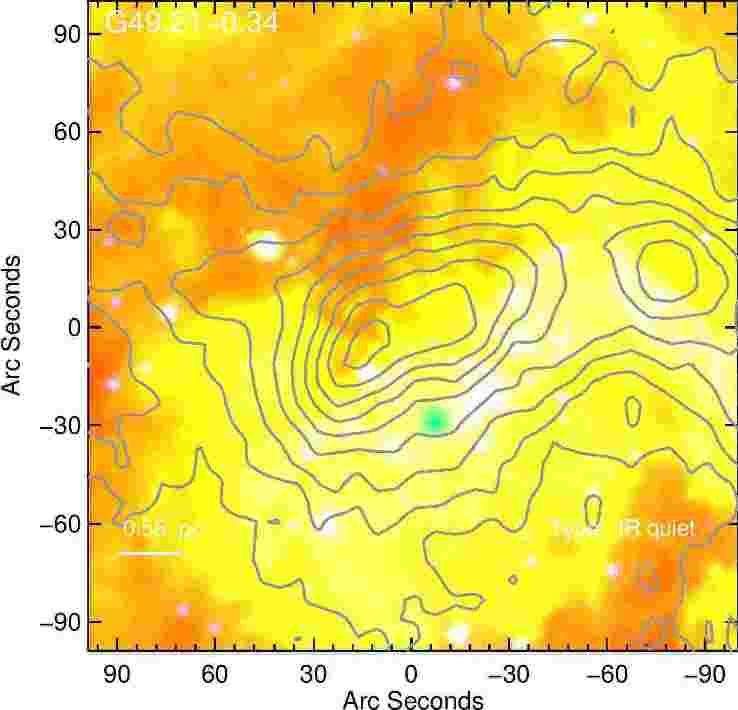
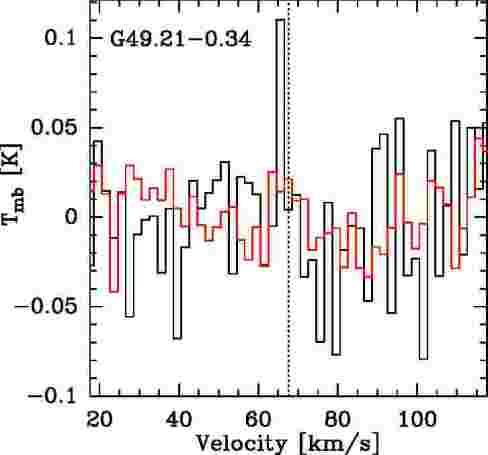
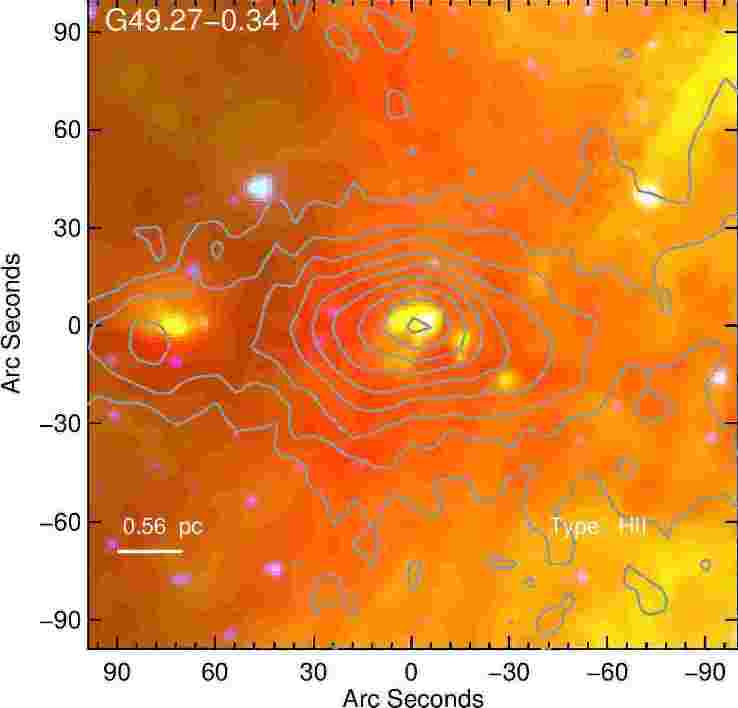
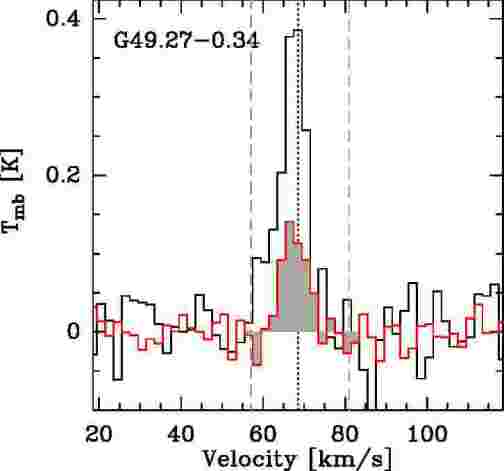
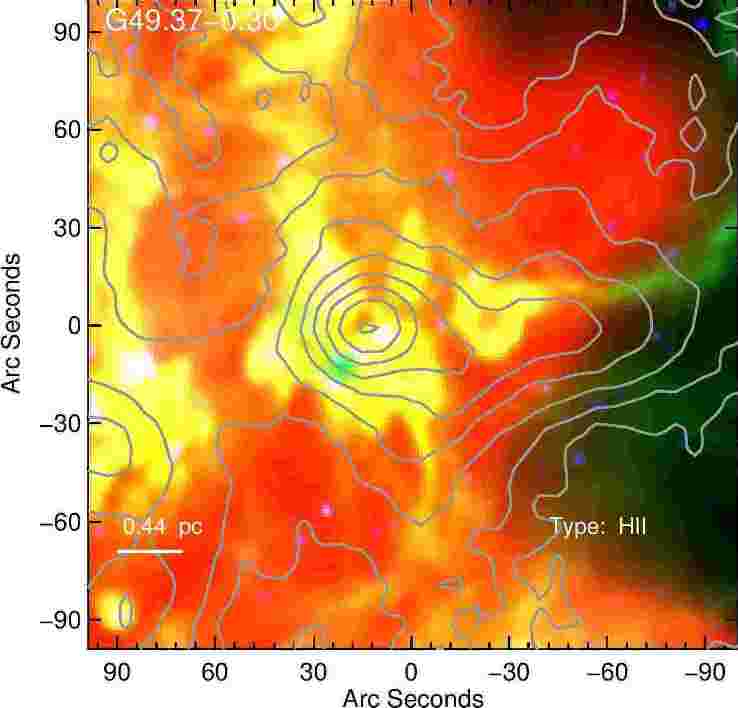
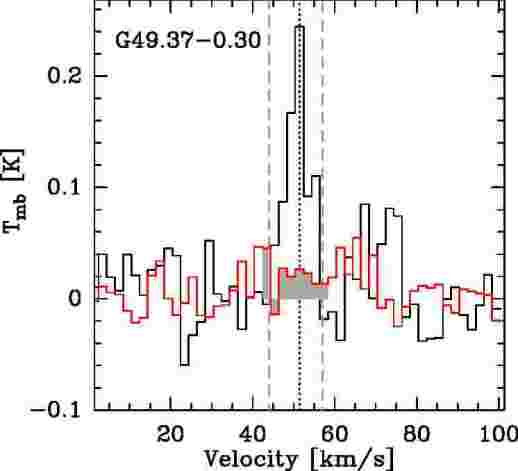
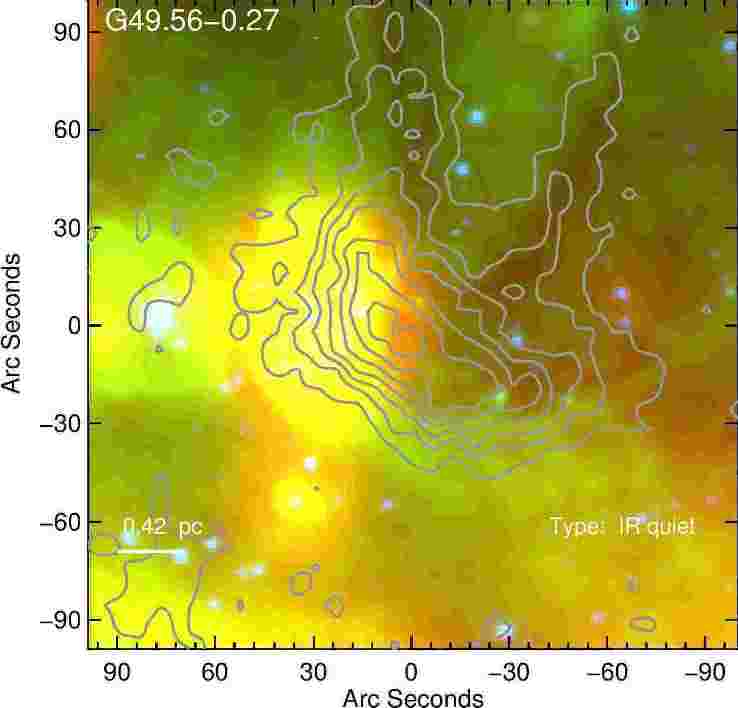
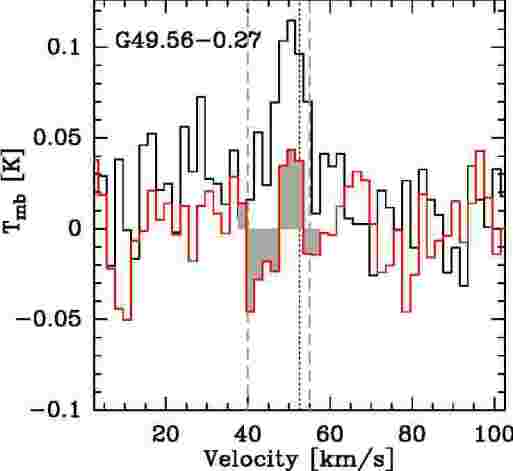
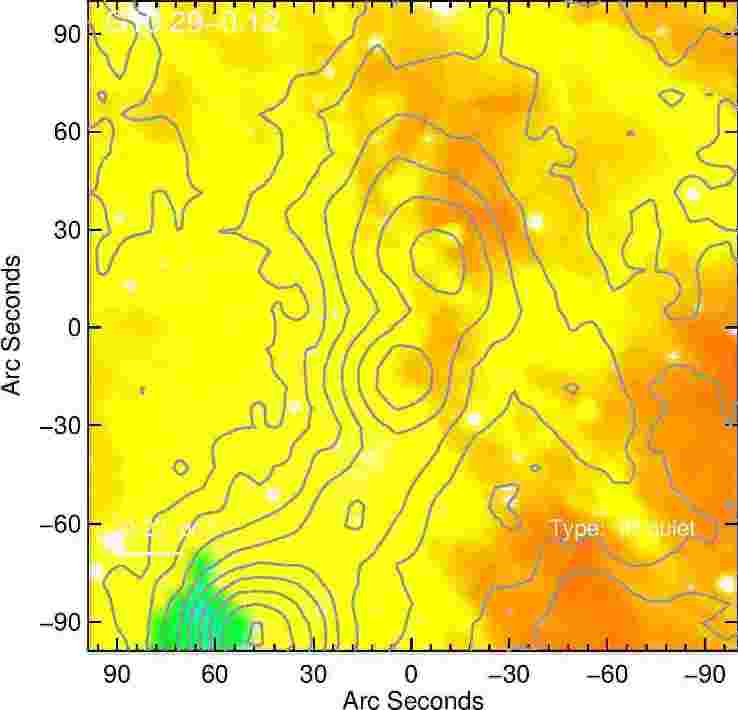
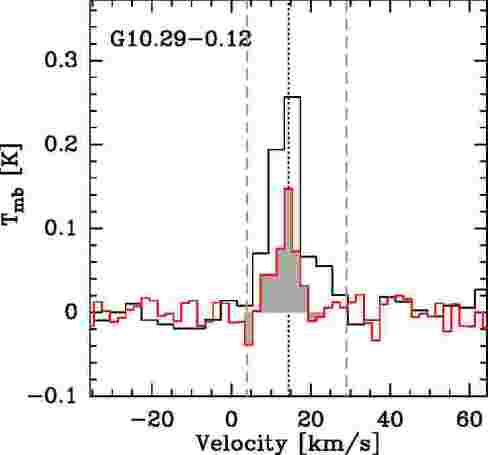
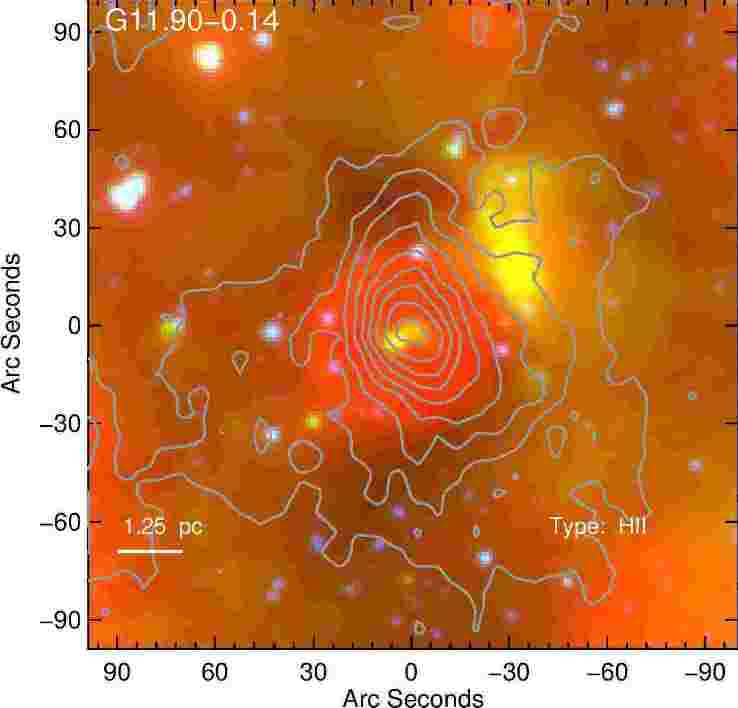
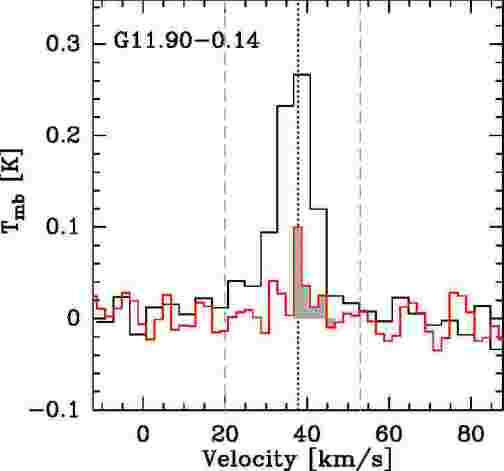
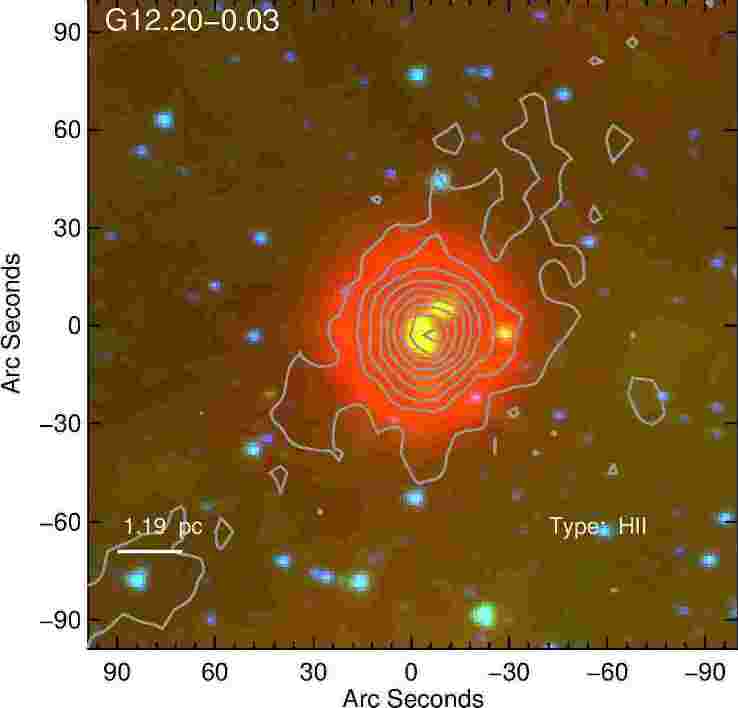
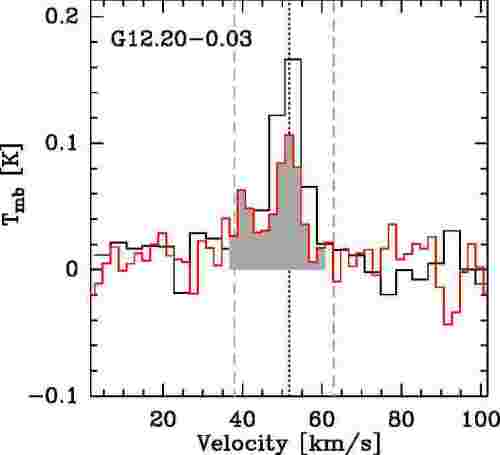
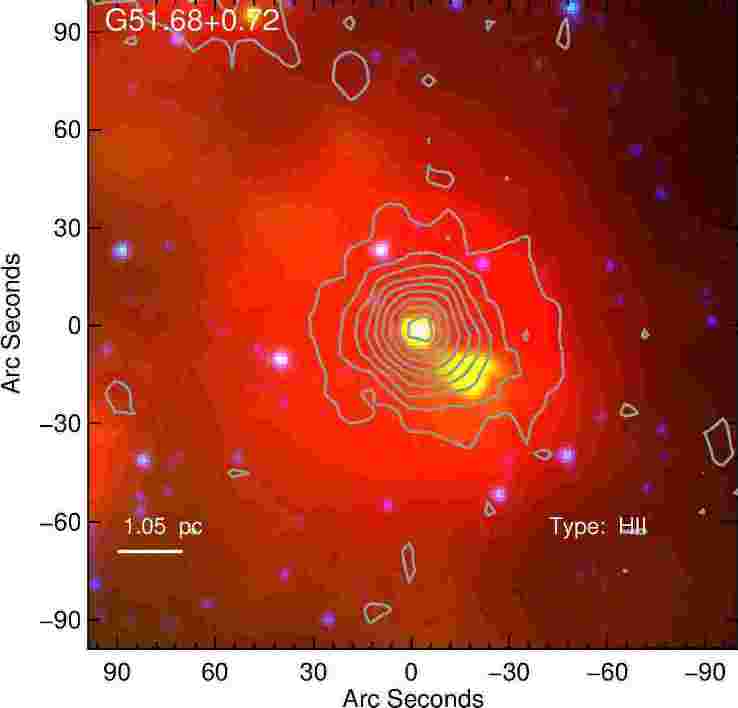
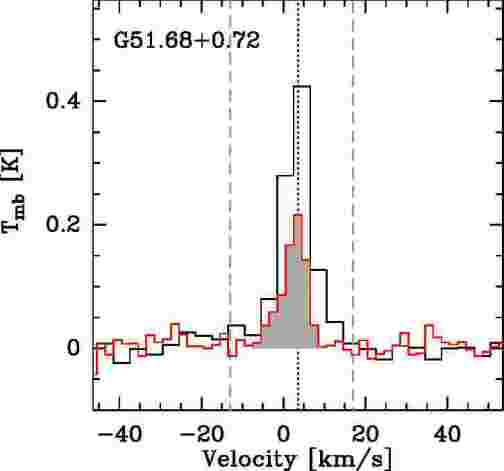
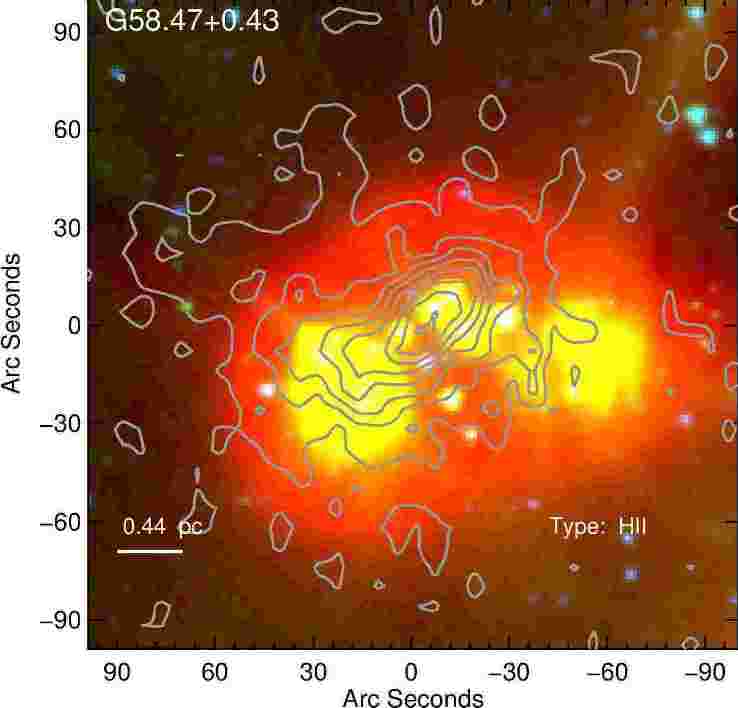
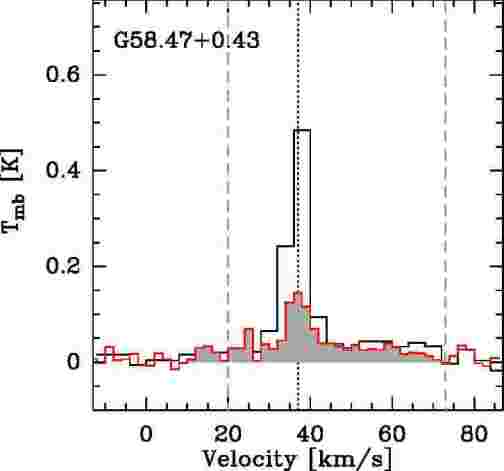
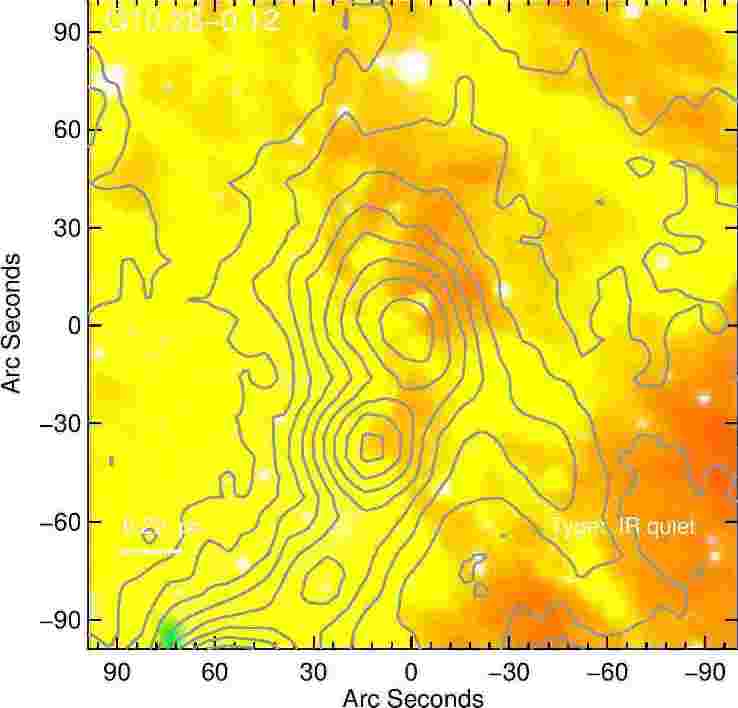
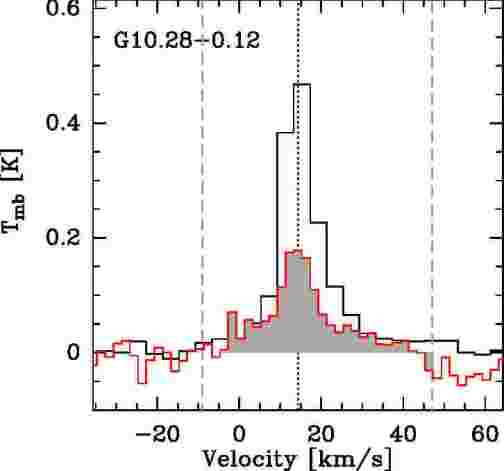
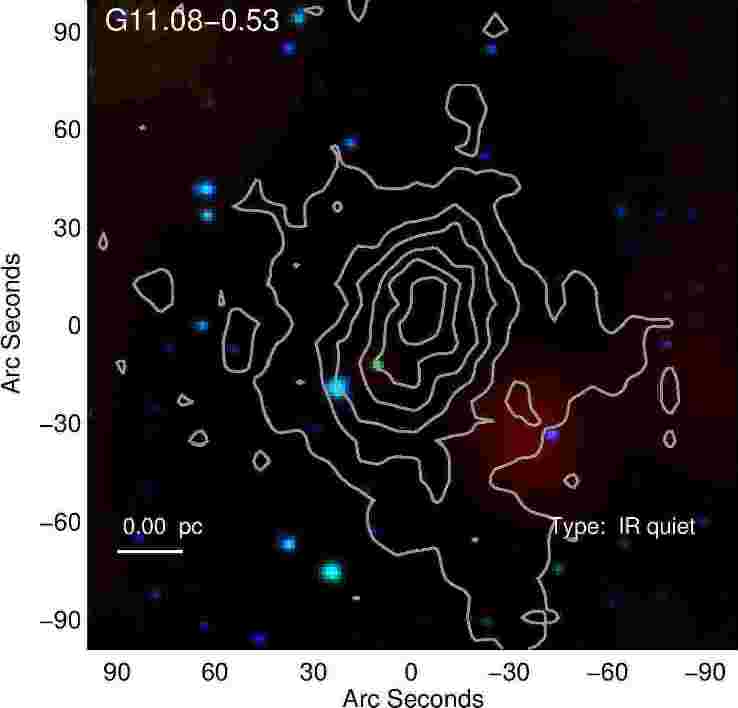
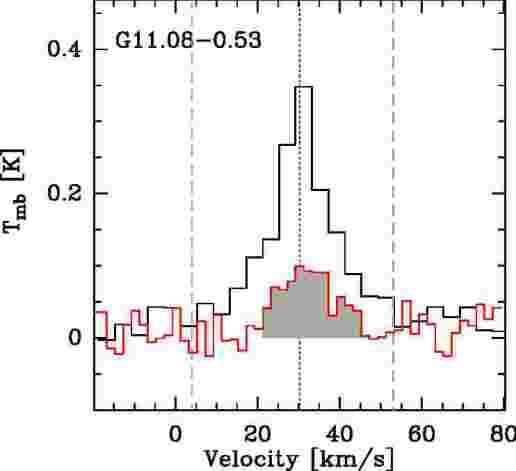
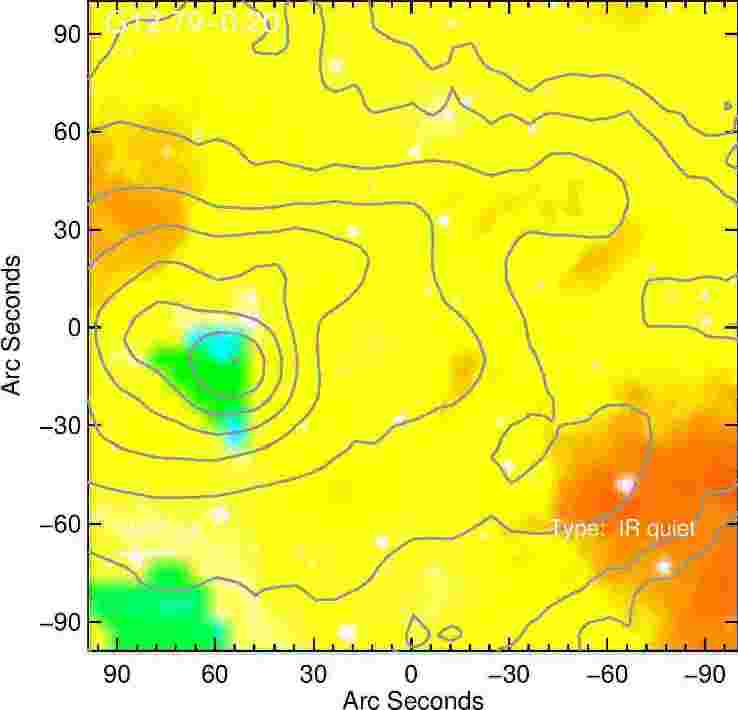
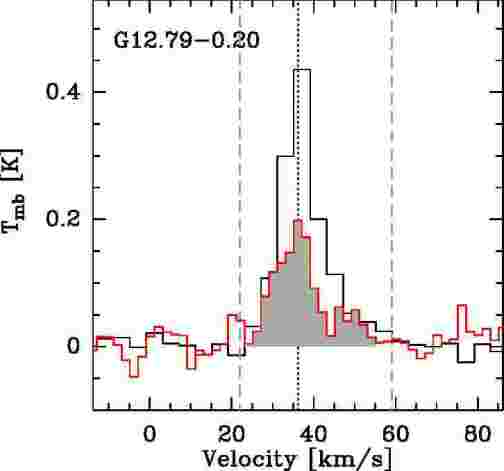
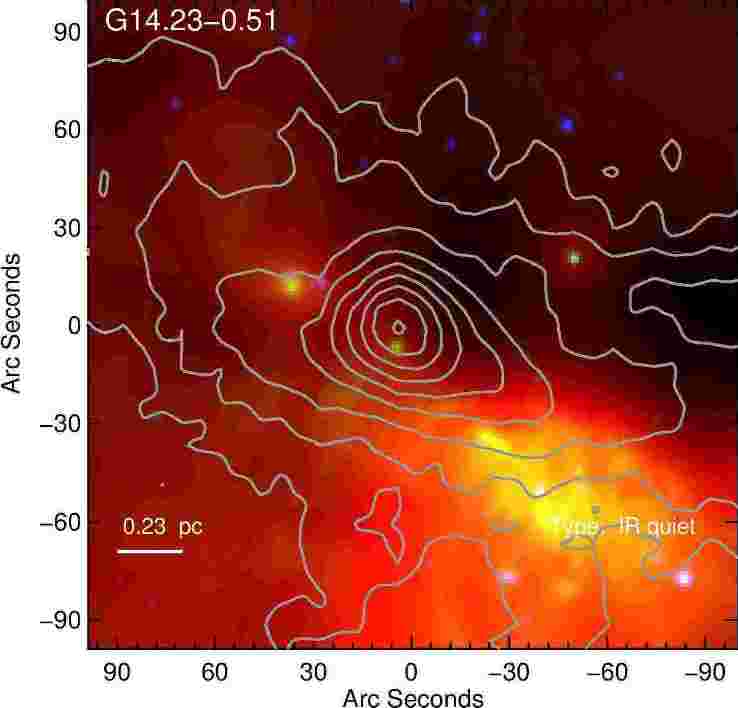
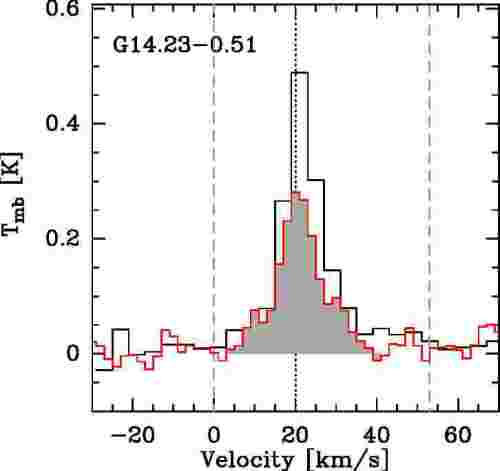
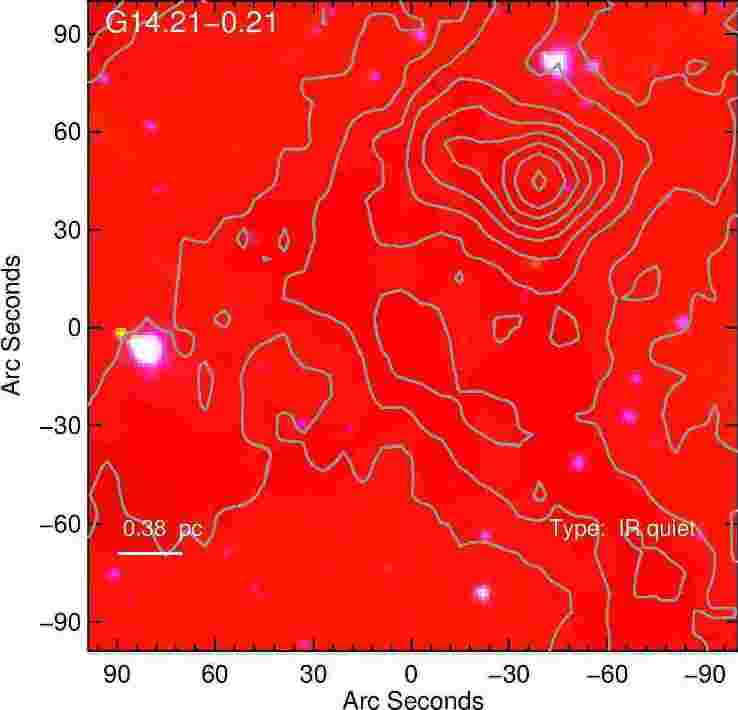
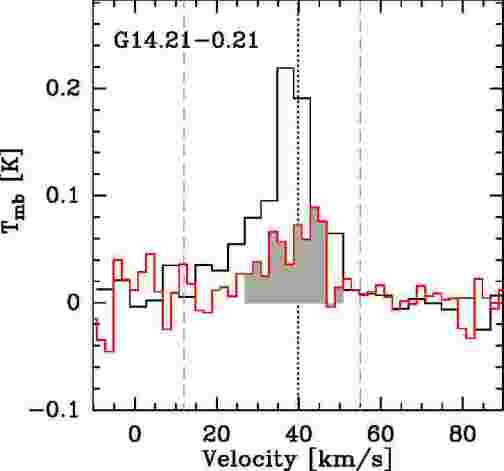
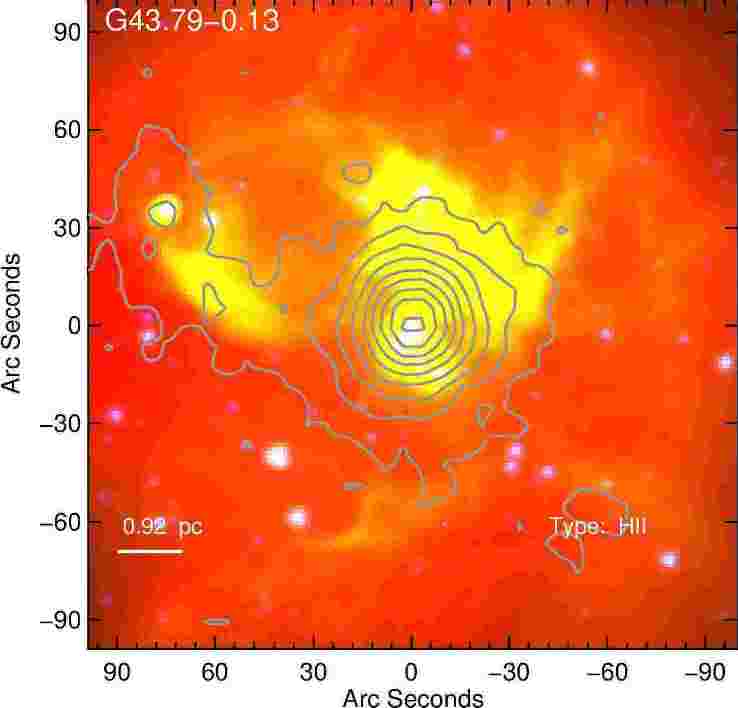
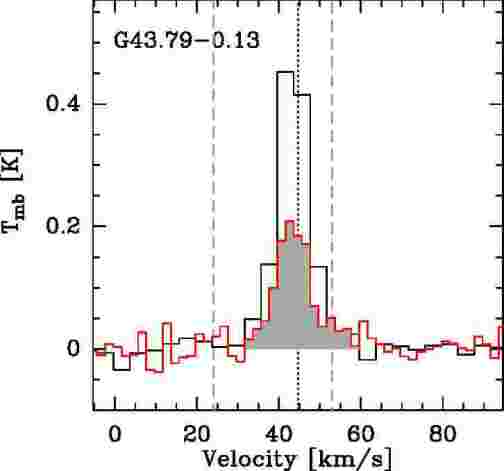
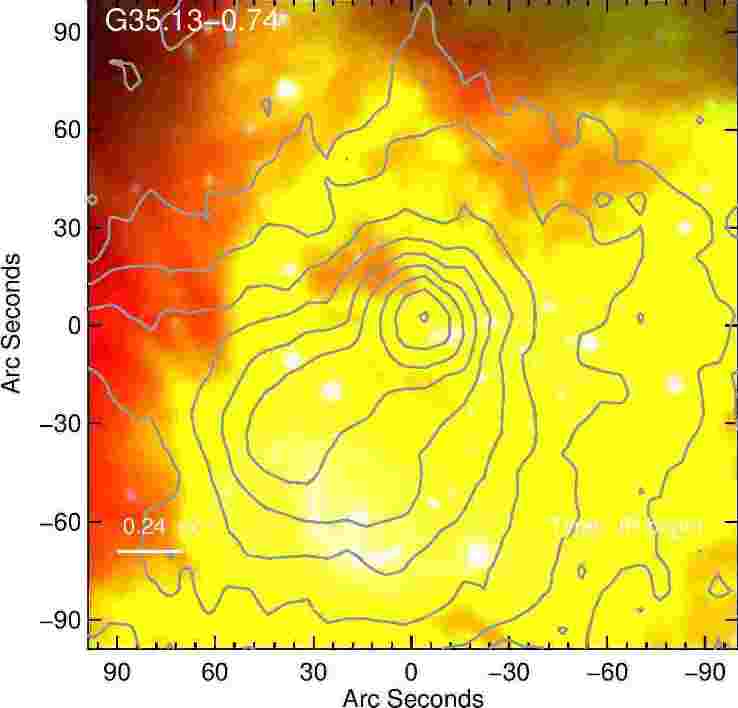
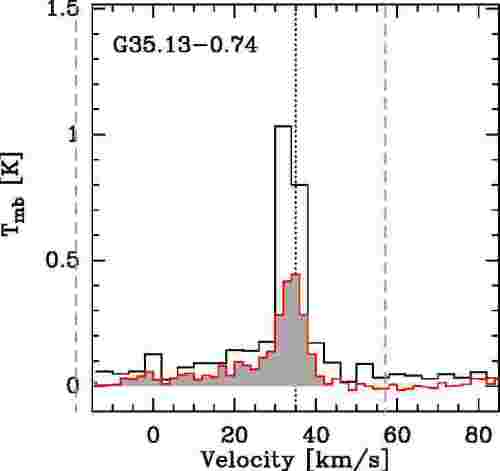
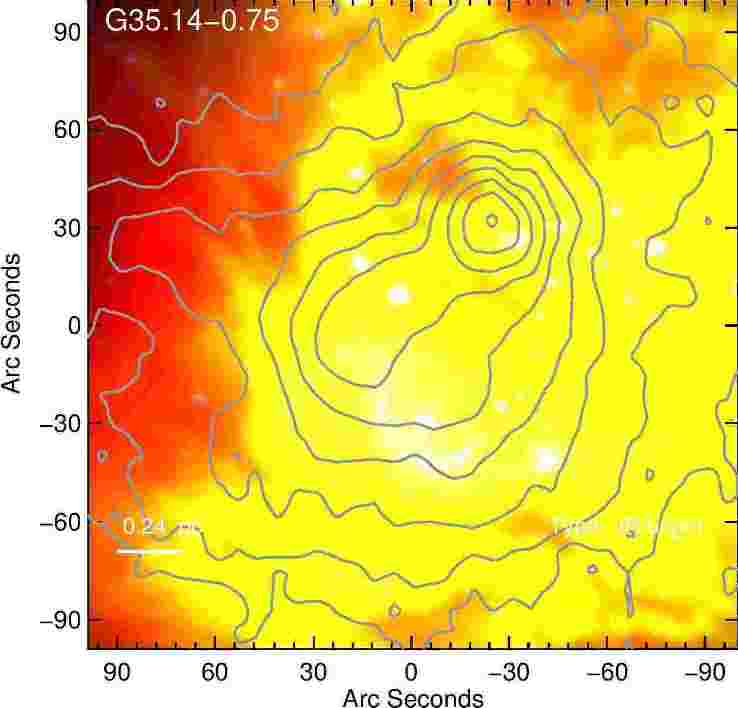
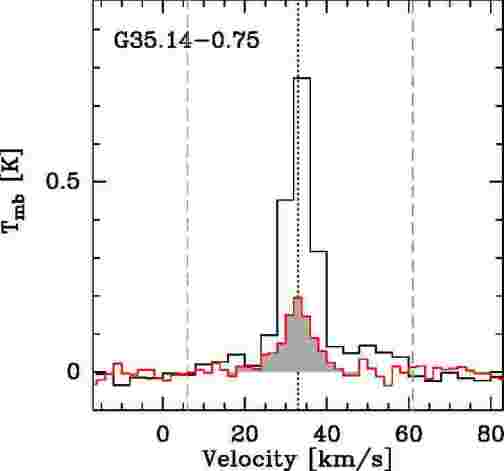
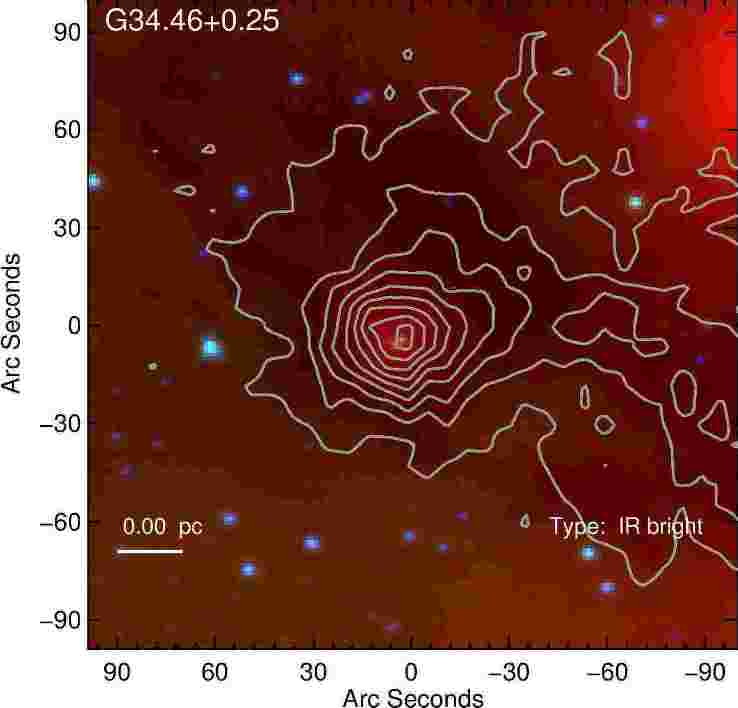
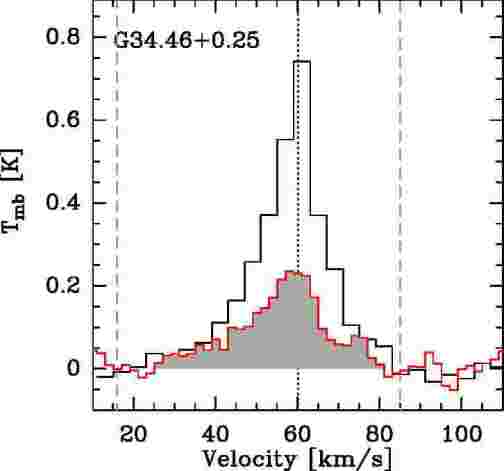
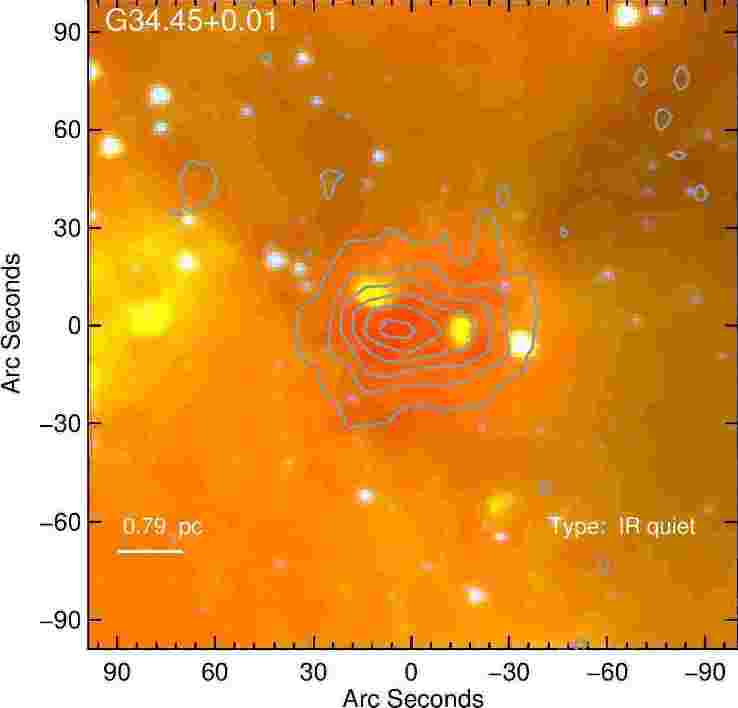
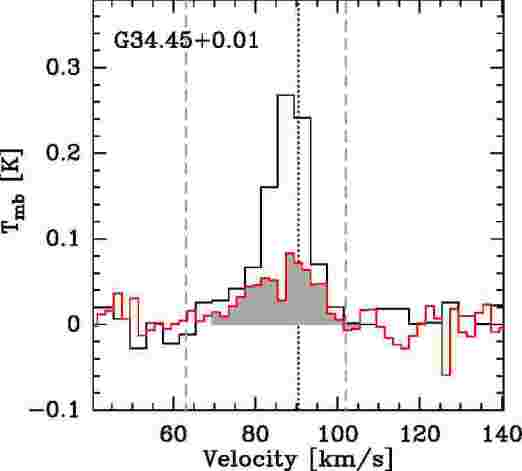
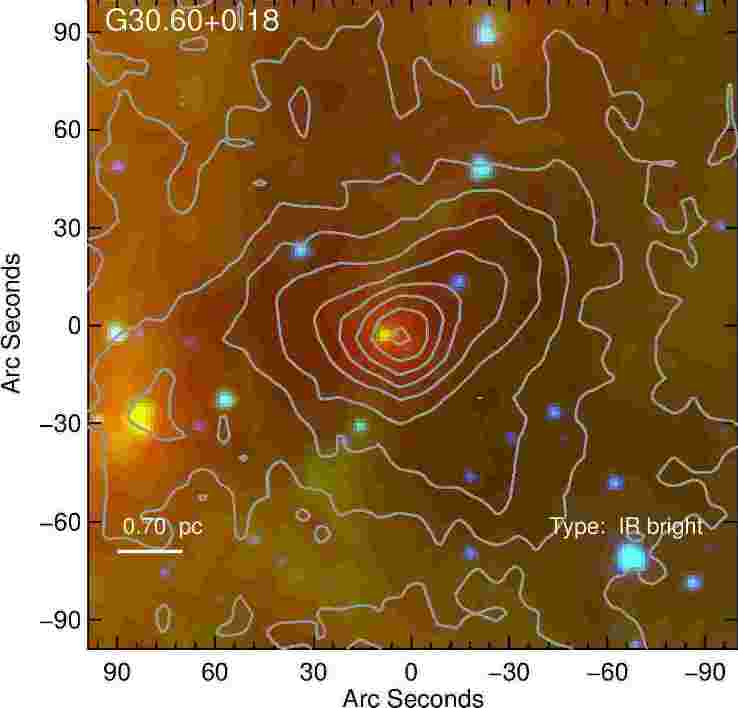
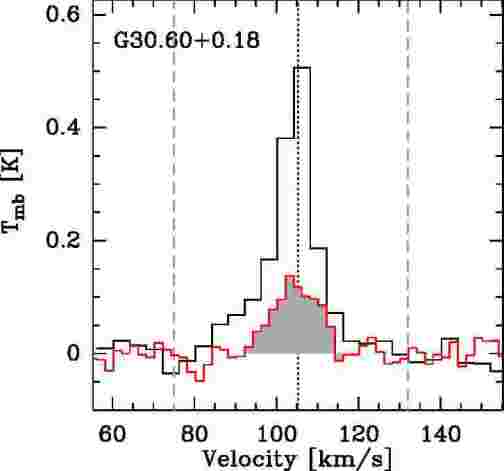
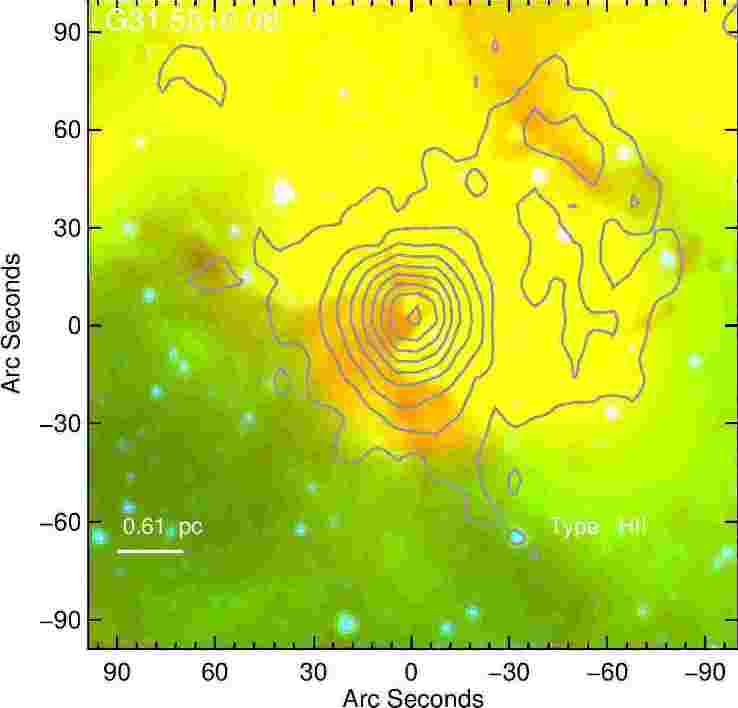
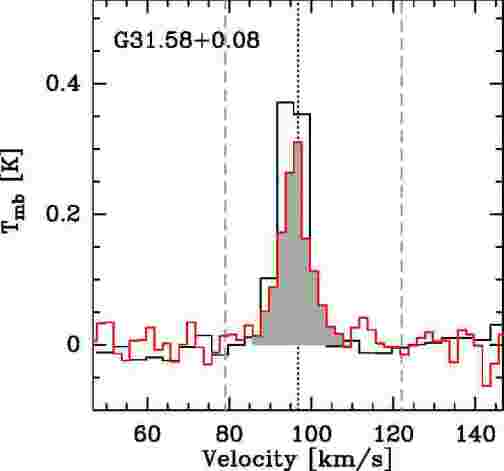
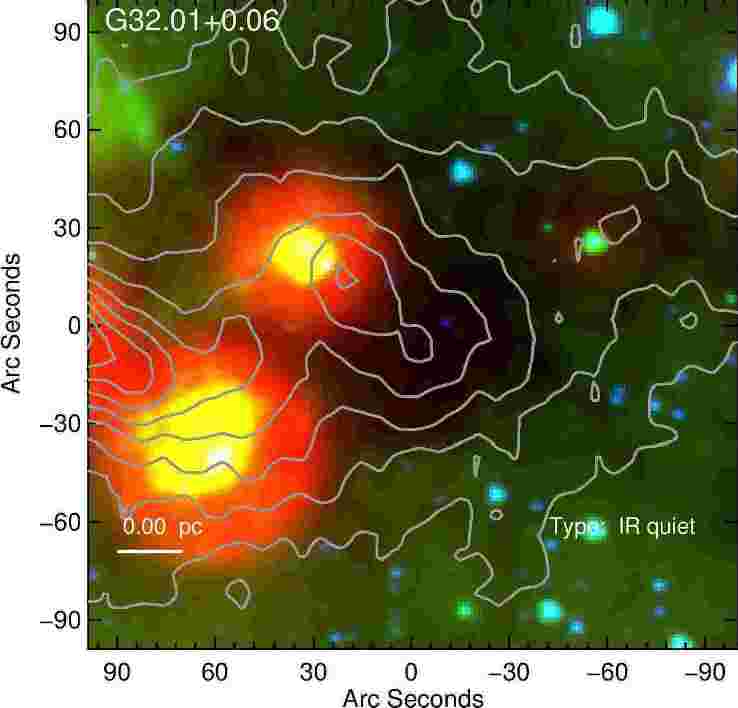
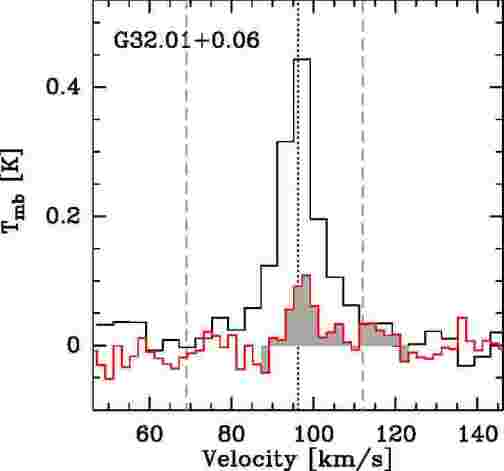
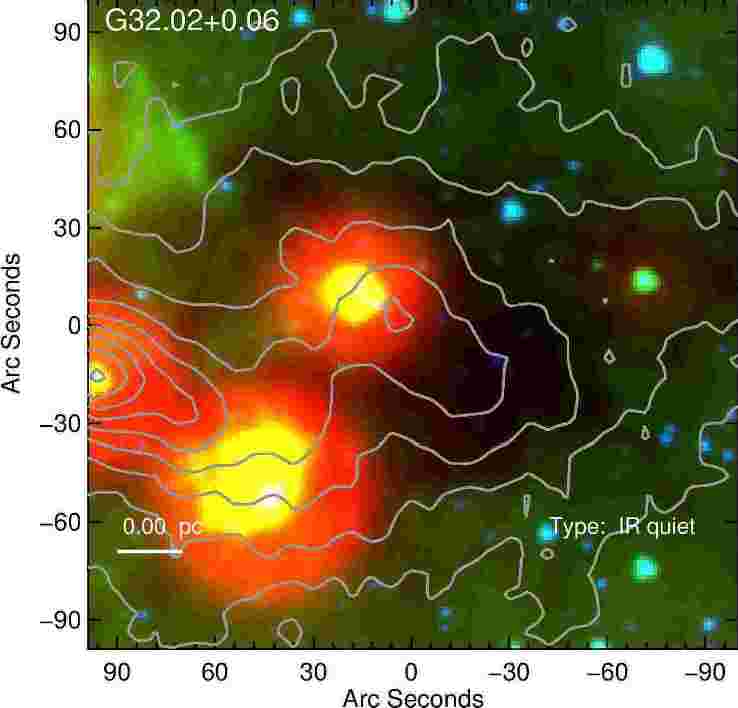
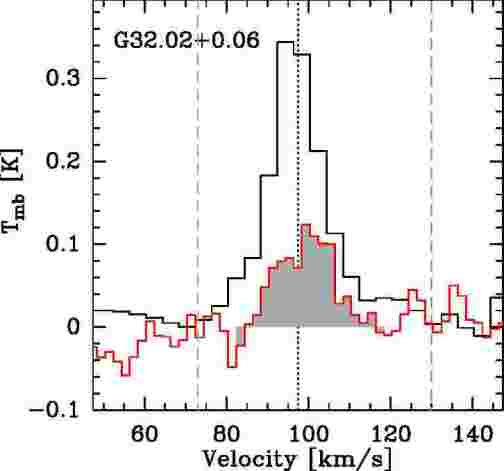
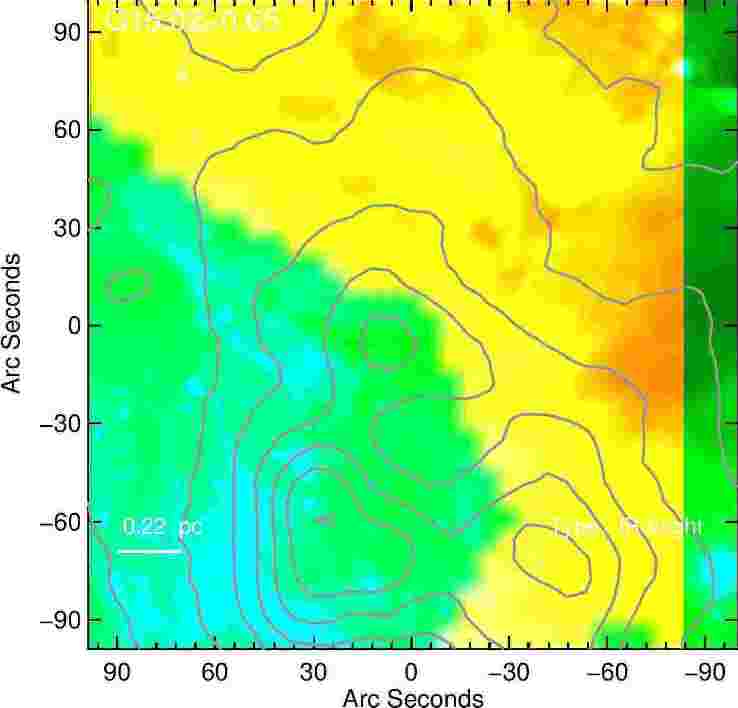
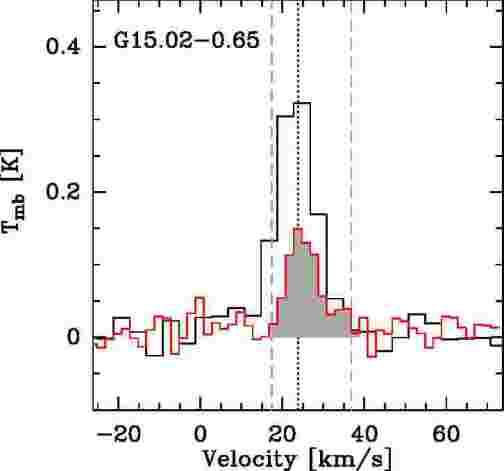
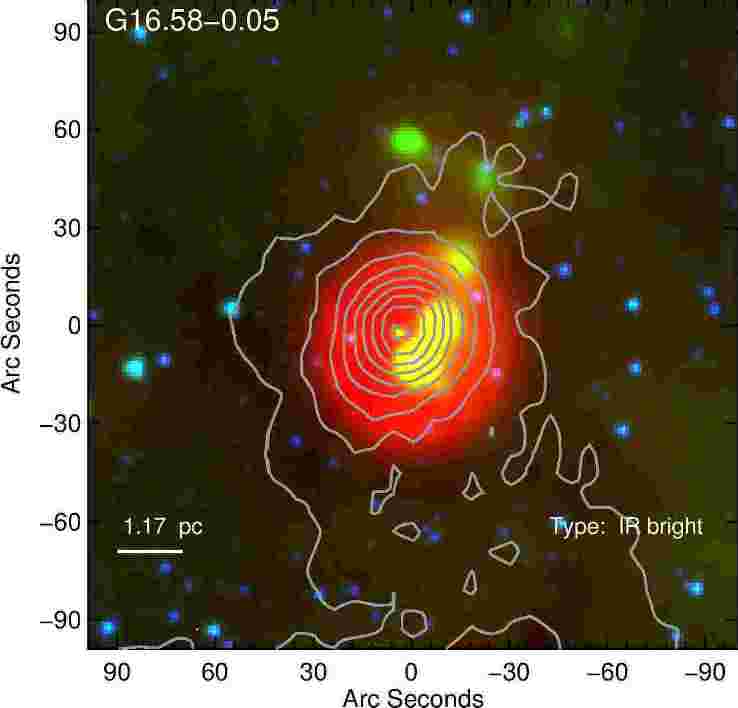
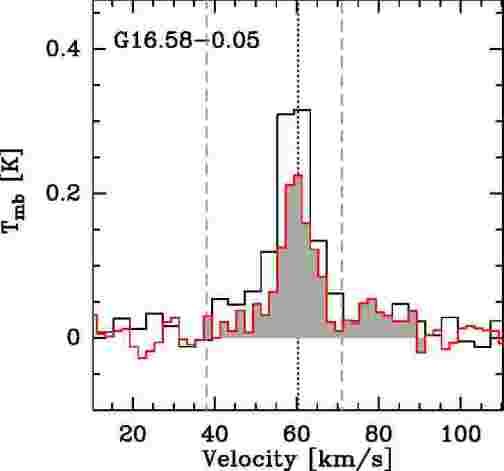
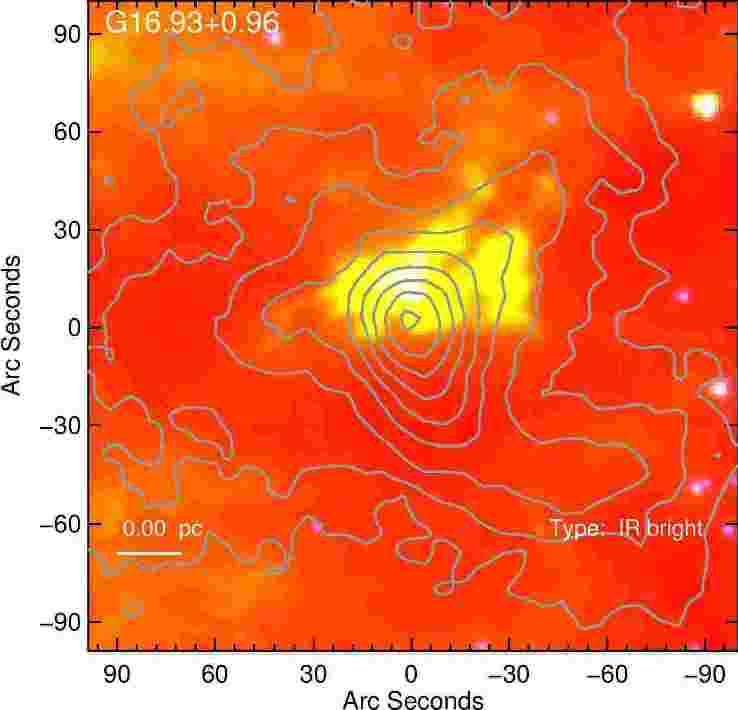
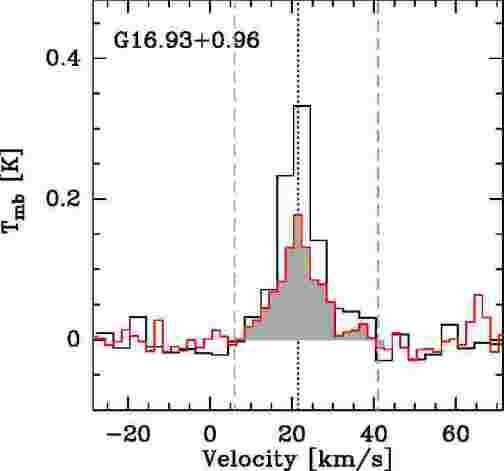
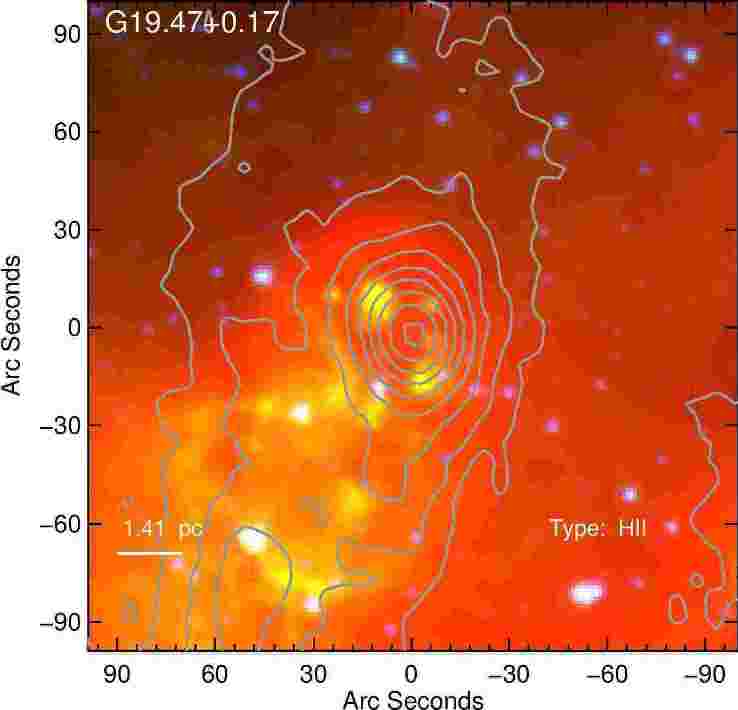
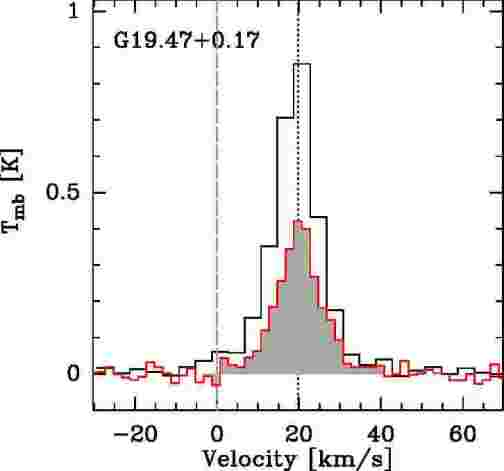
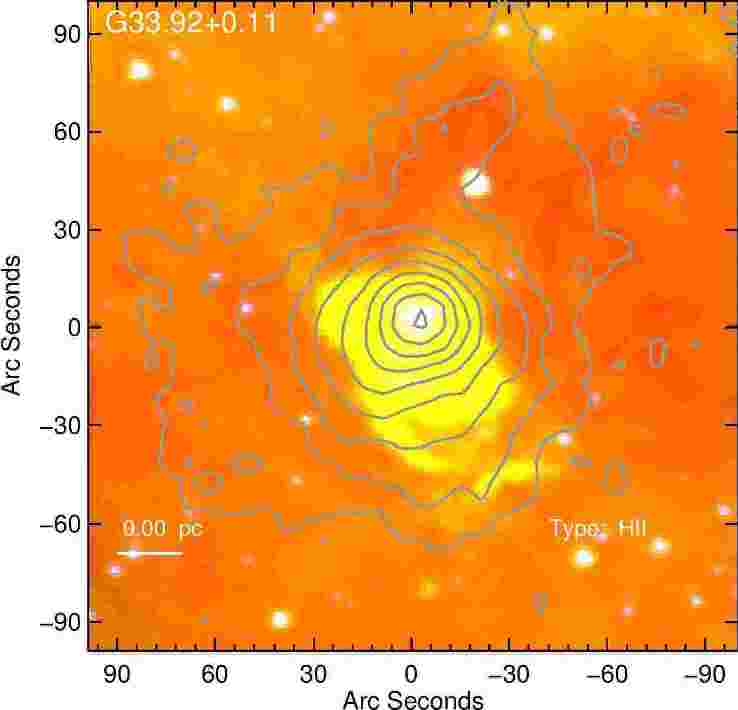
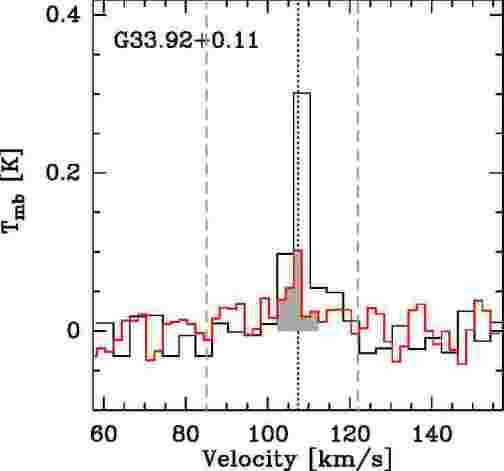
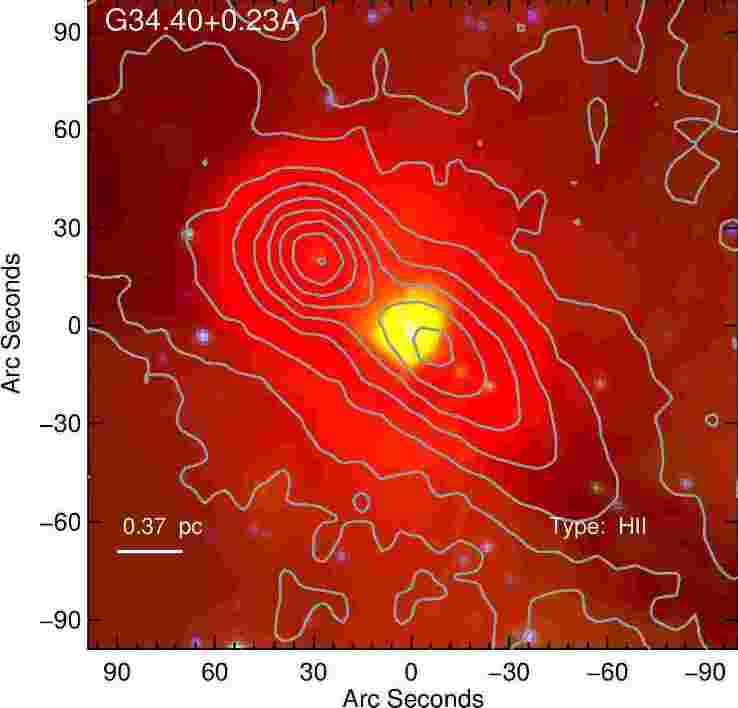
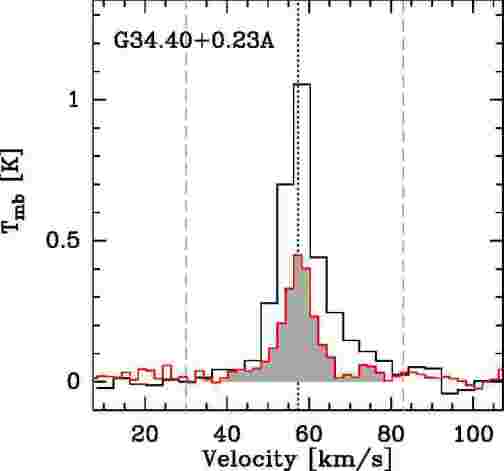
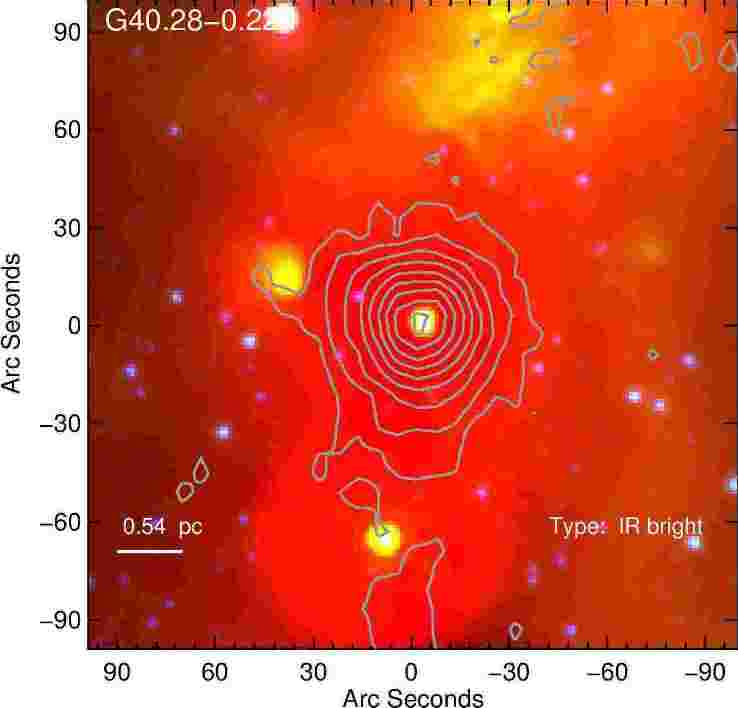
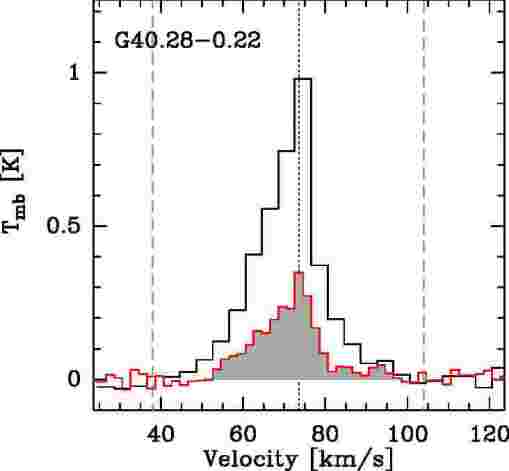
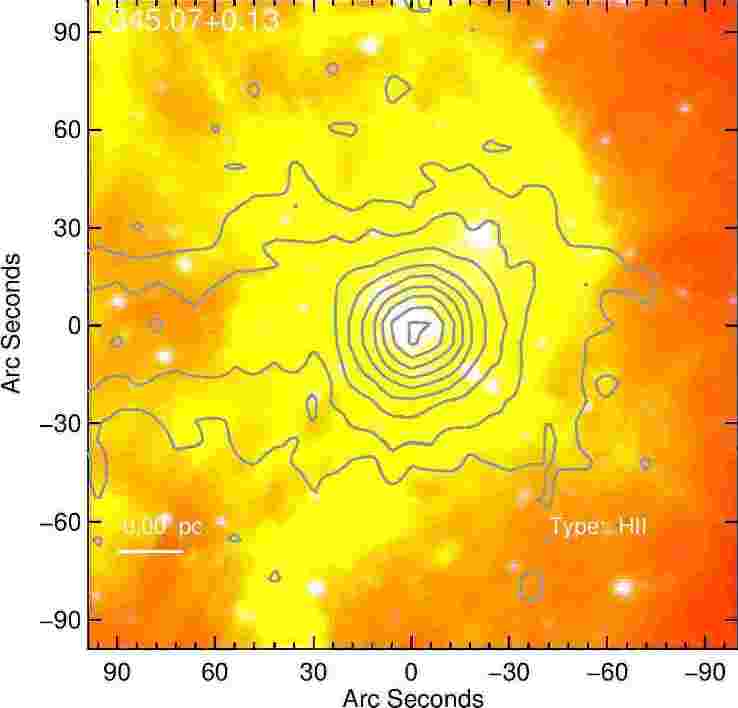
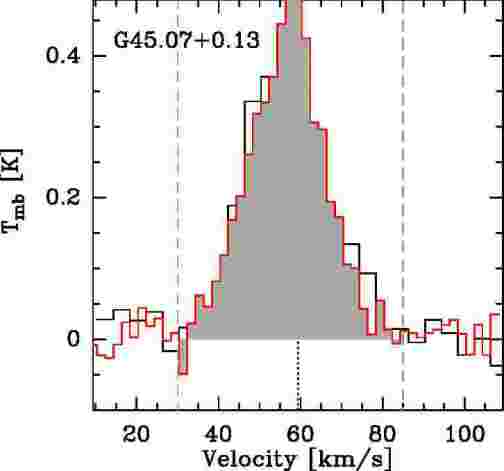
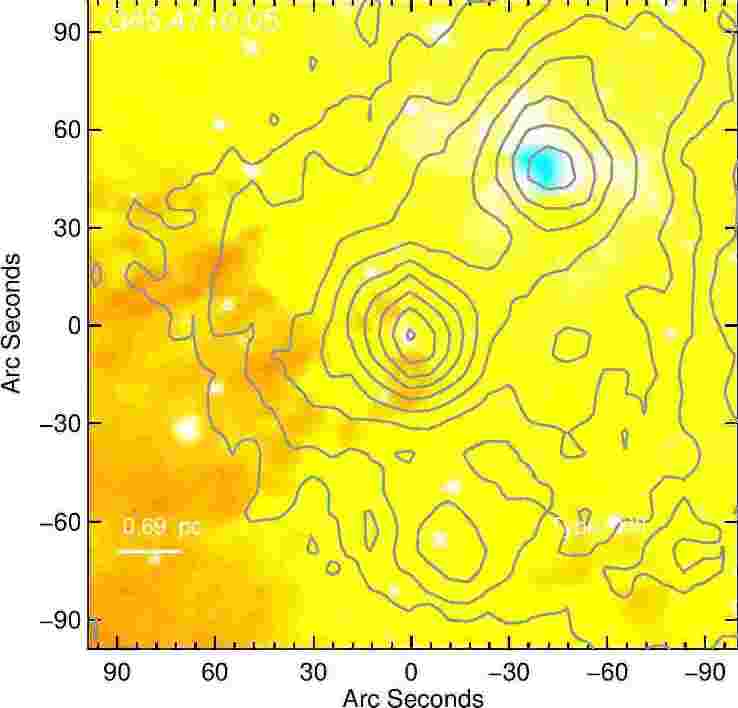
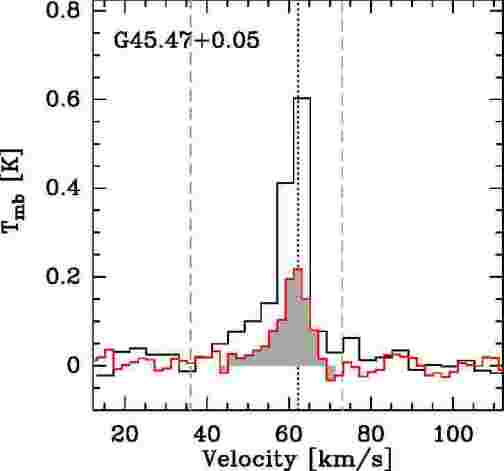
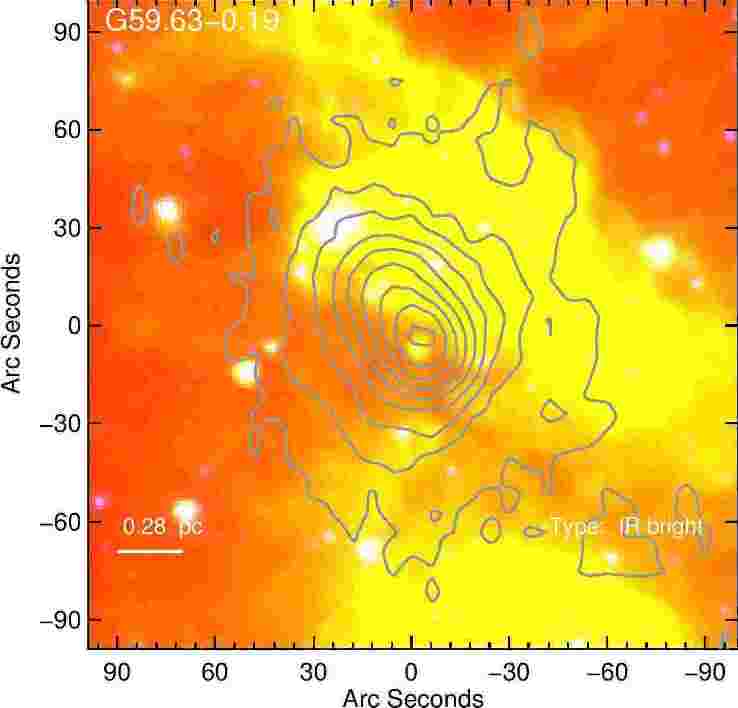
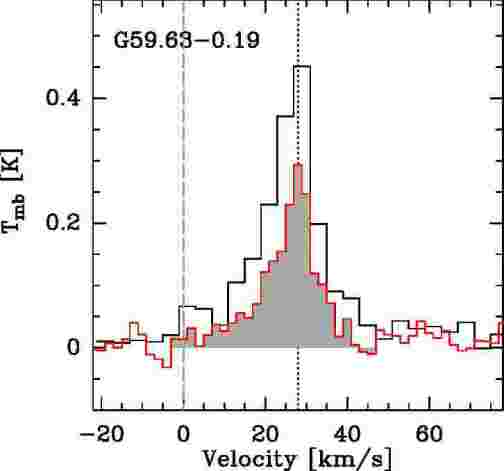
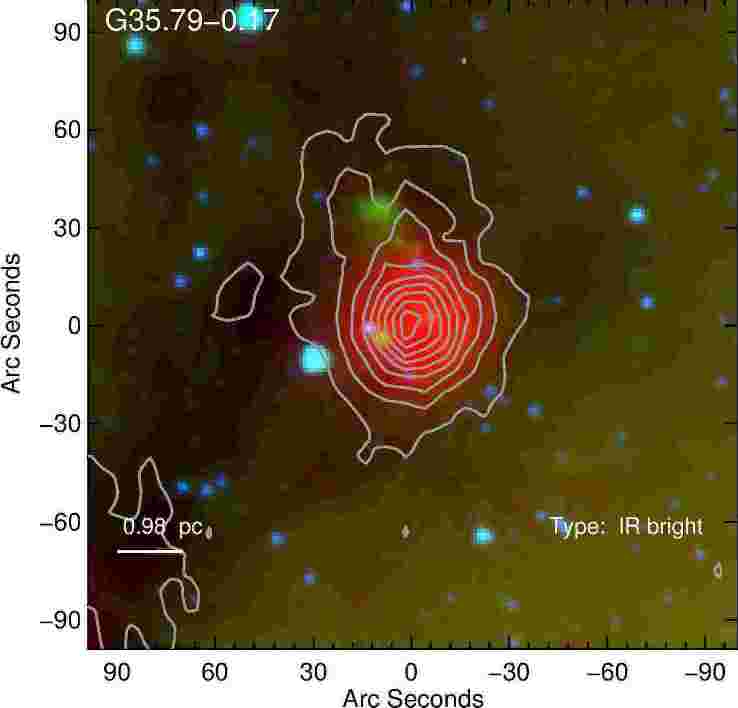
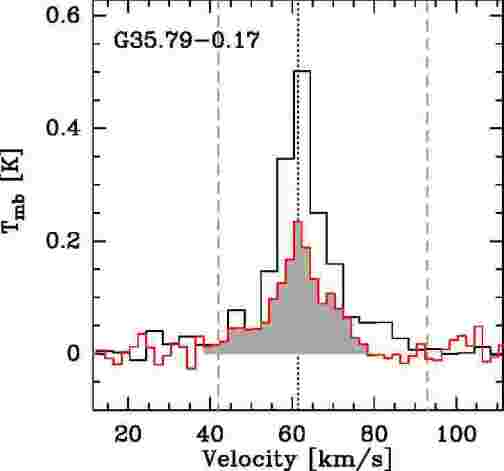
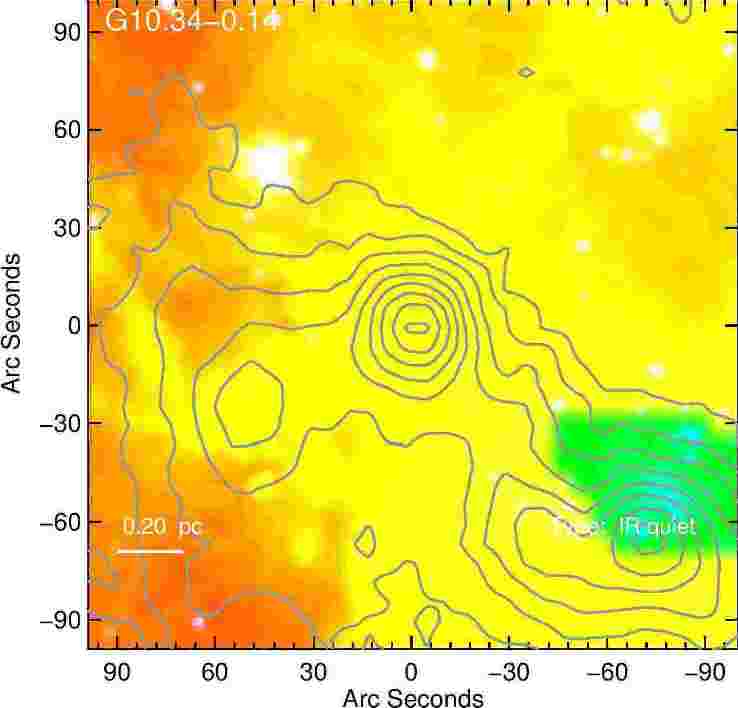
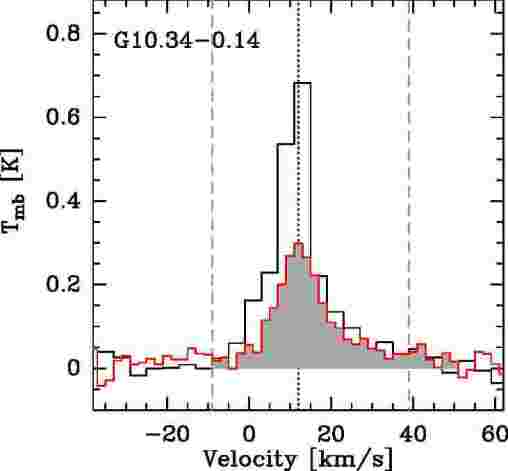
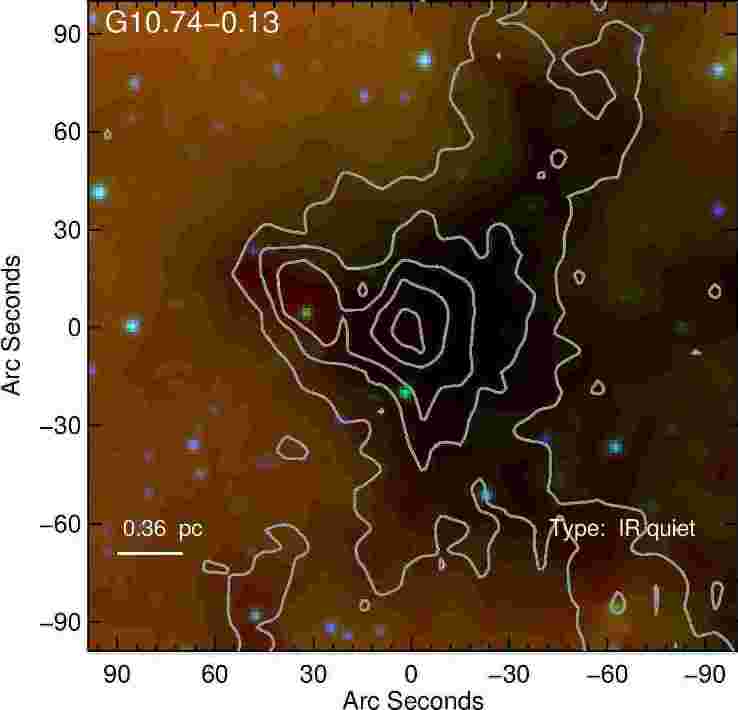
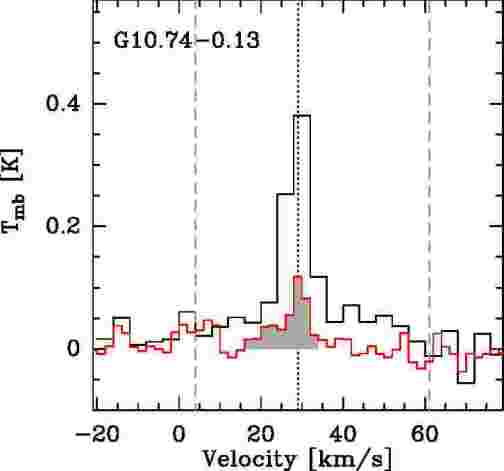
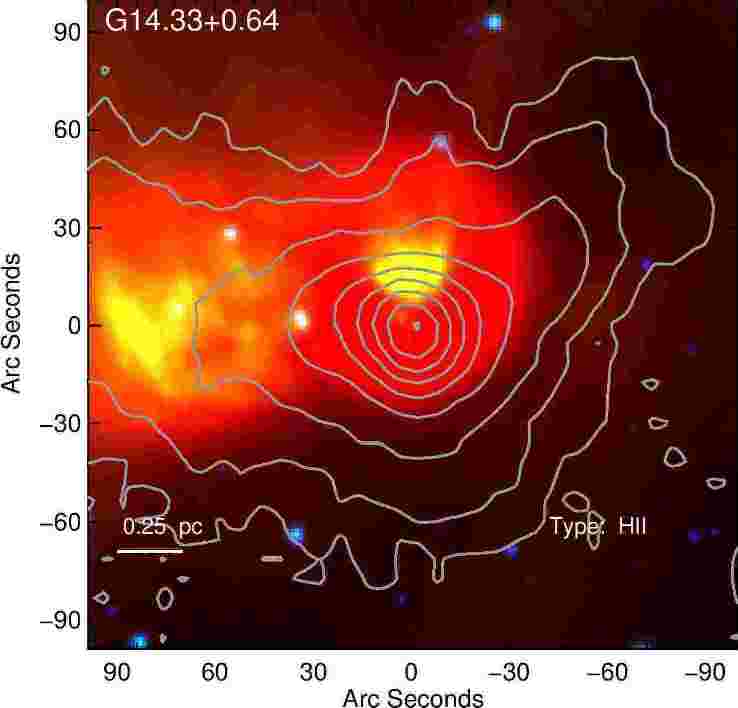
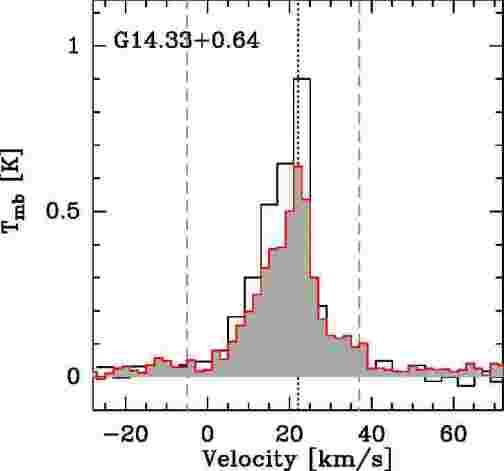
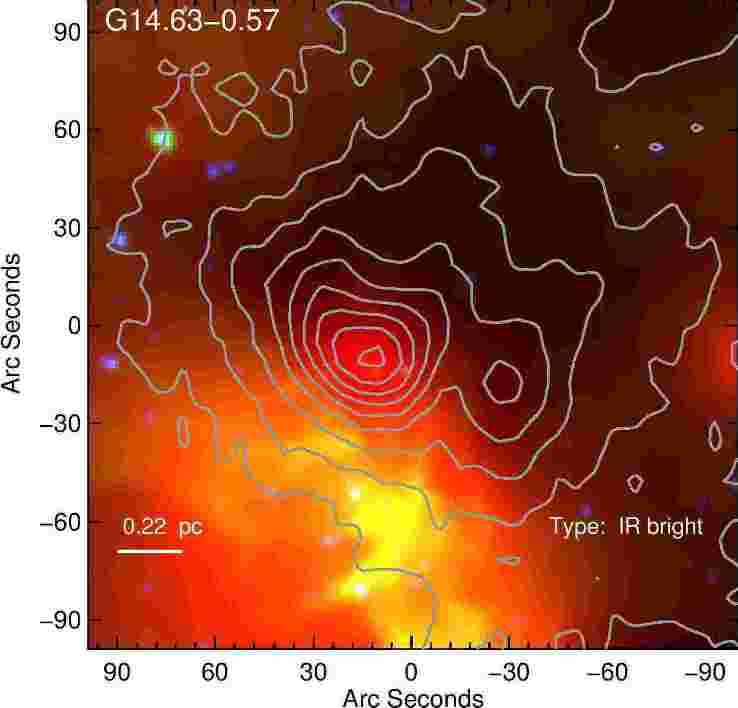
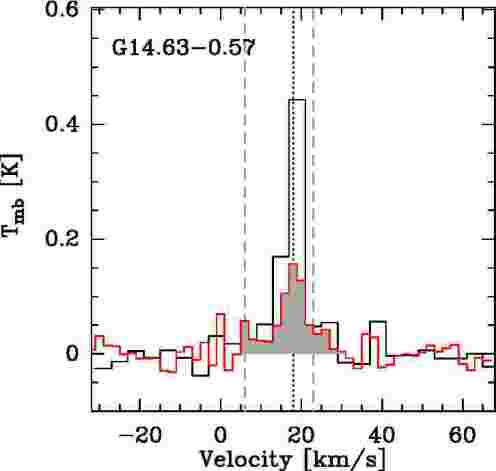
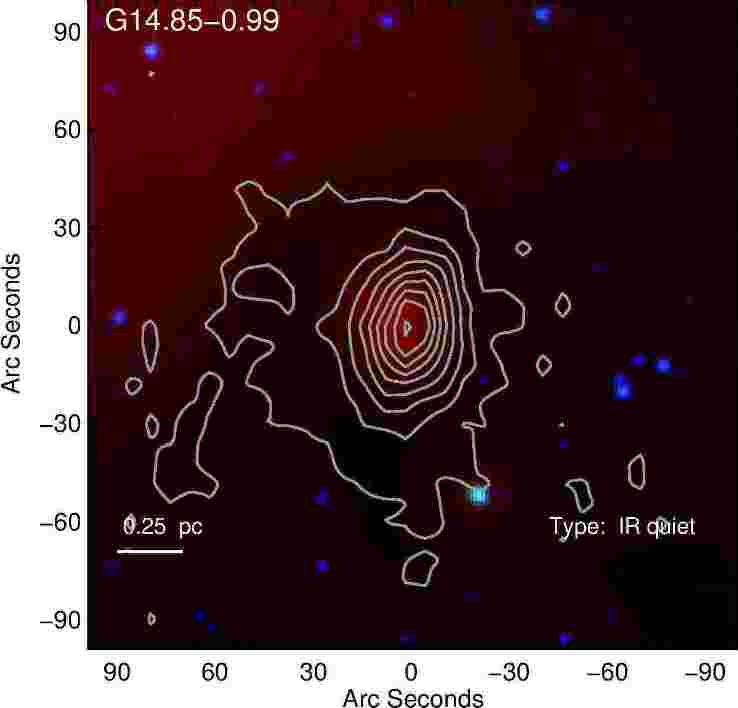
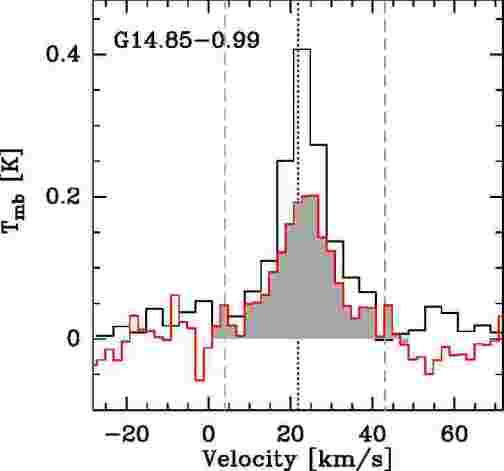
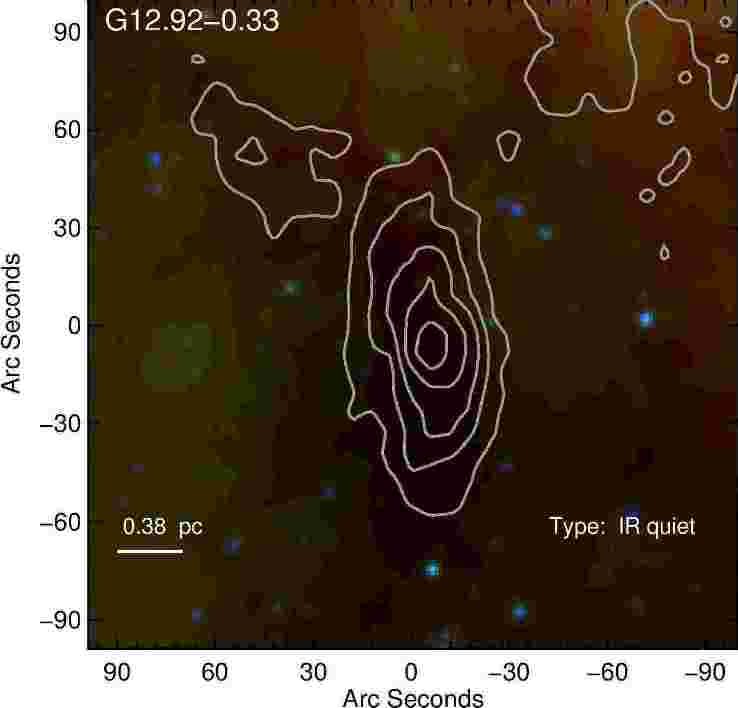
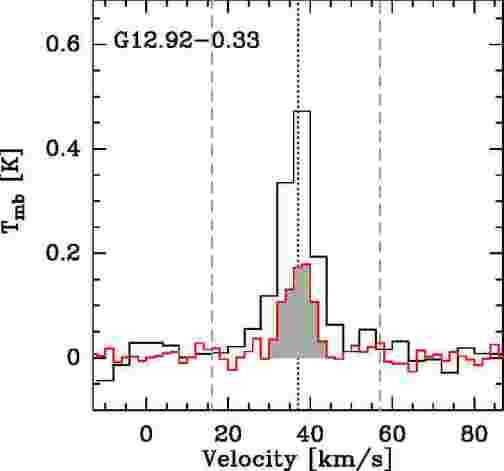
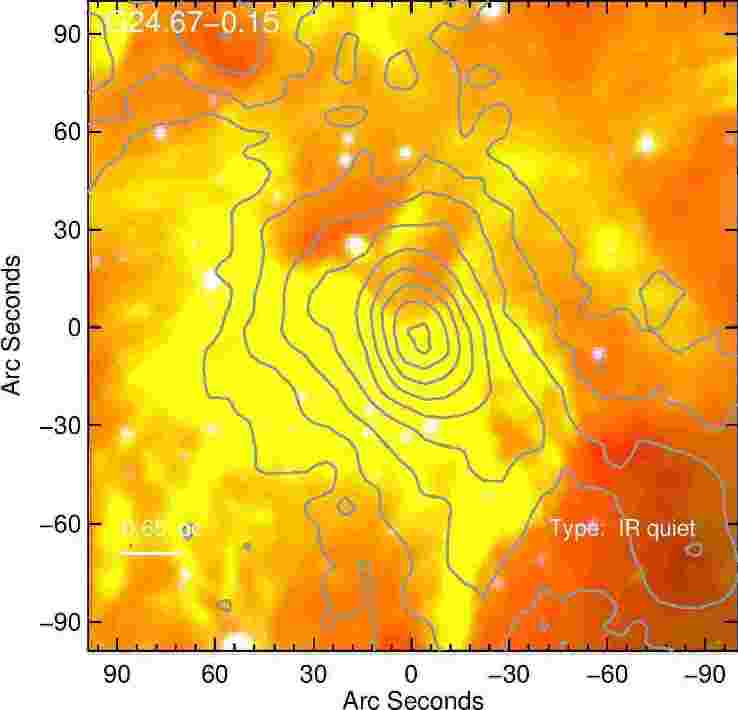
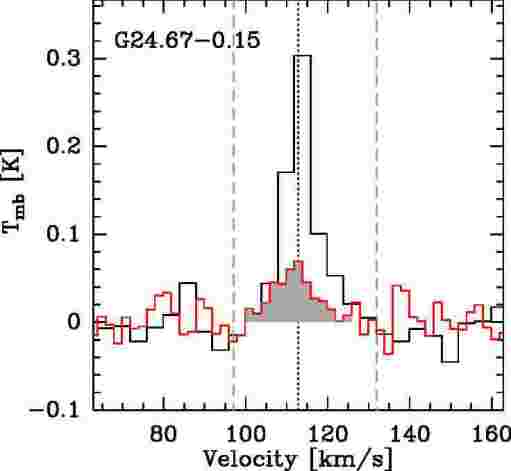
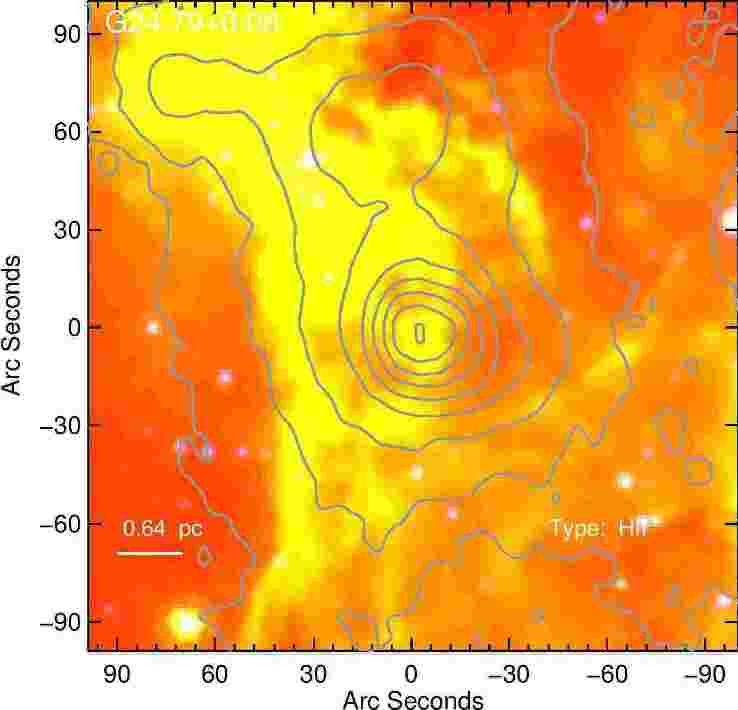
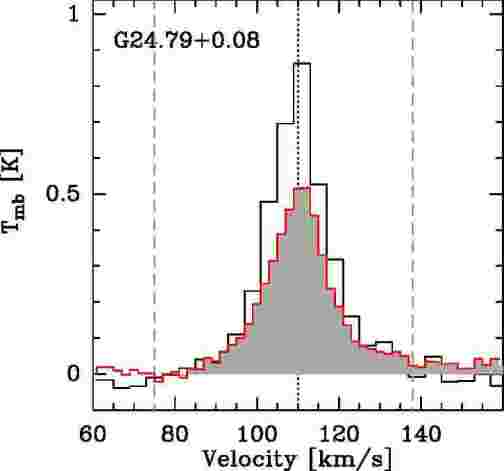
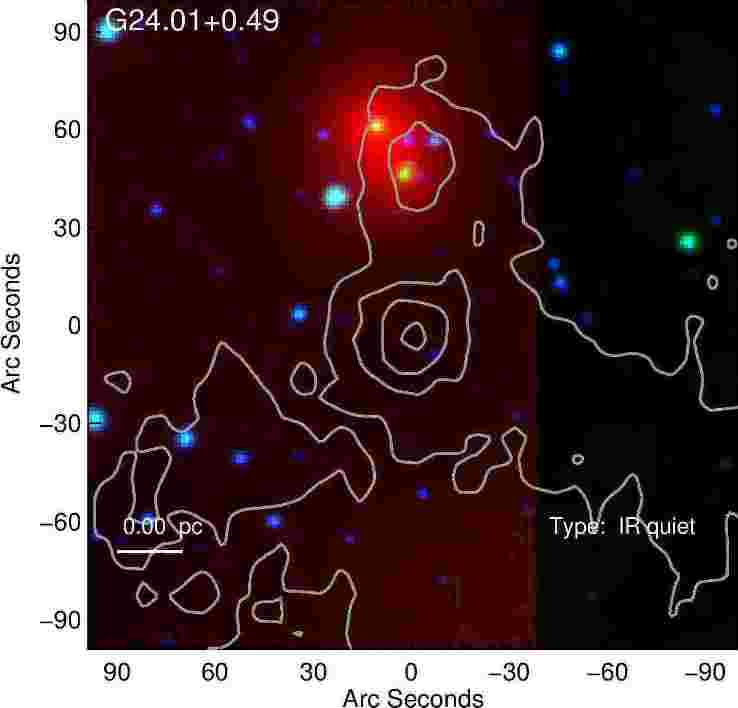
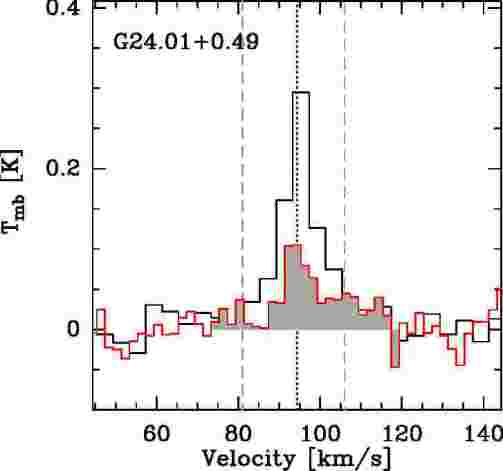
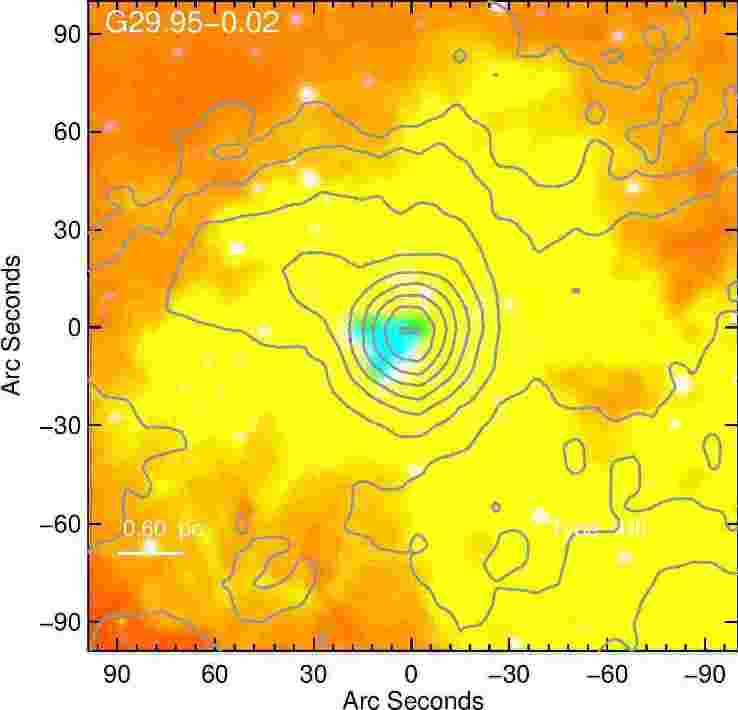
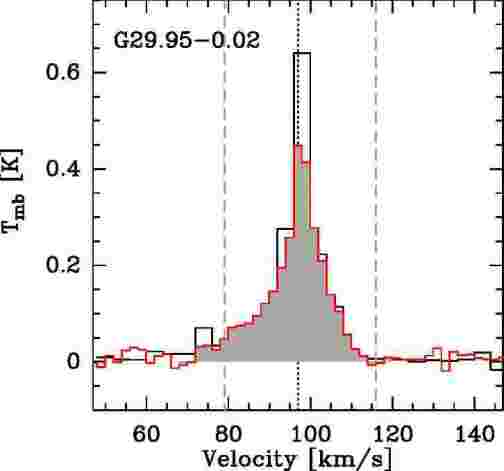
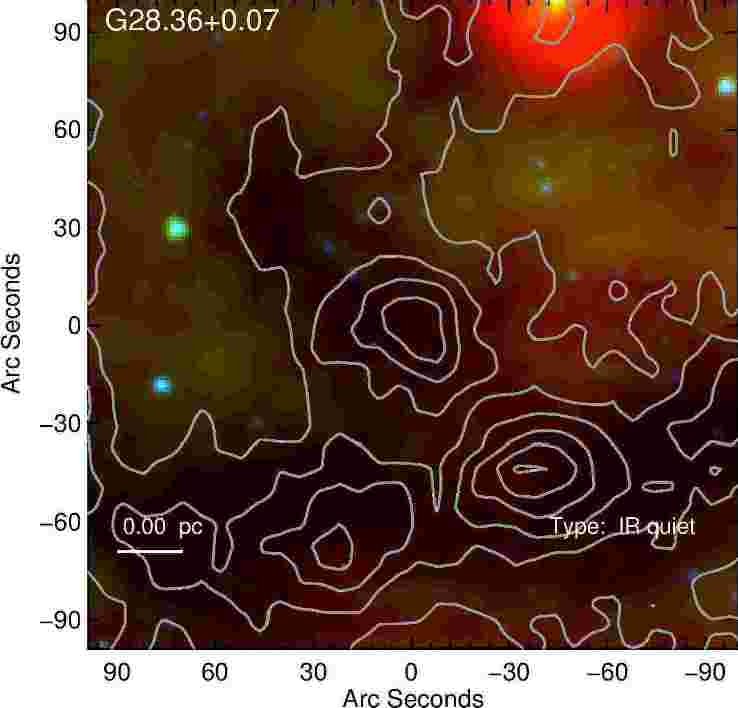
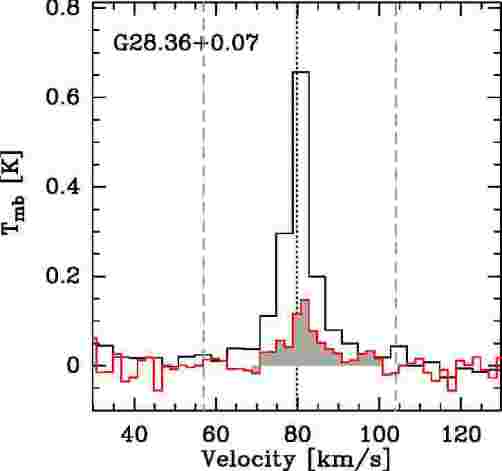
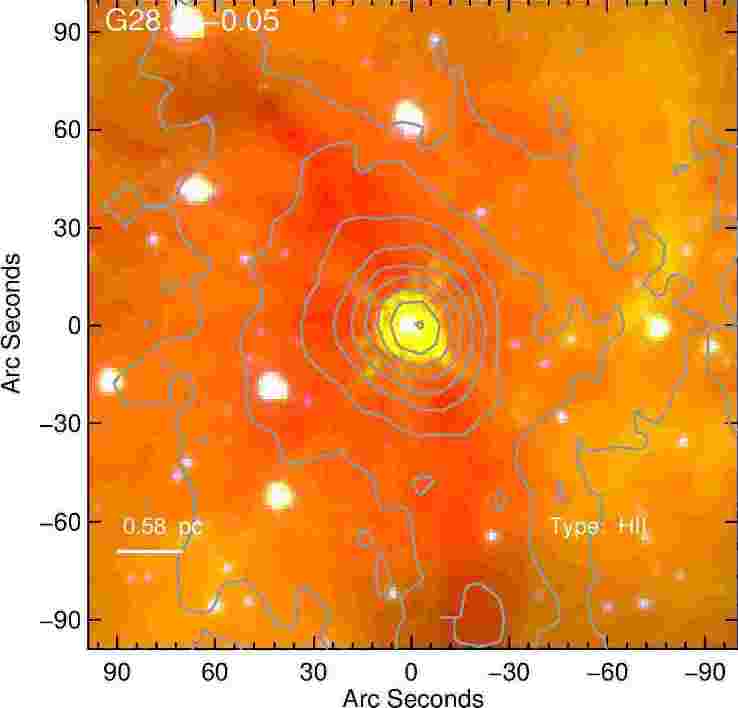
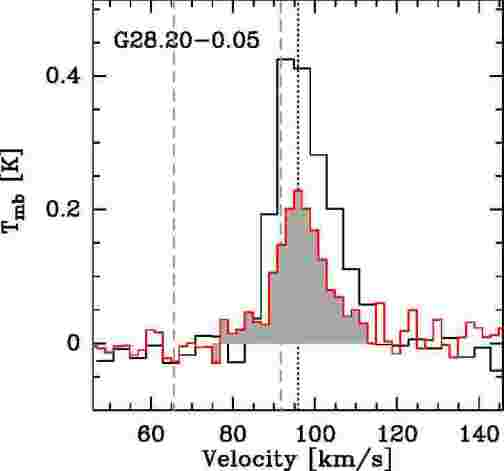
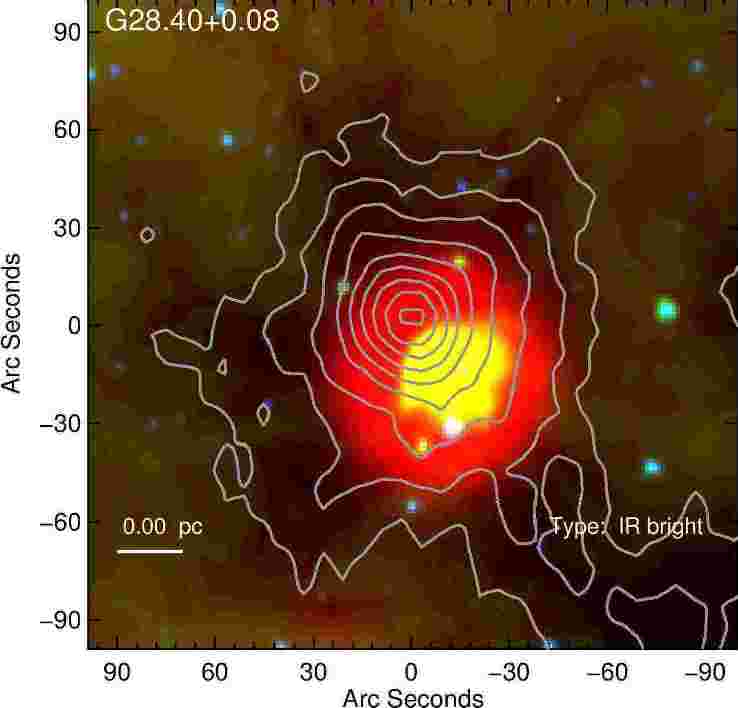
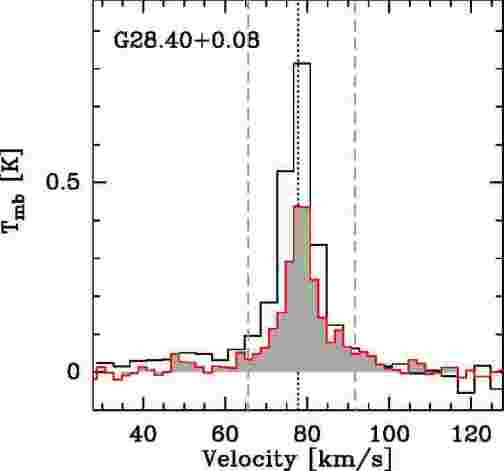
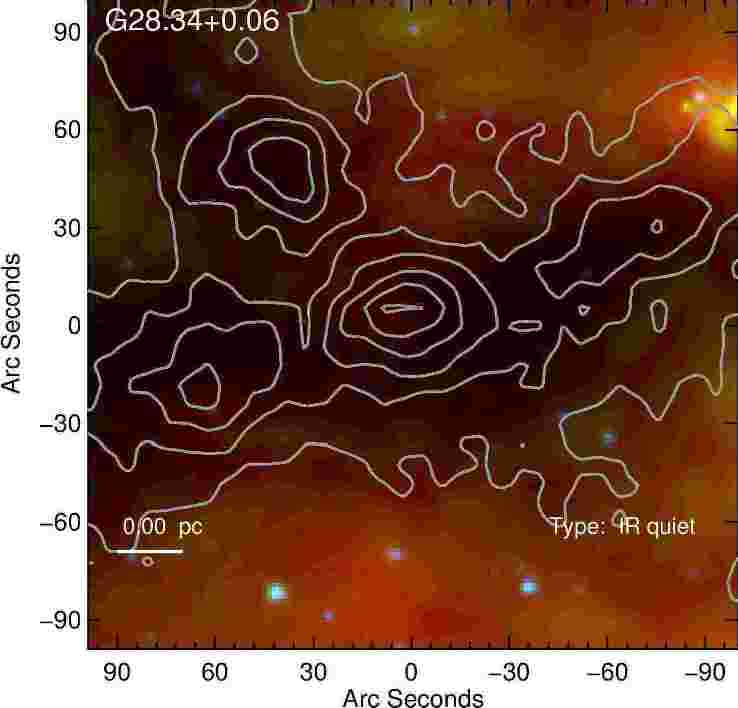
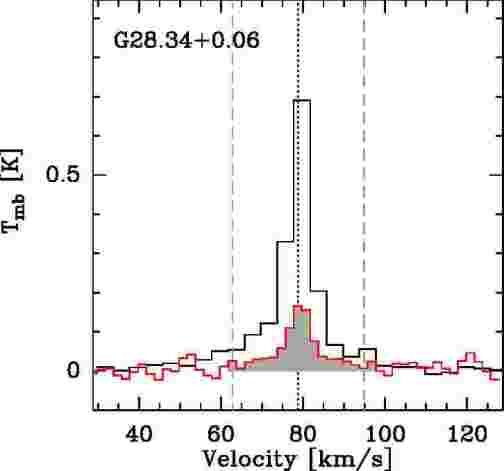
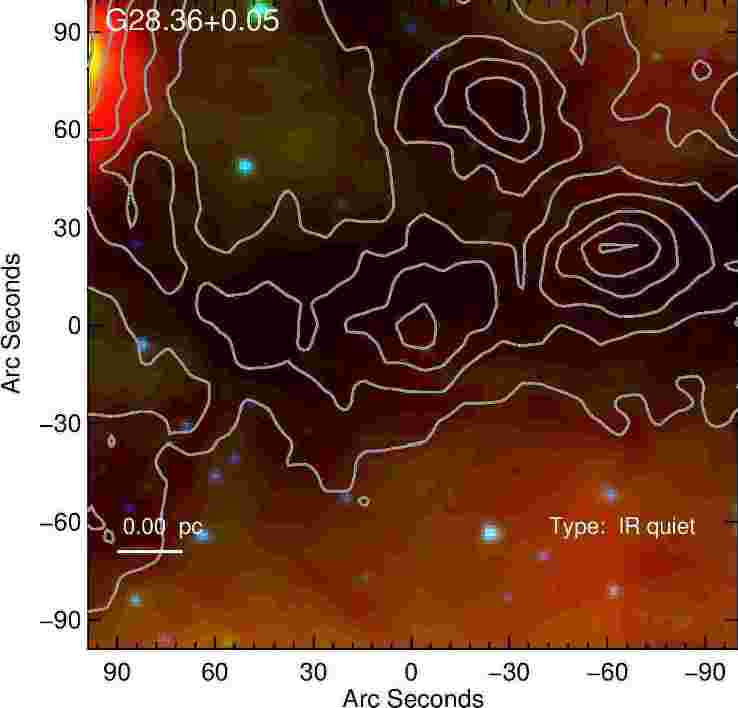
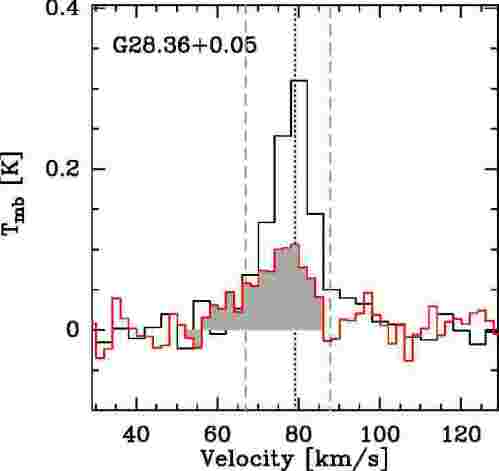
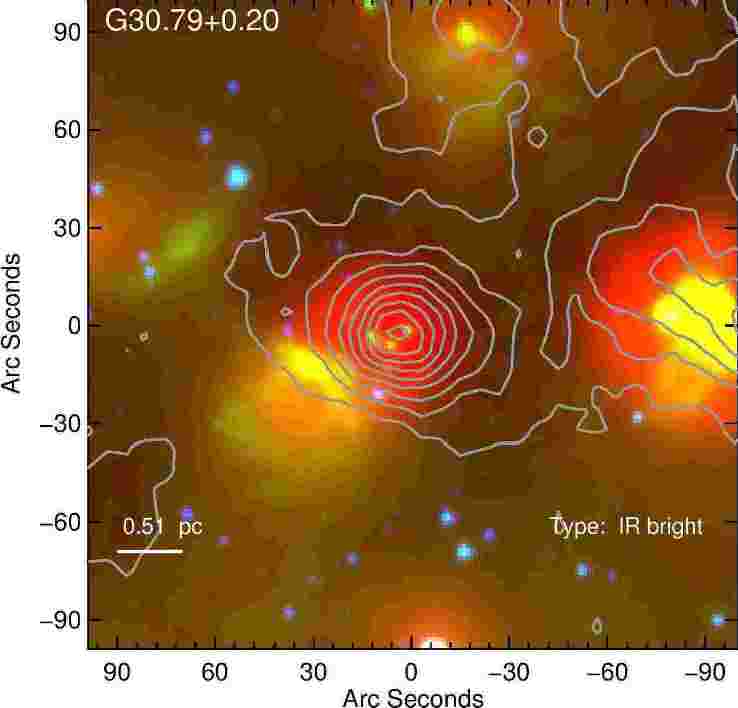
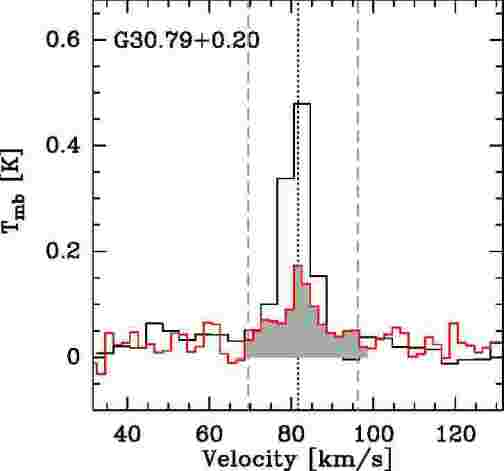
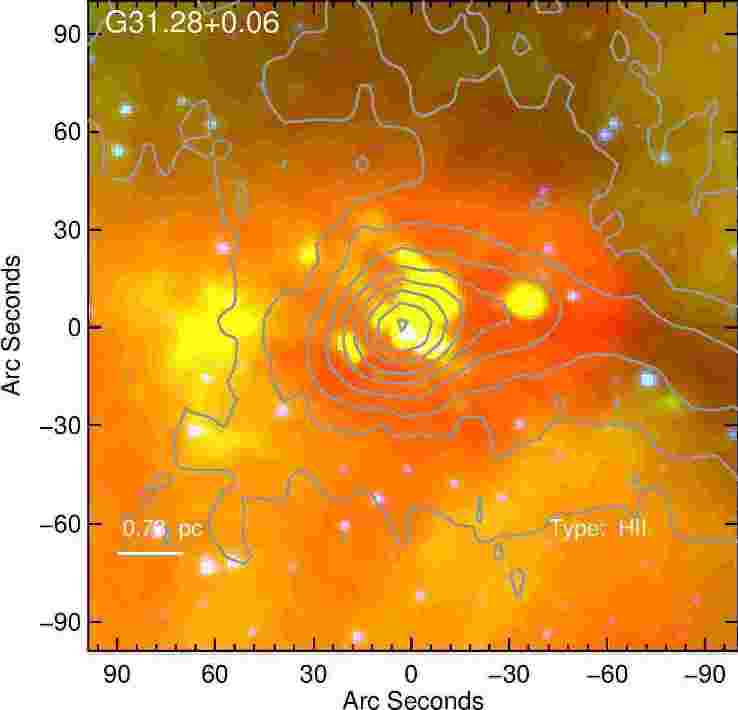
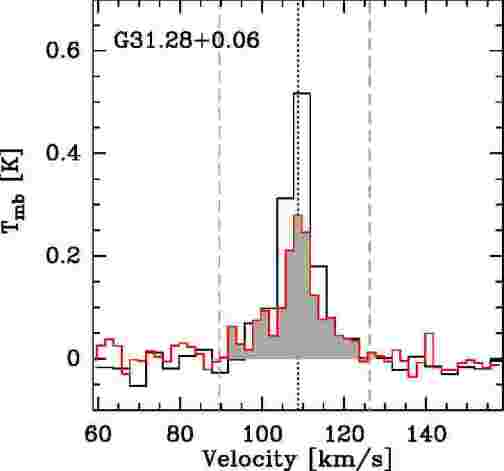
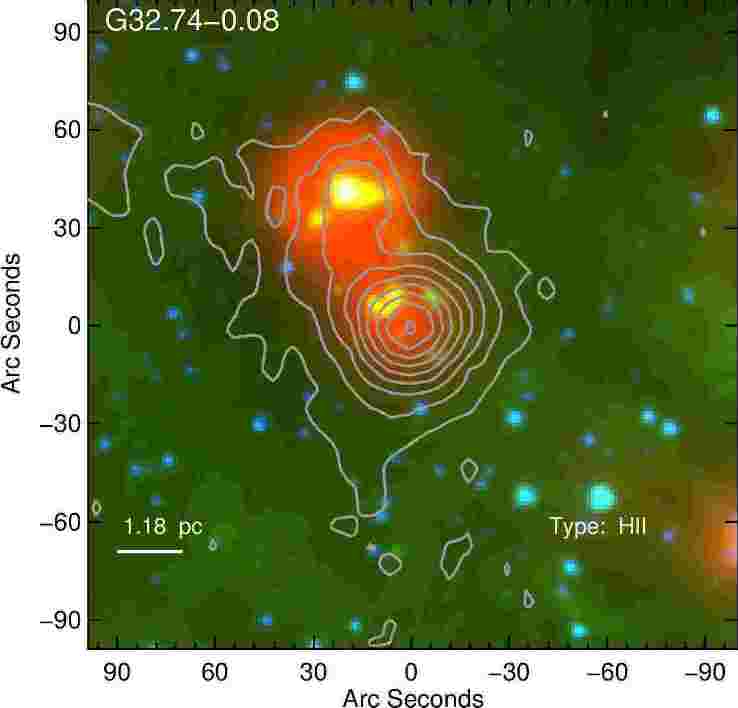
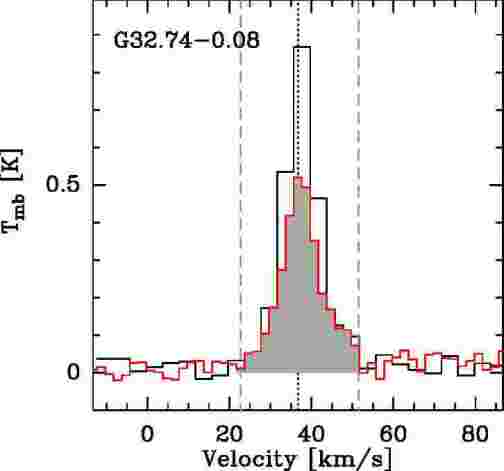
E.2 Spectra of sources observed only in the SiO () transition
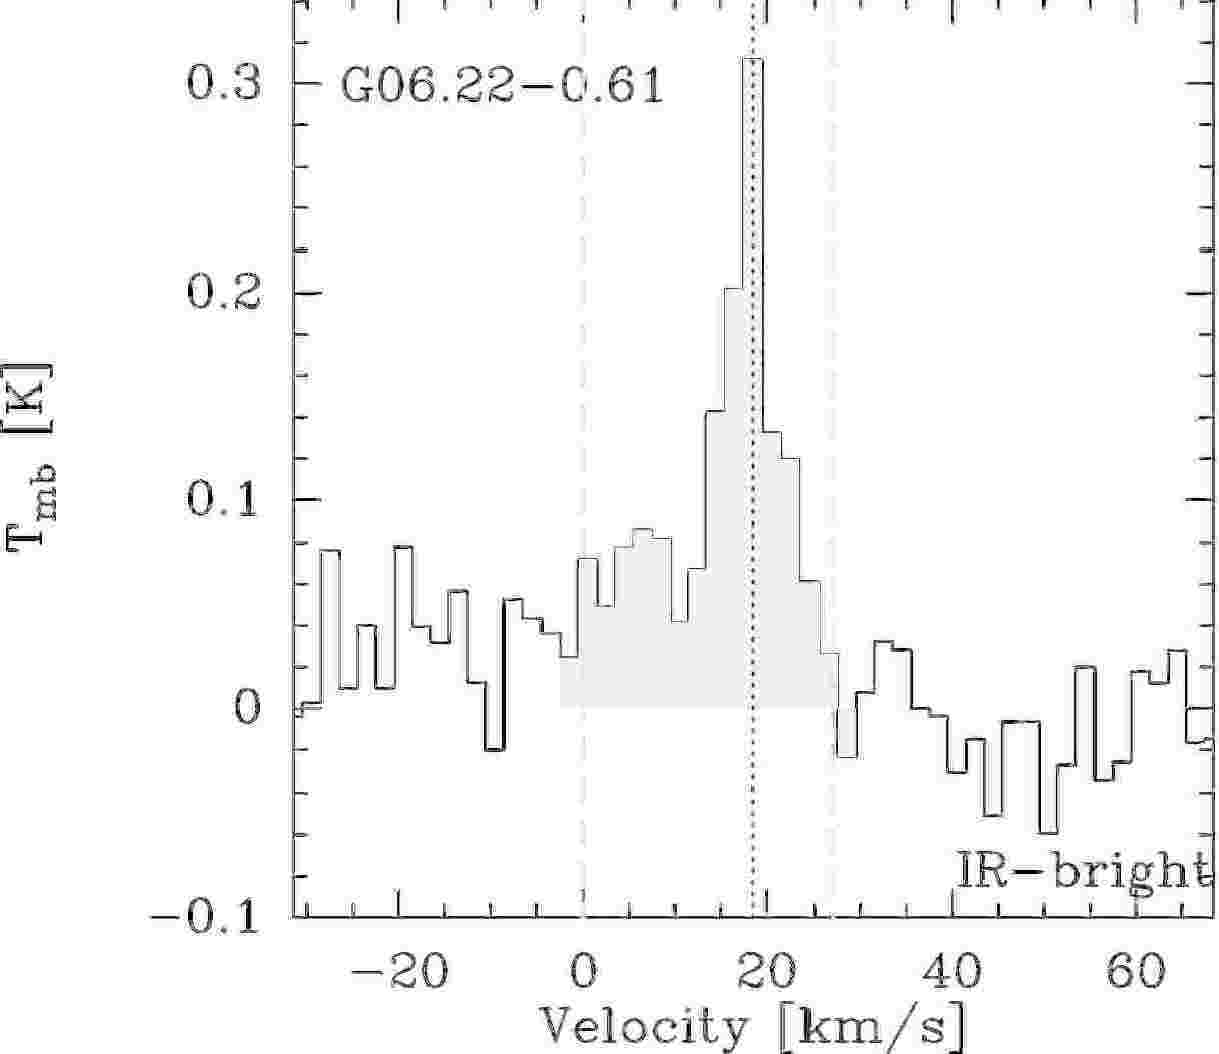
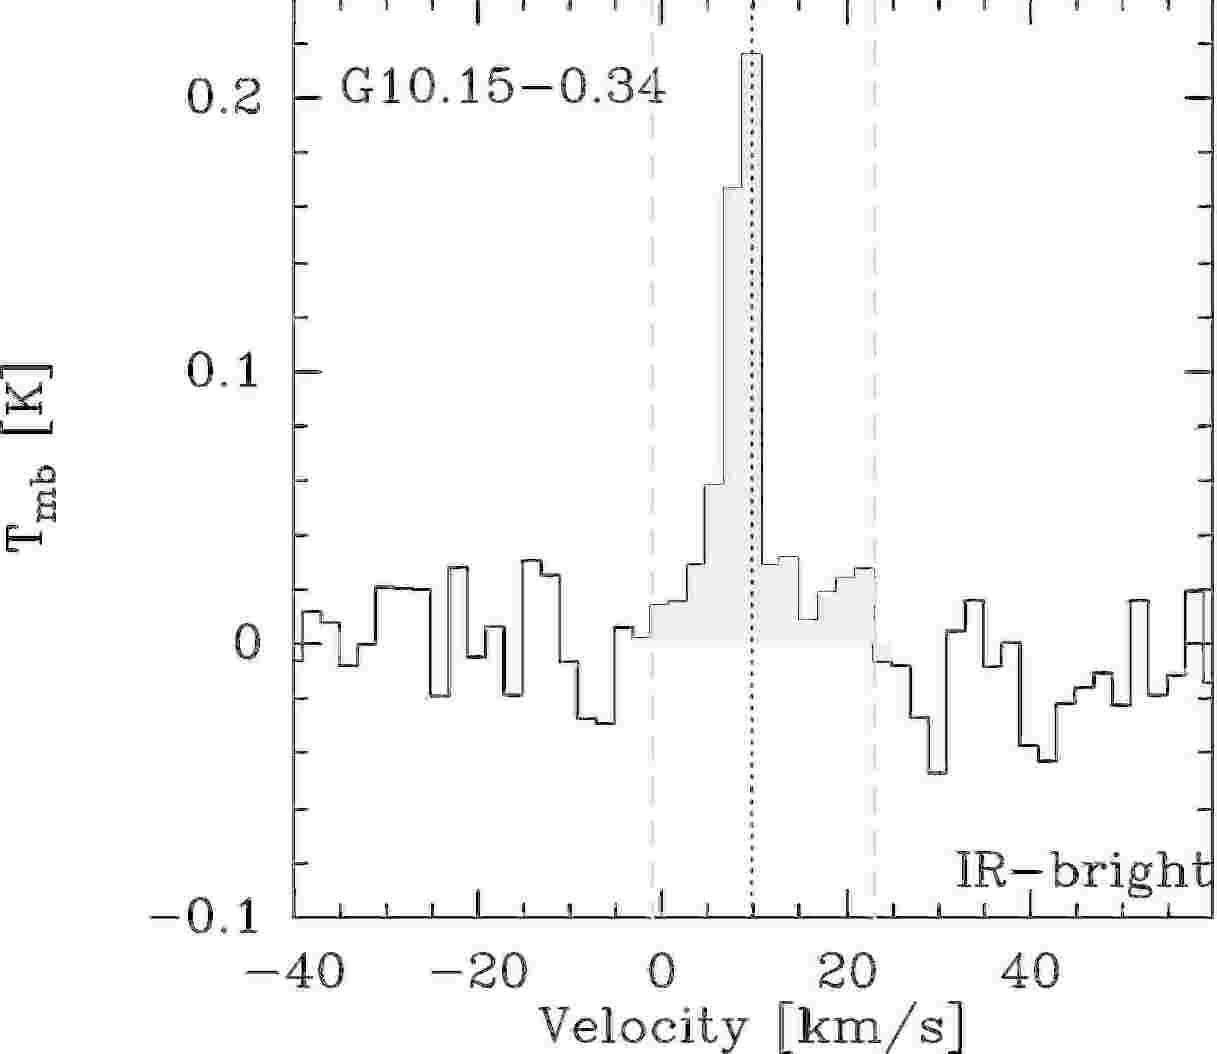
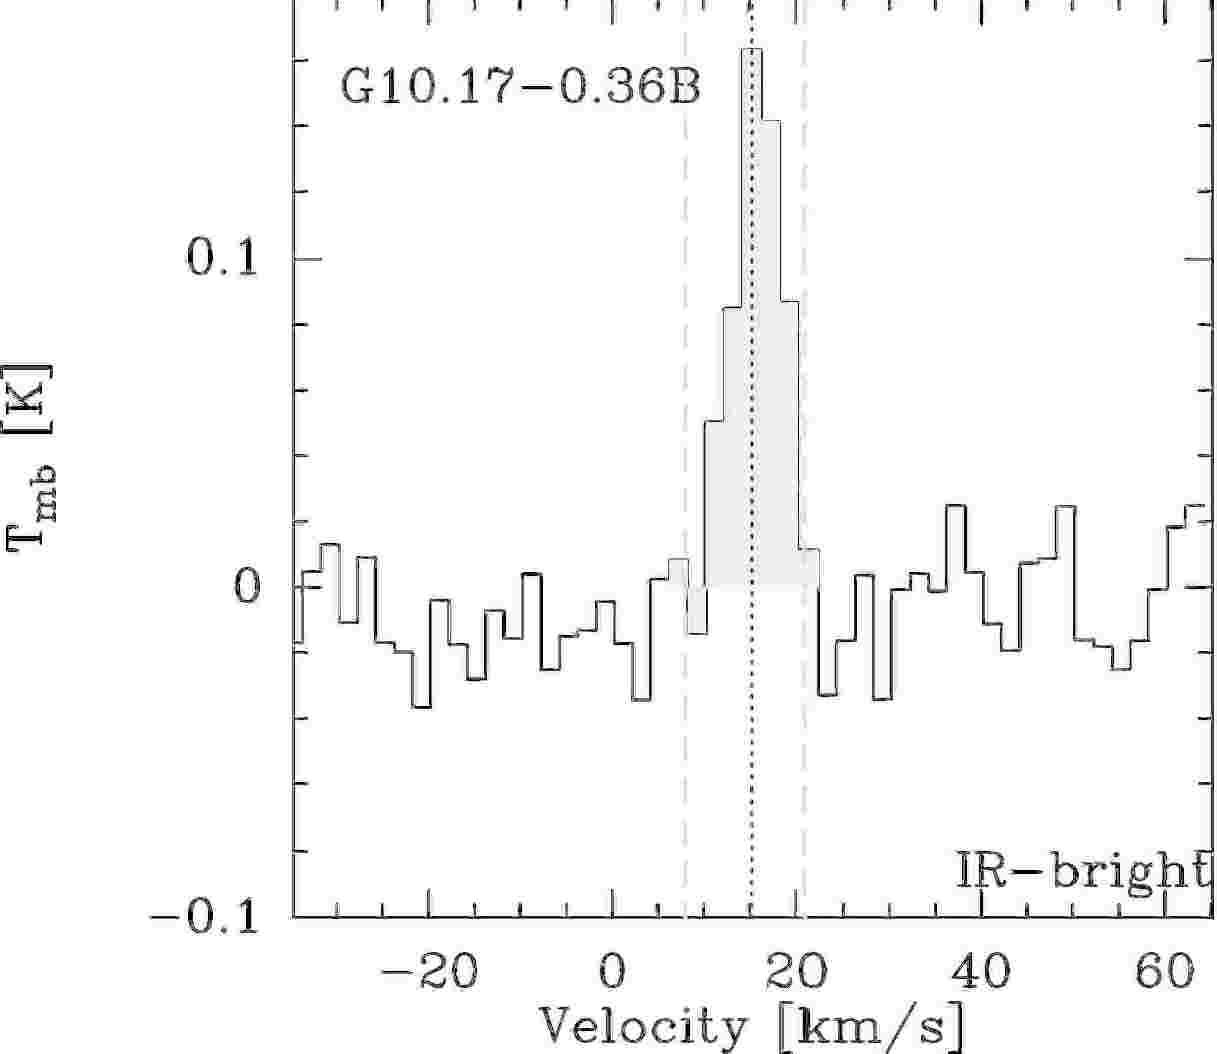
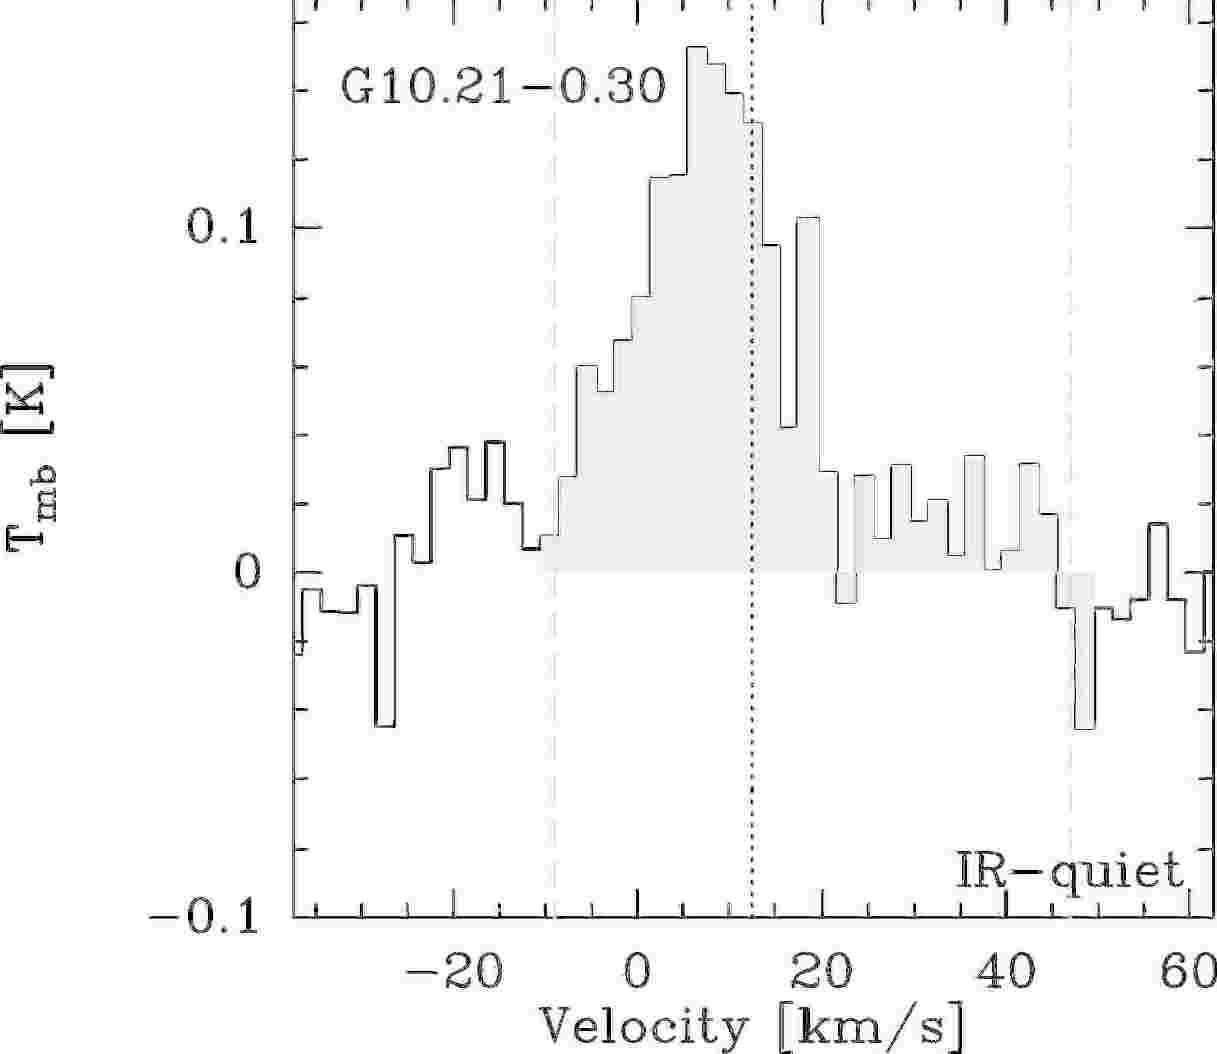
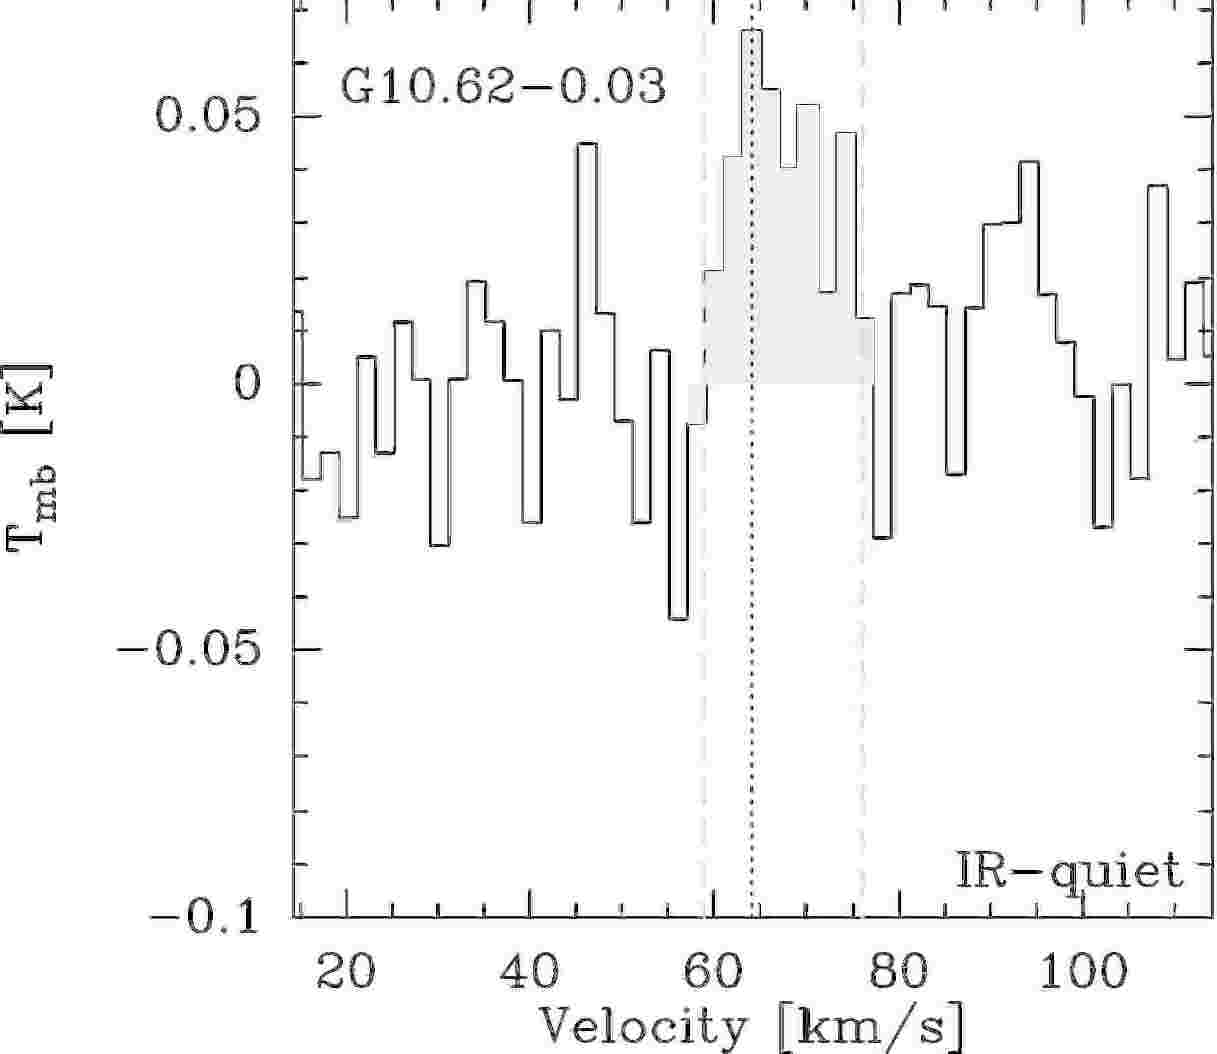
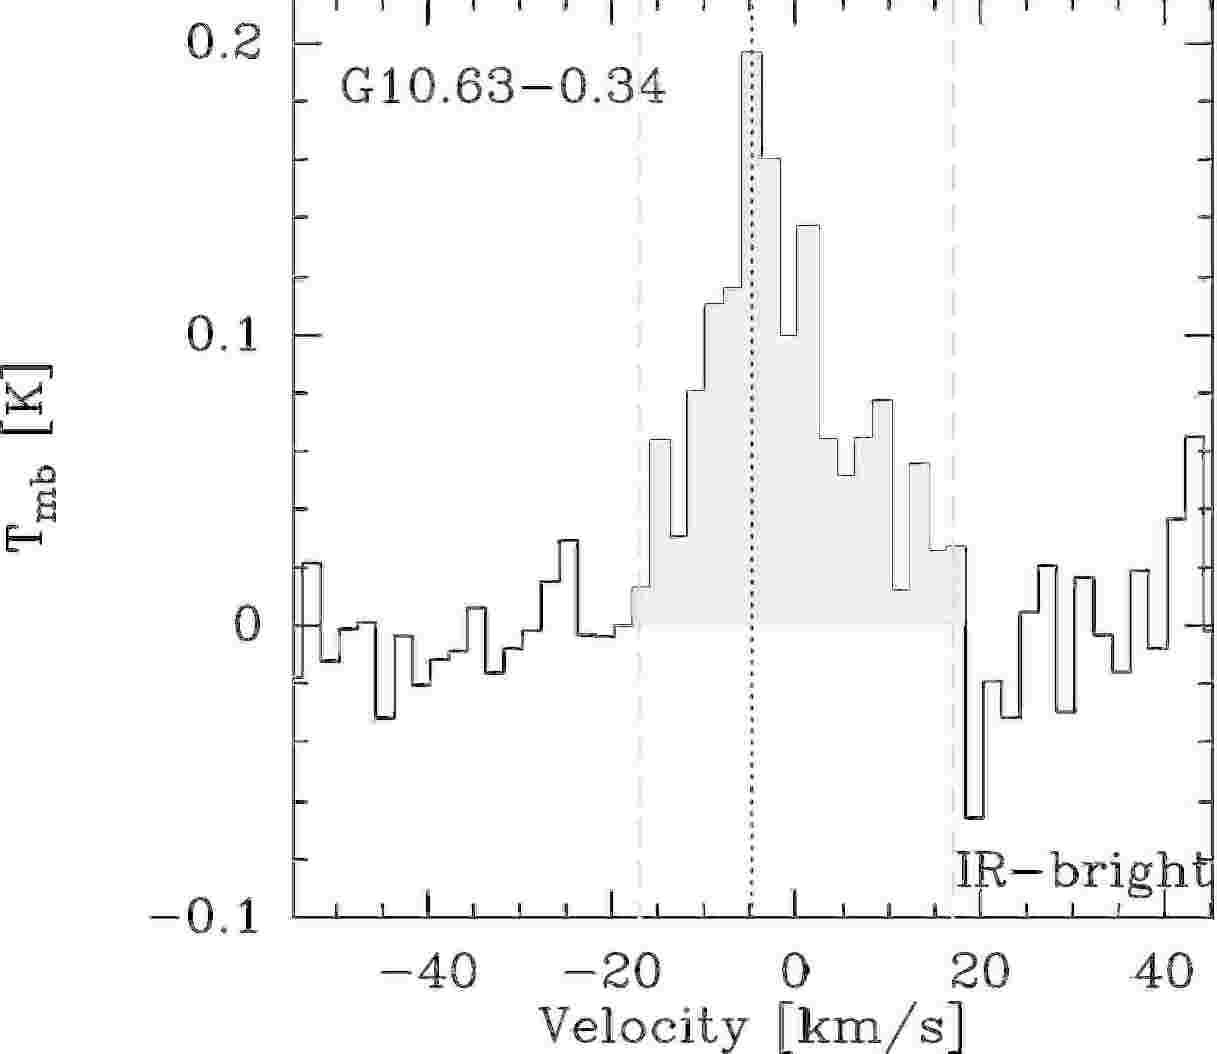
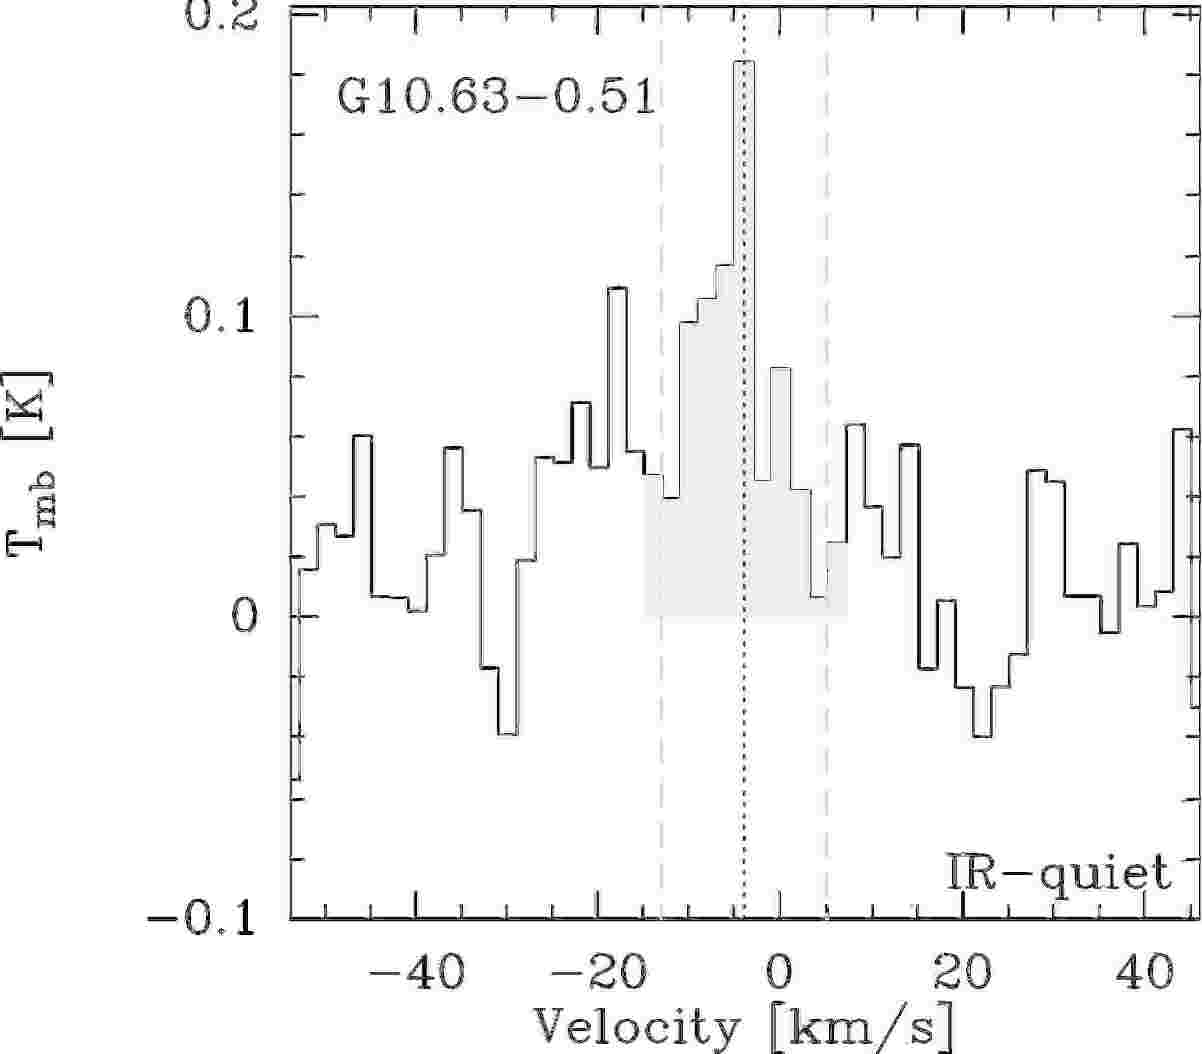
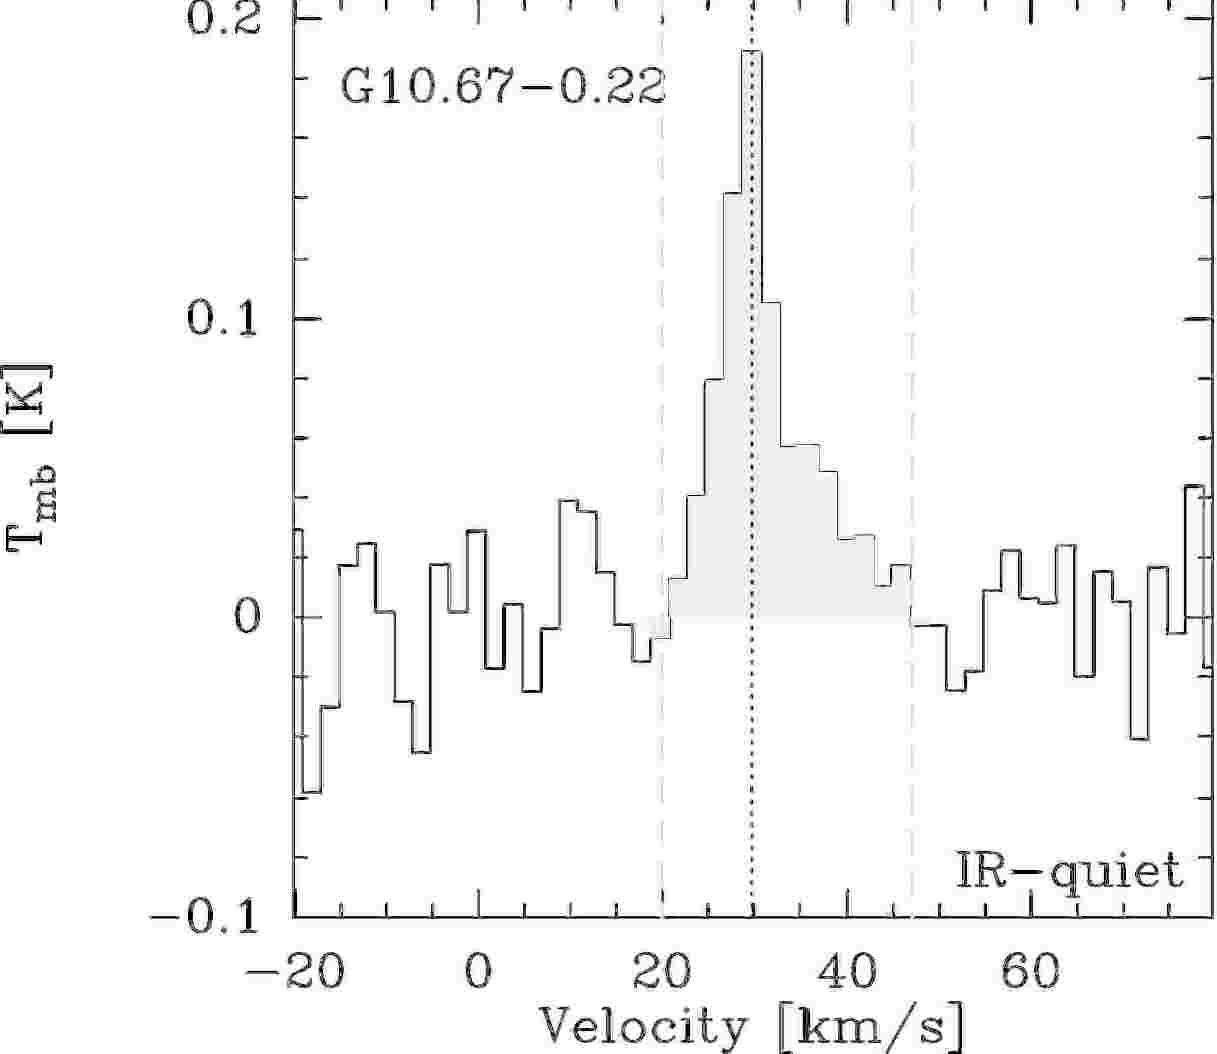
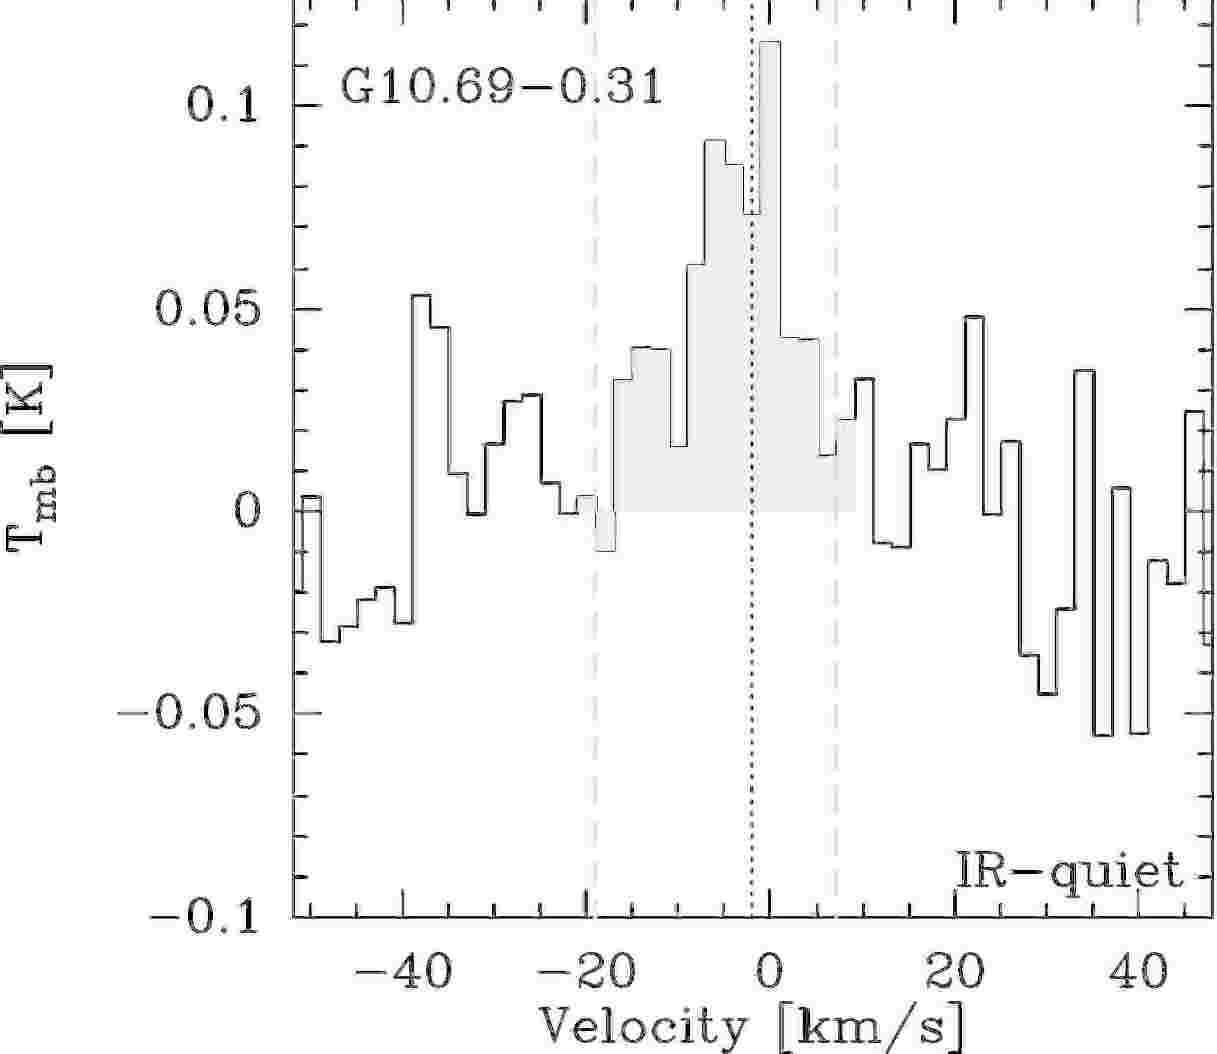
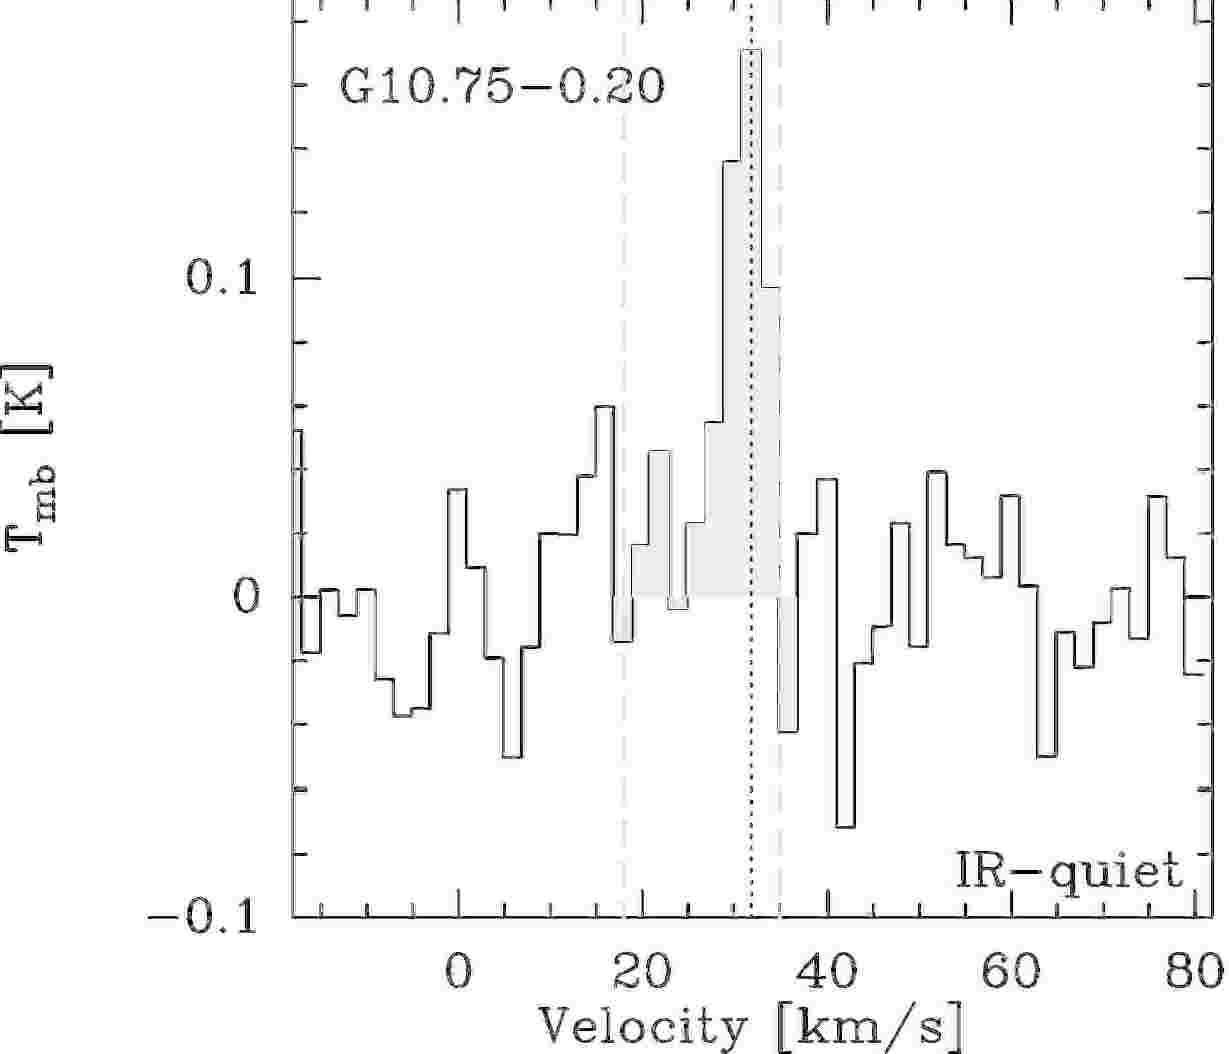
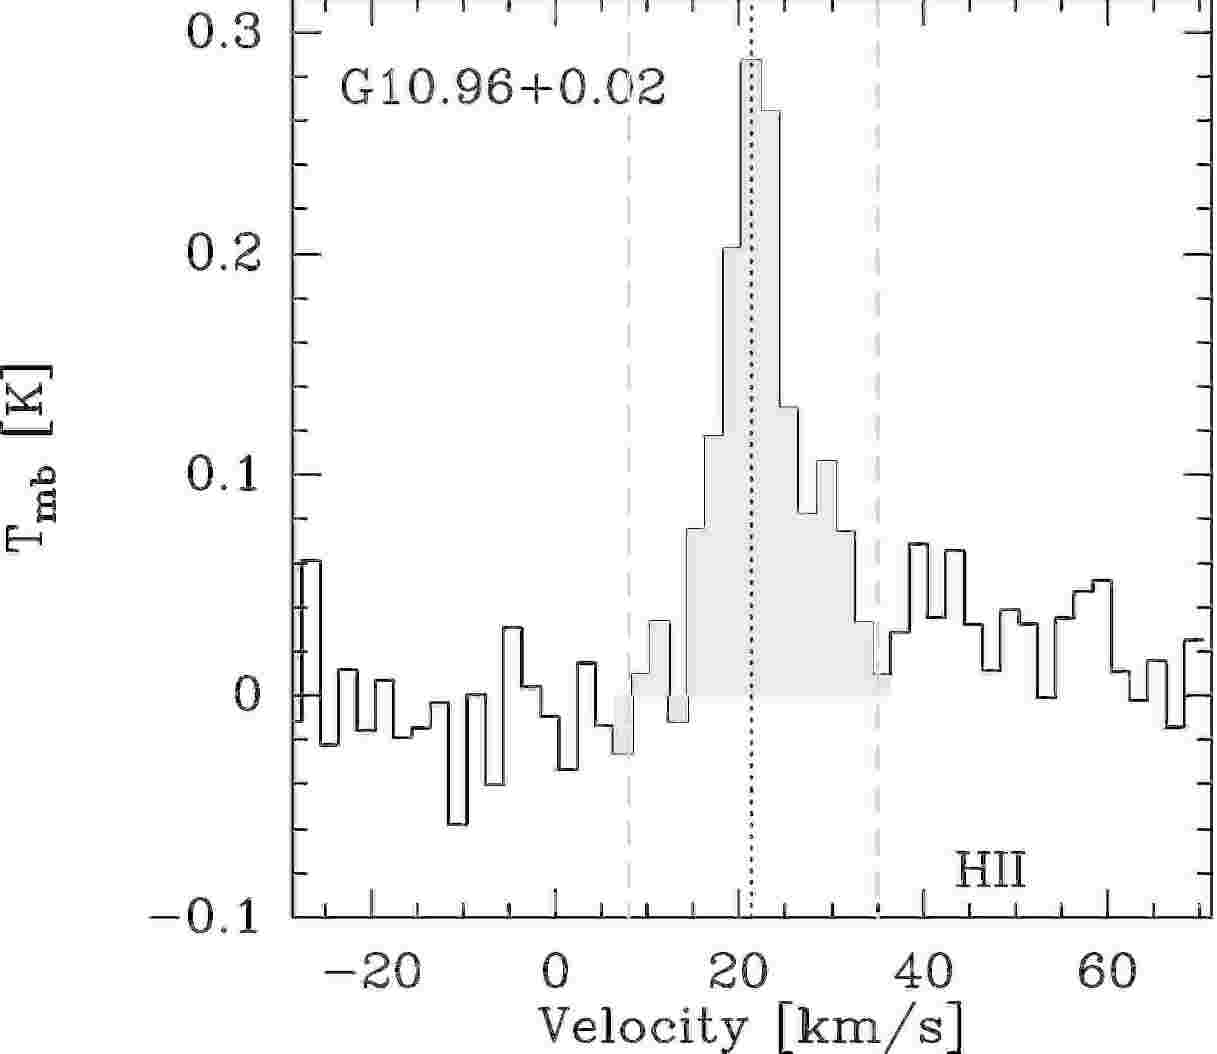
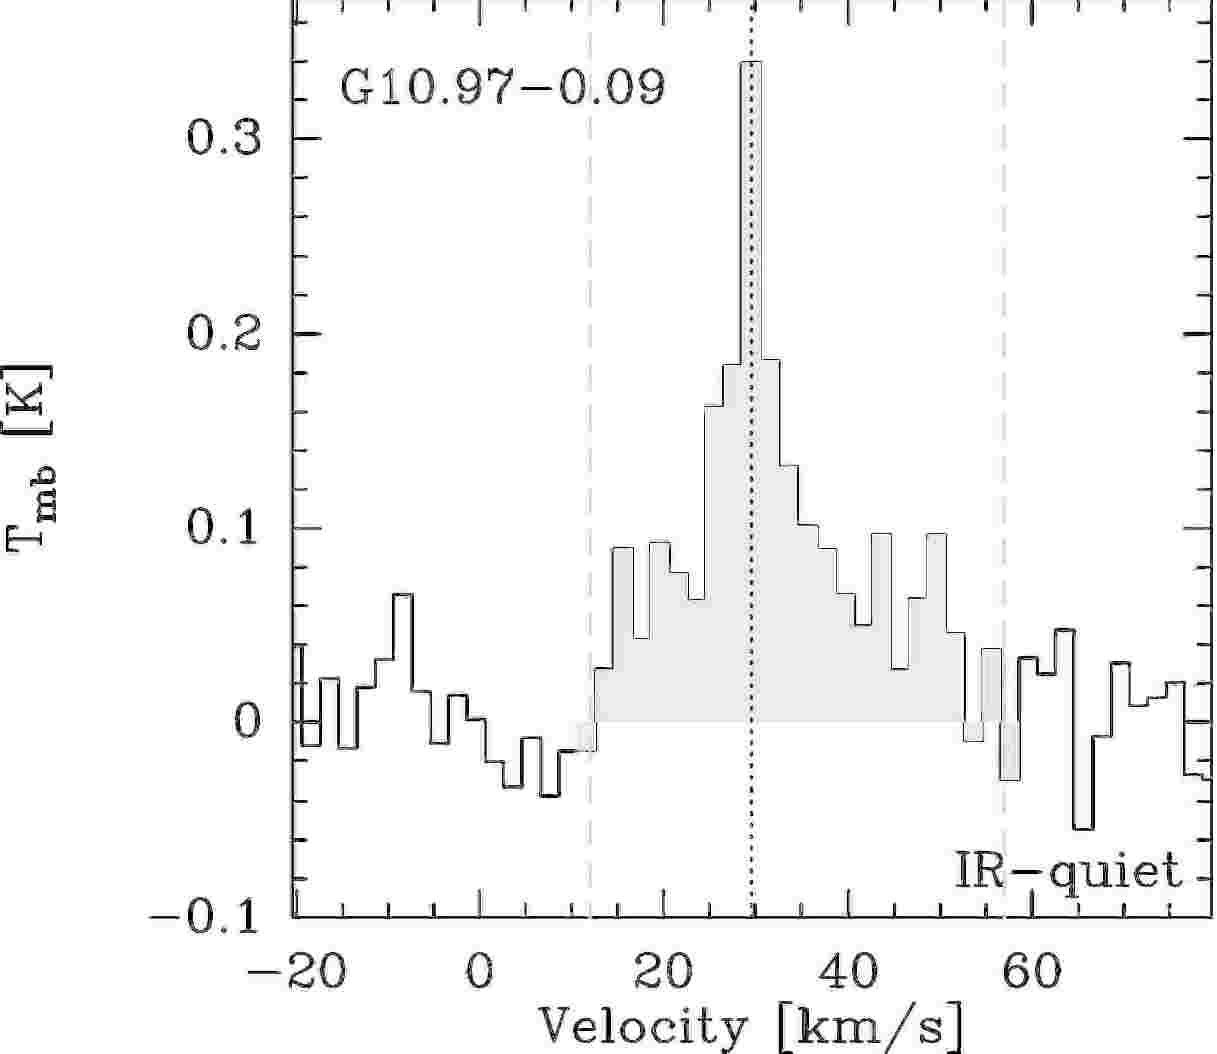
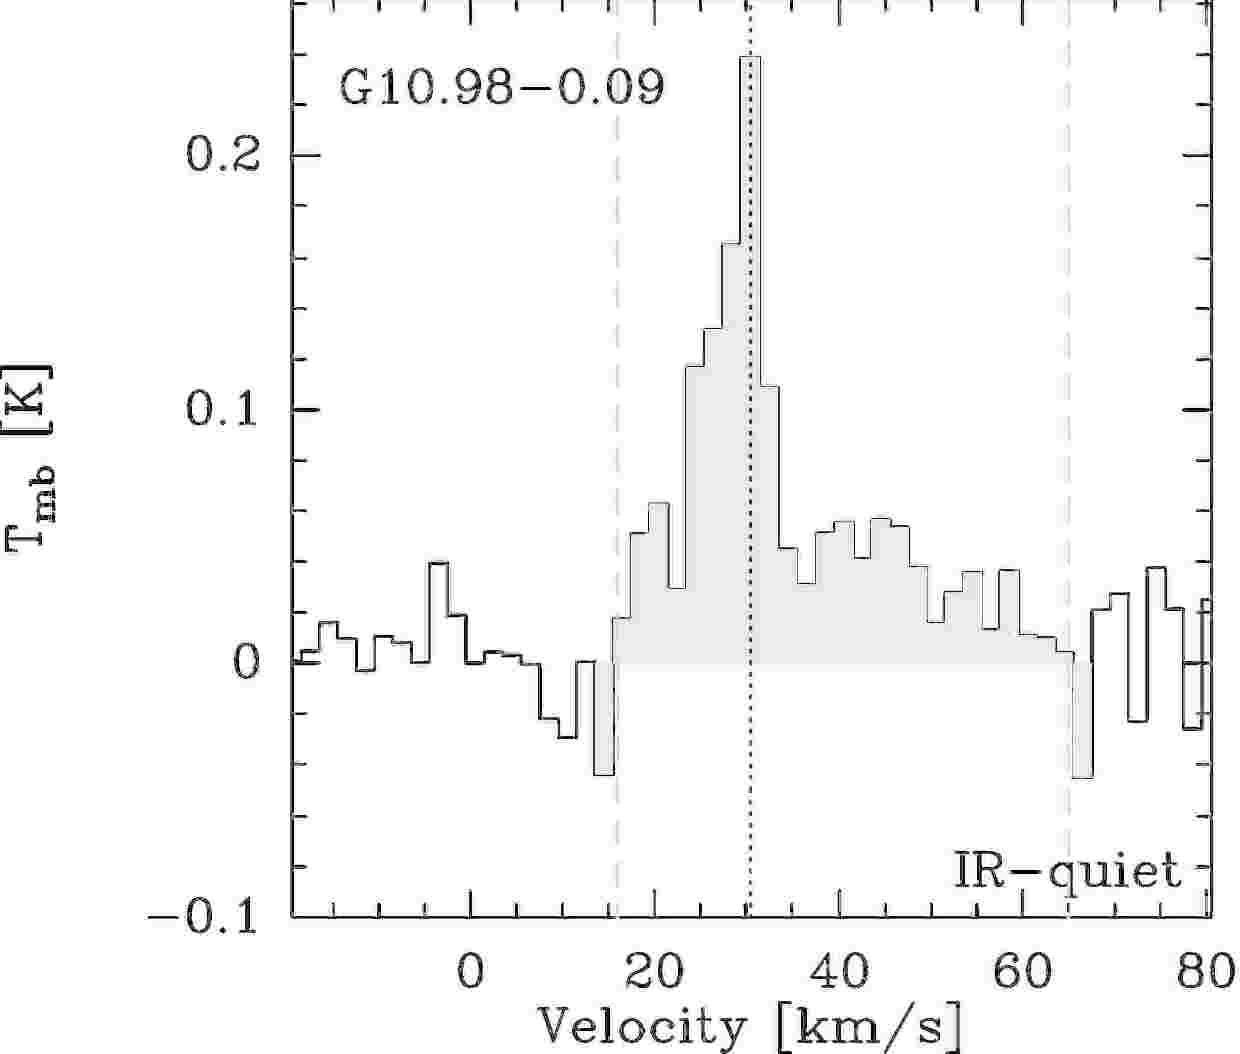
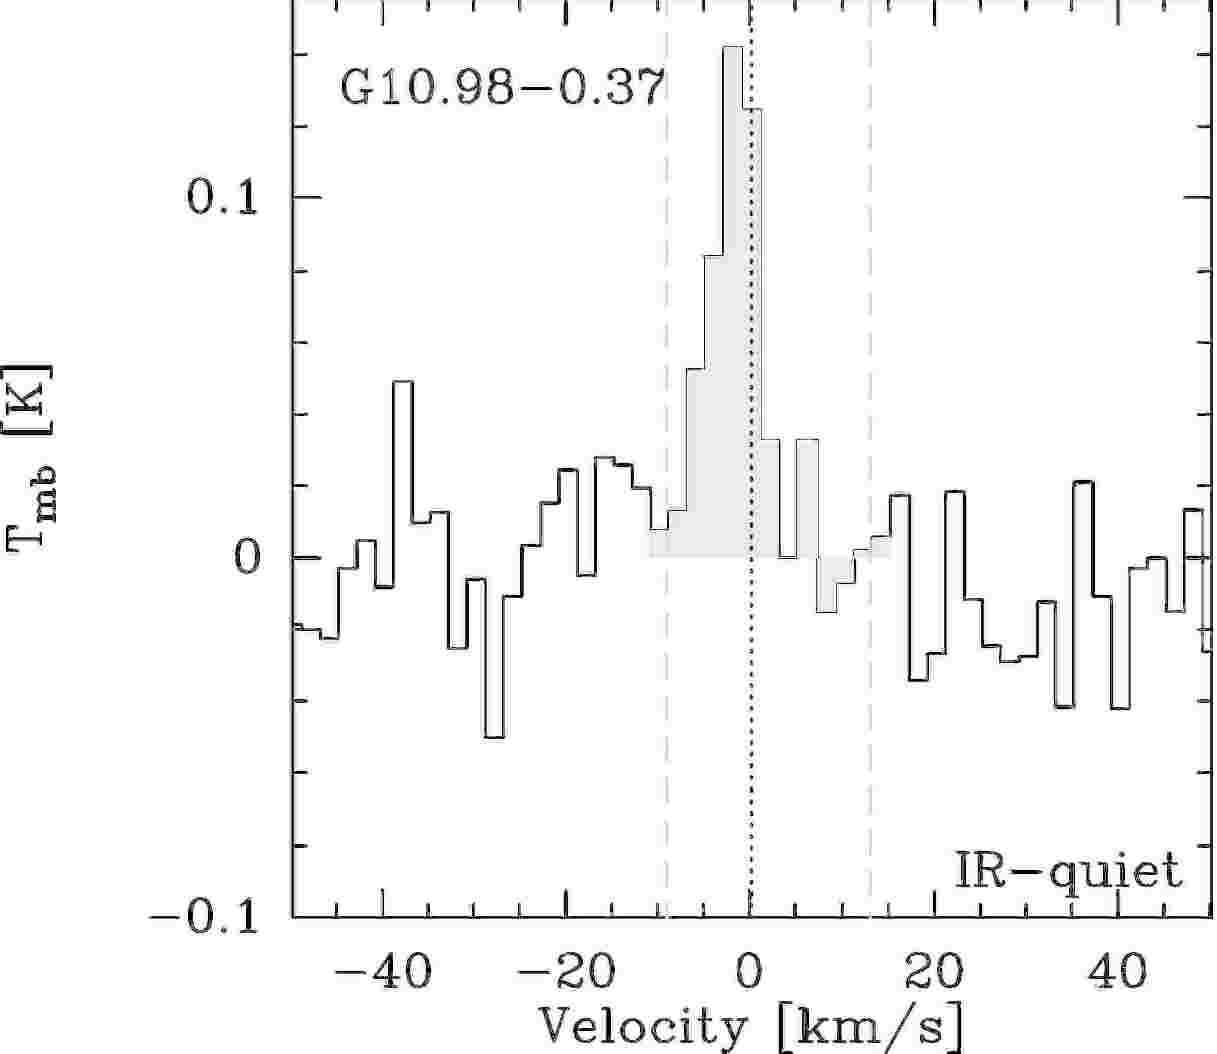
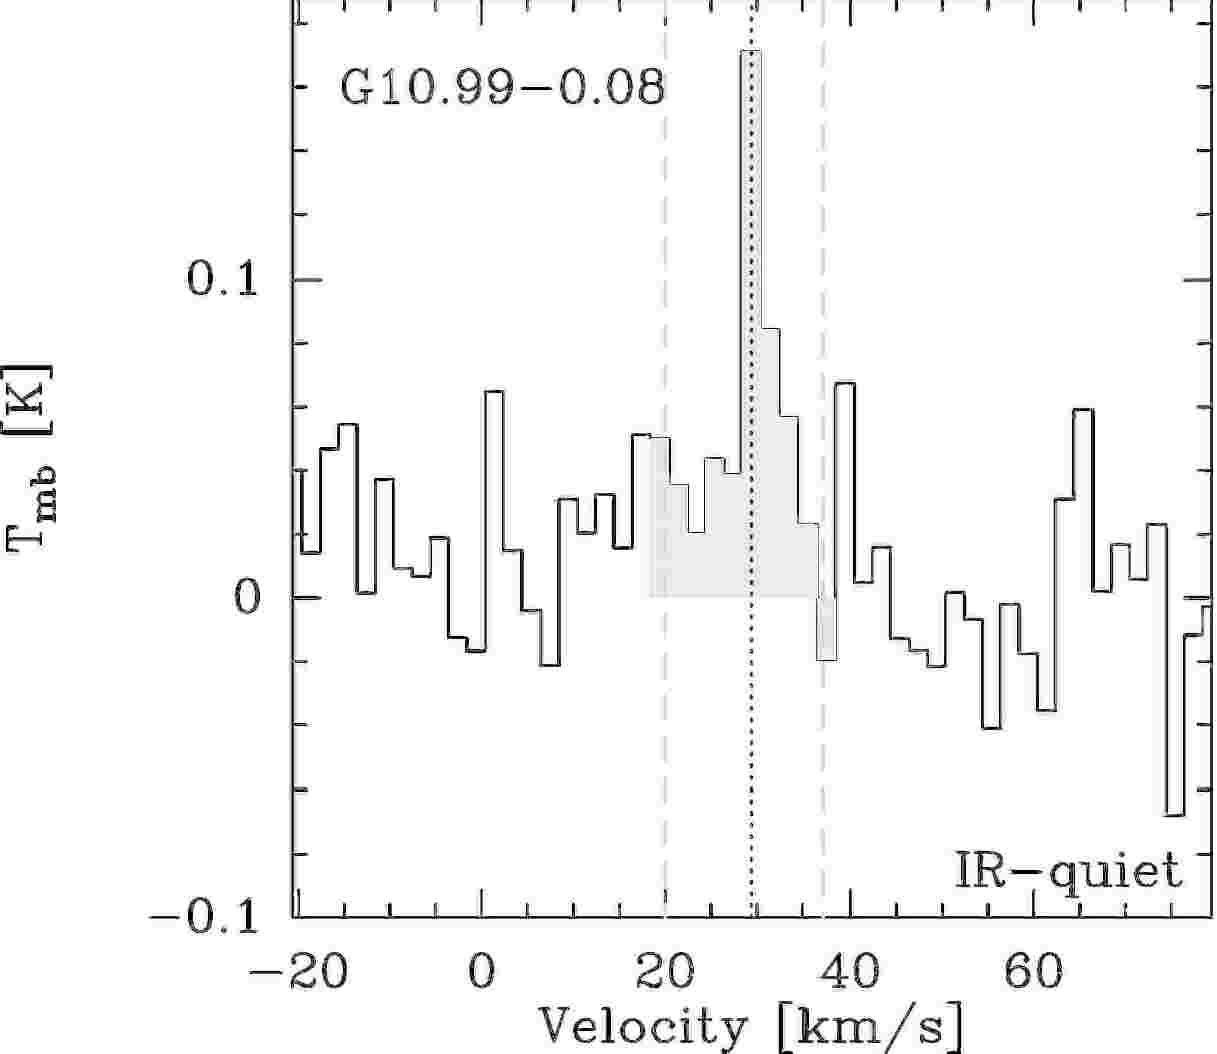
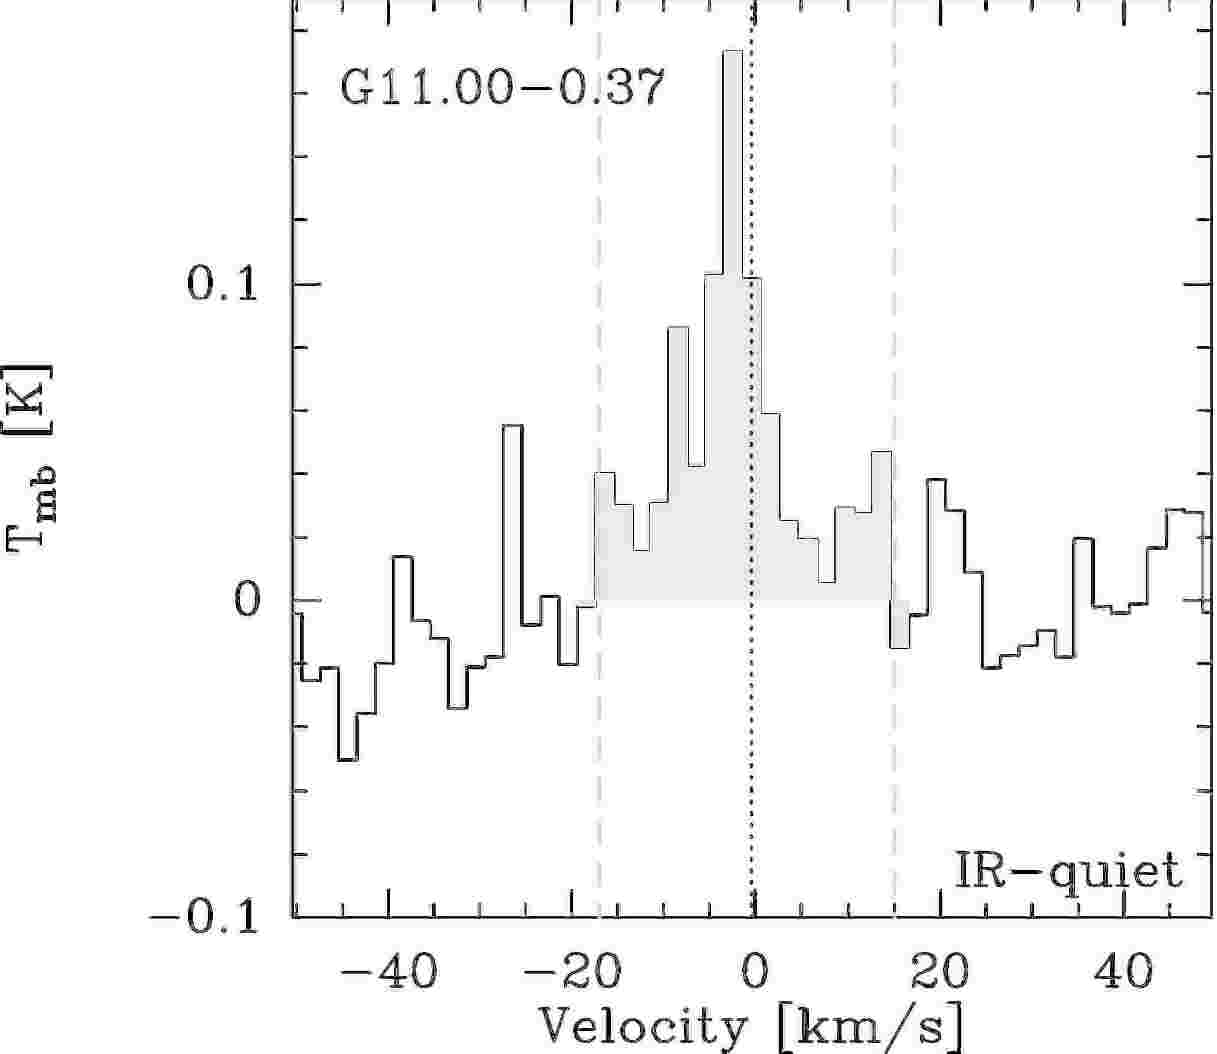
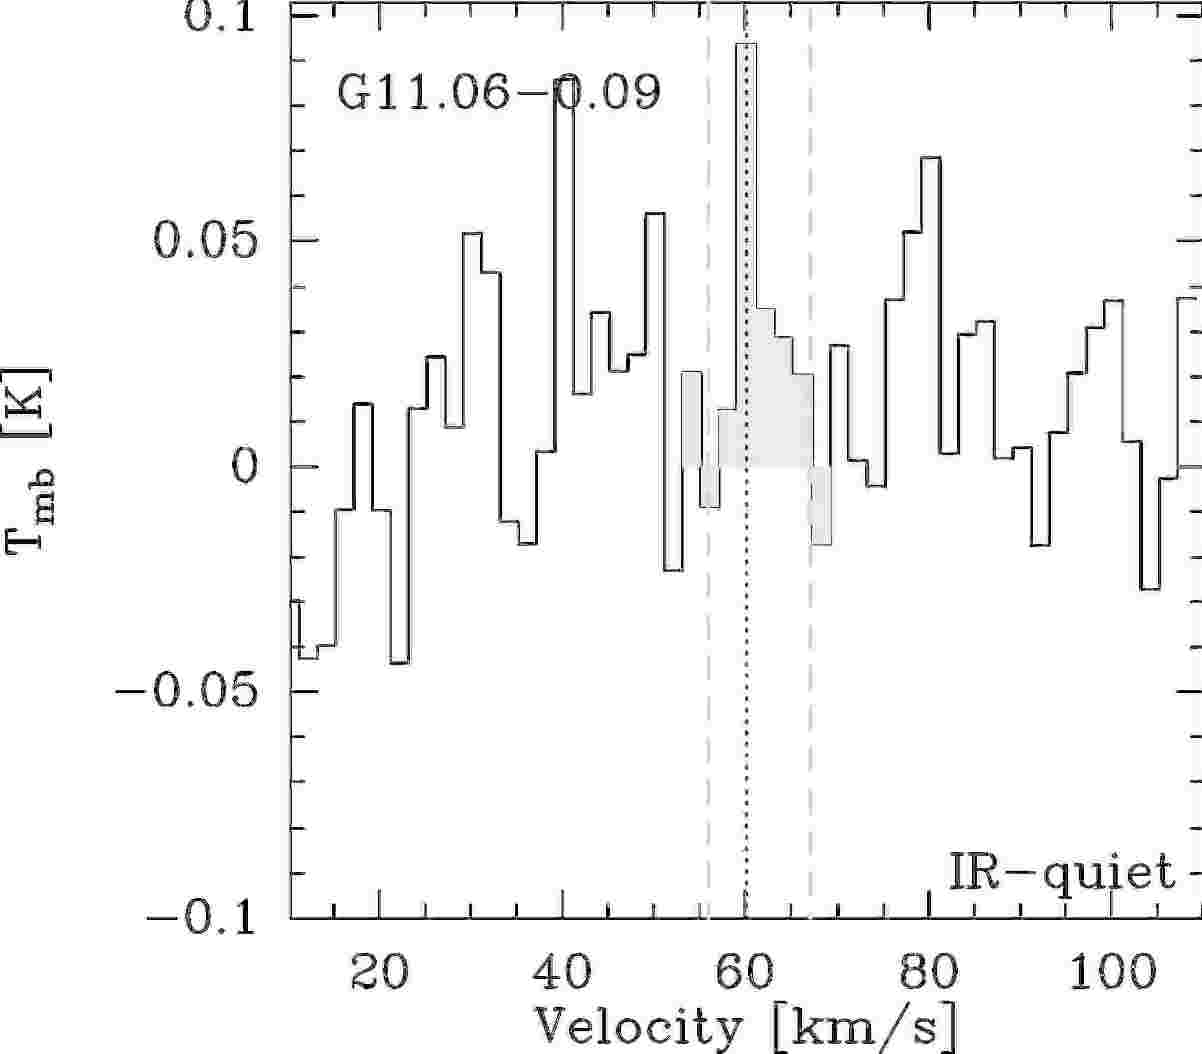
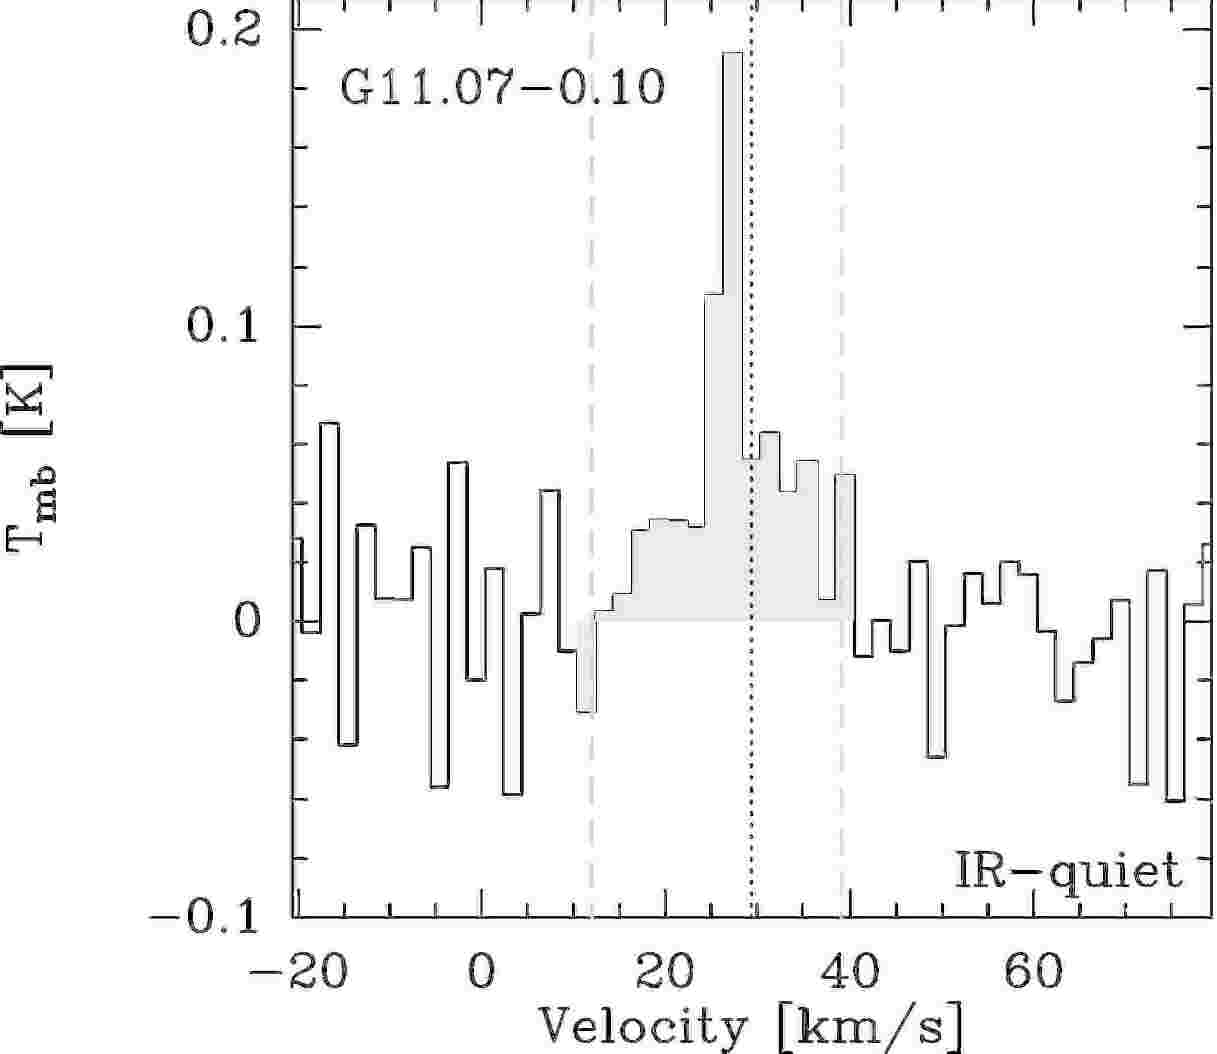
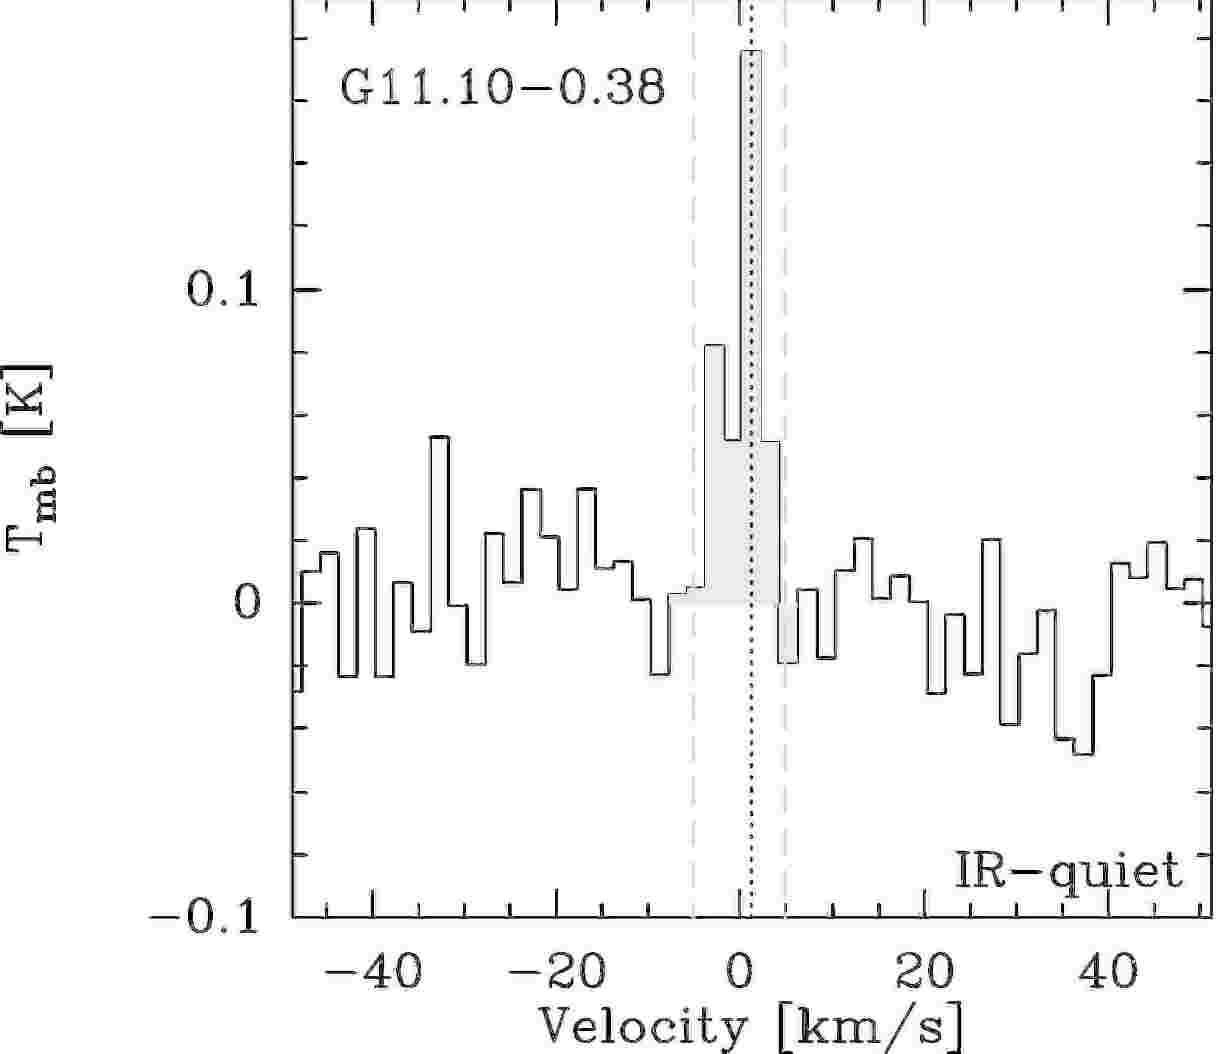
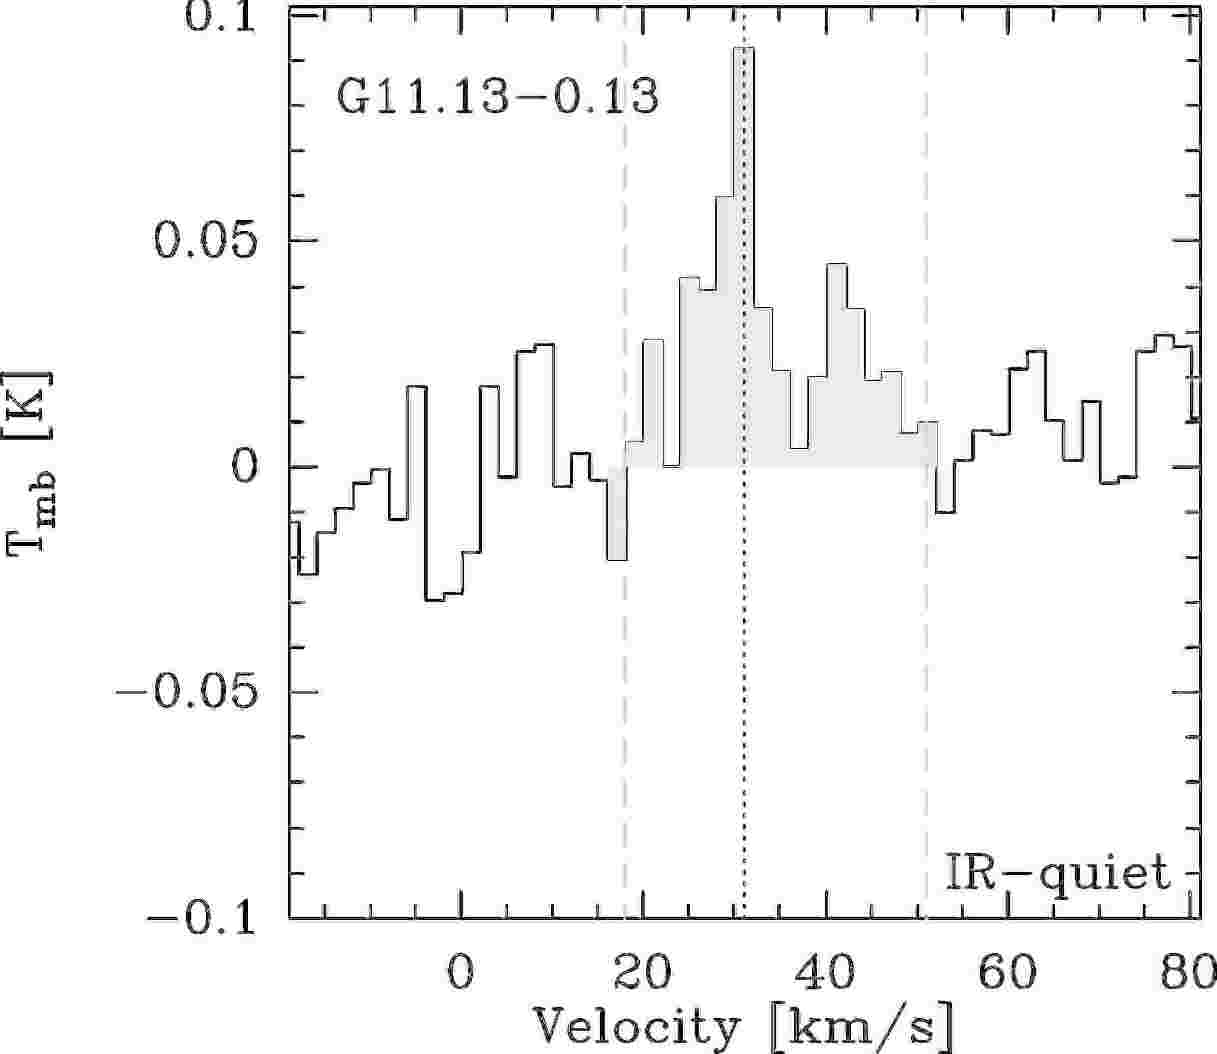
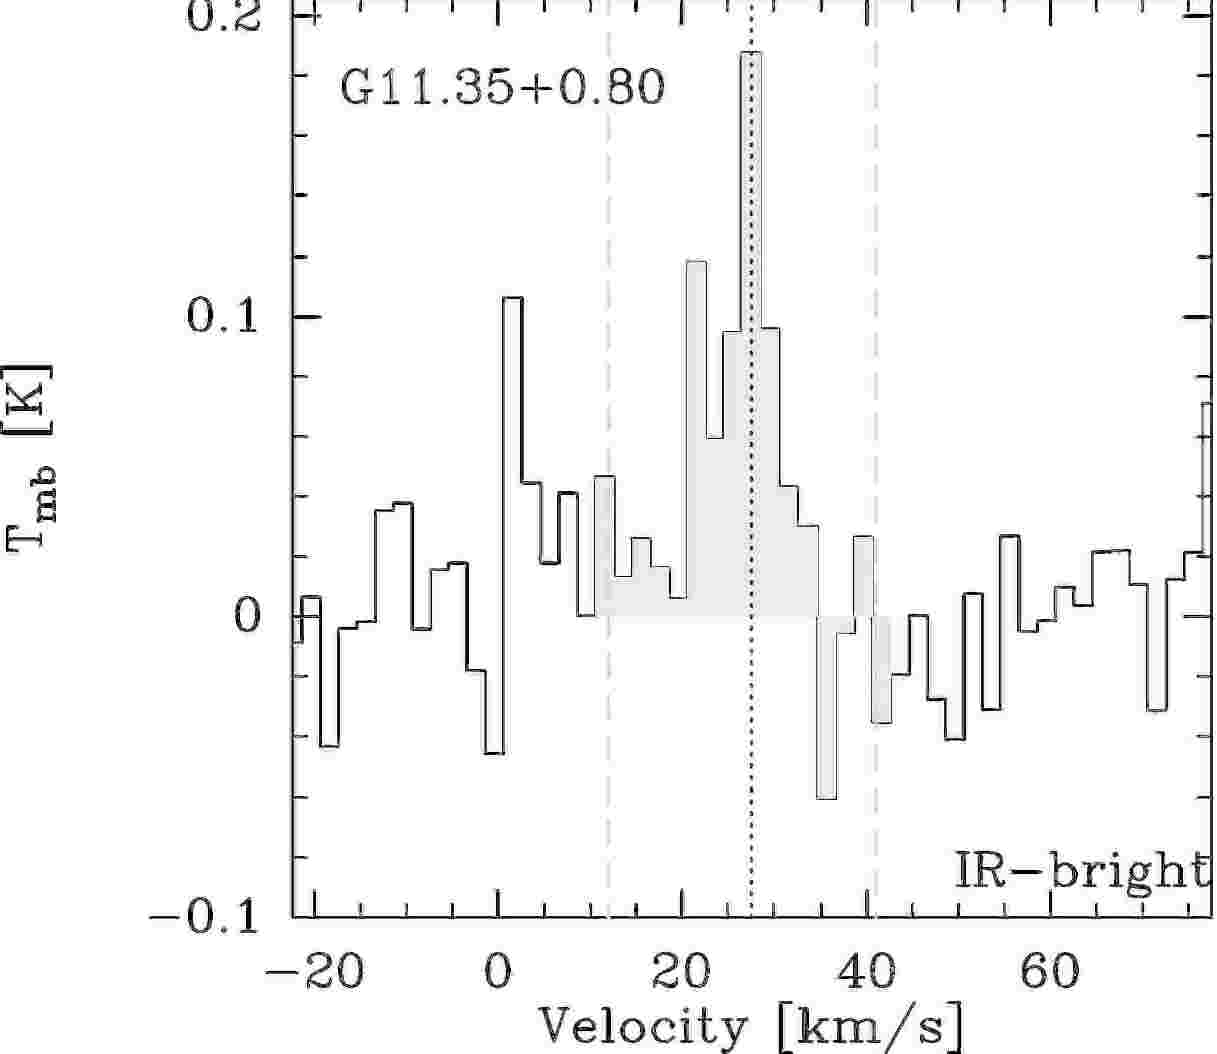
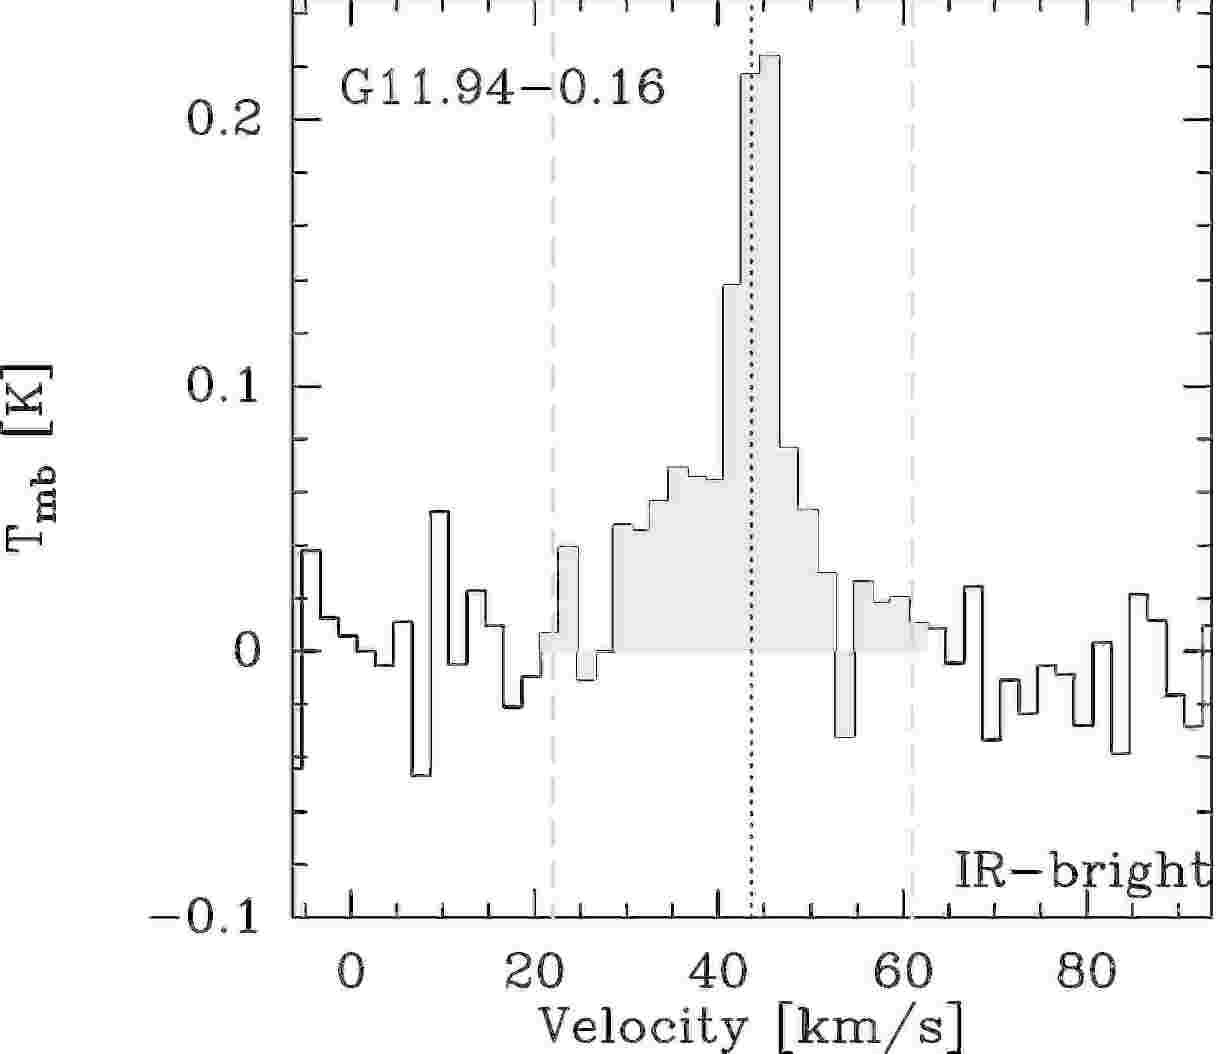
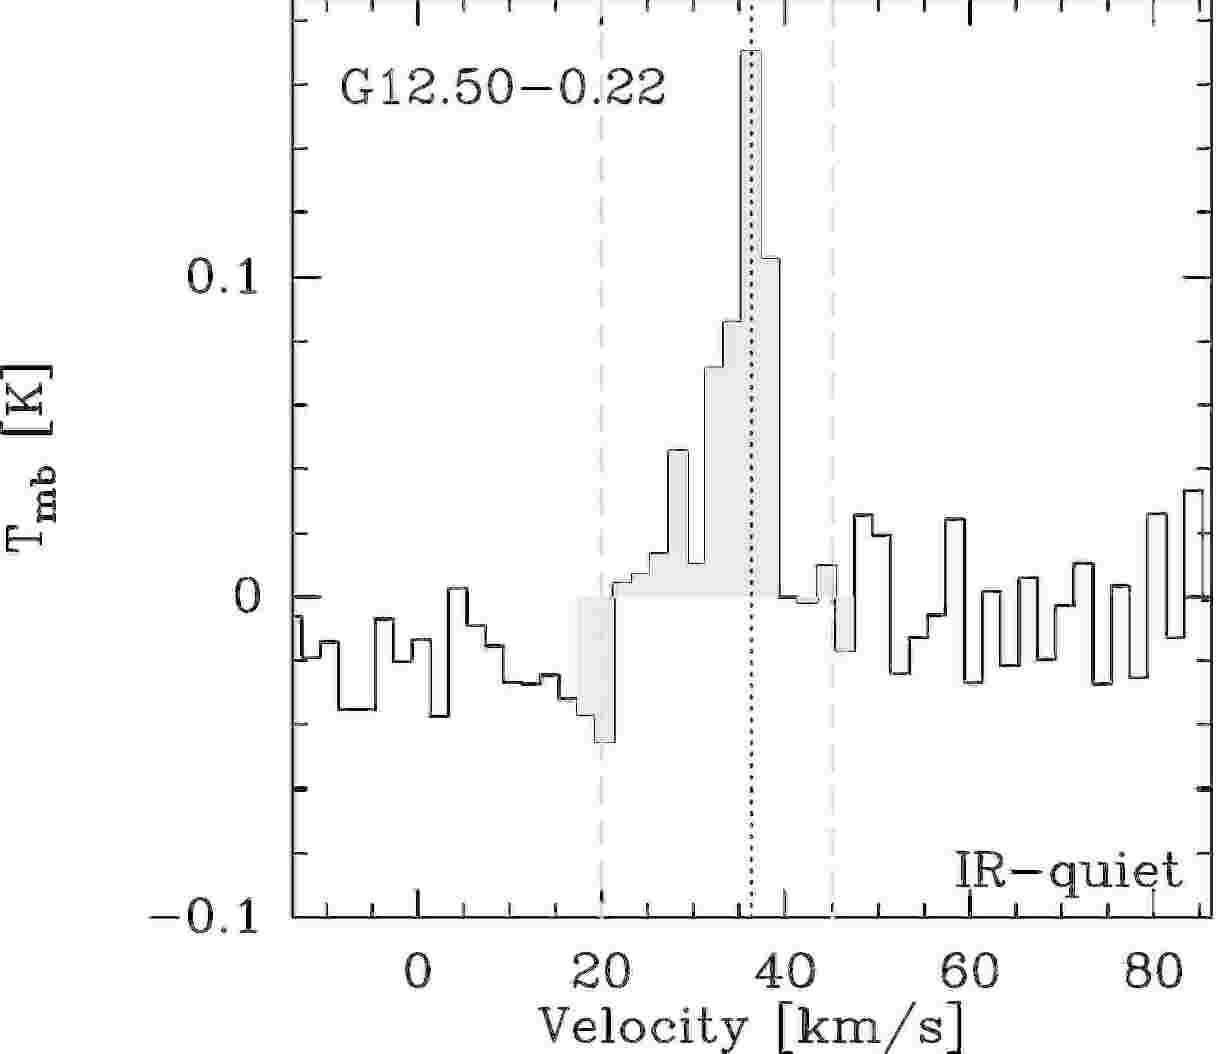
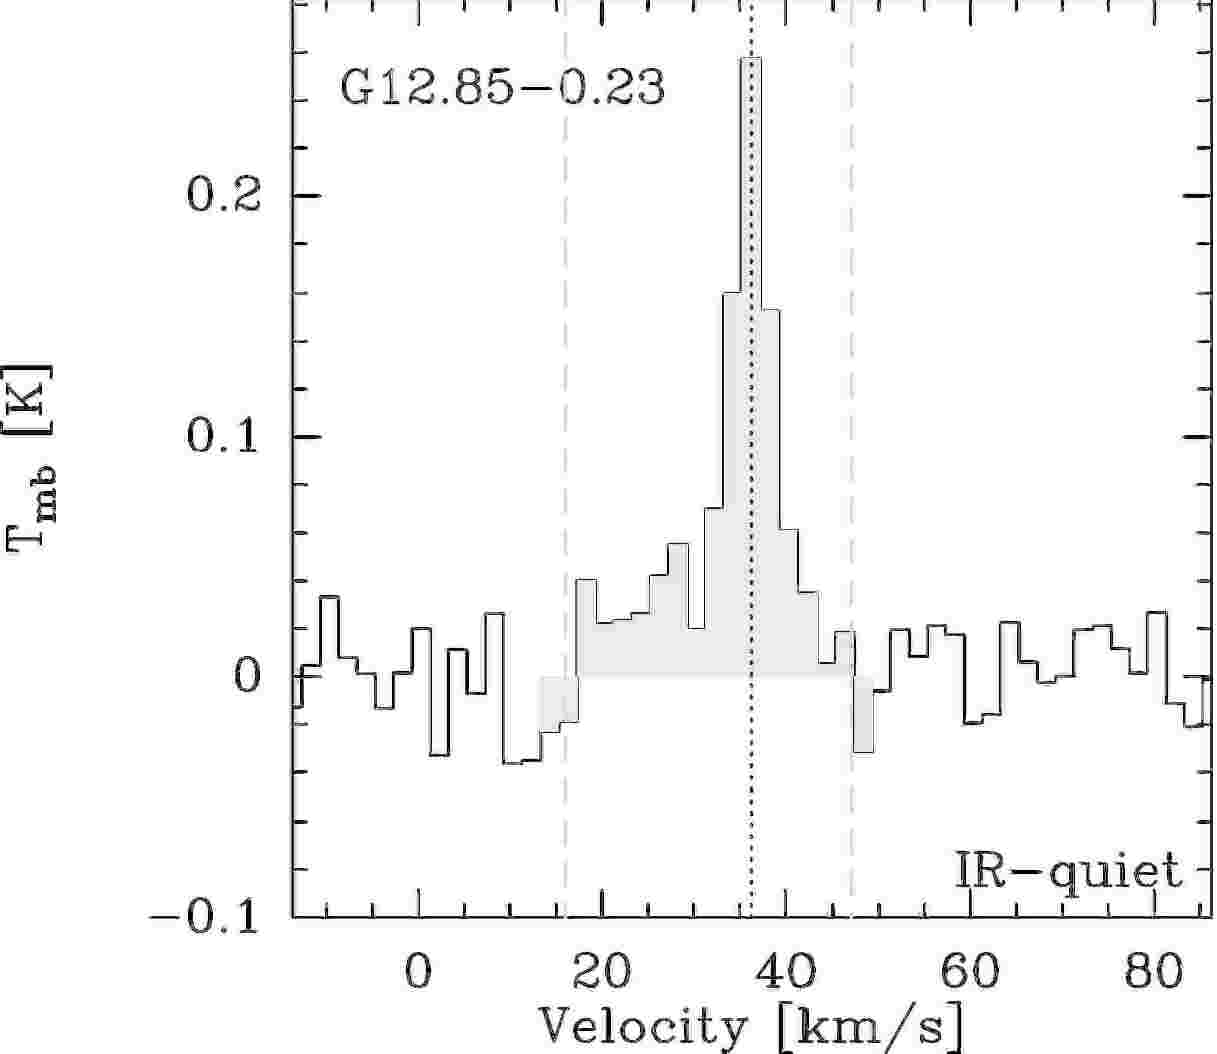
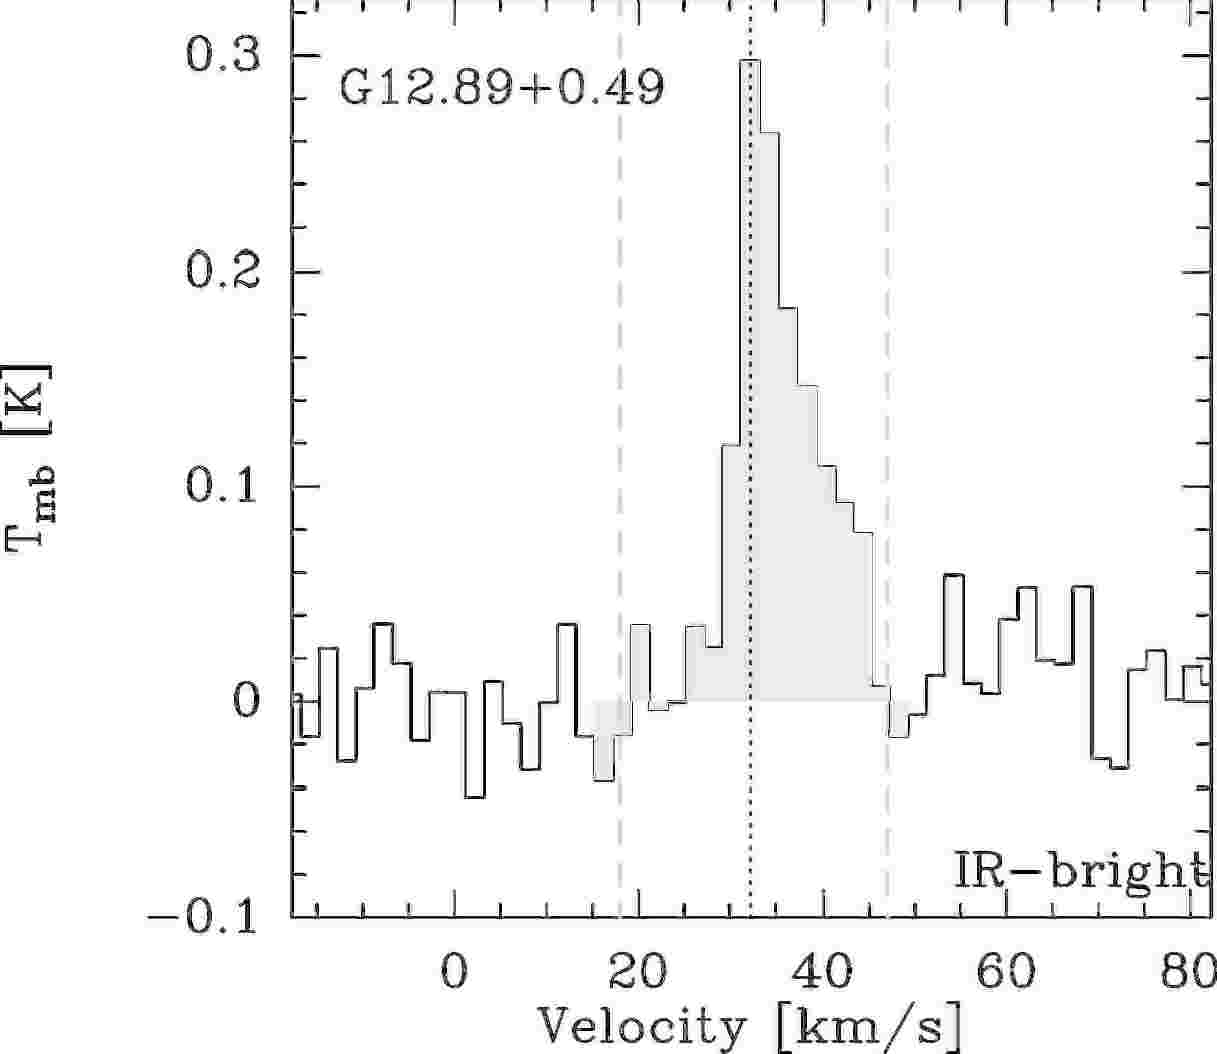
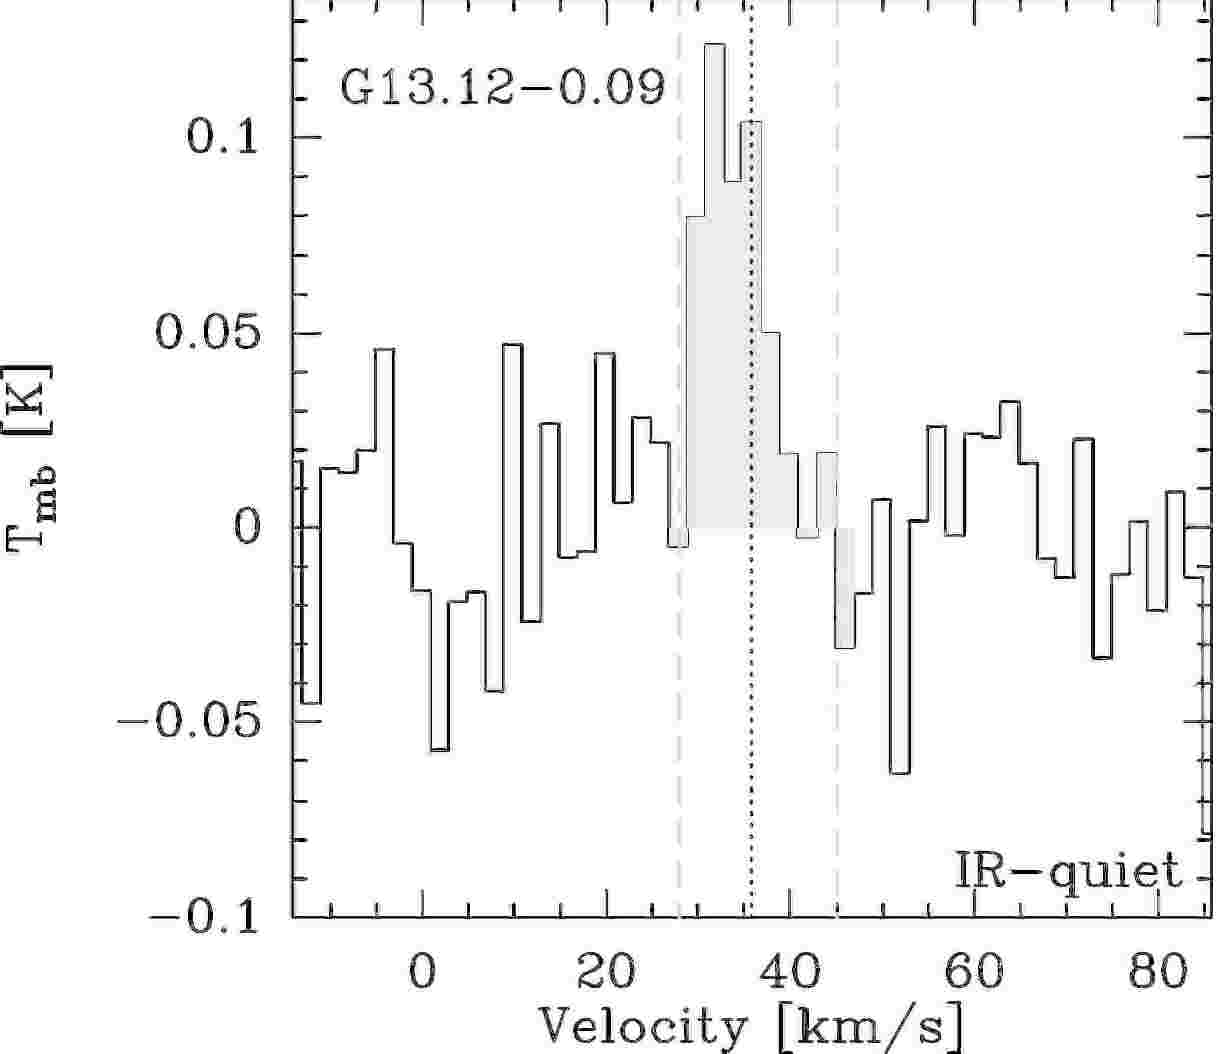
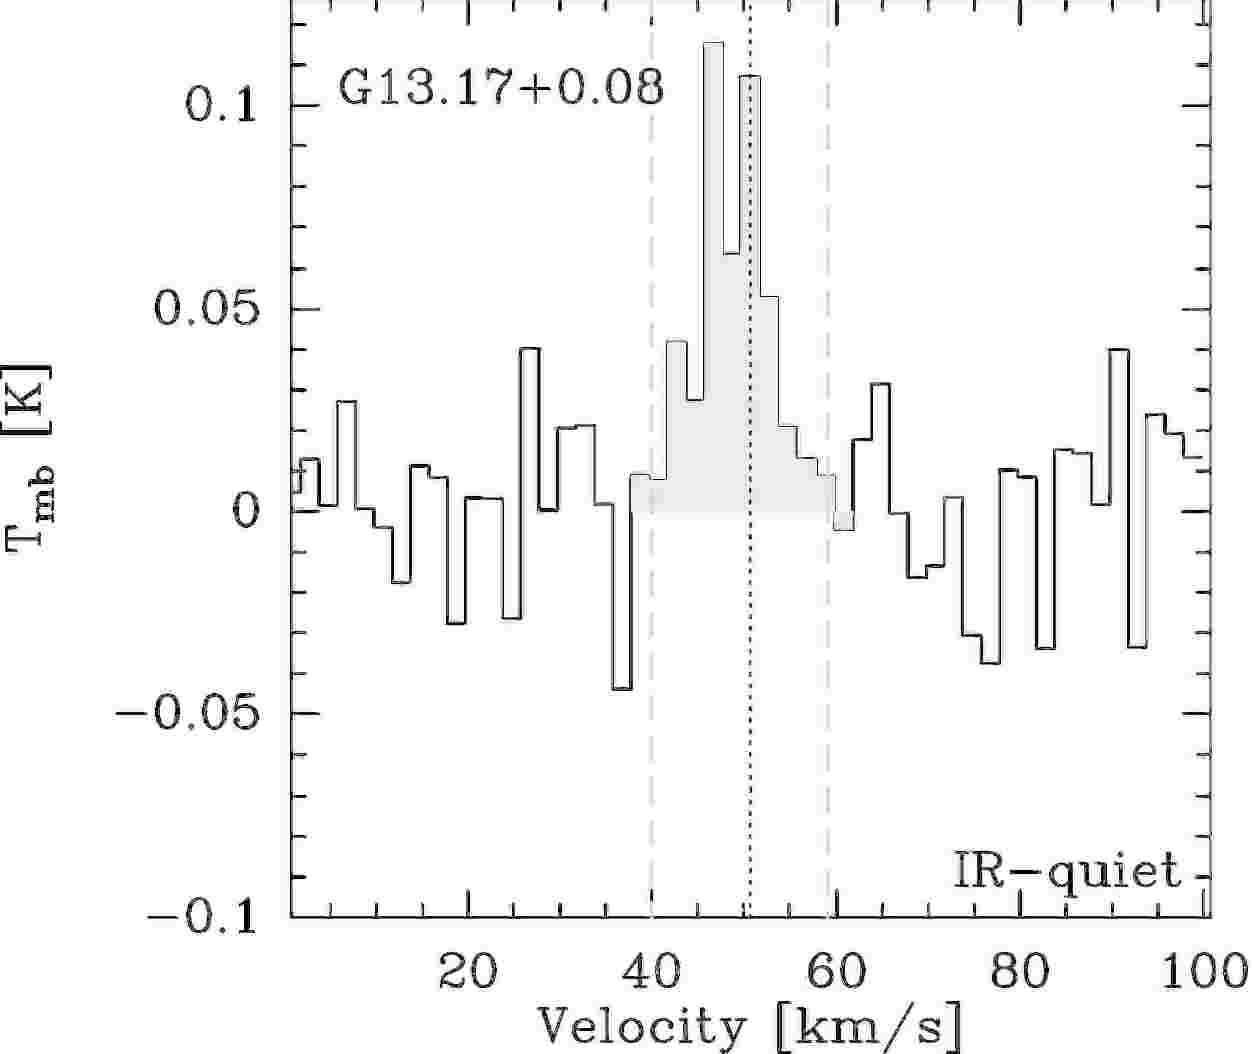
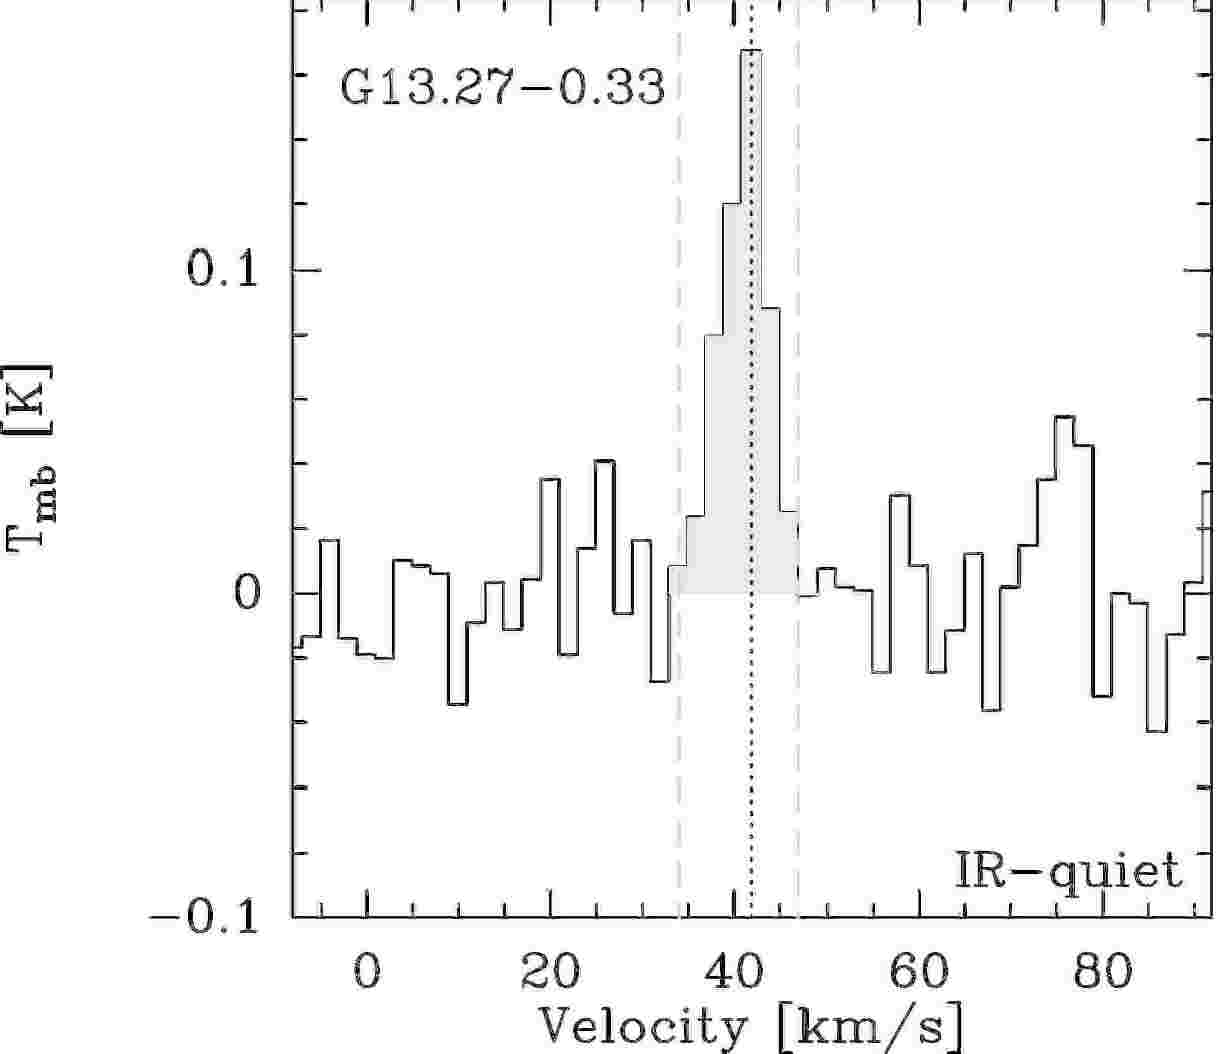
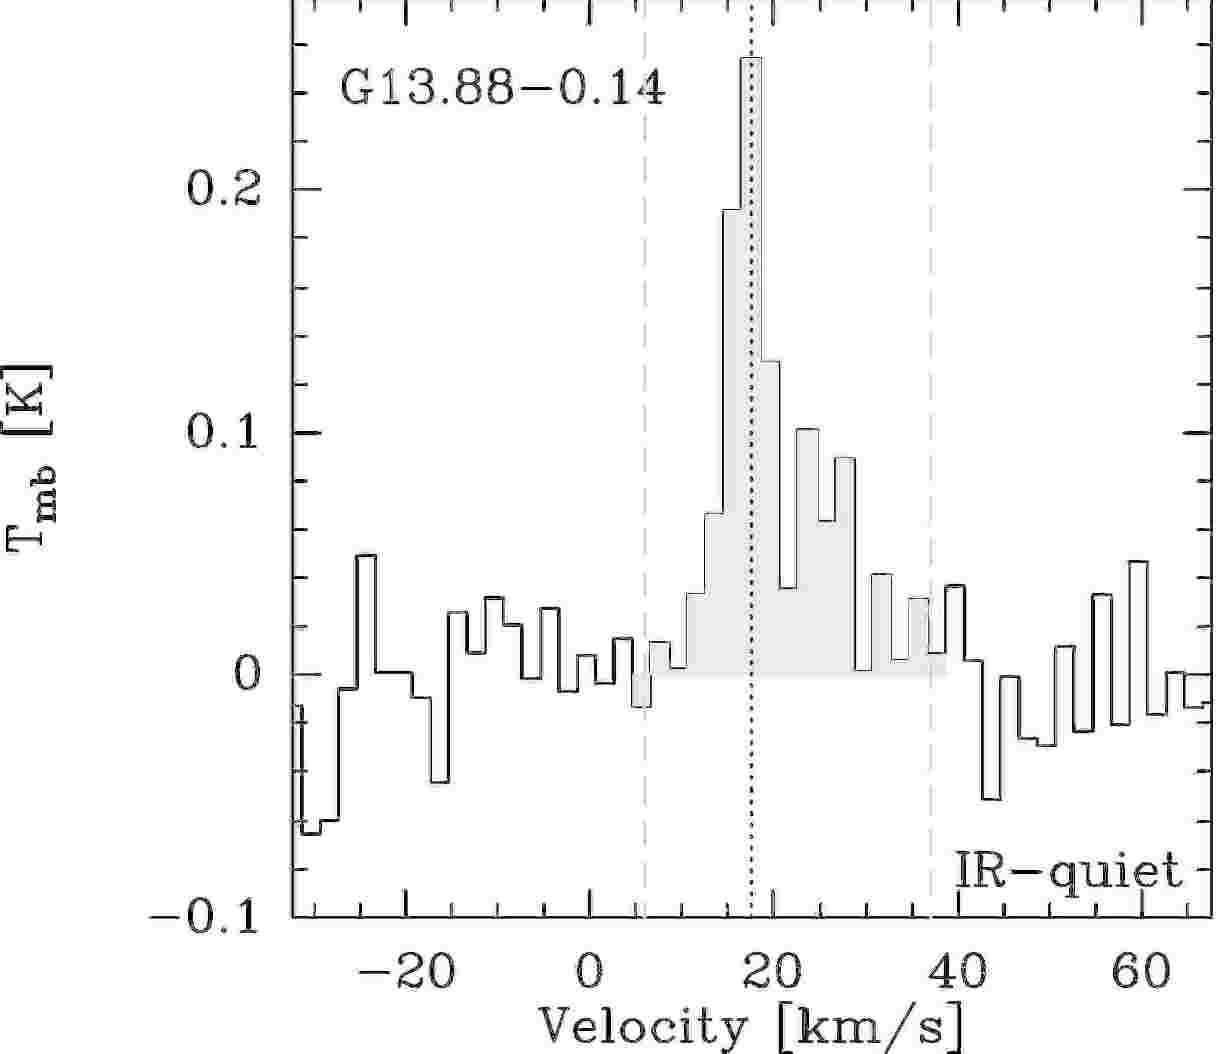
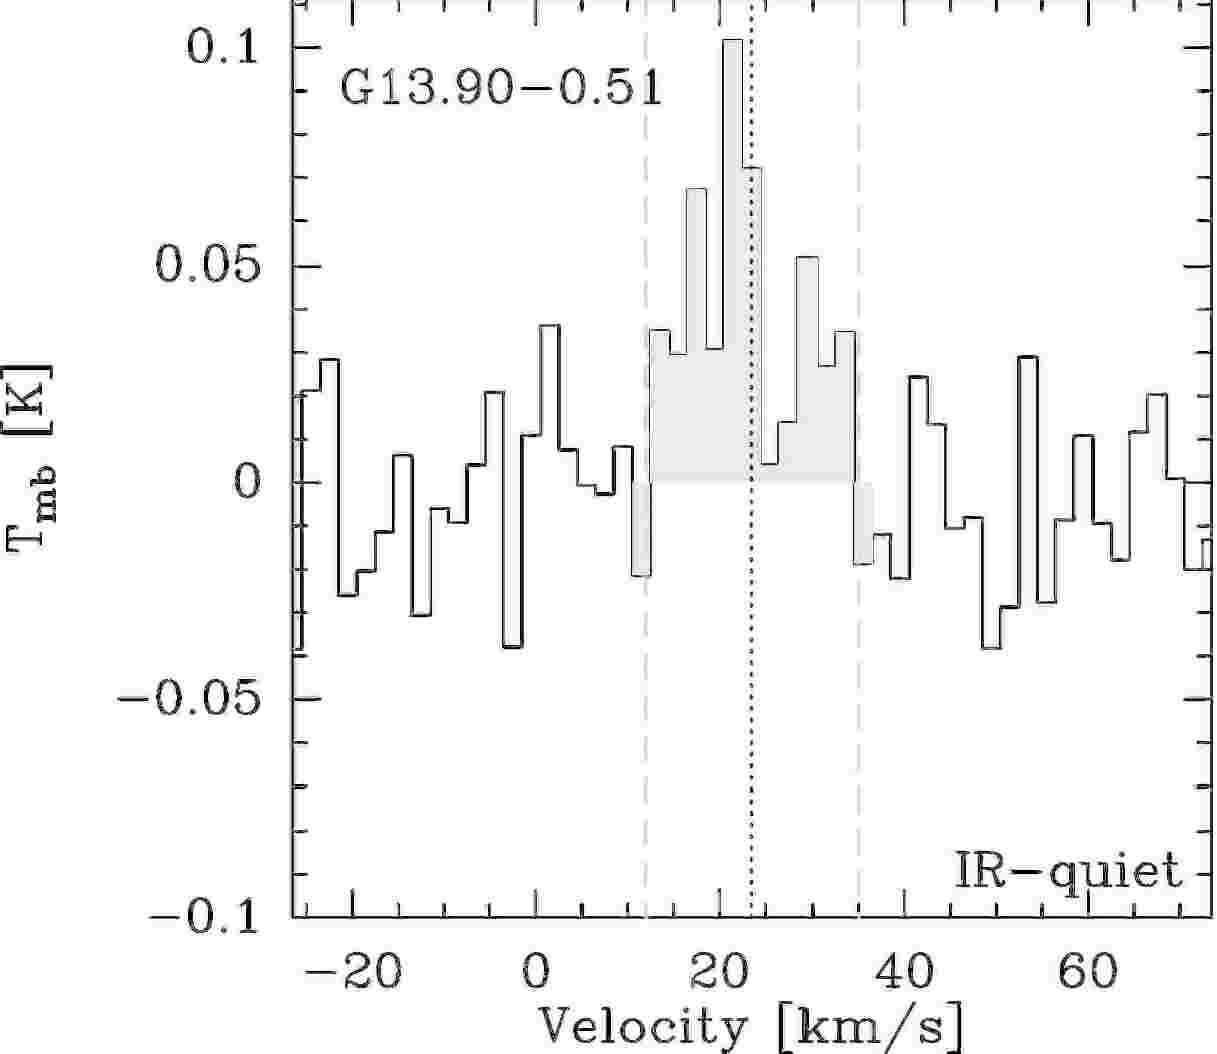
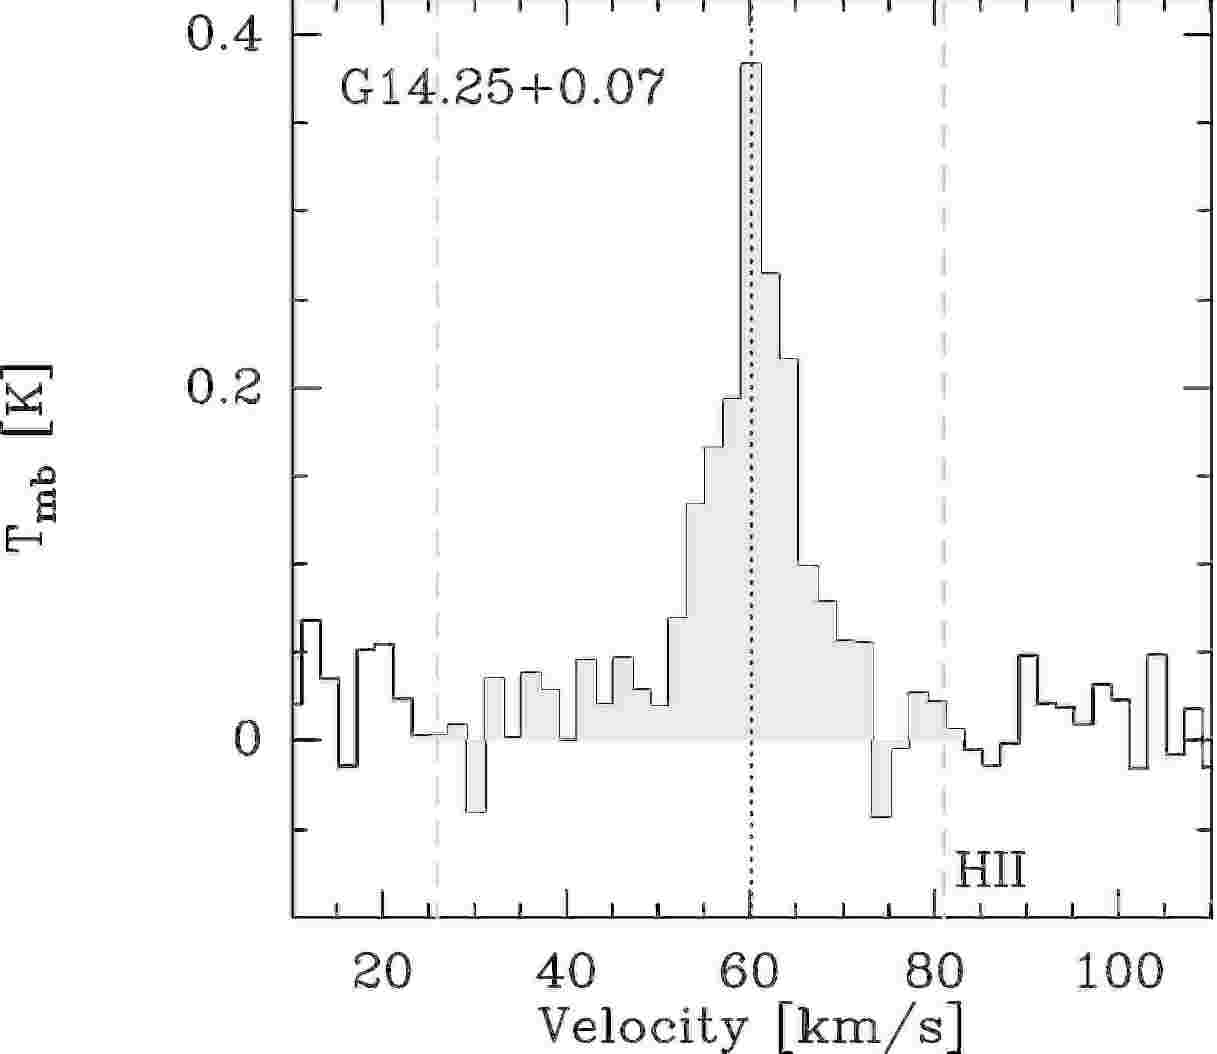
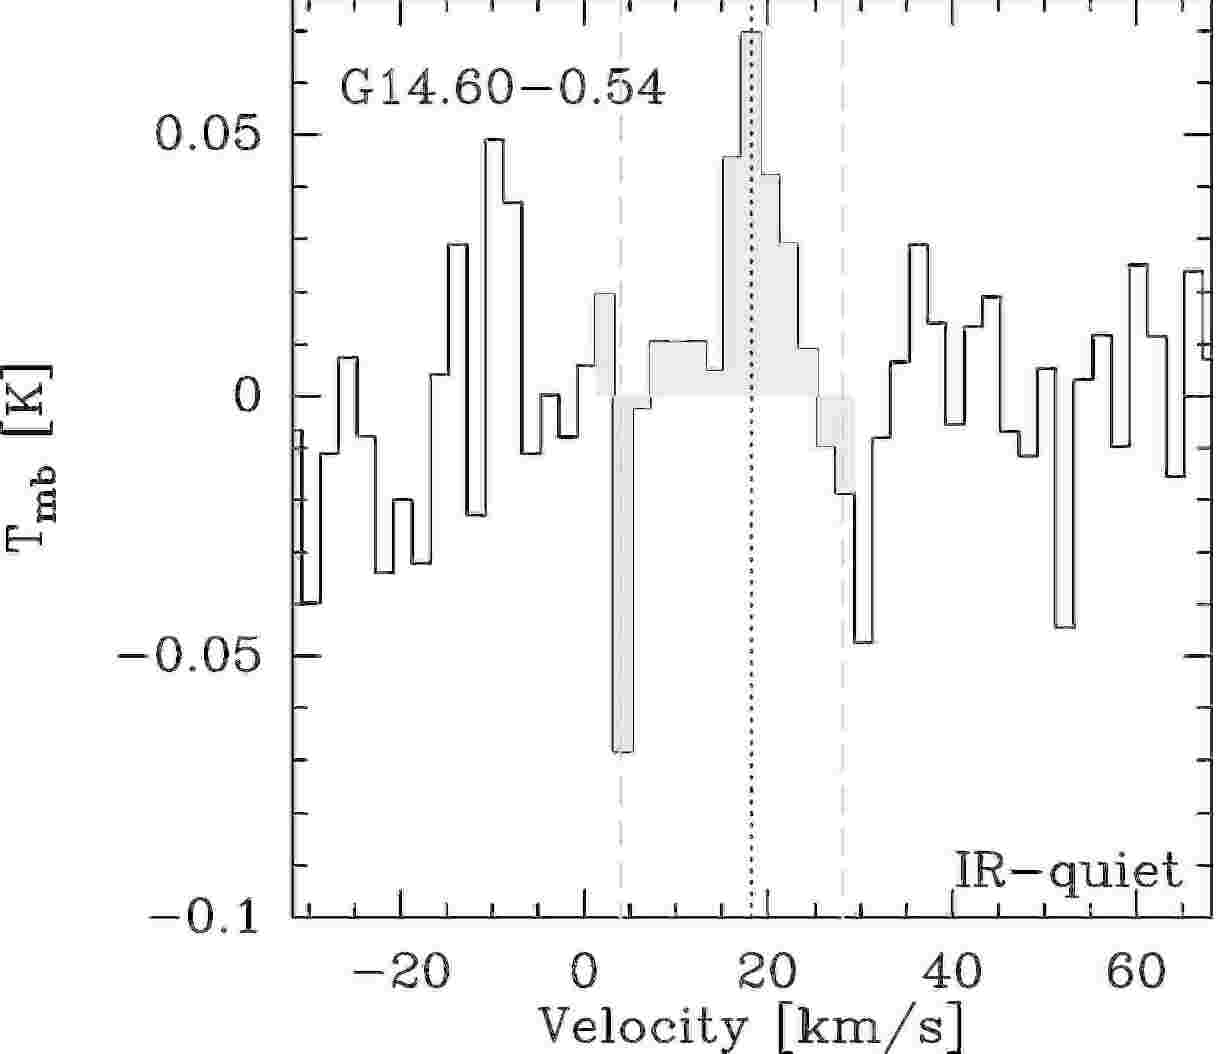
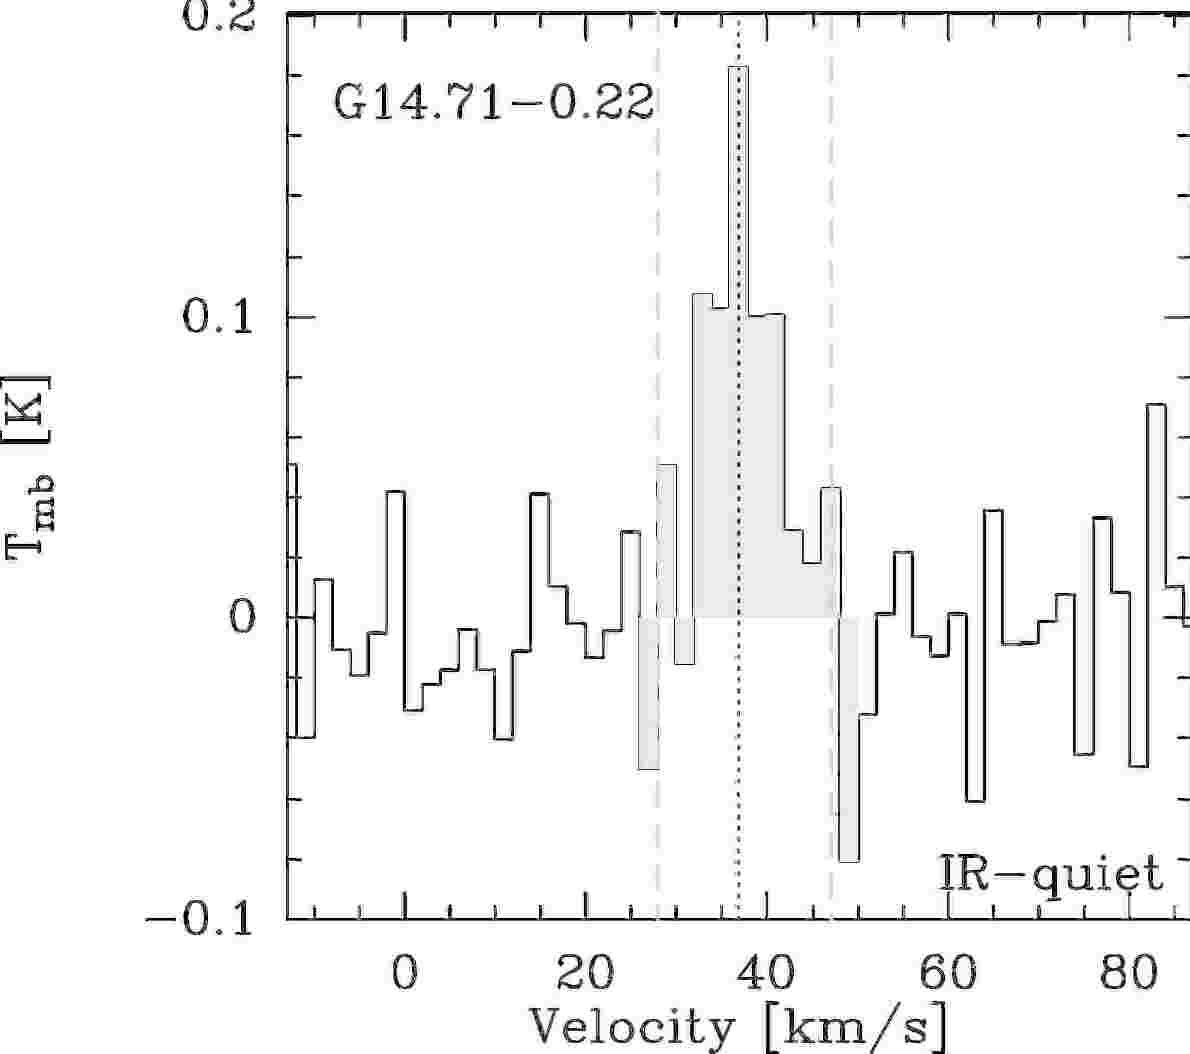
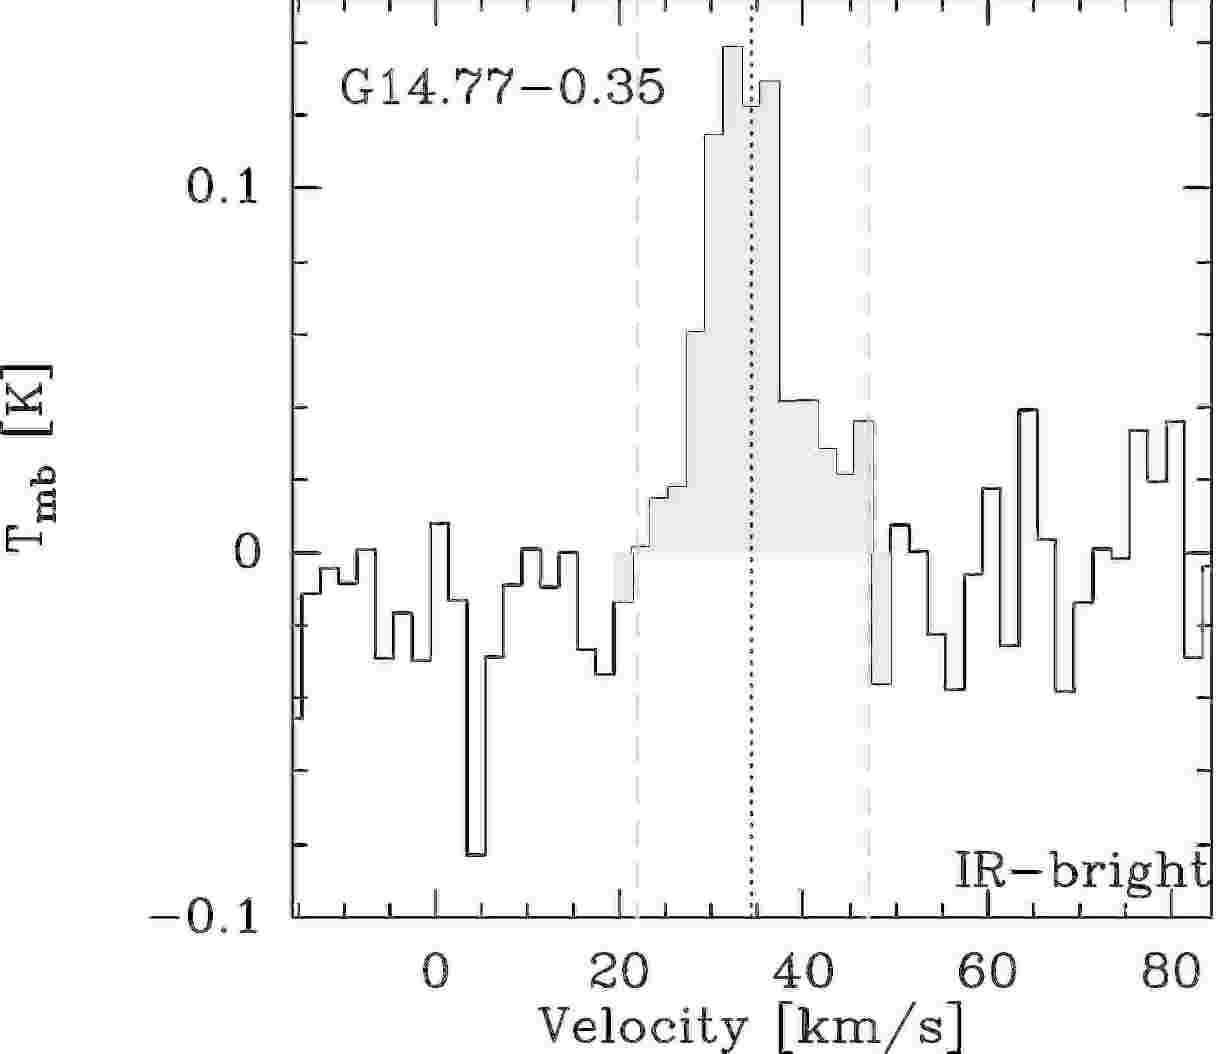
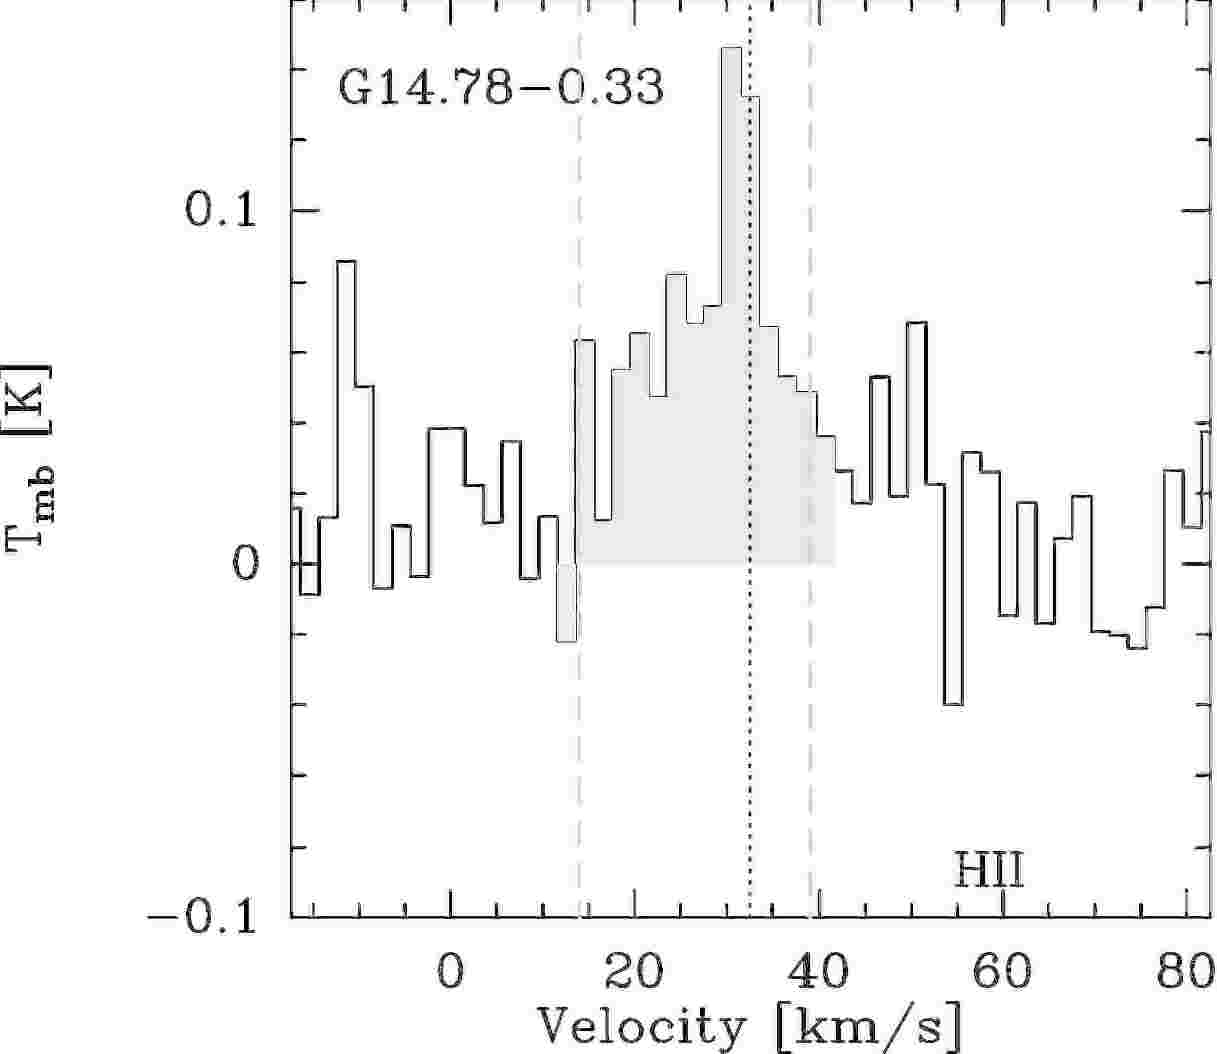
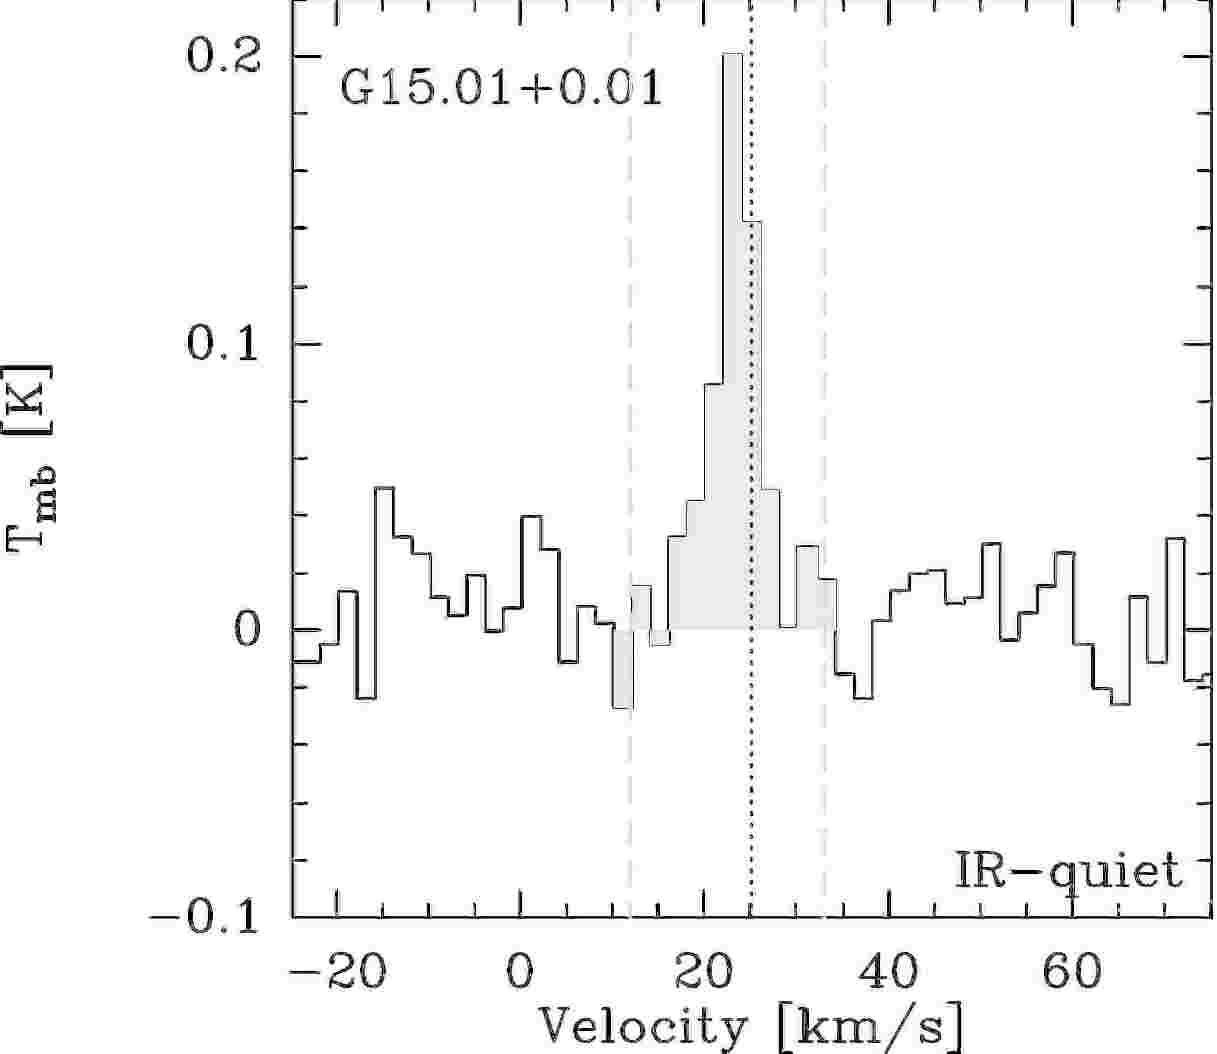
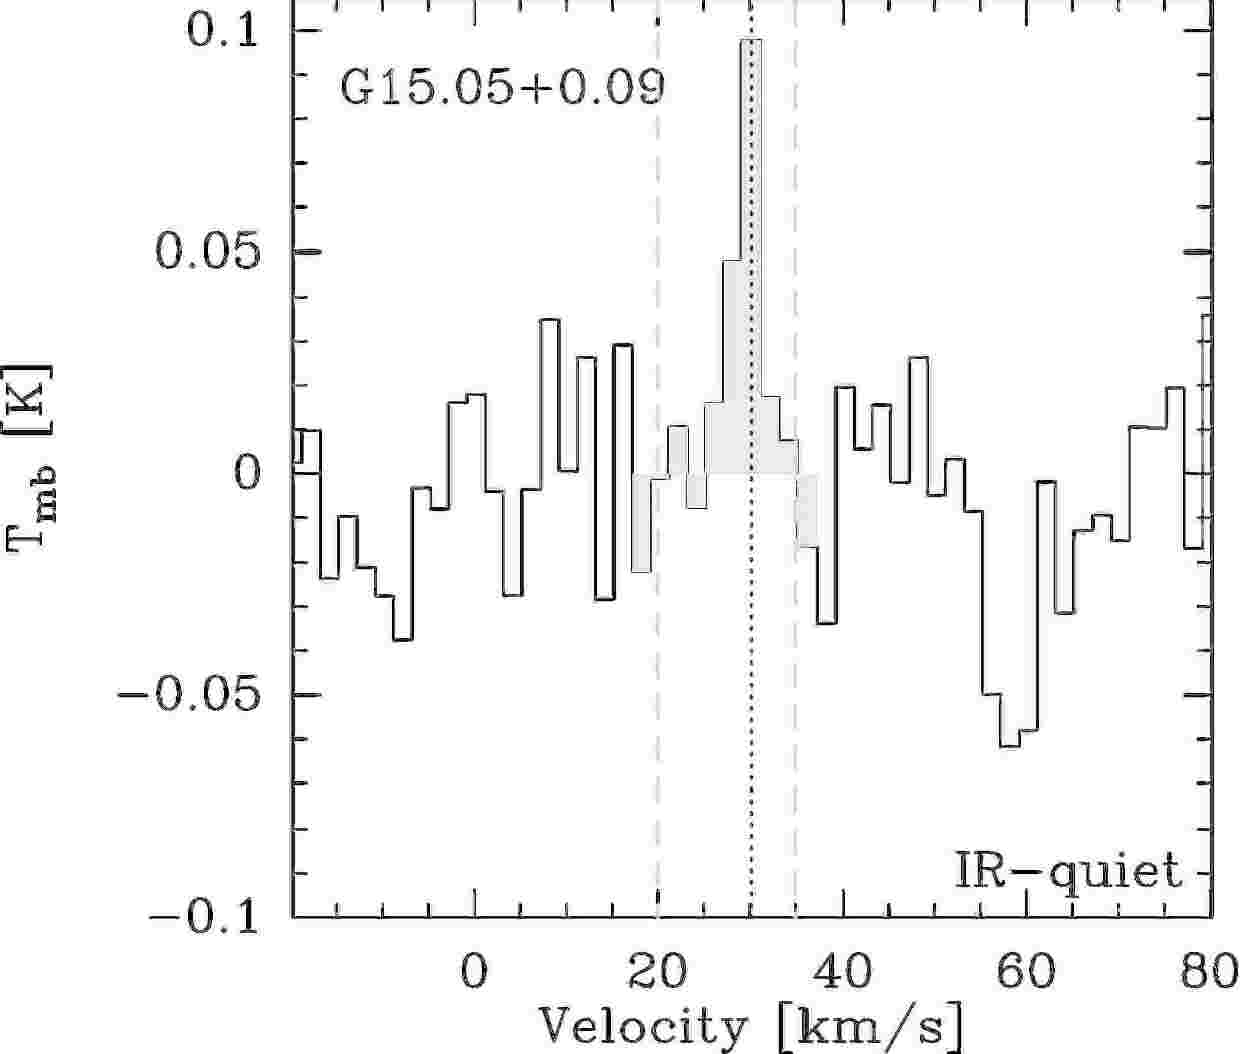
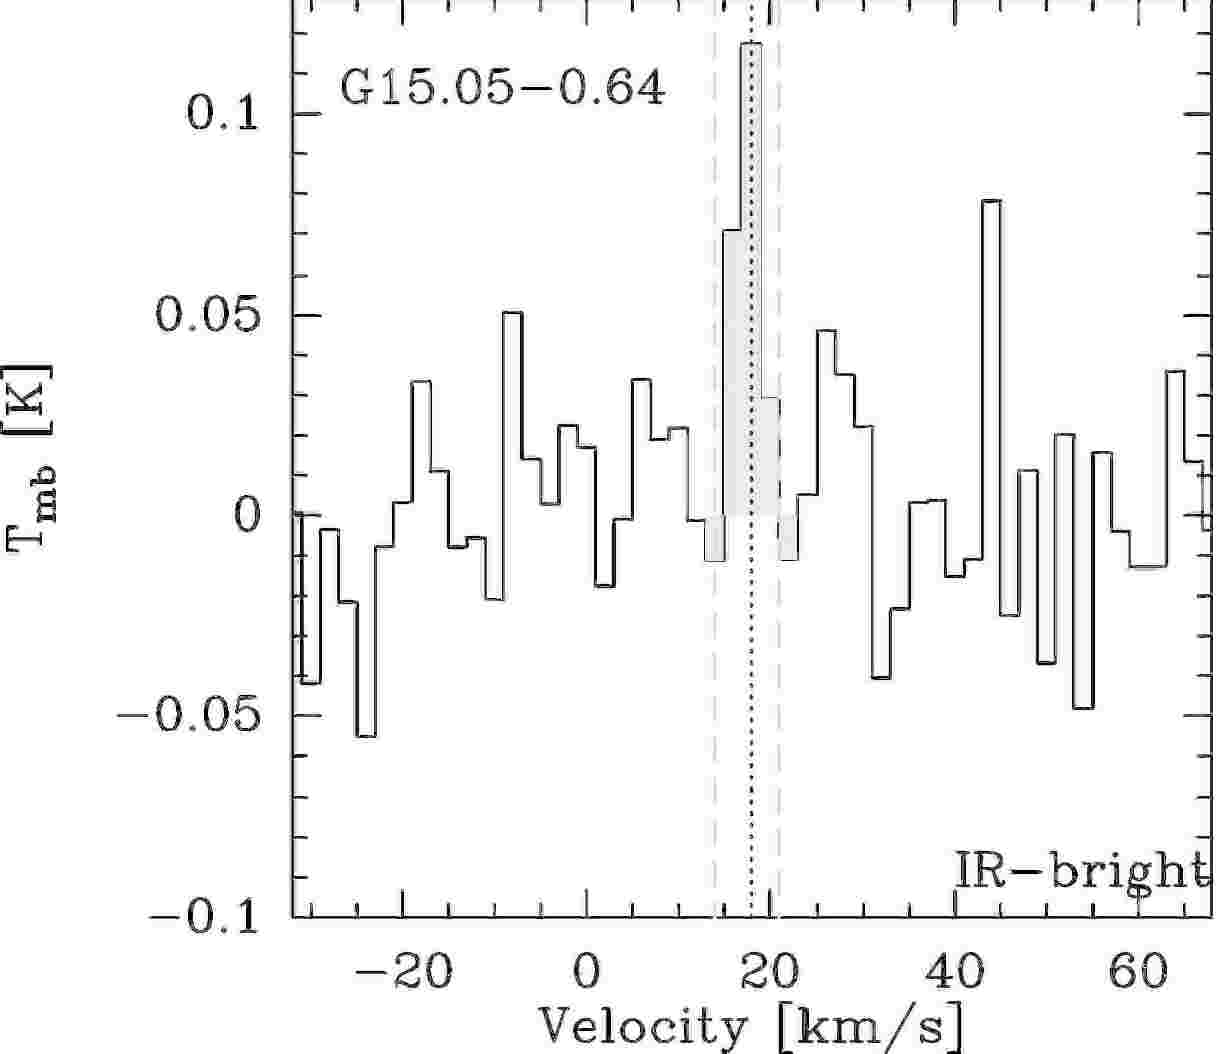
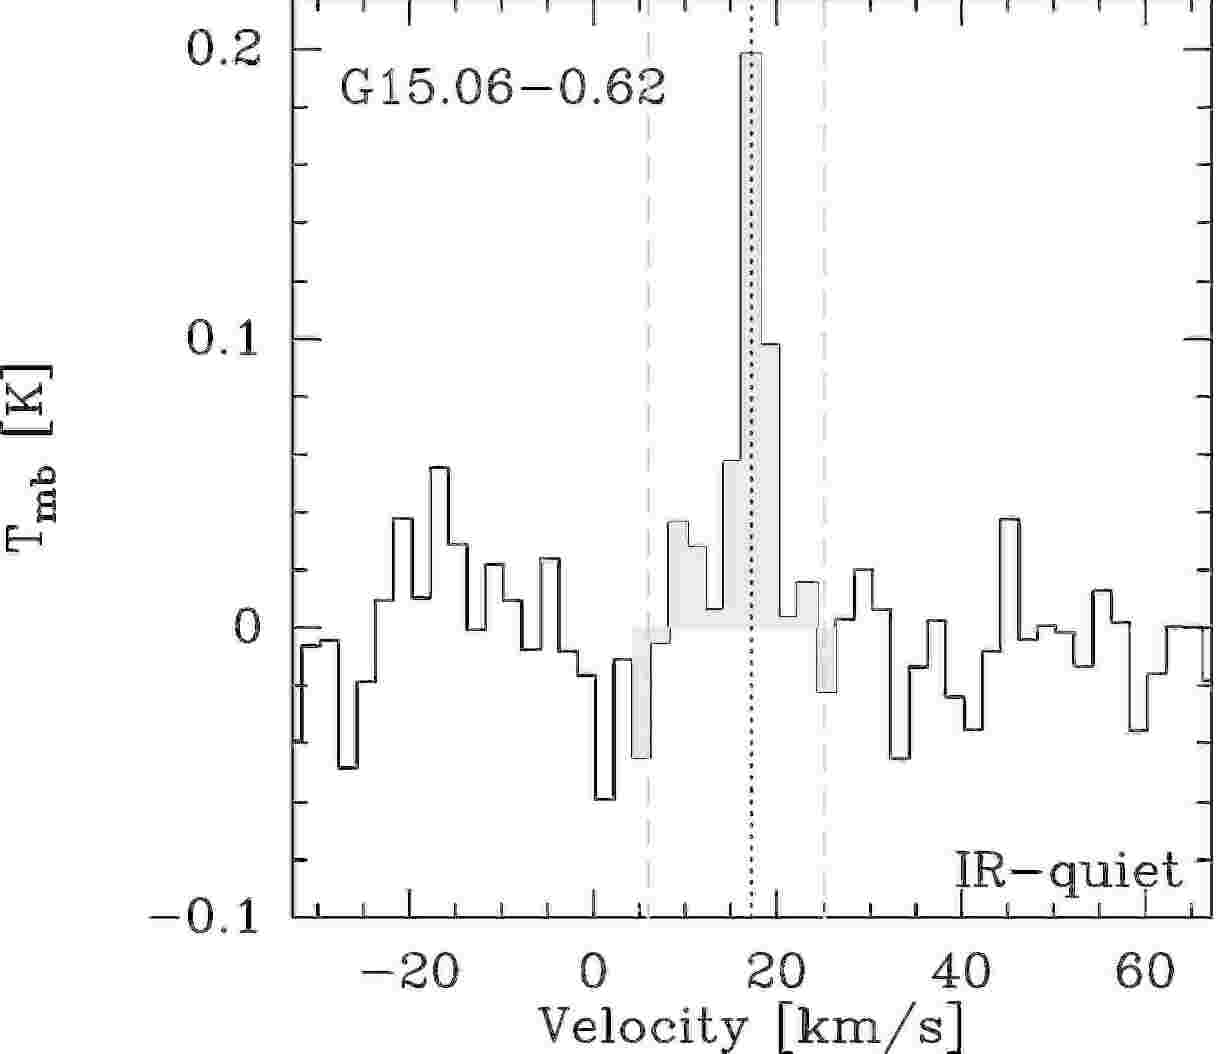
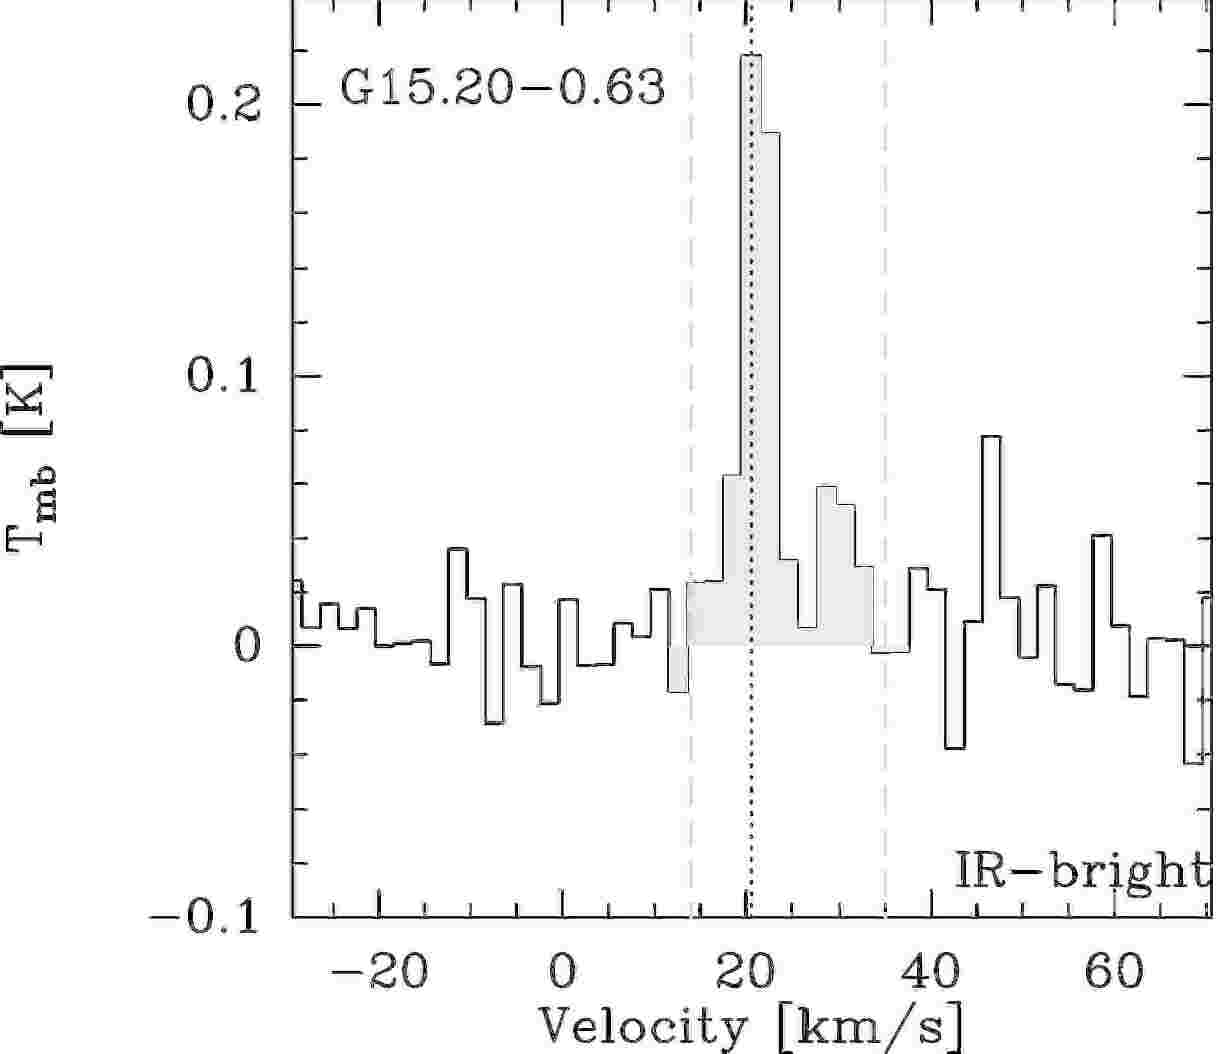
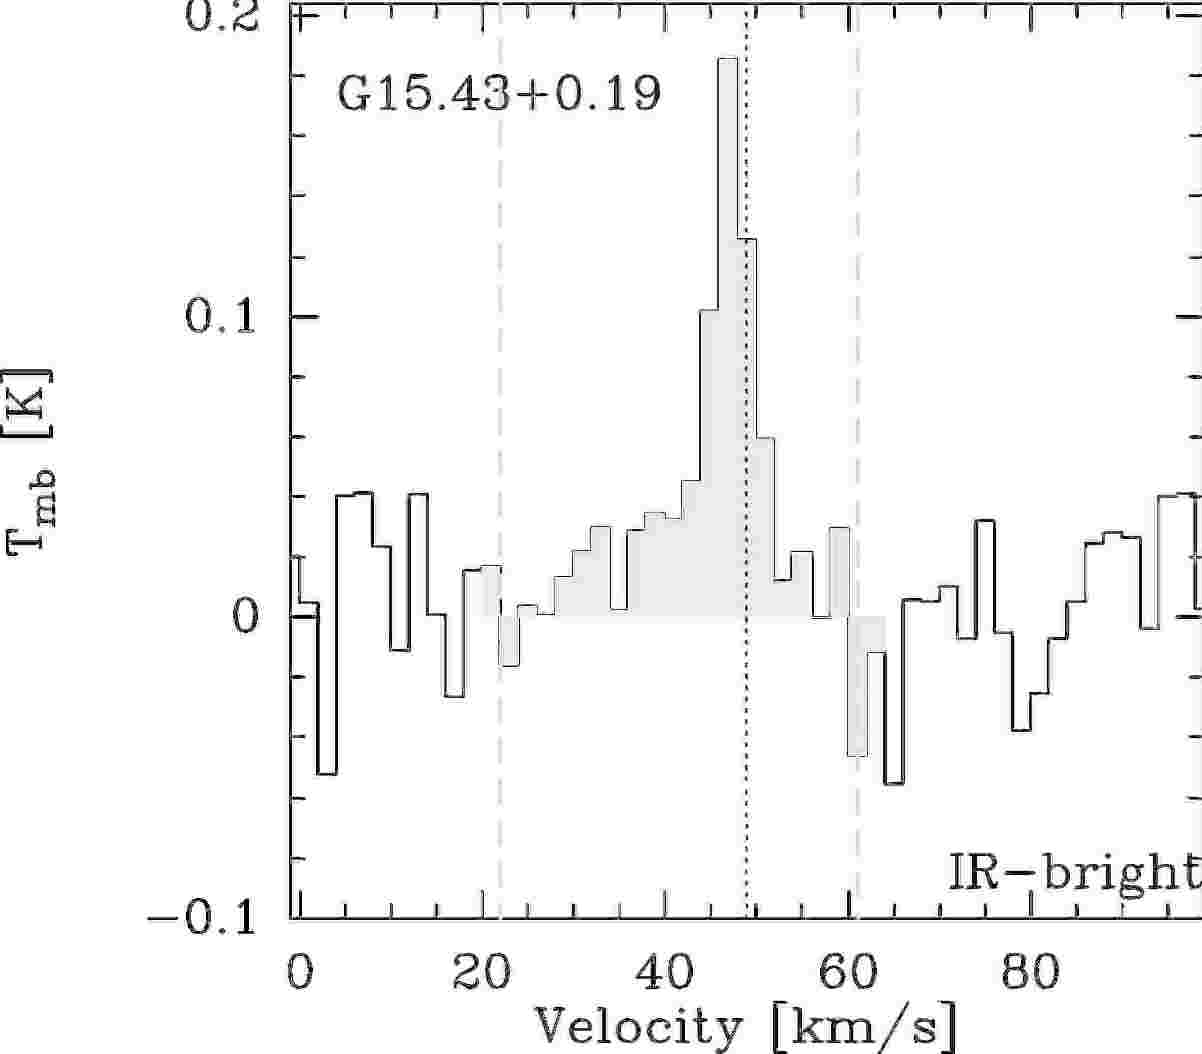
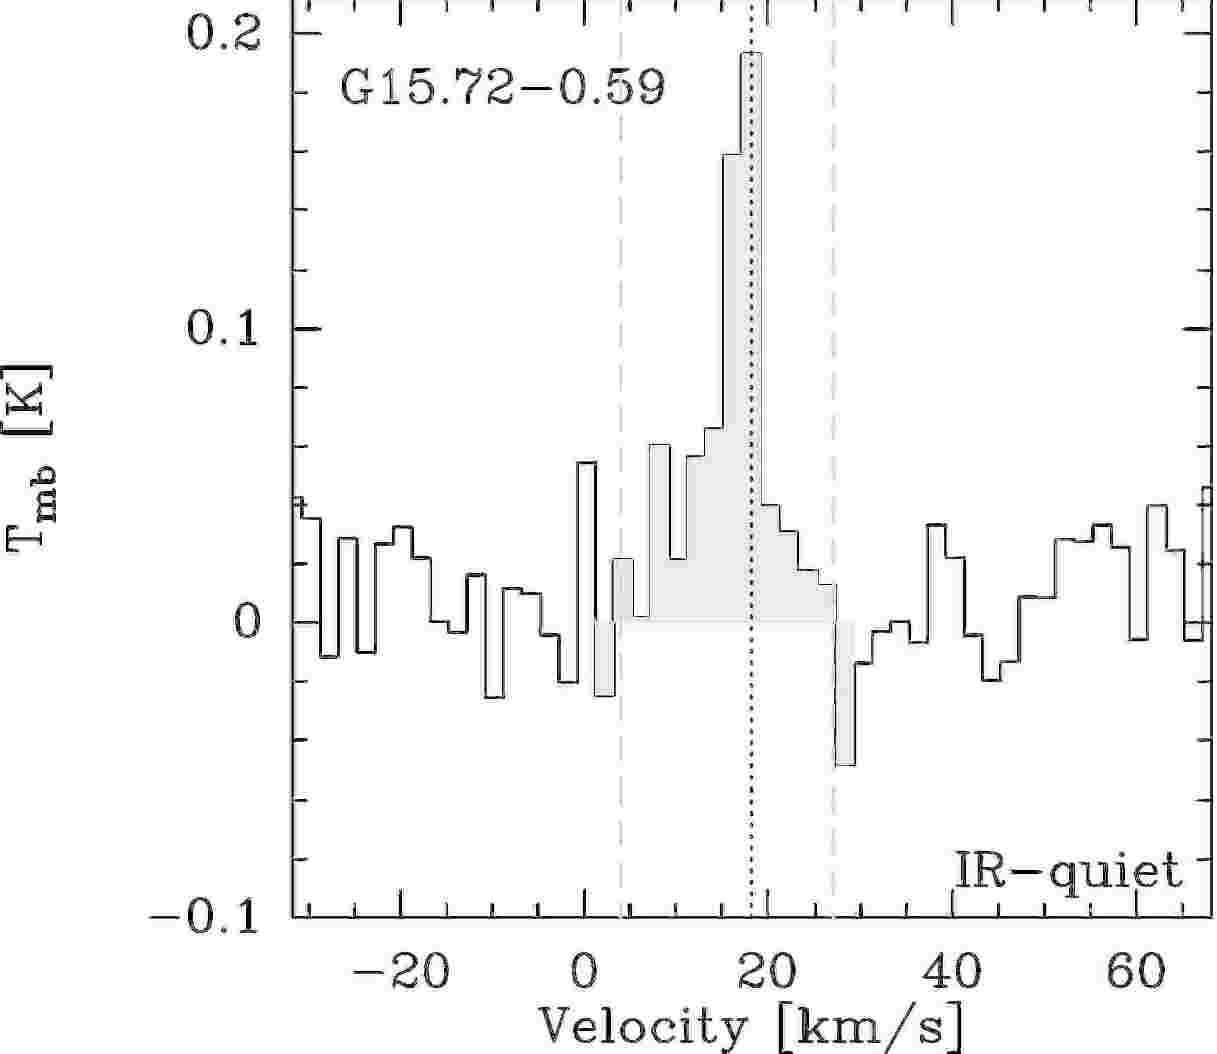
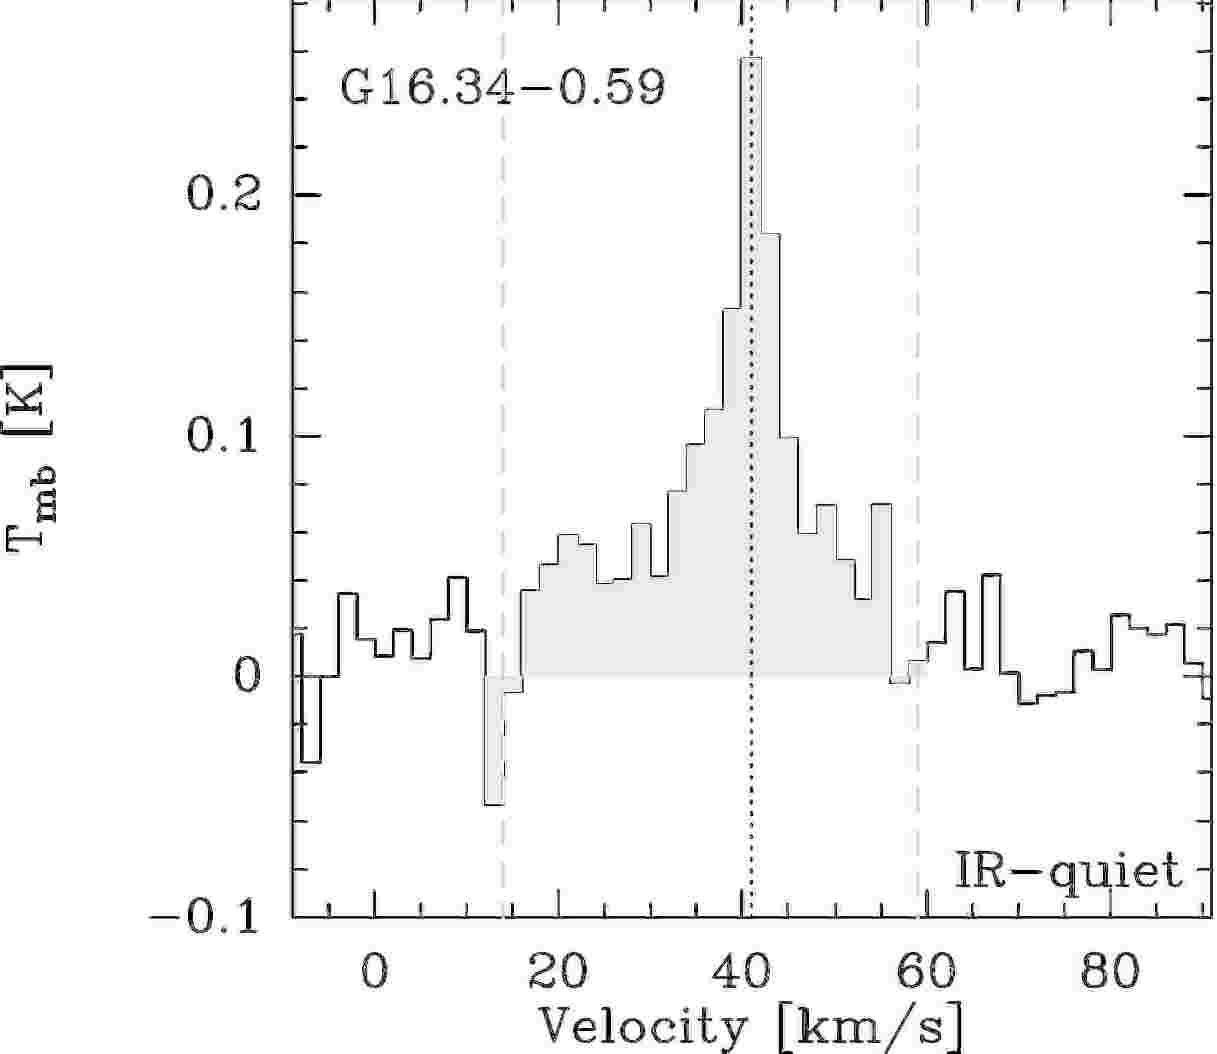
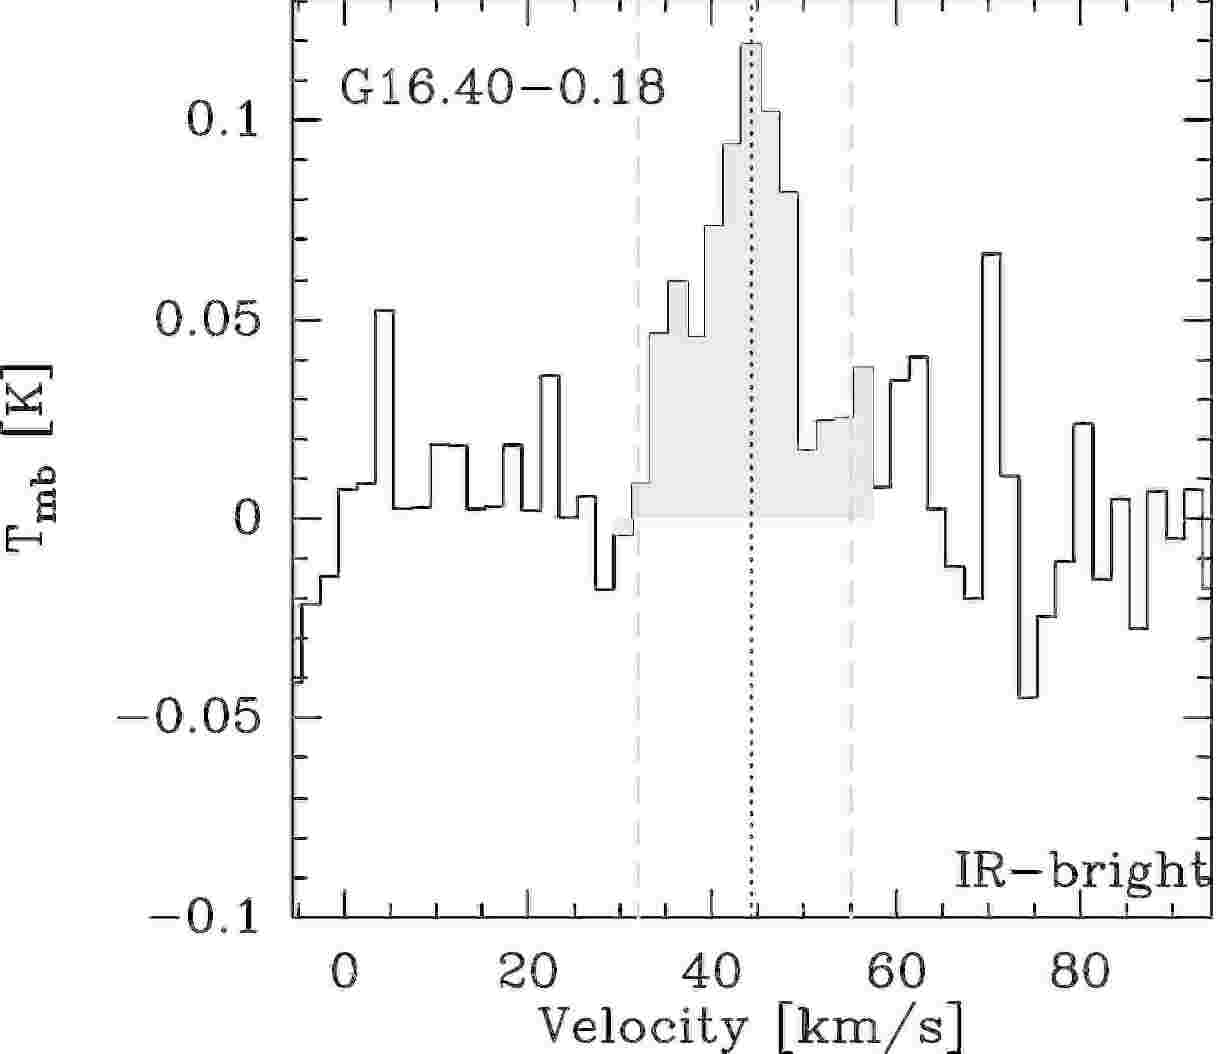
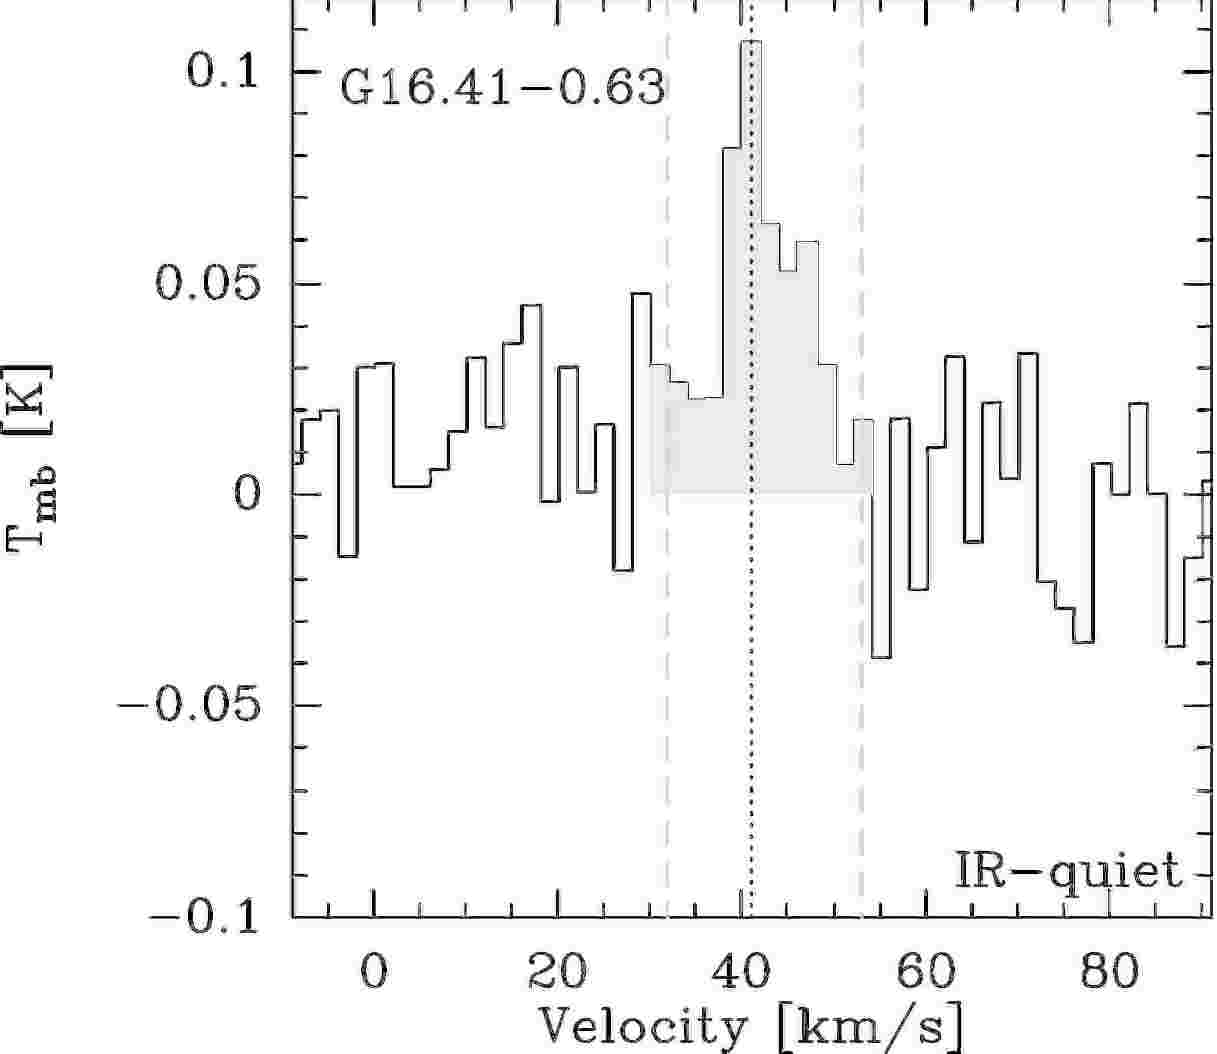
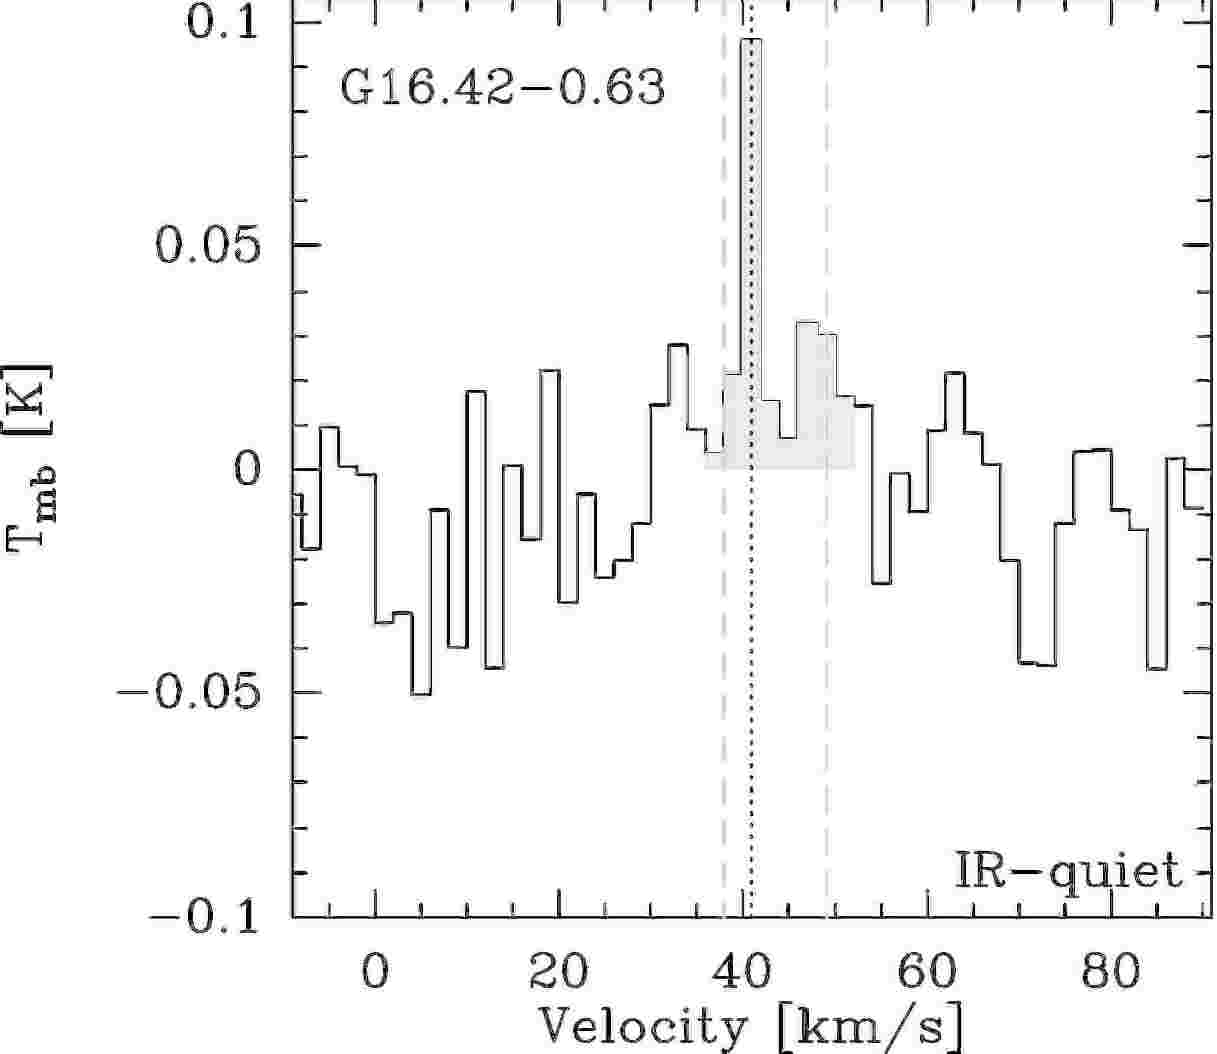
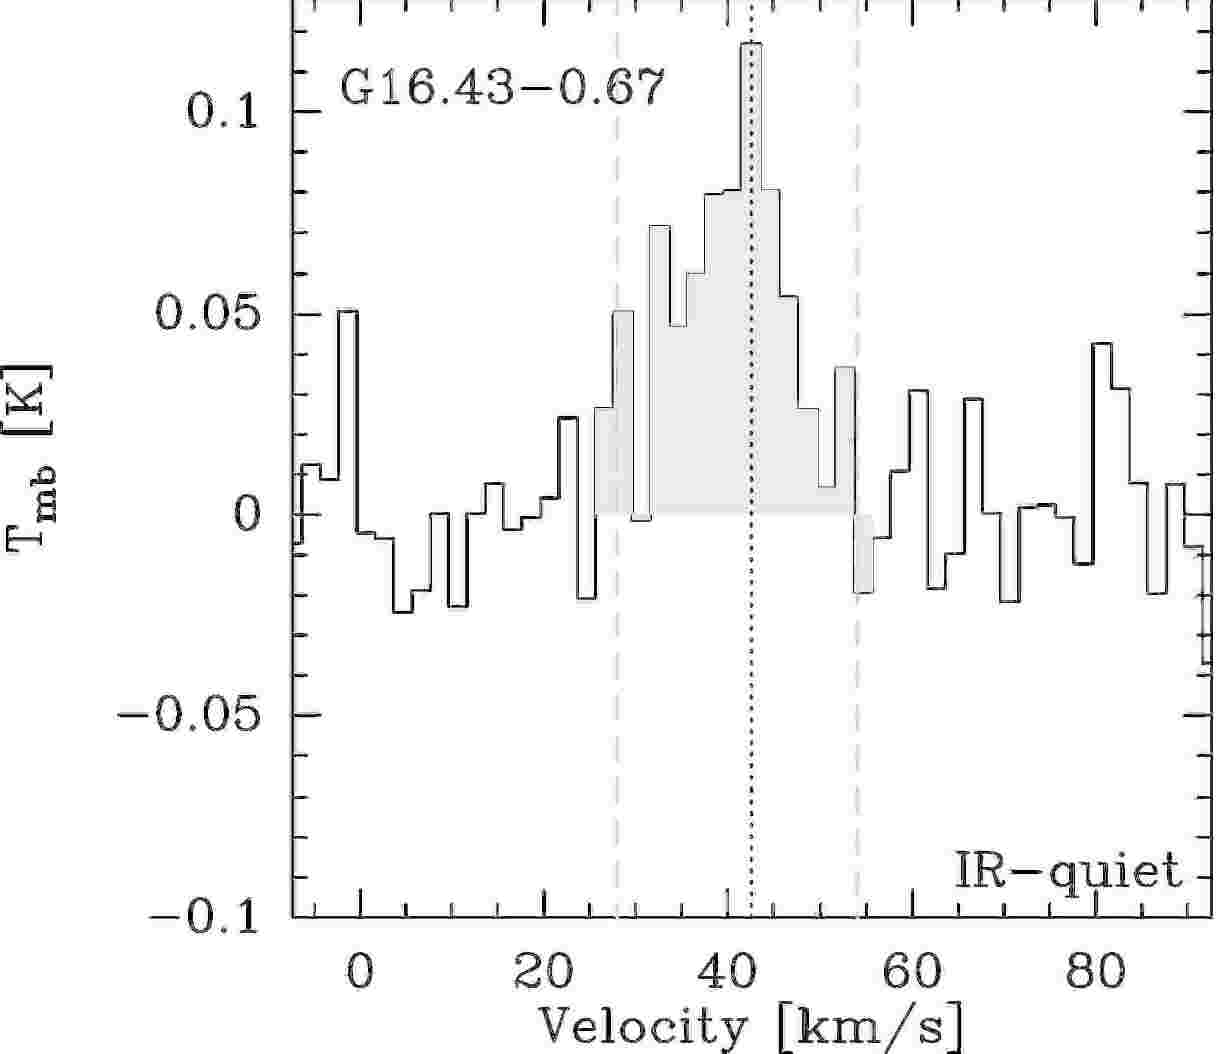
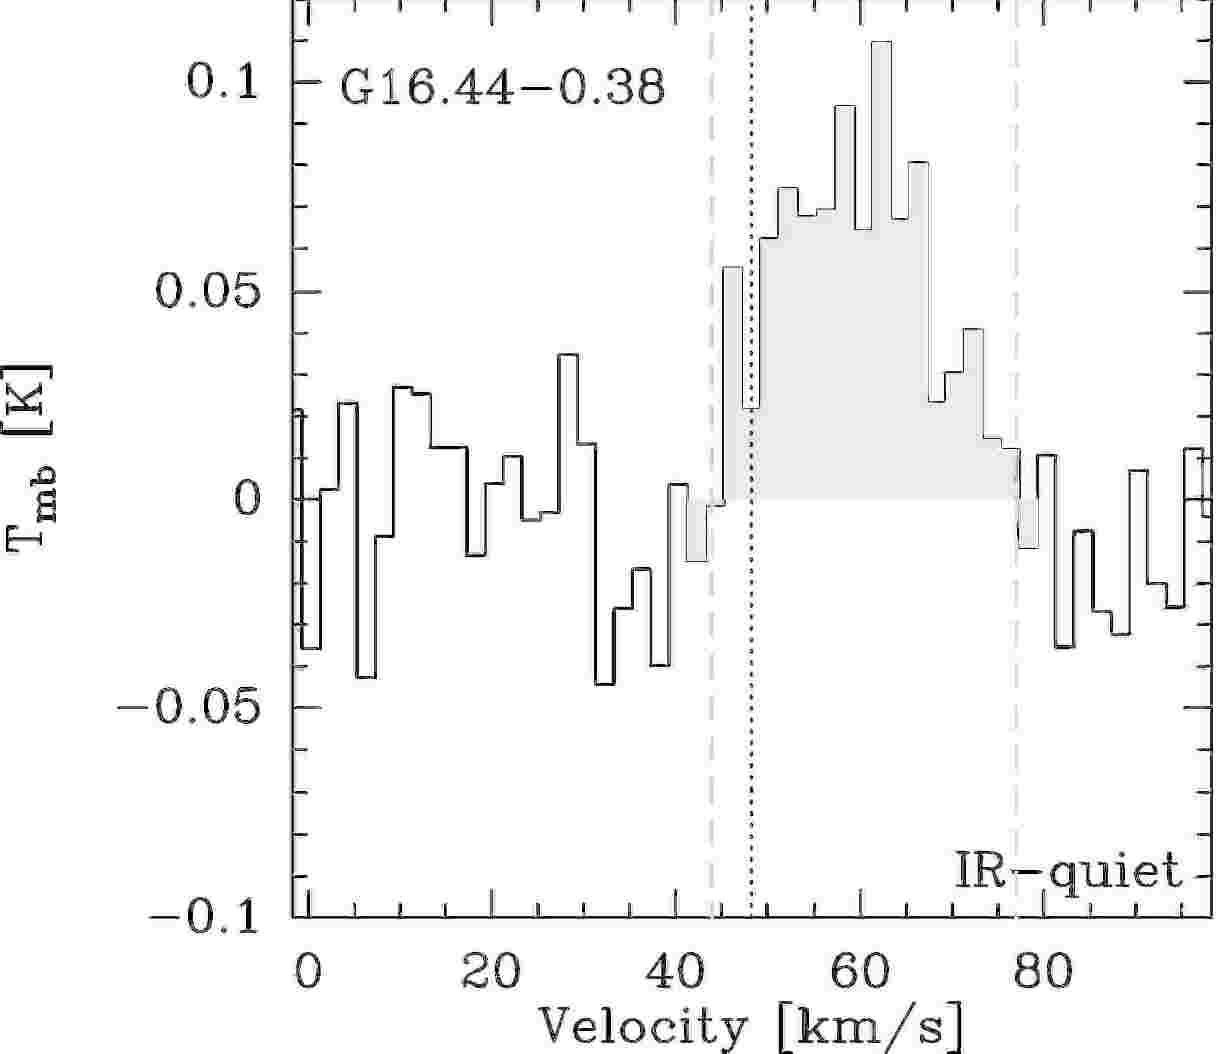
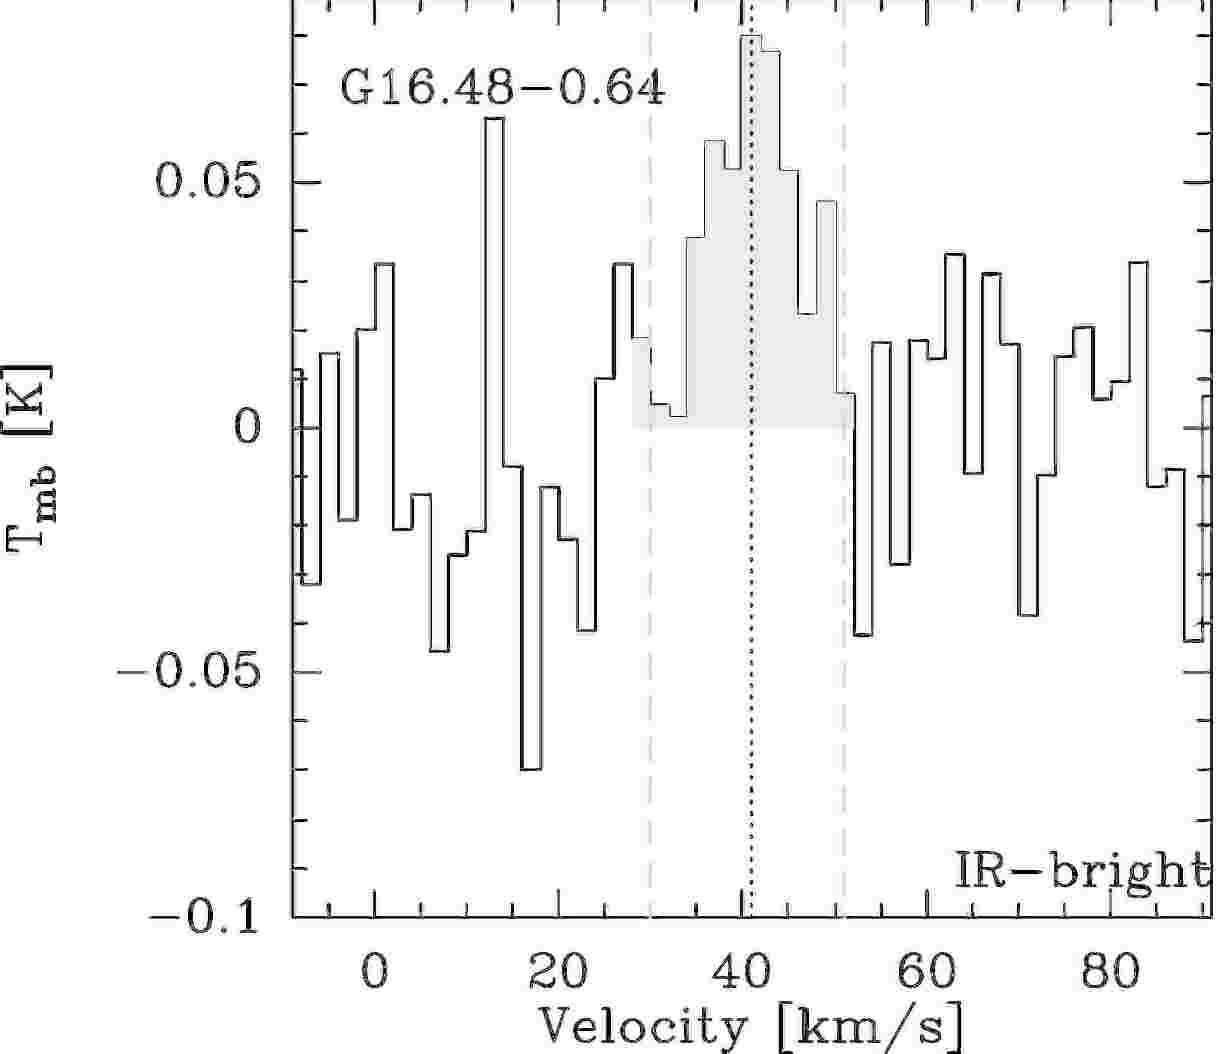
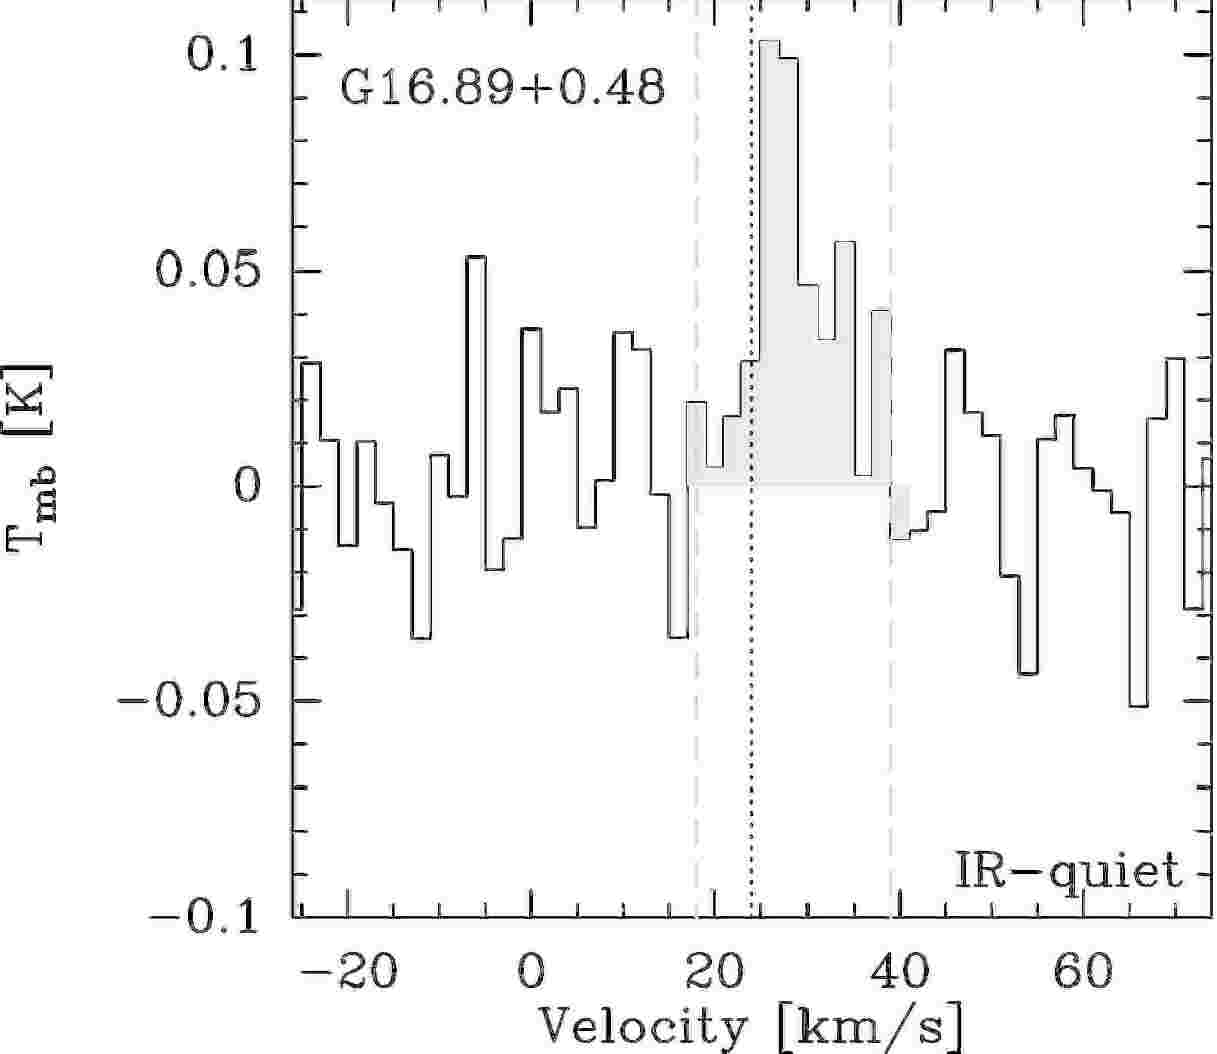
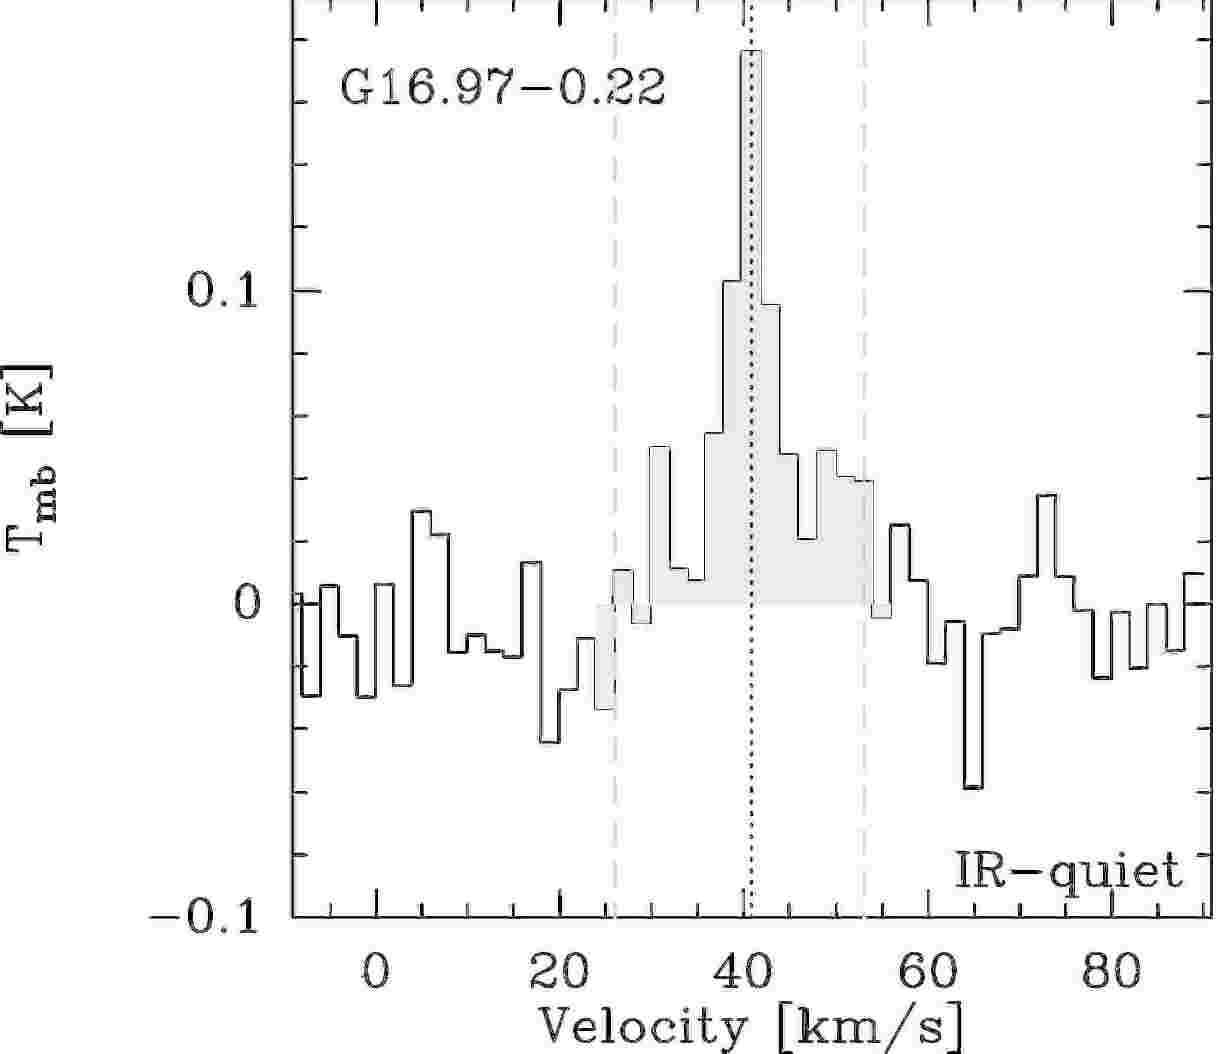
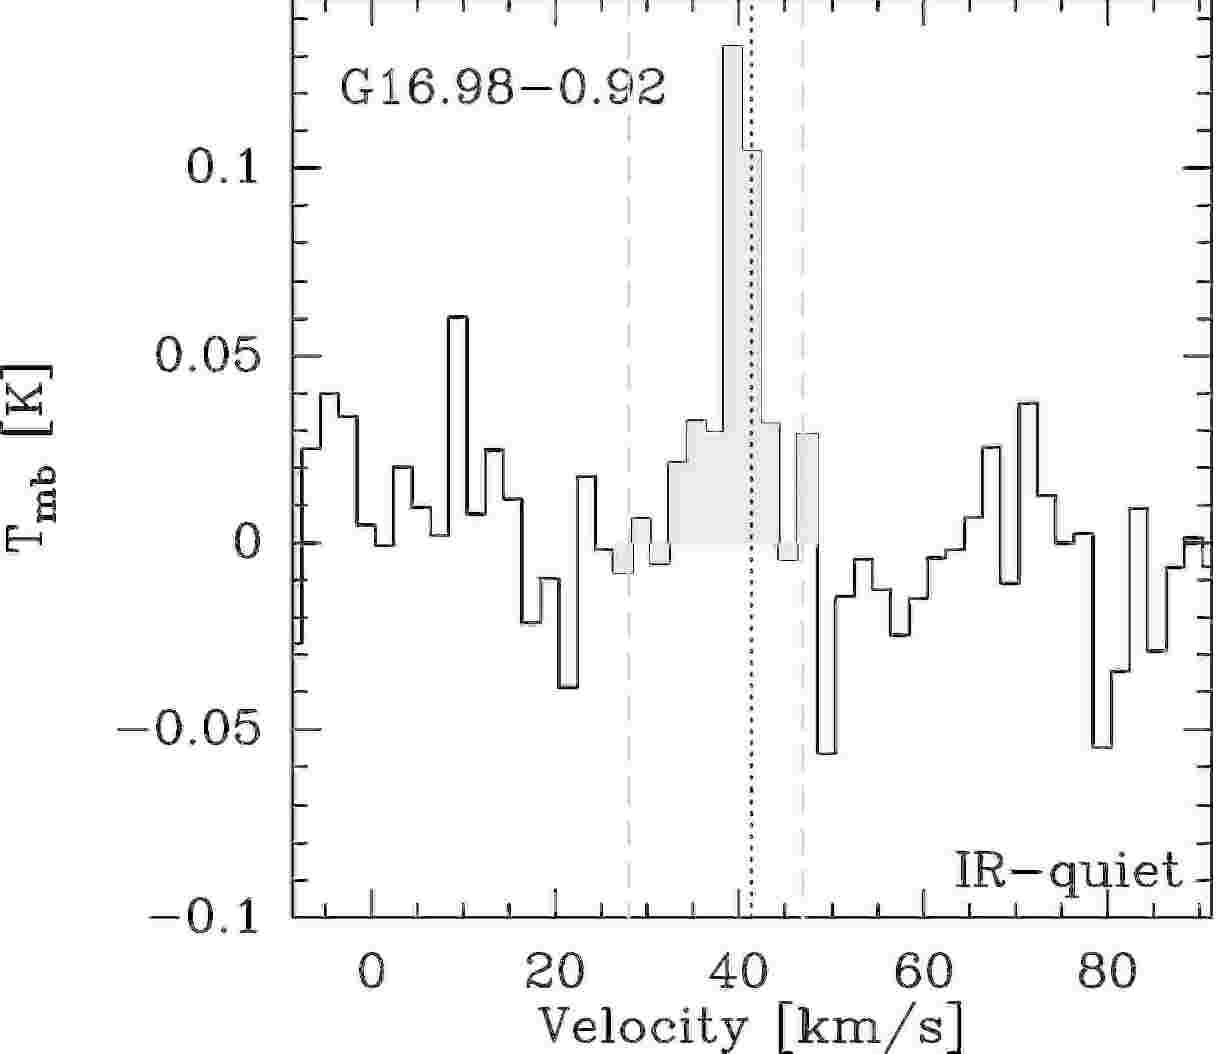
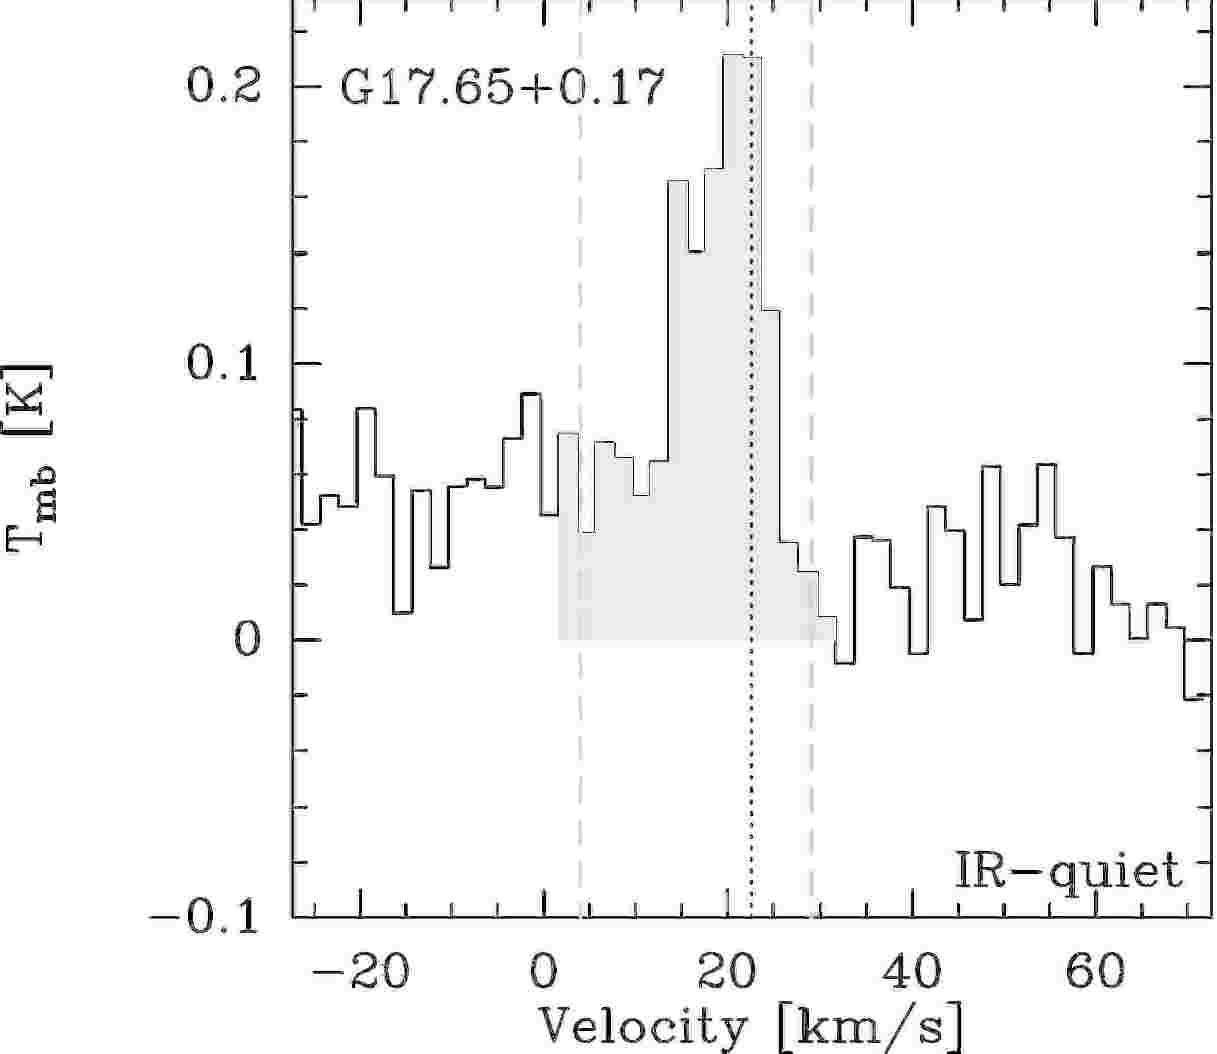
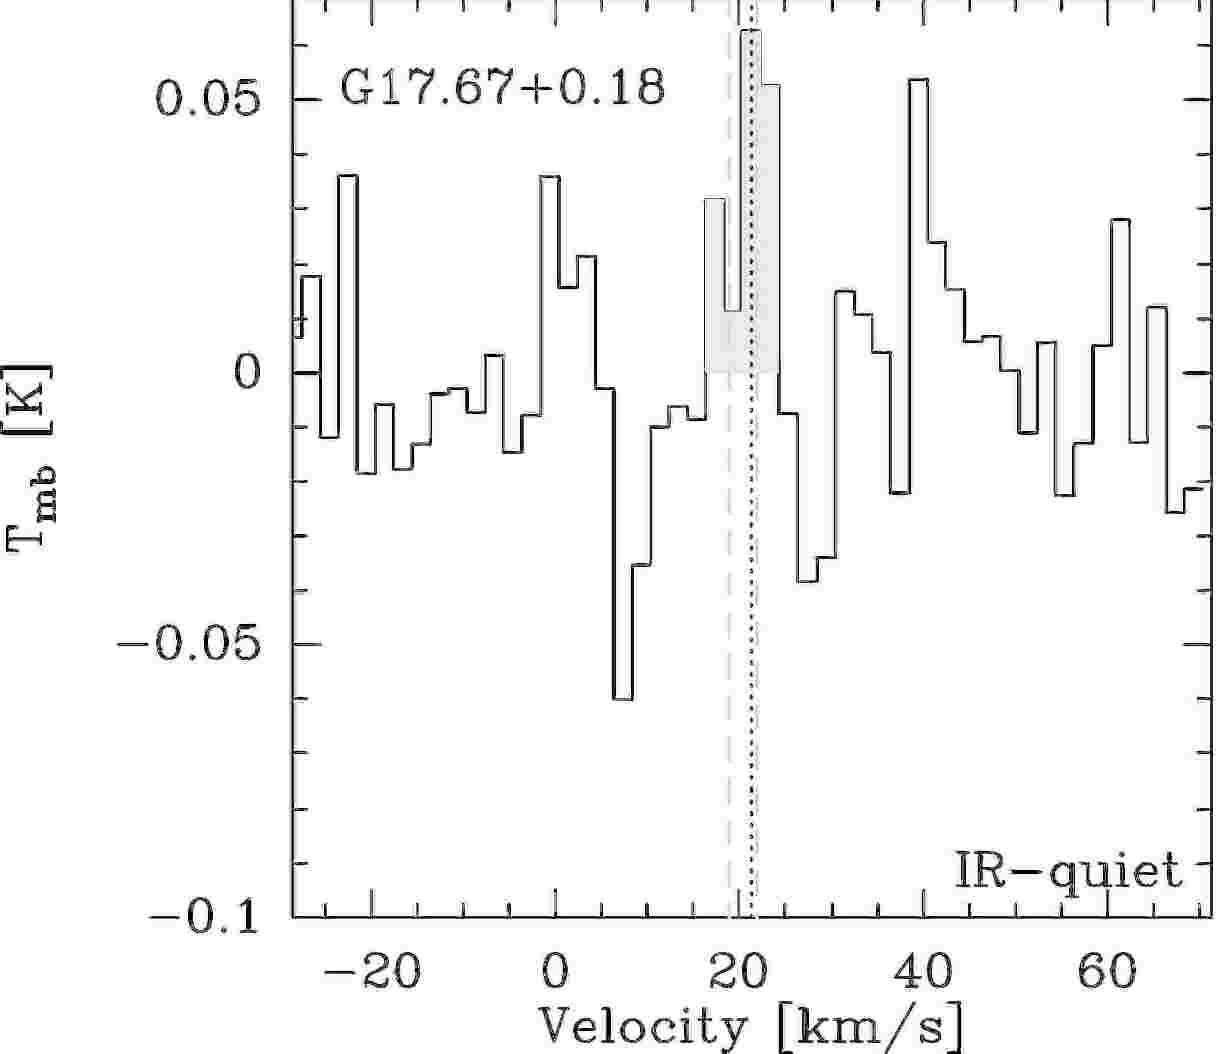
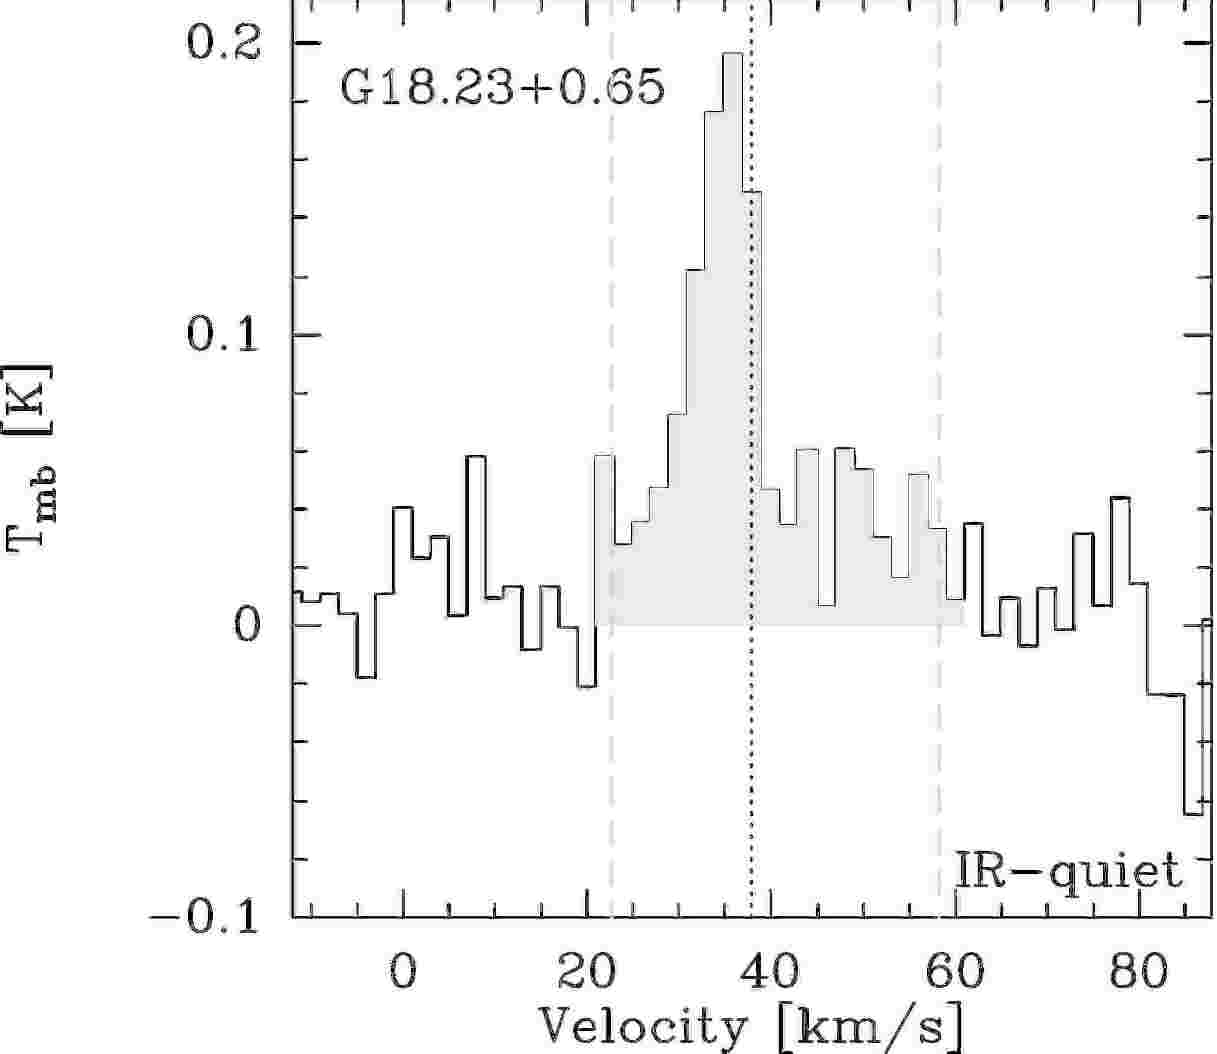
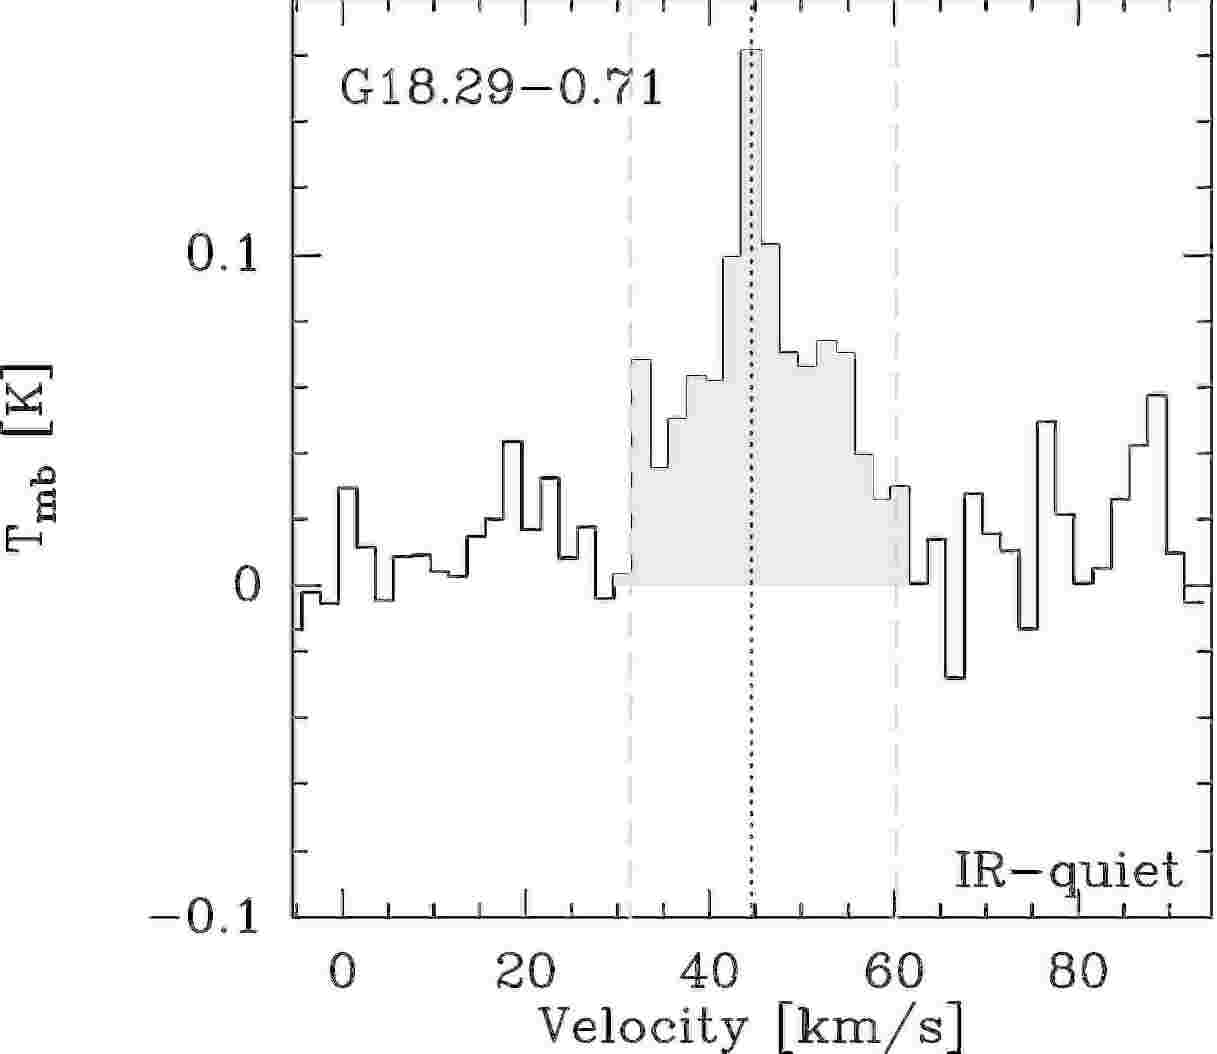
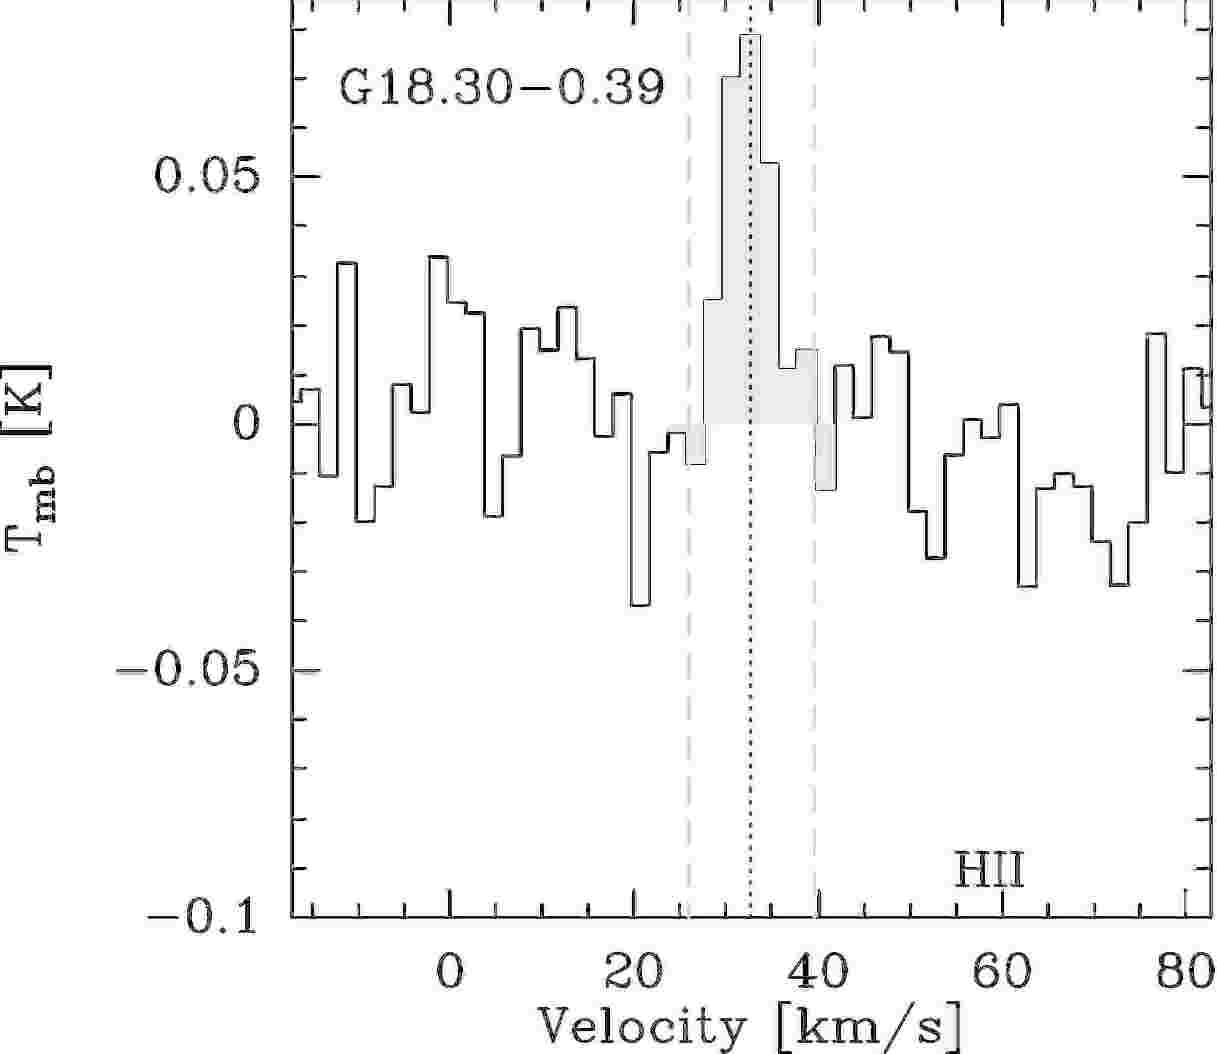
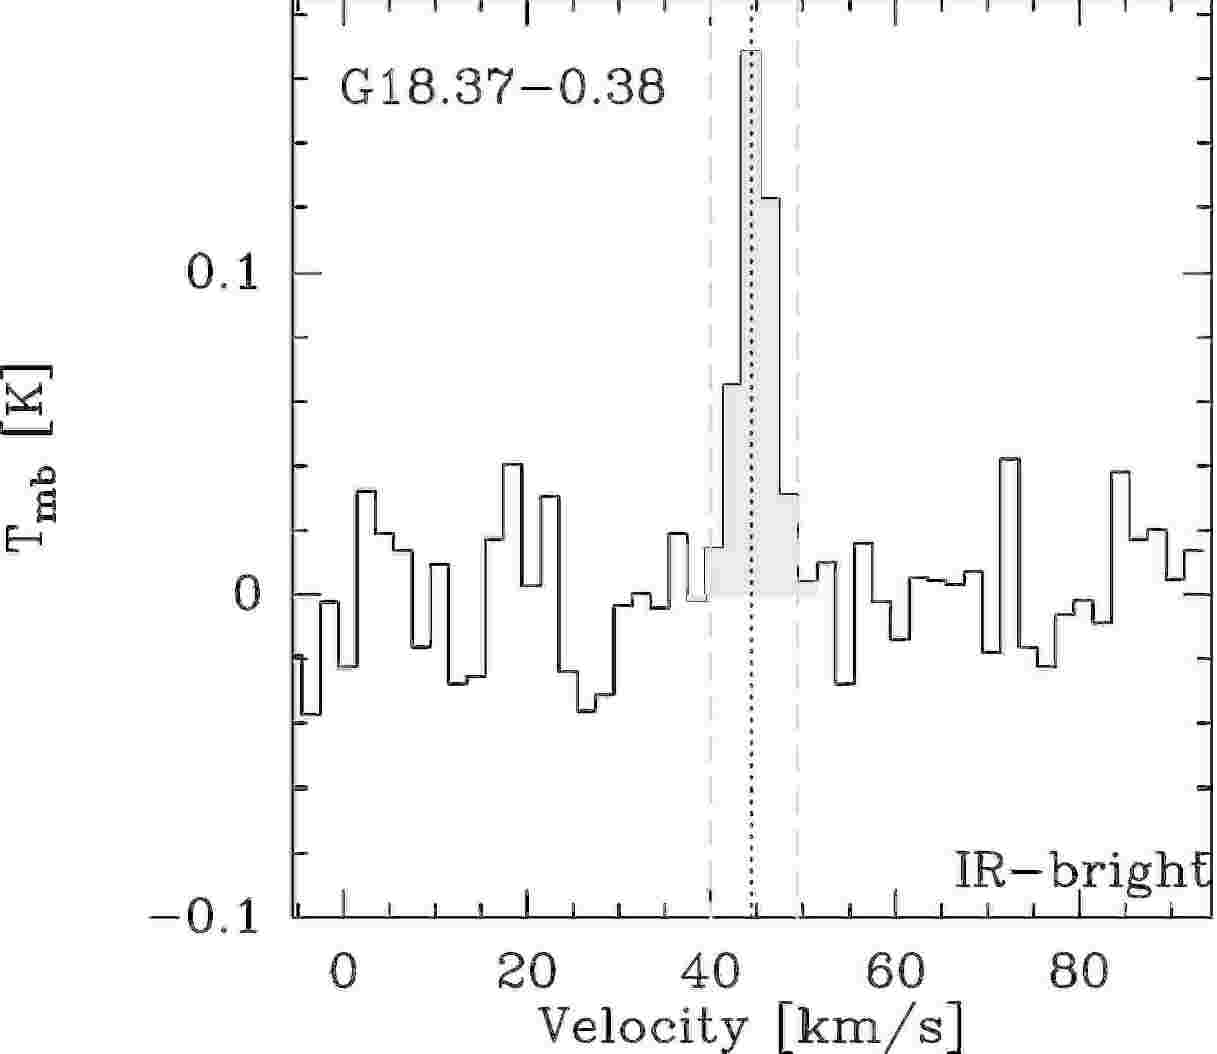
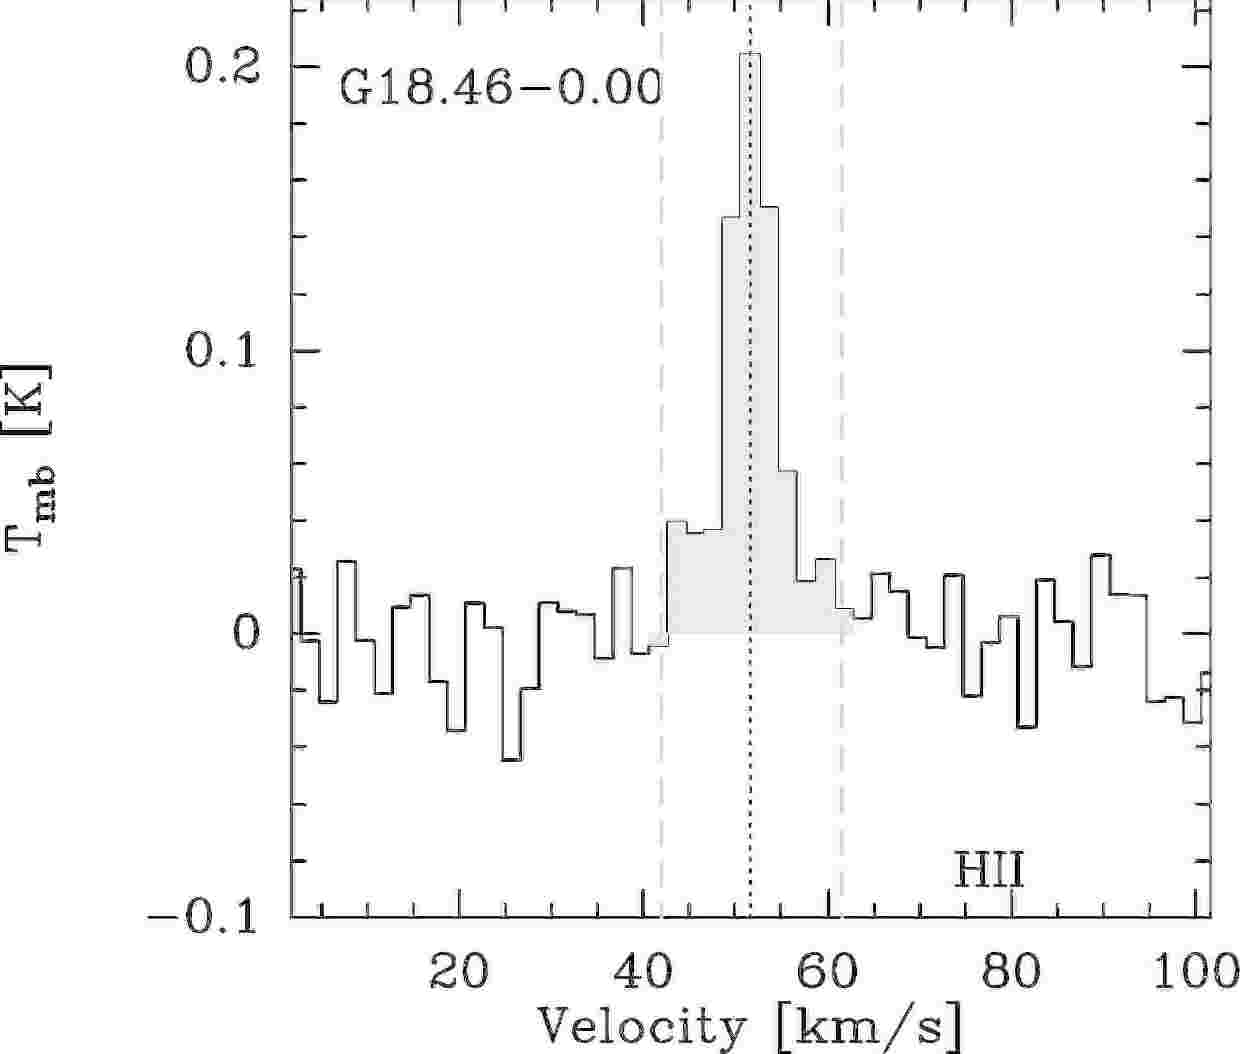
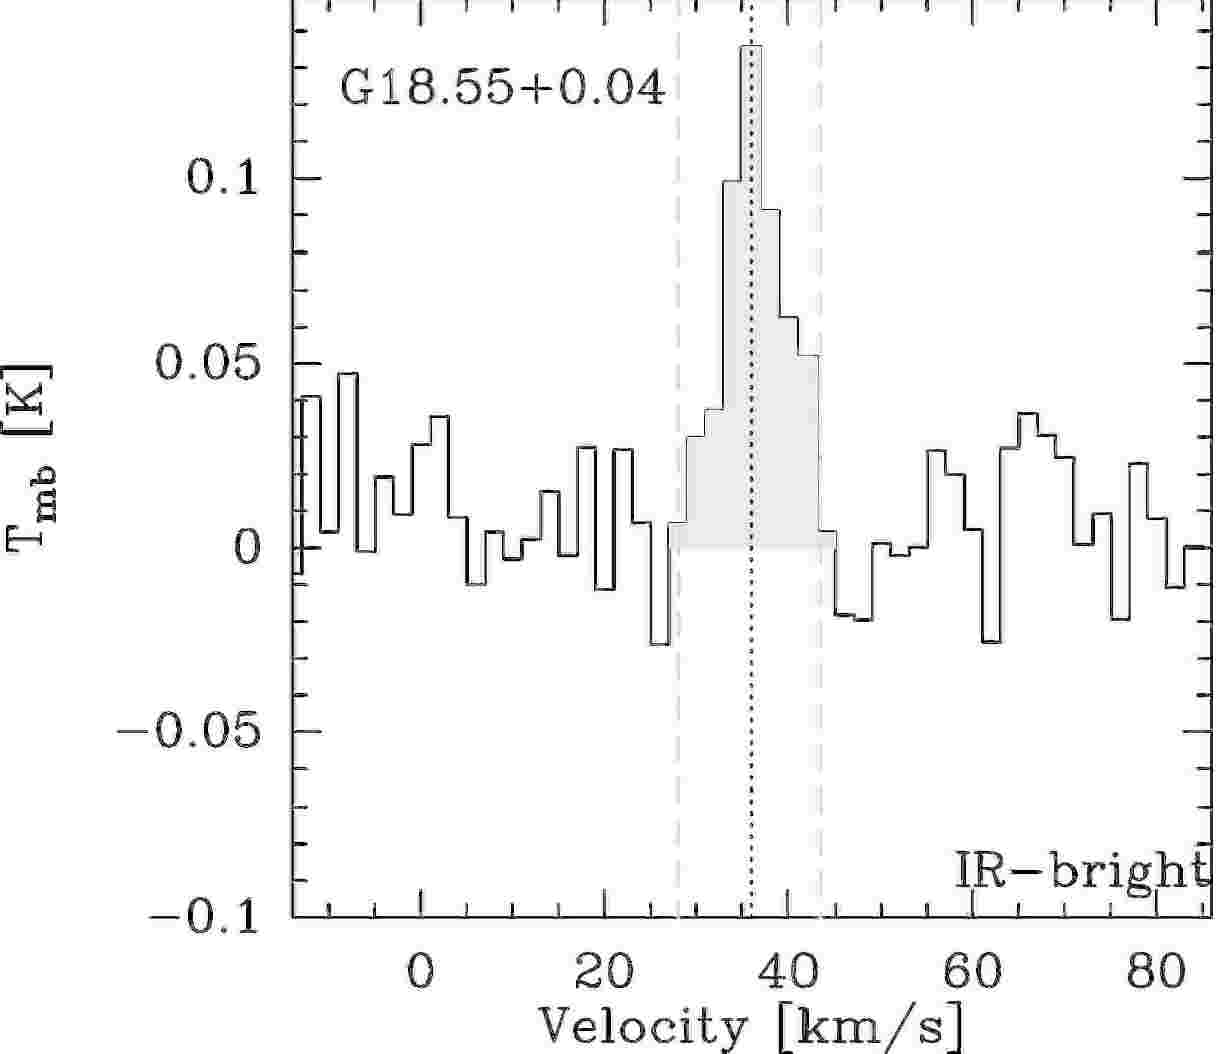
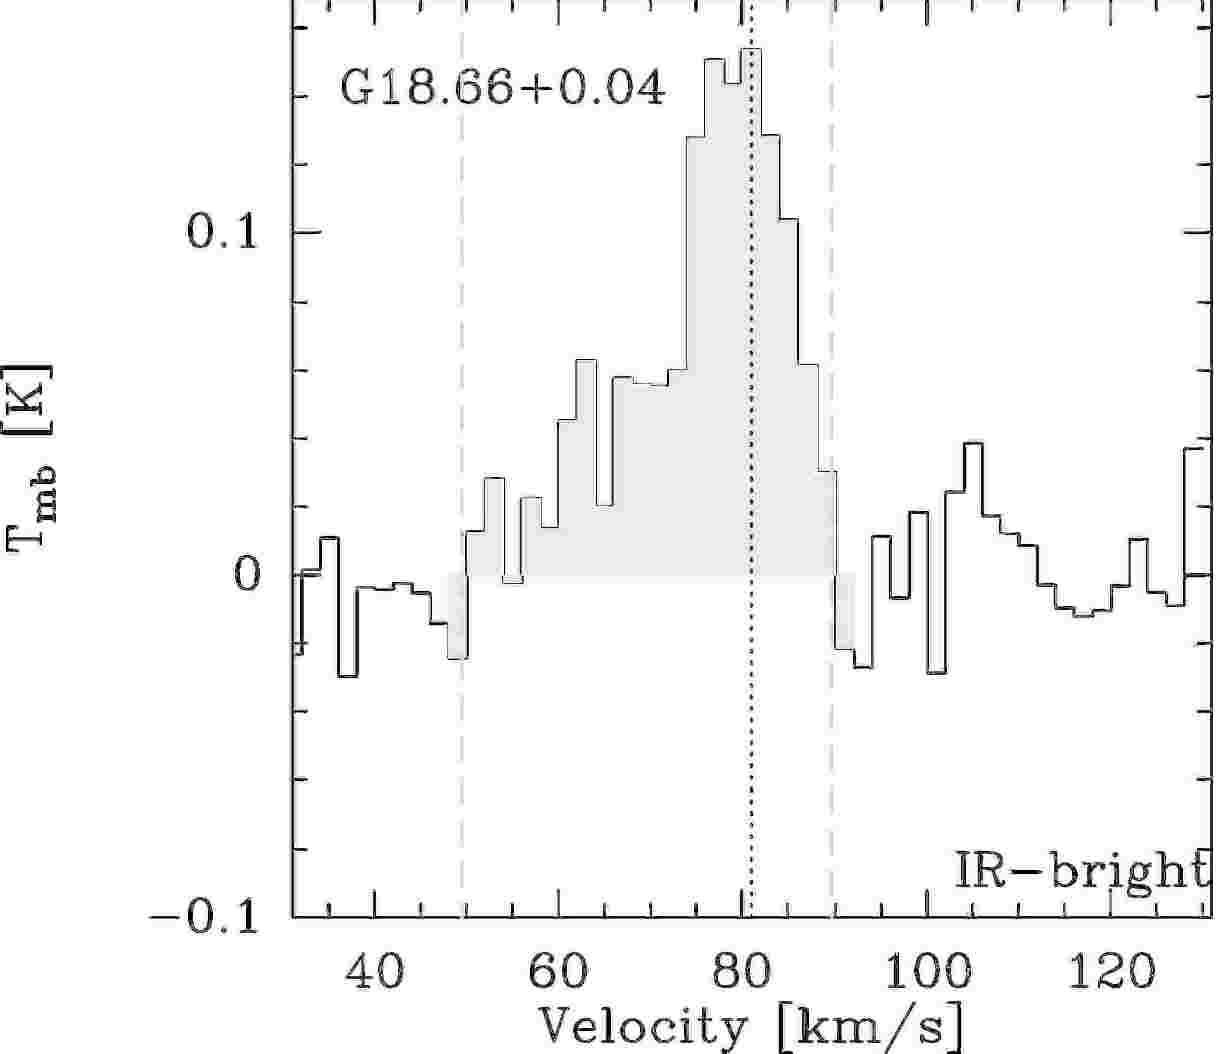
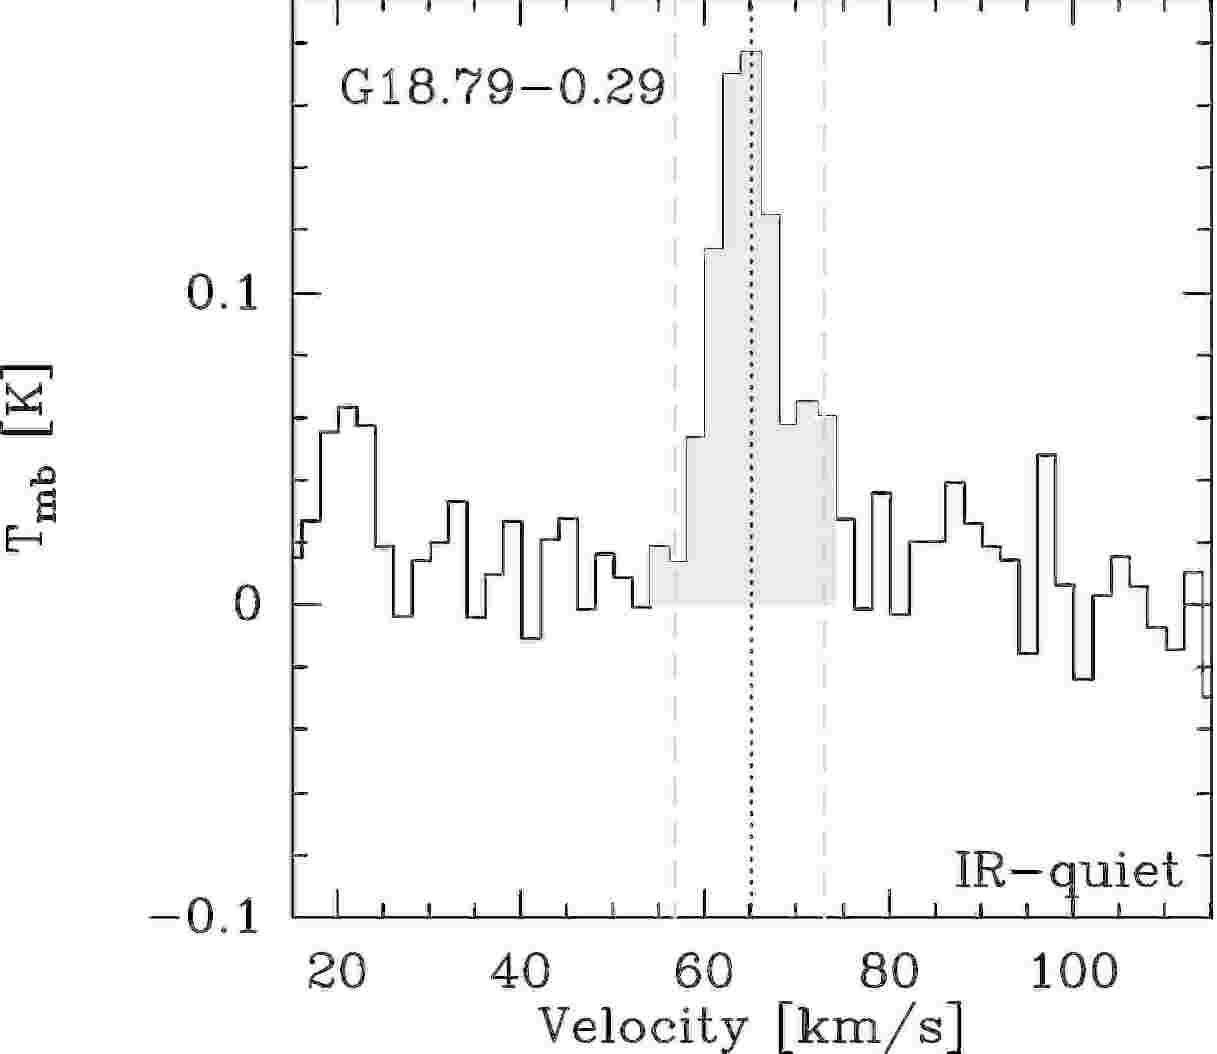
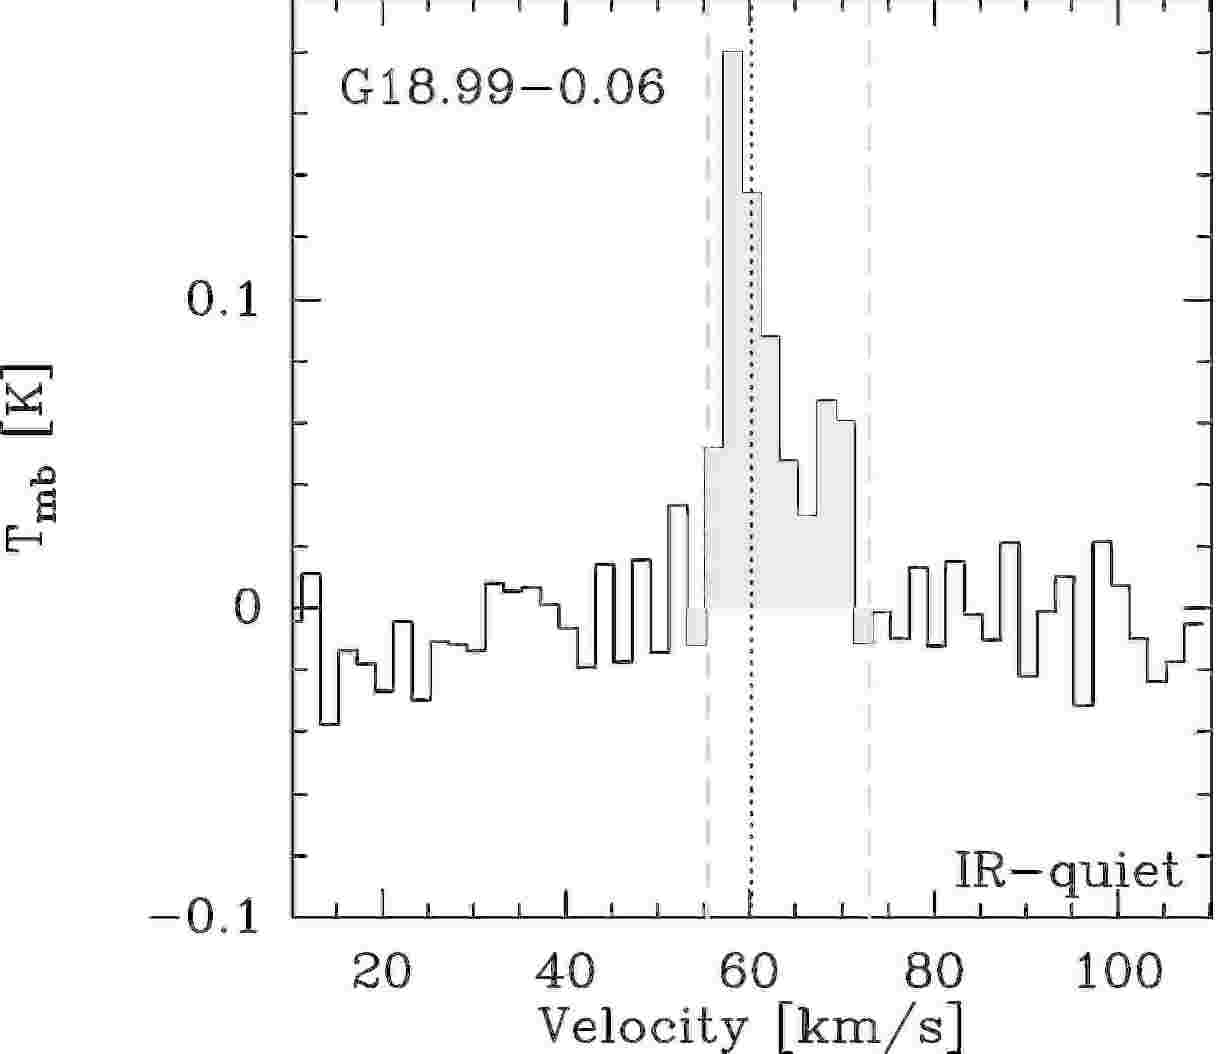
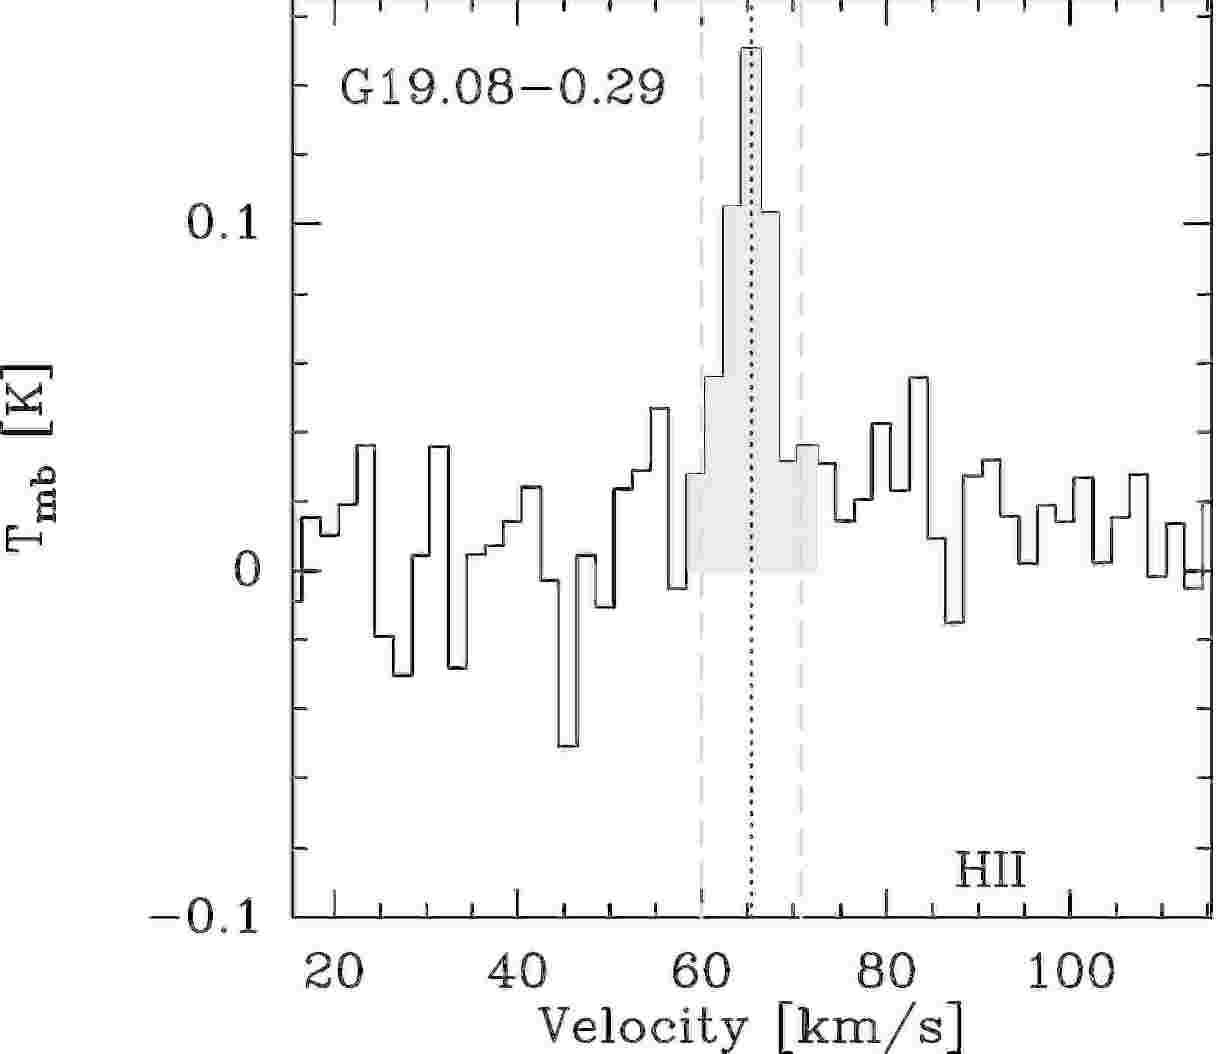
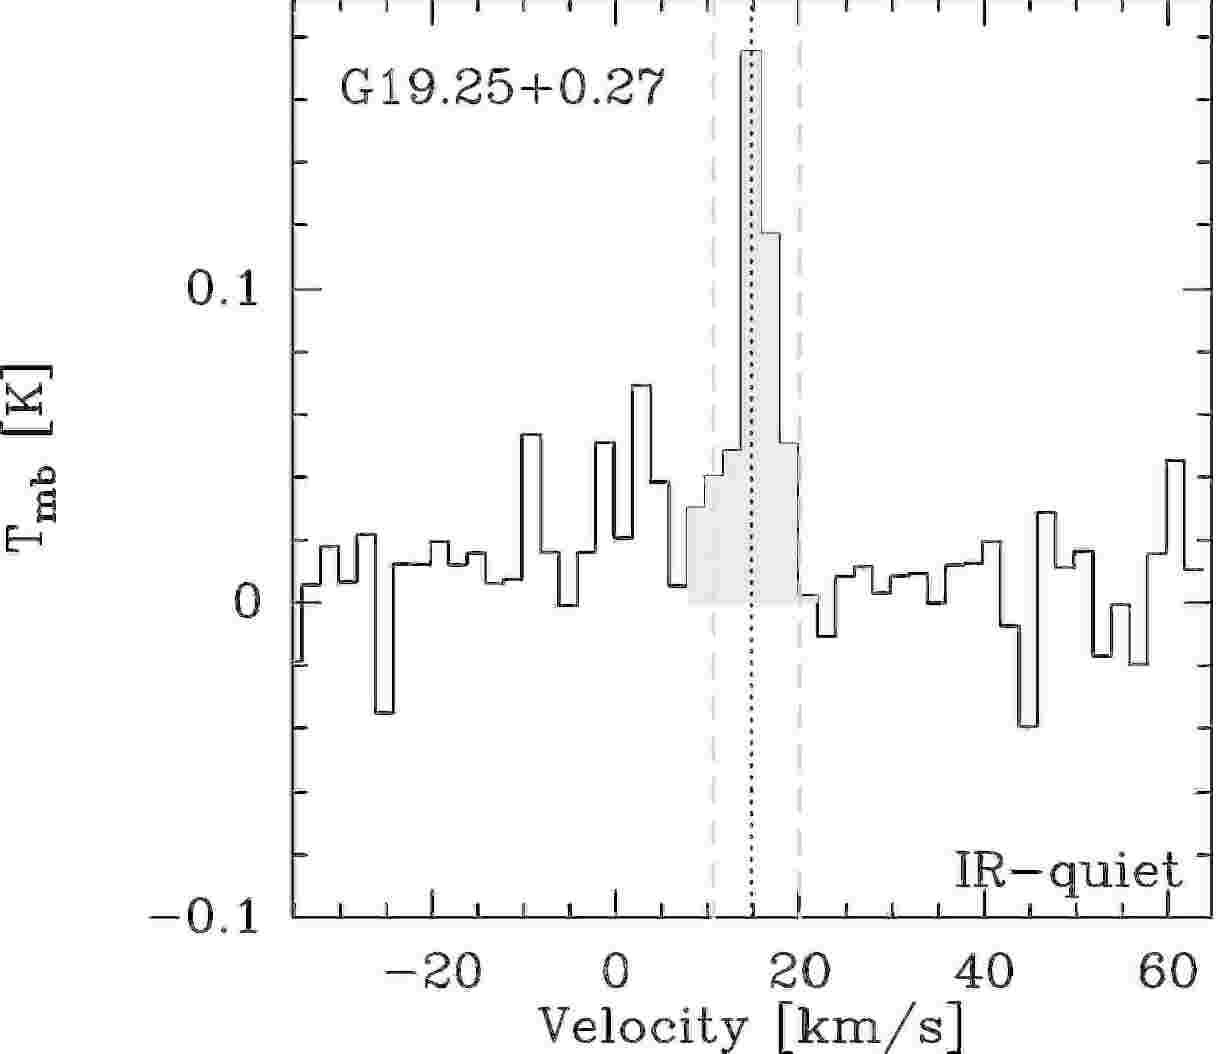
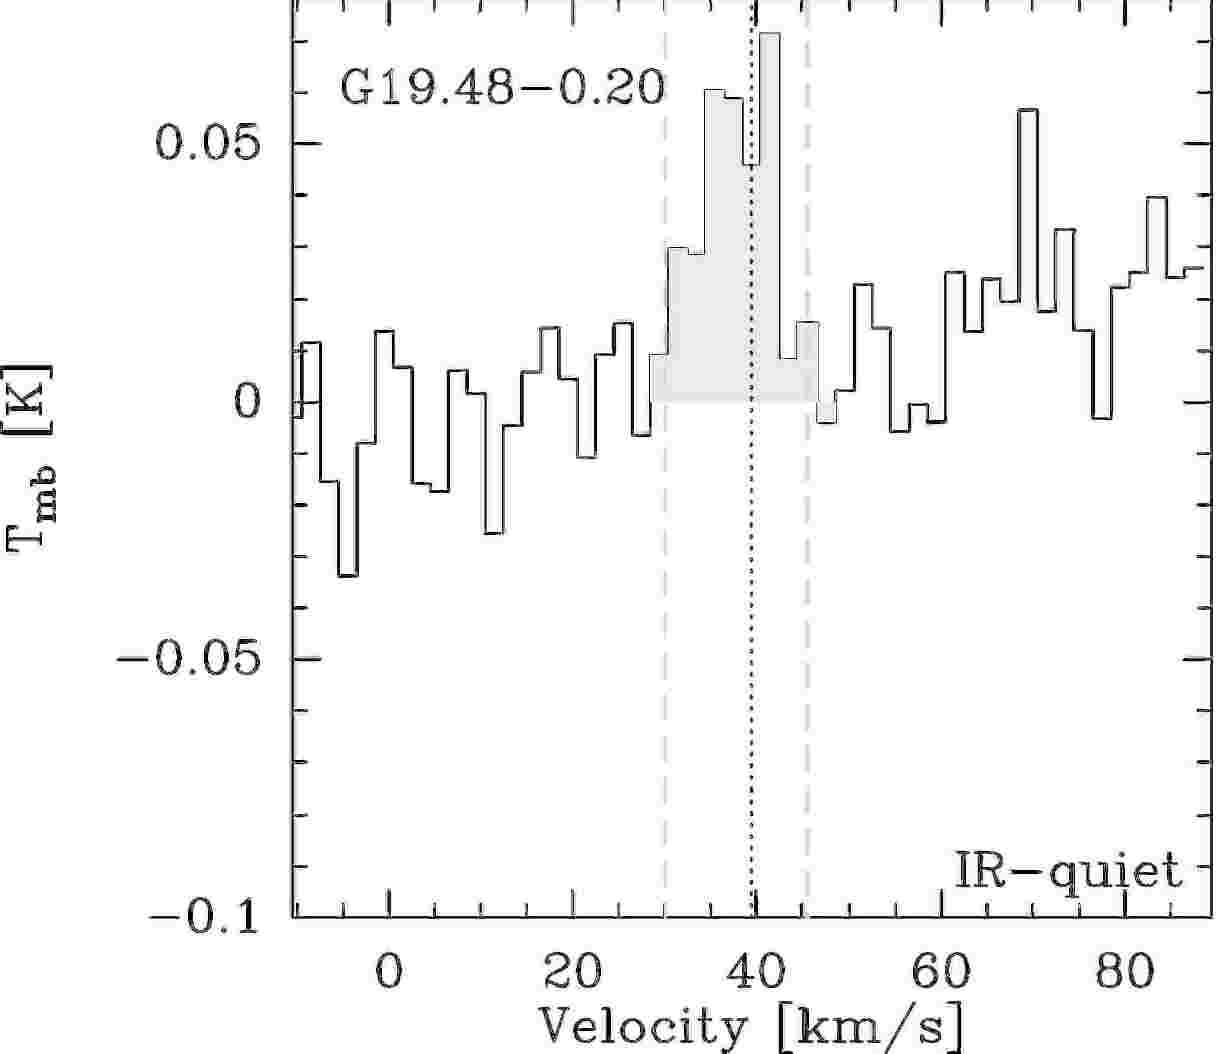
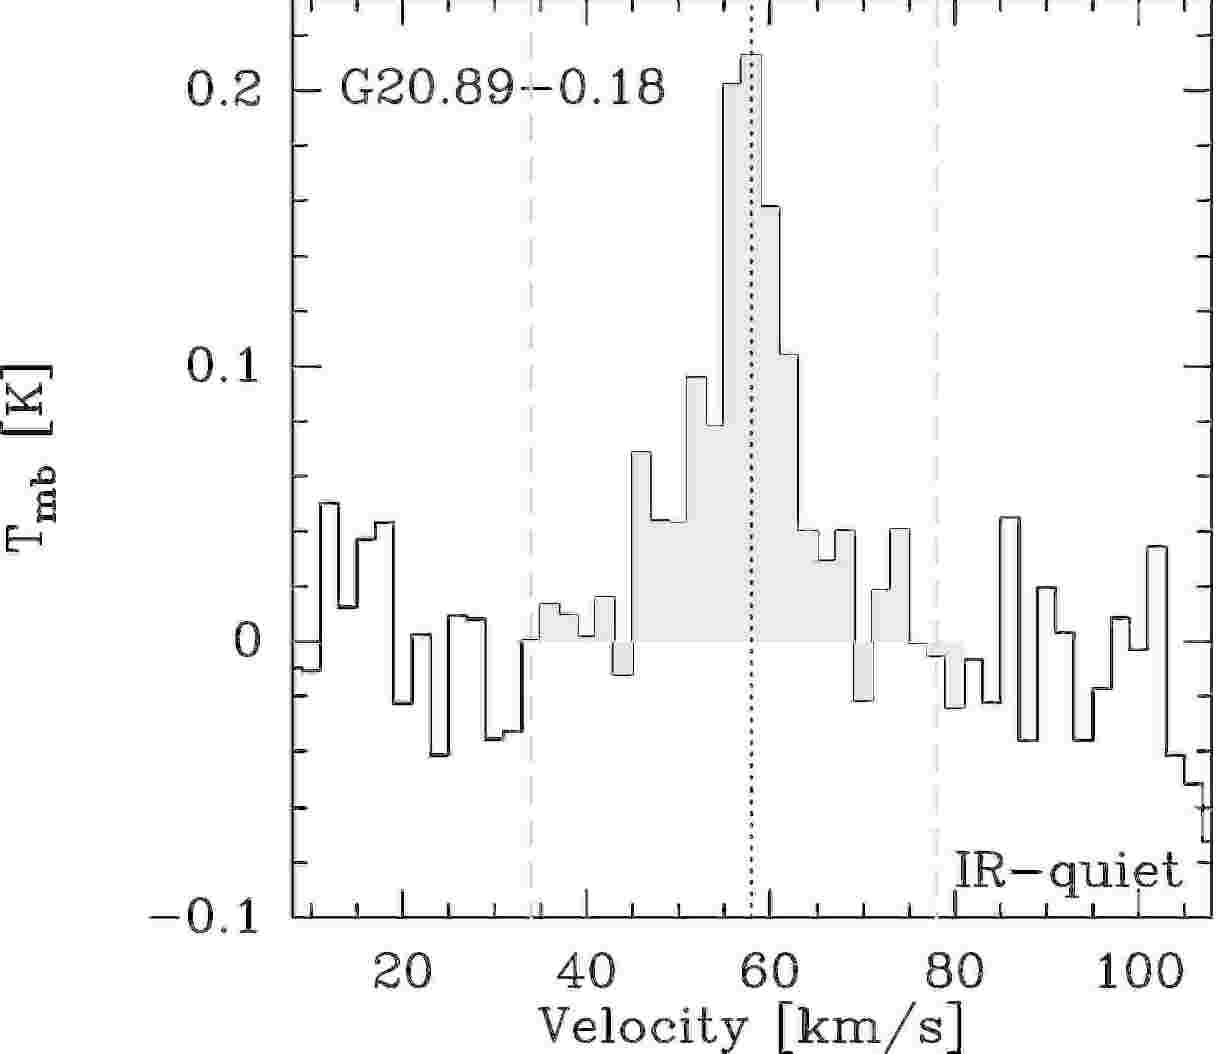
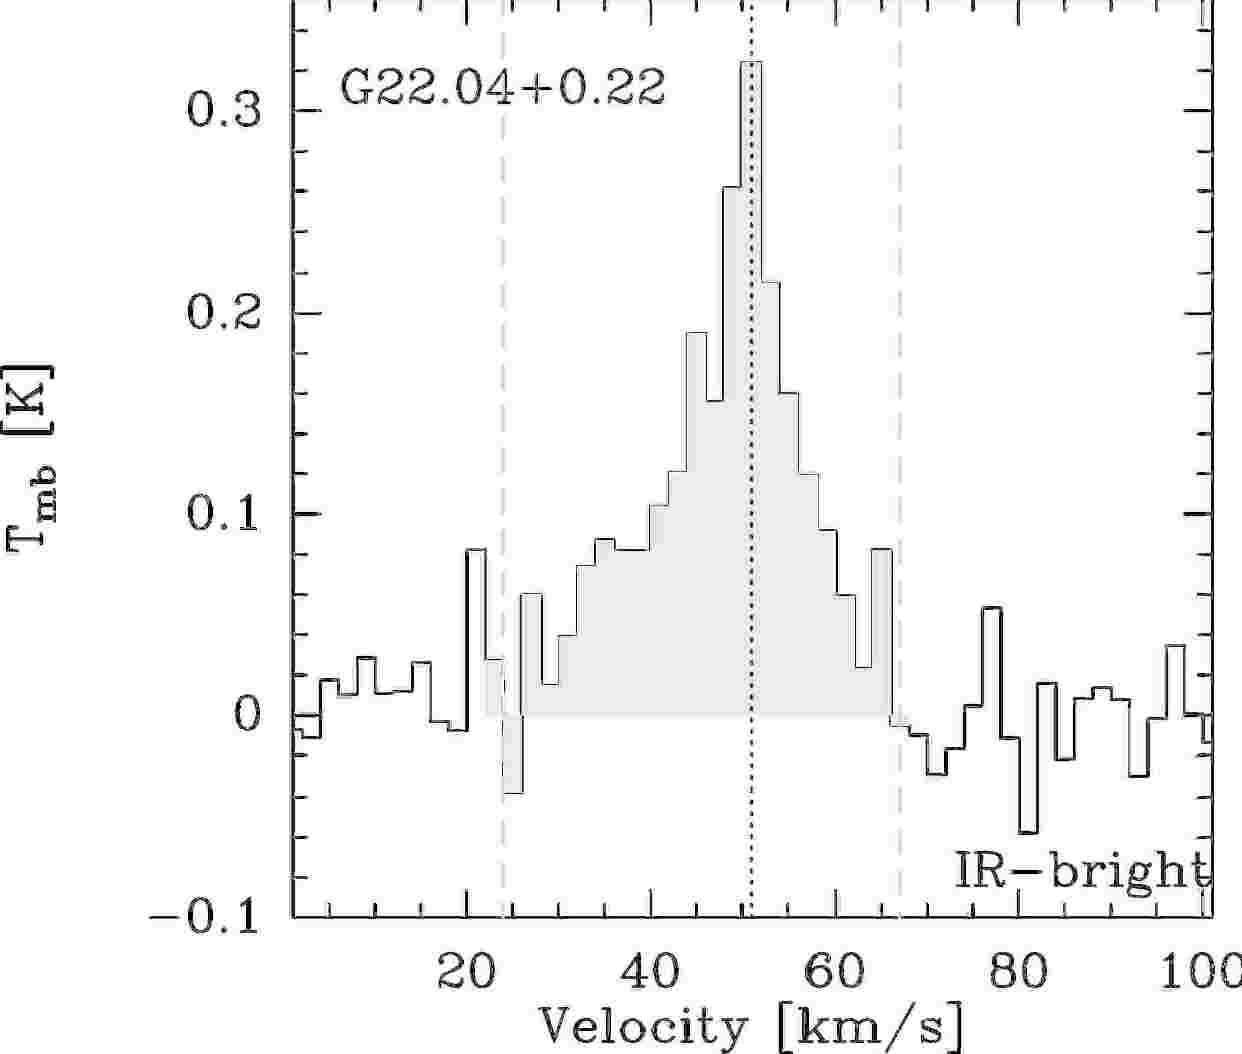
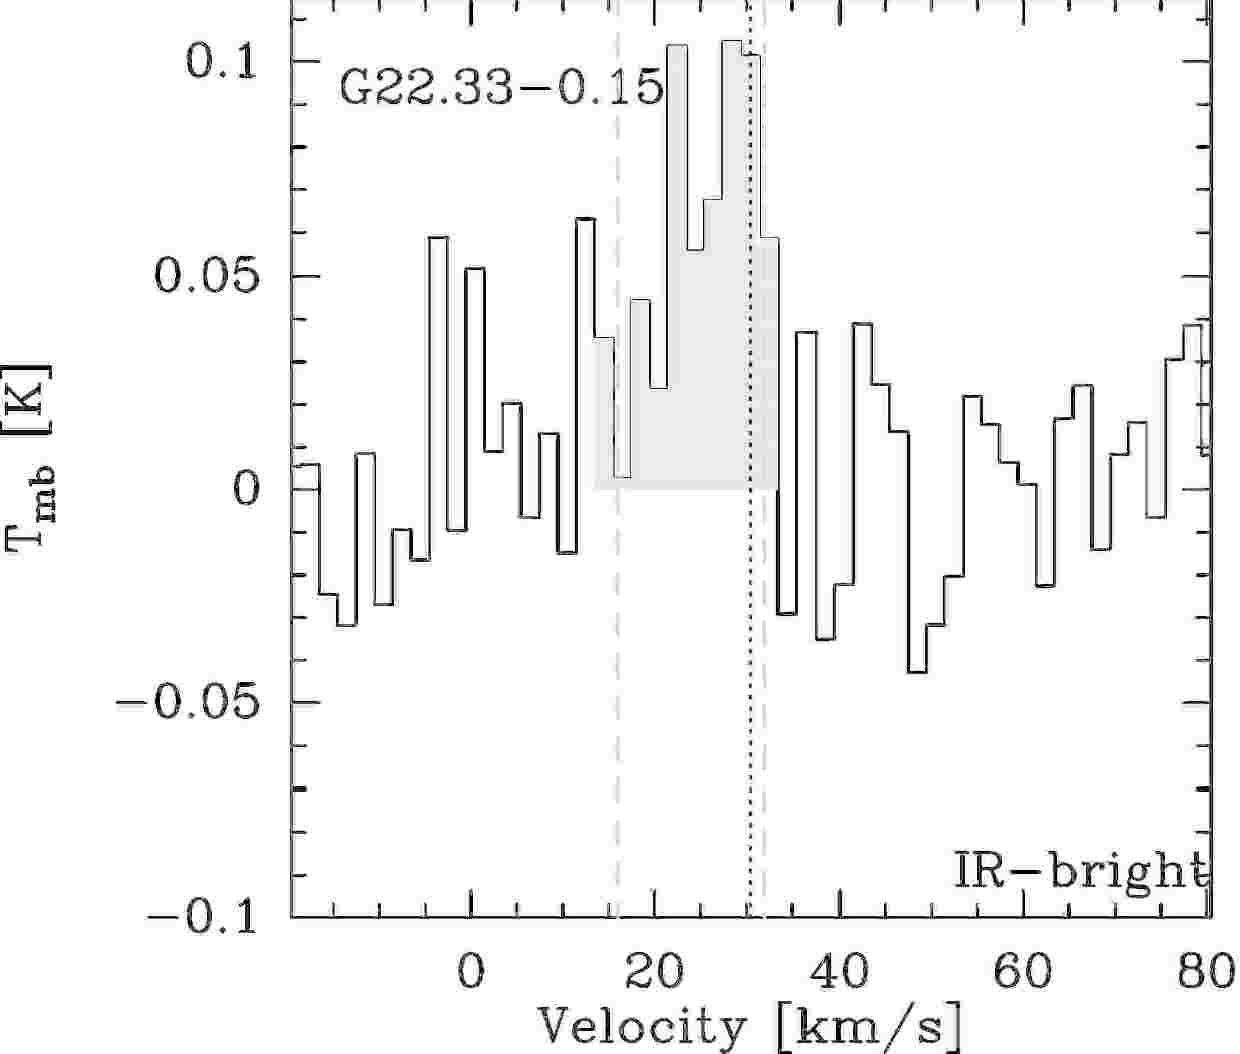
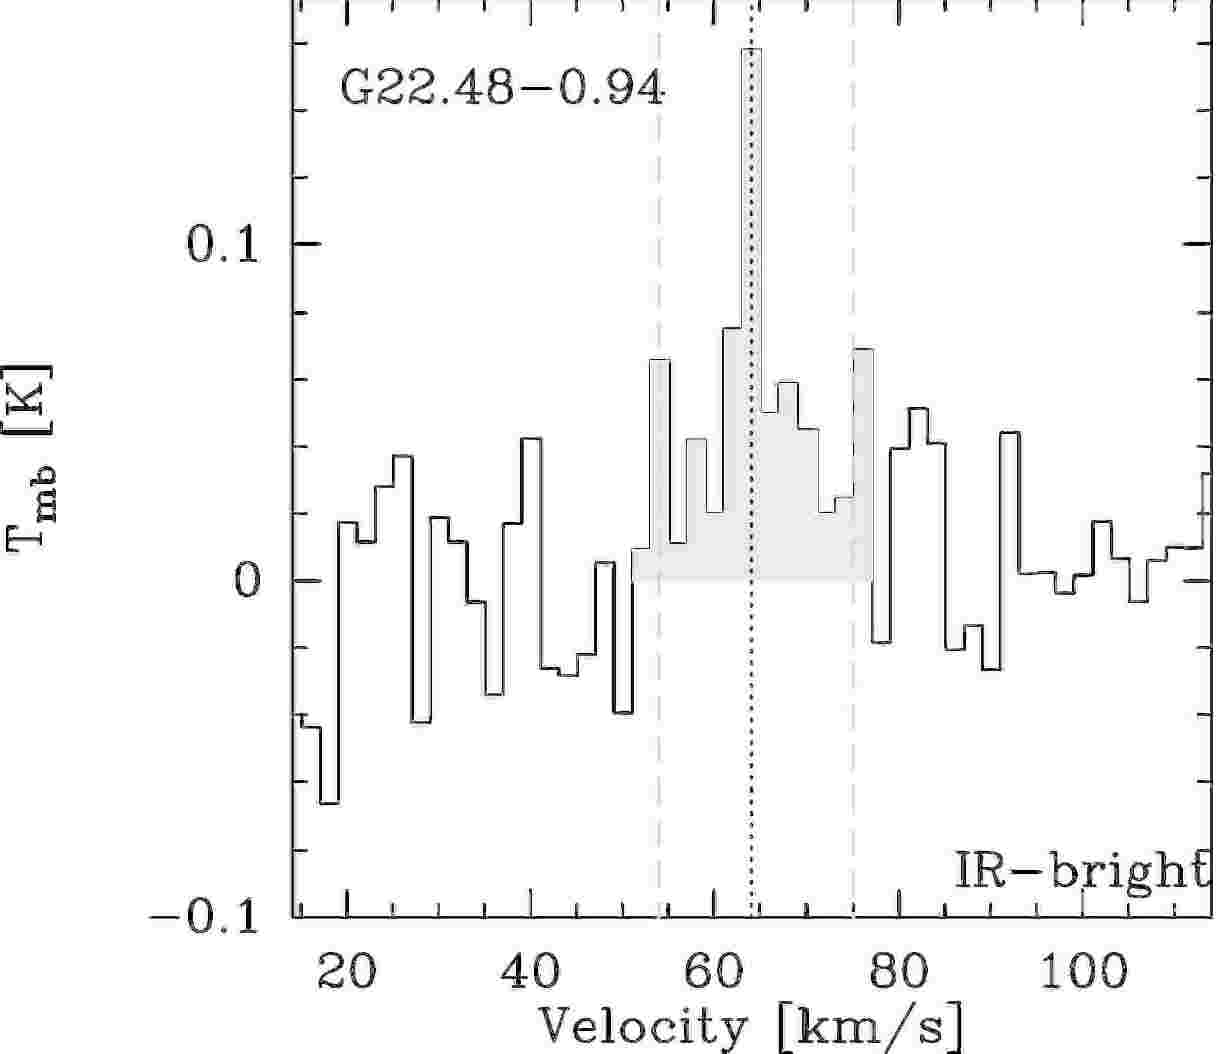
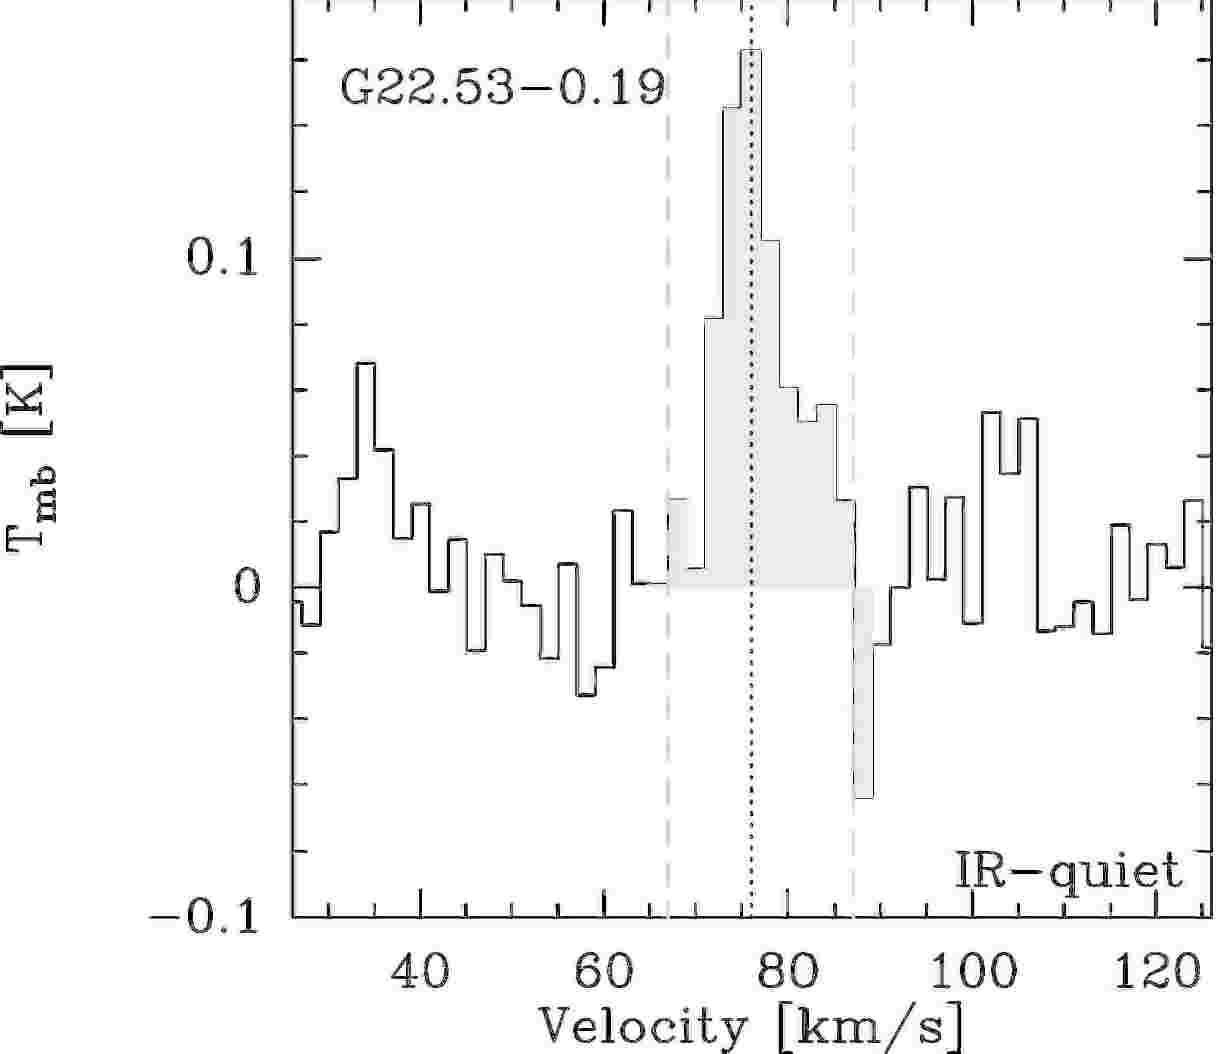
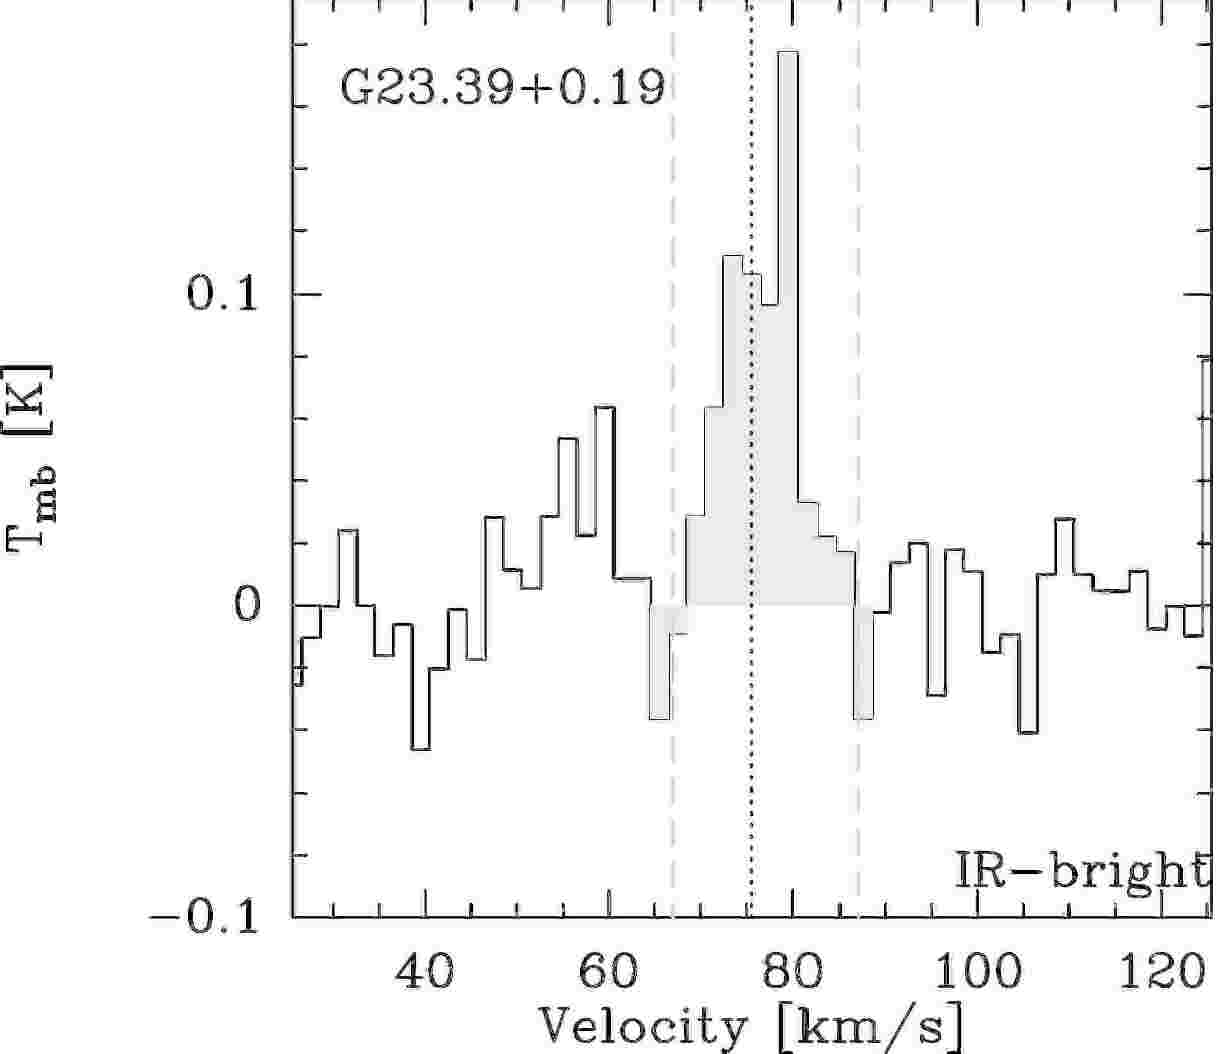
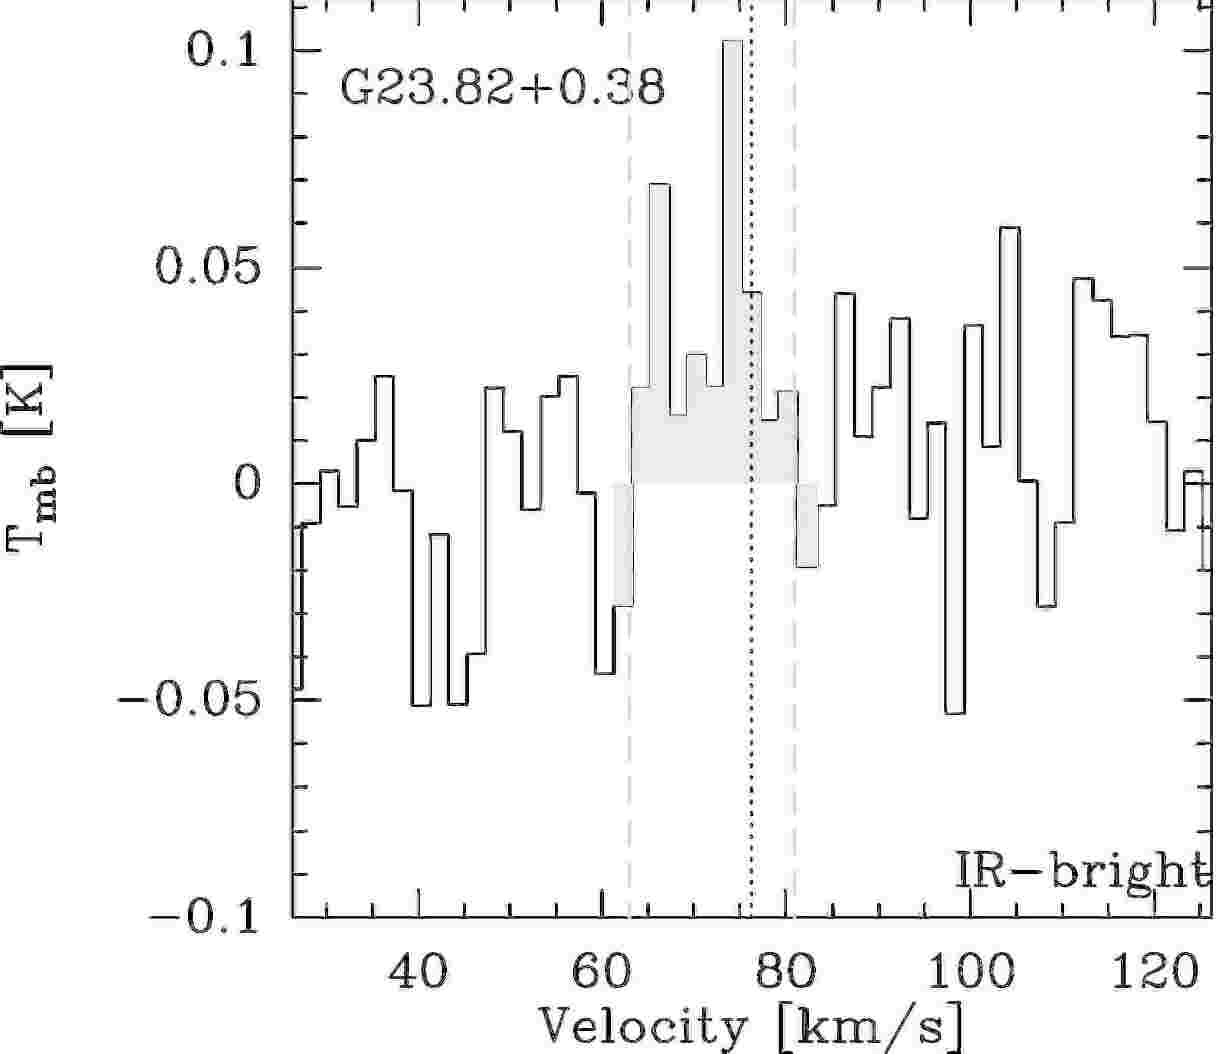
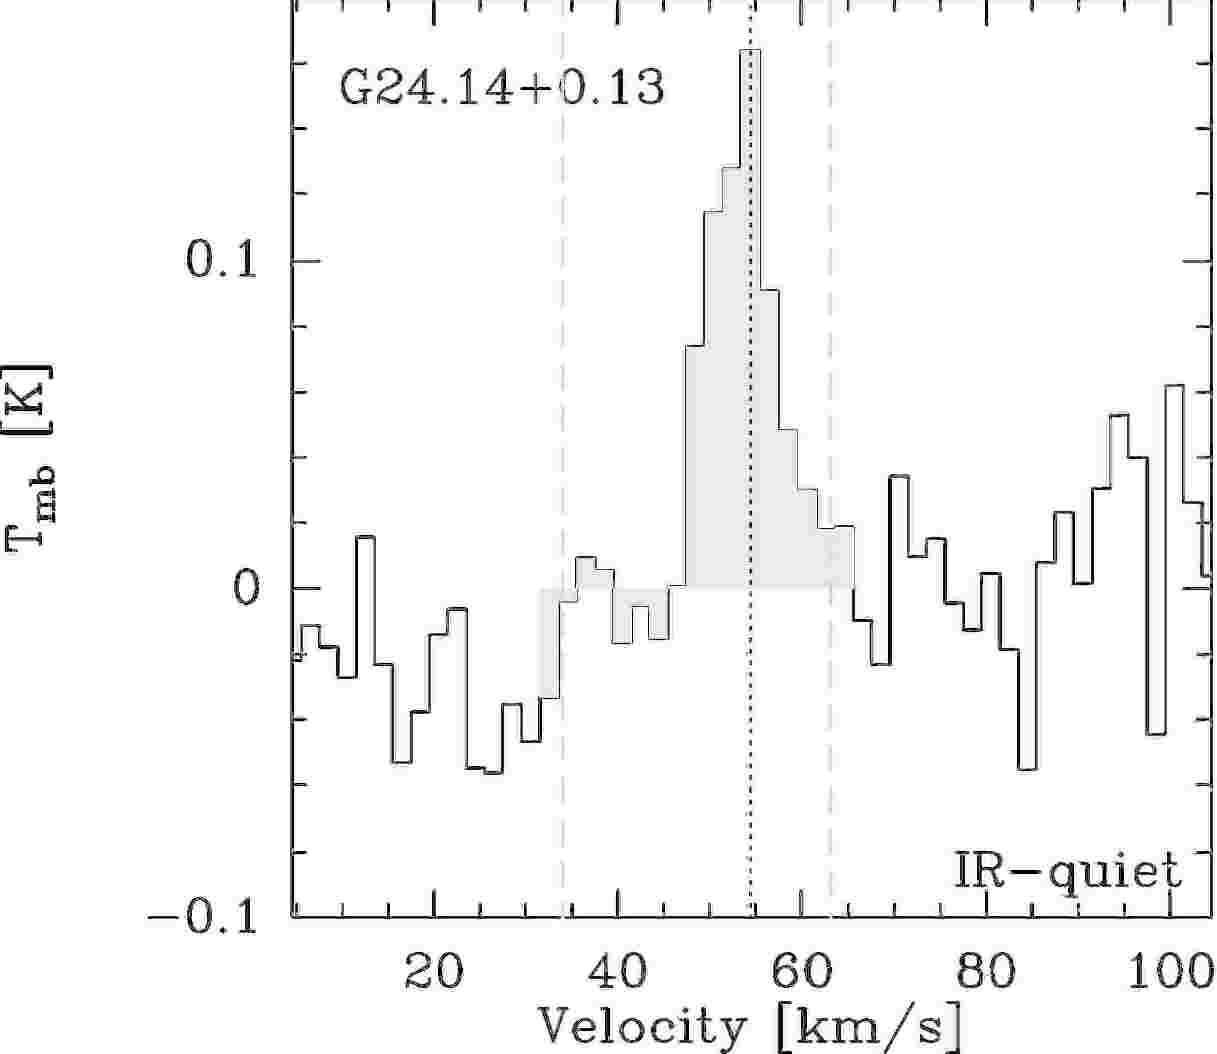
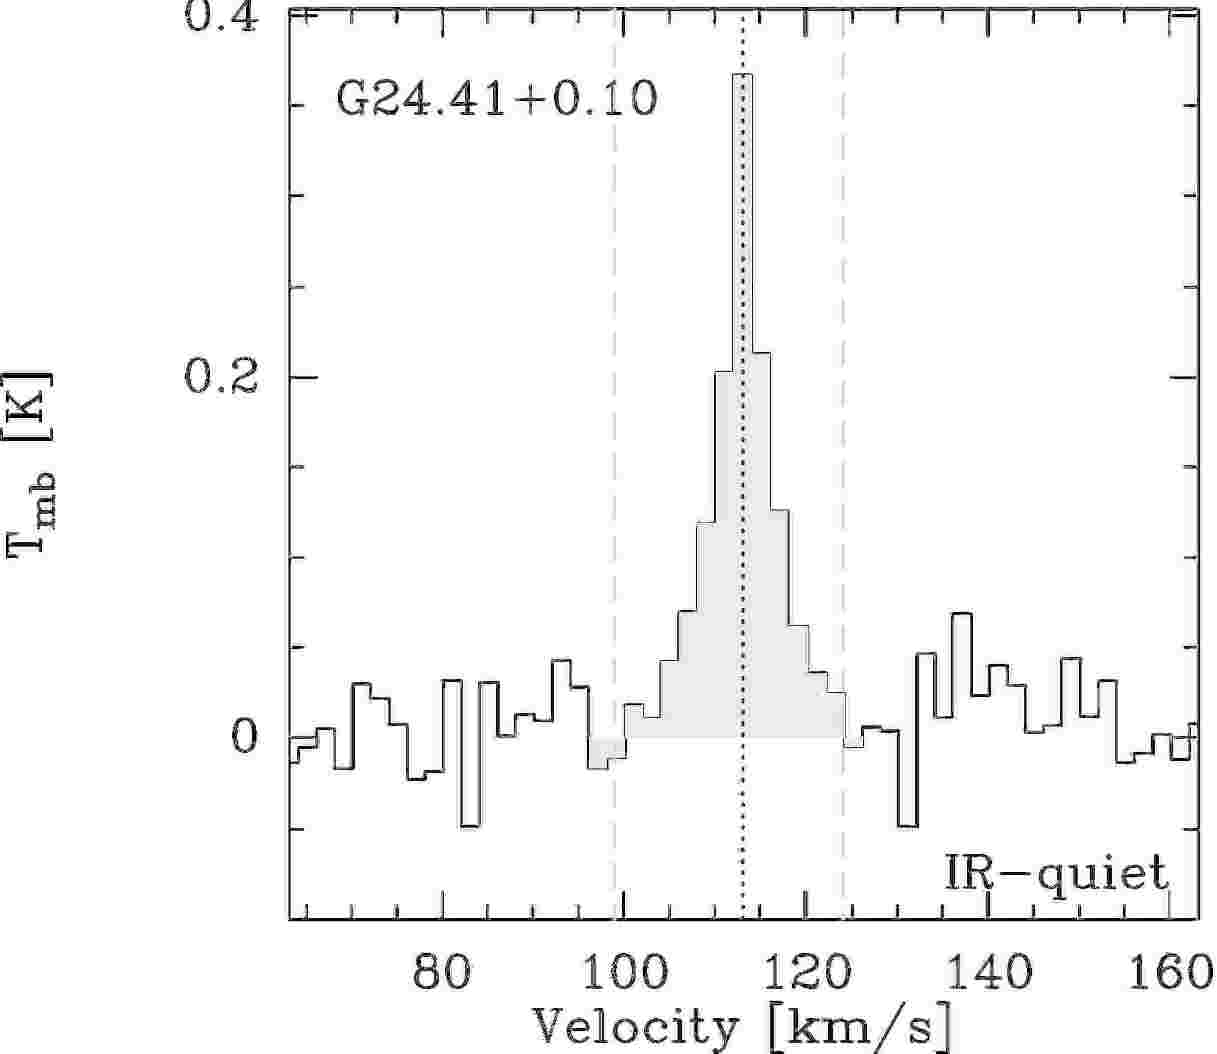
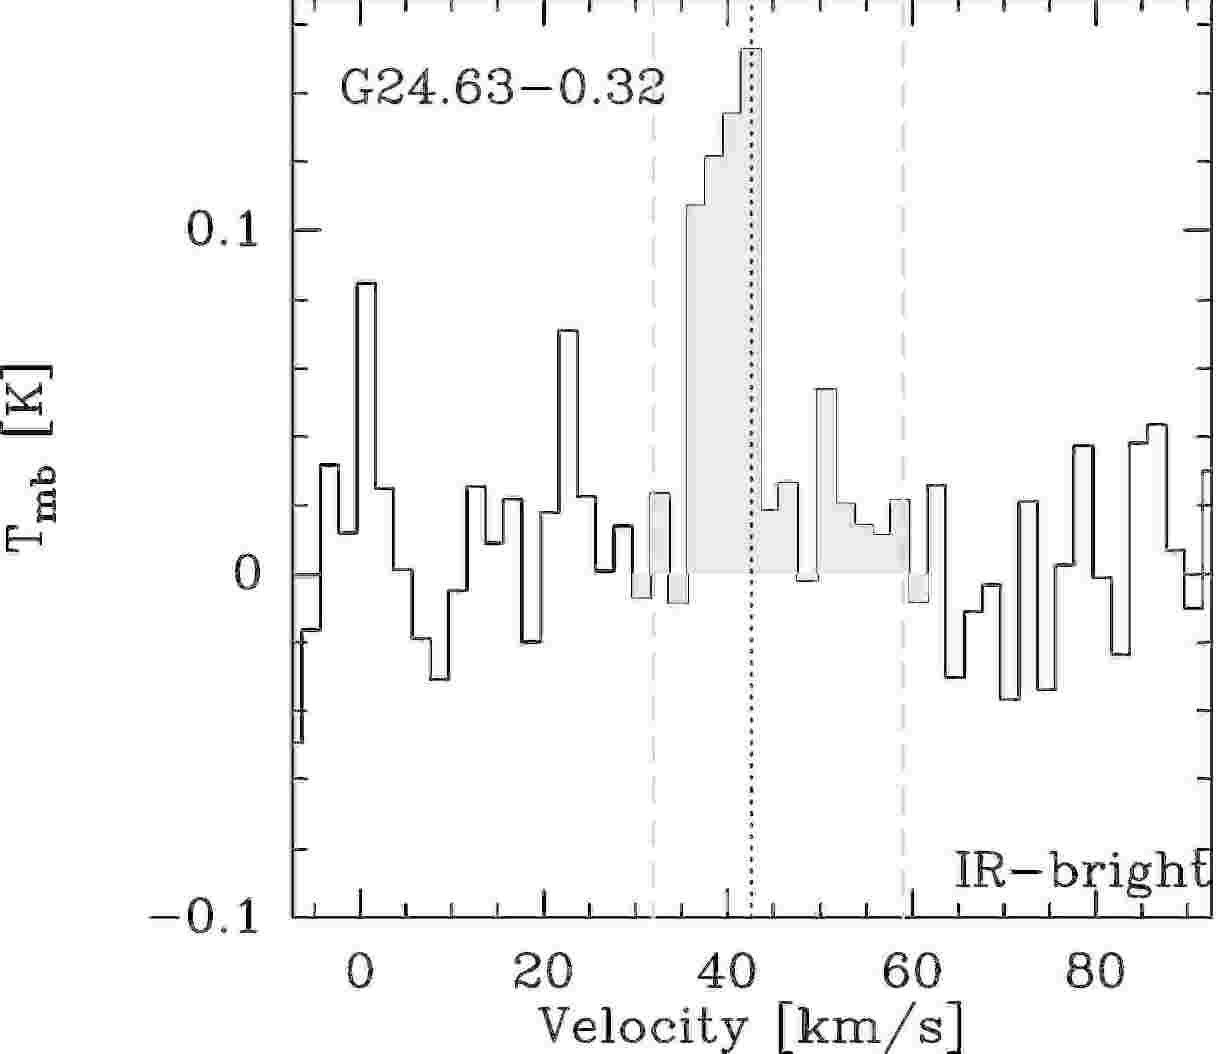
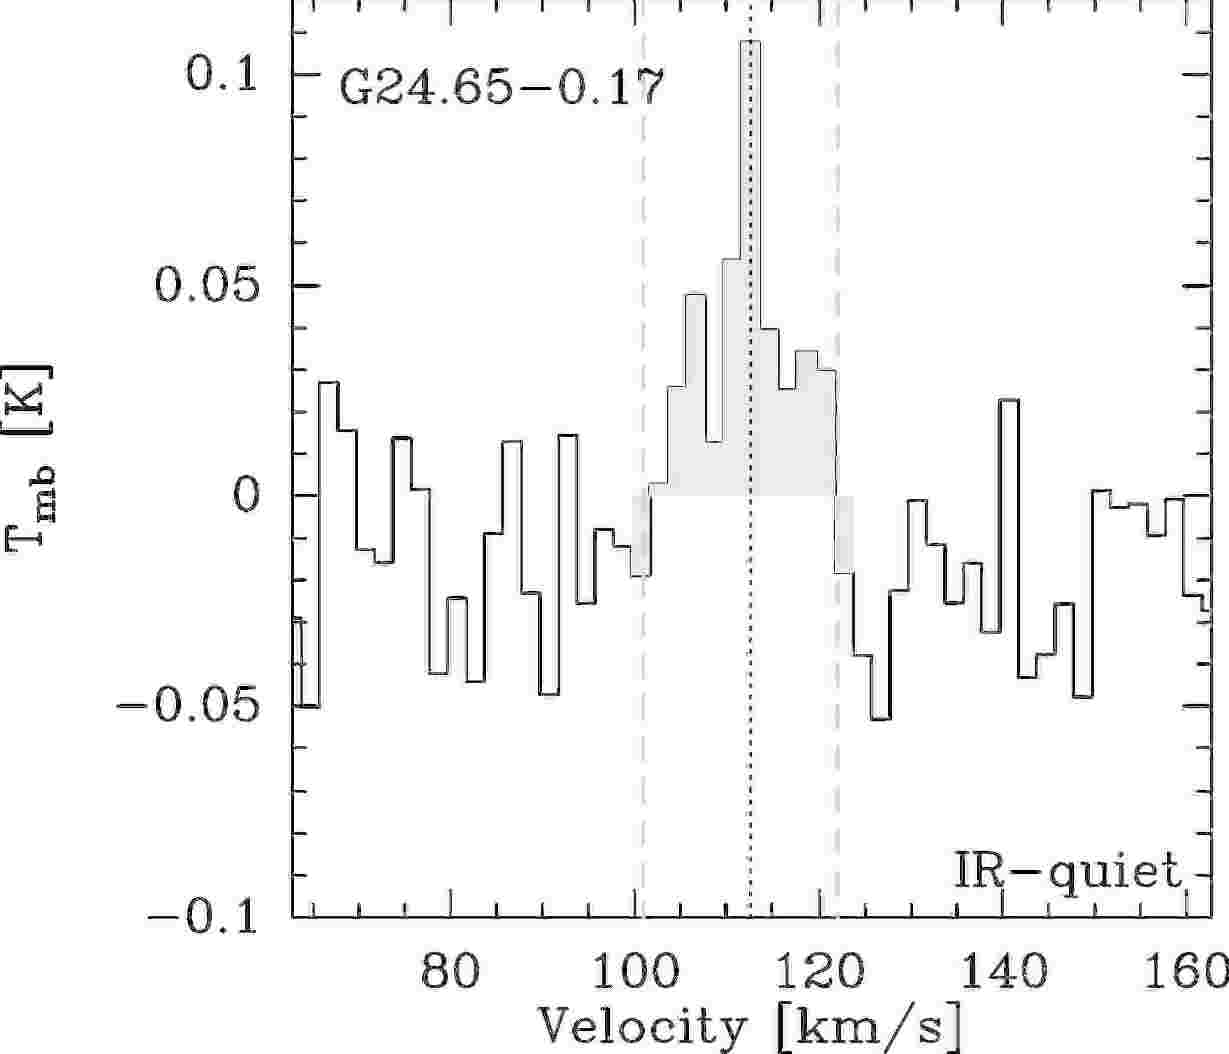
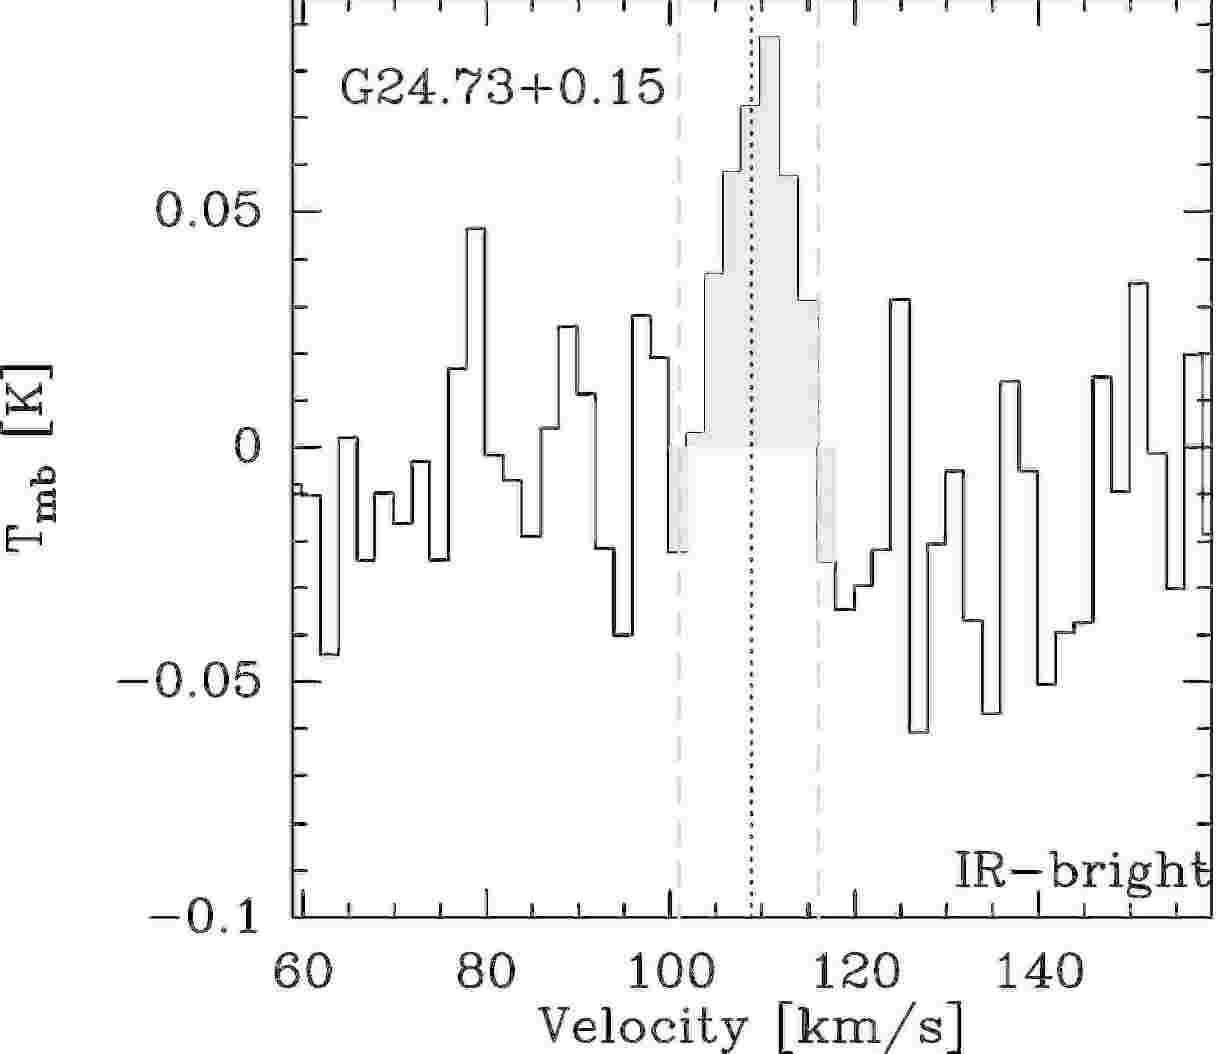
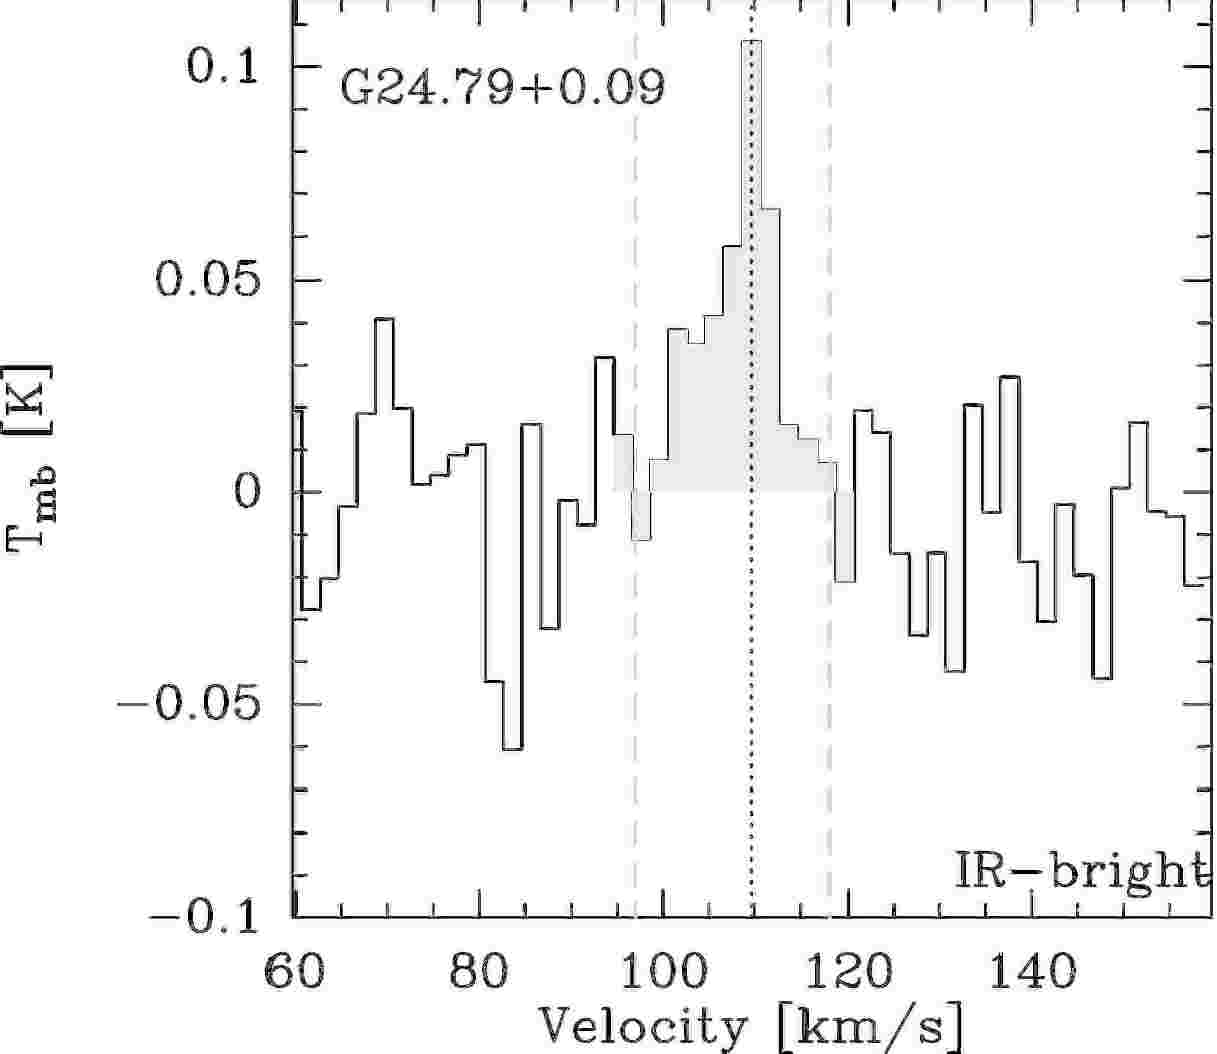
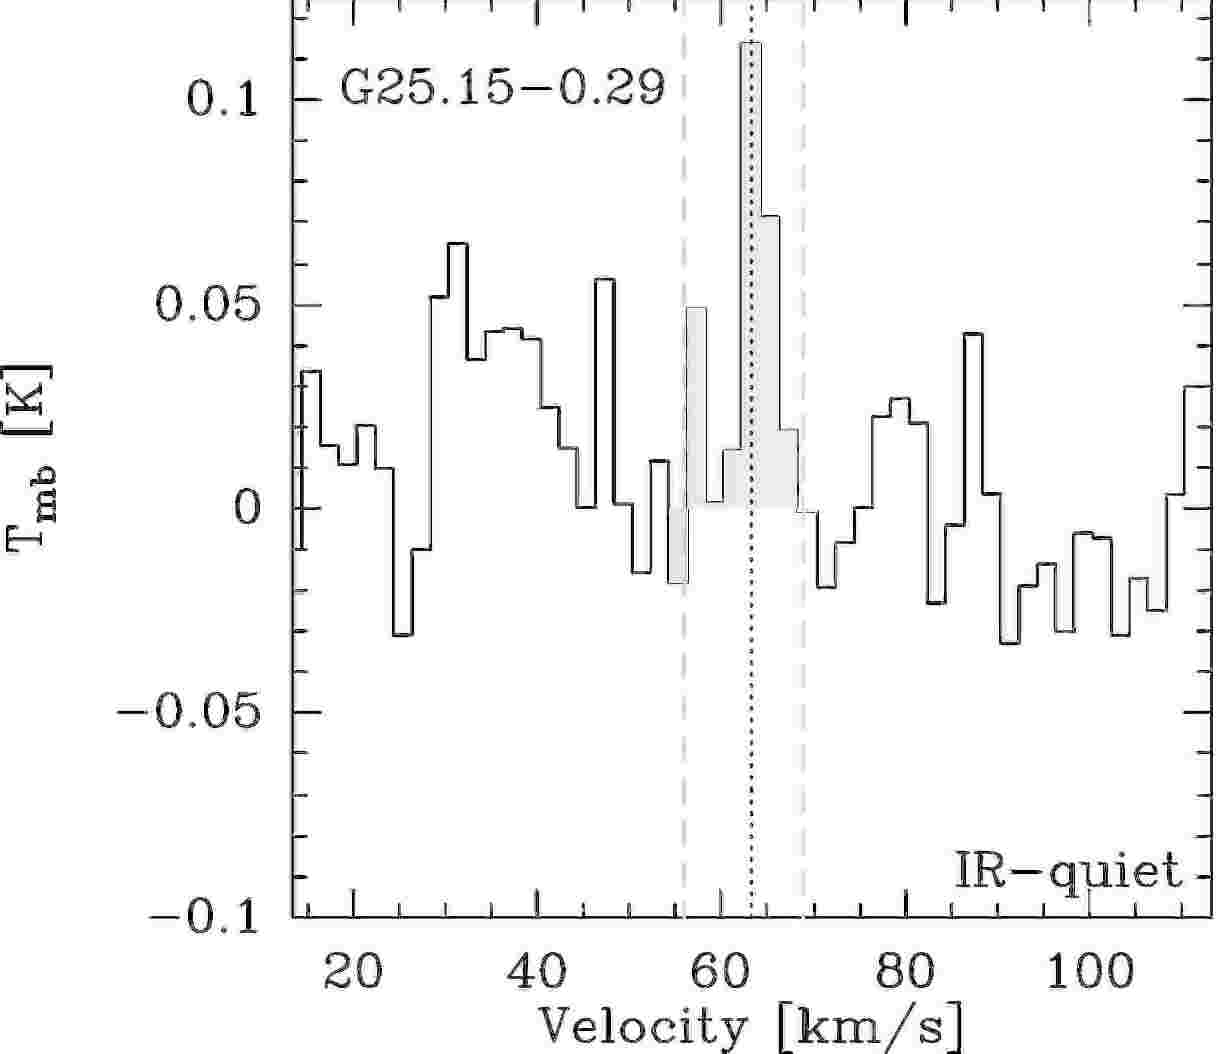
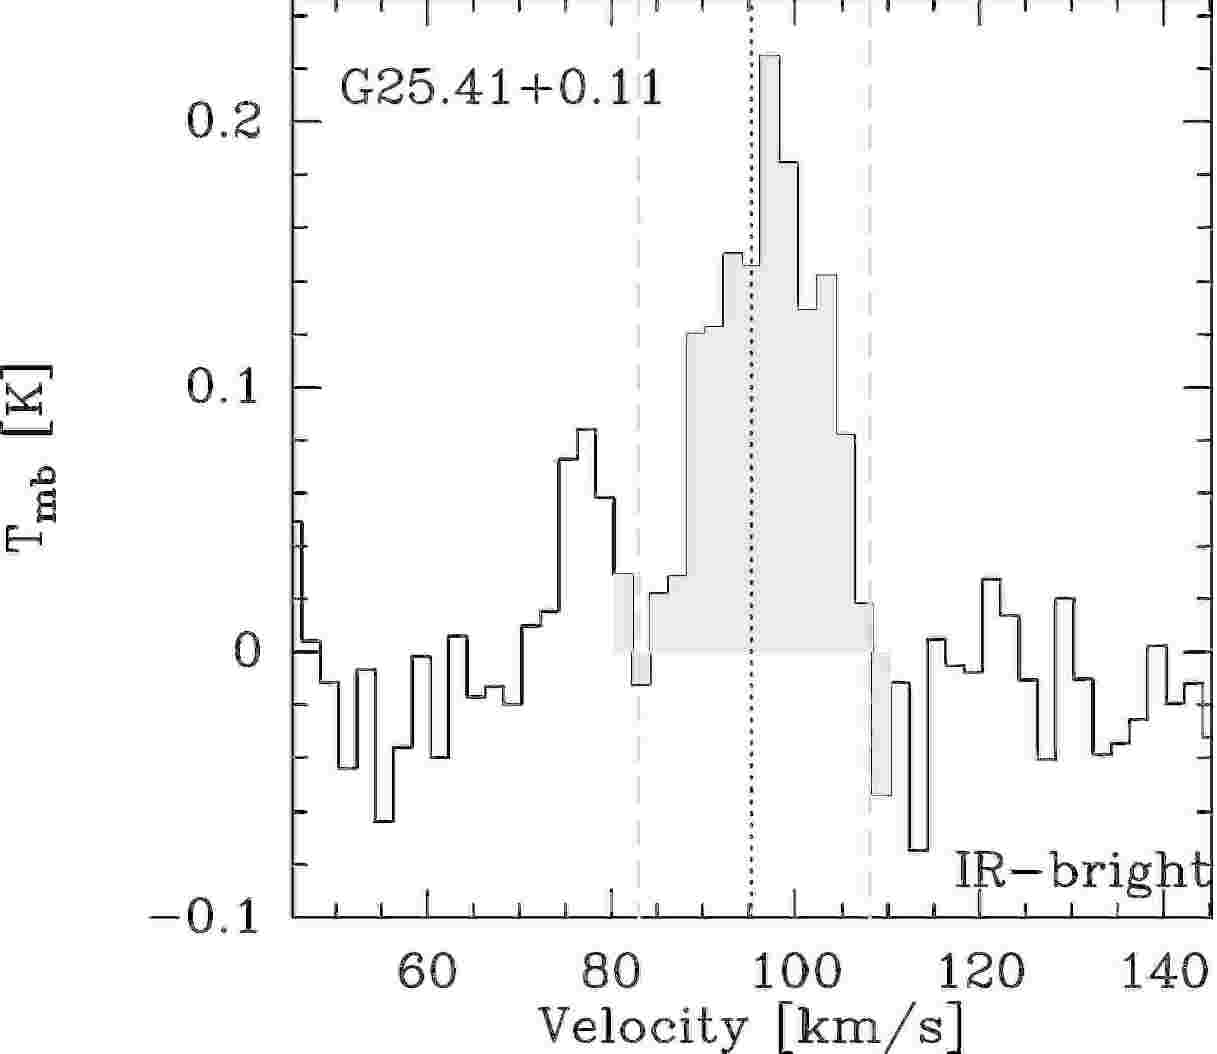
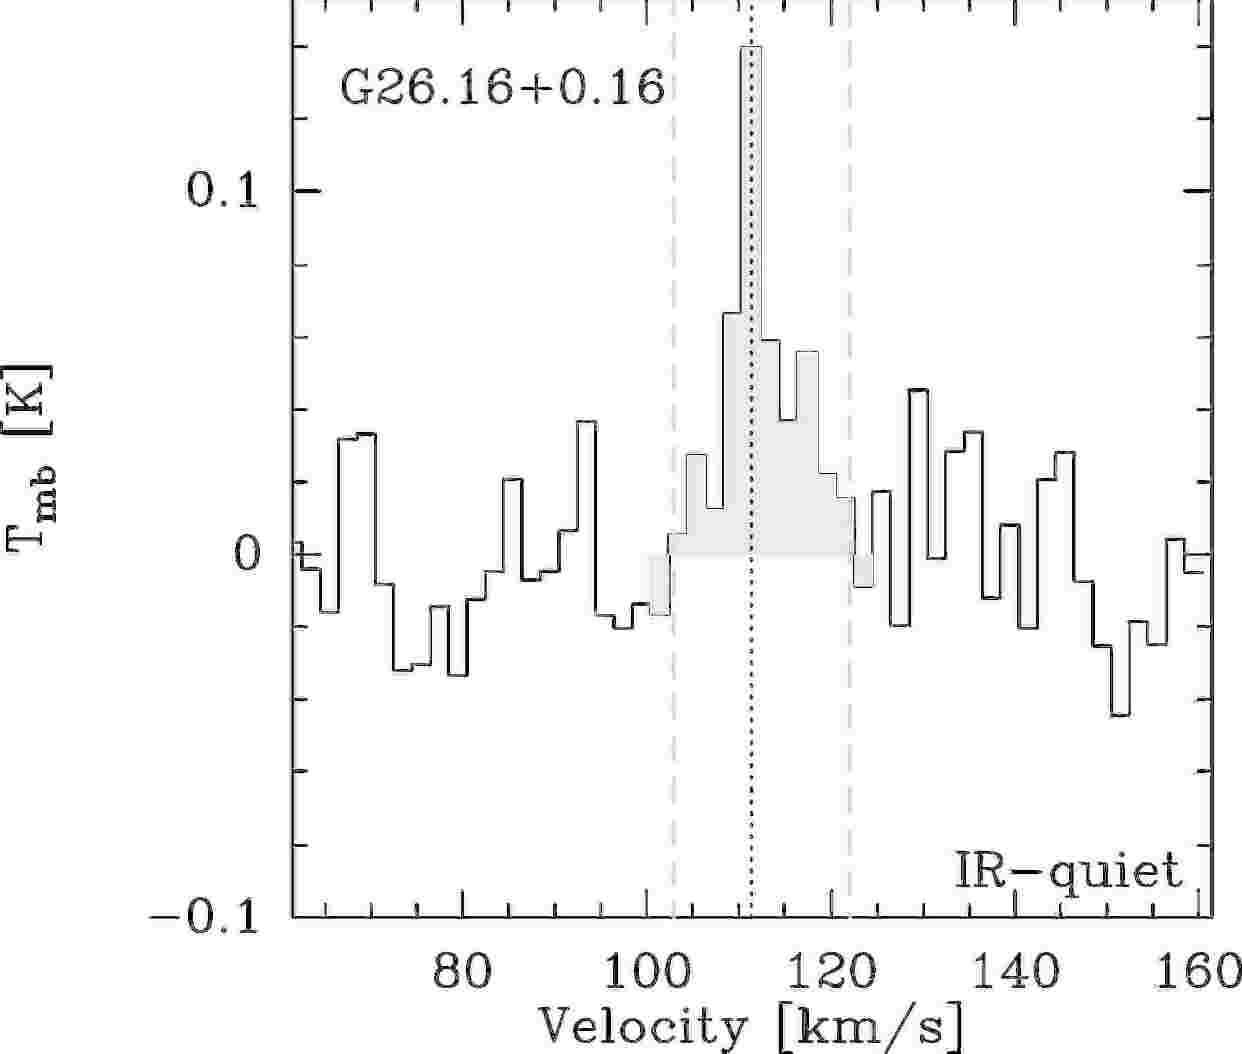
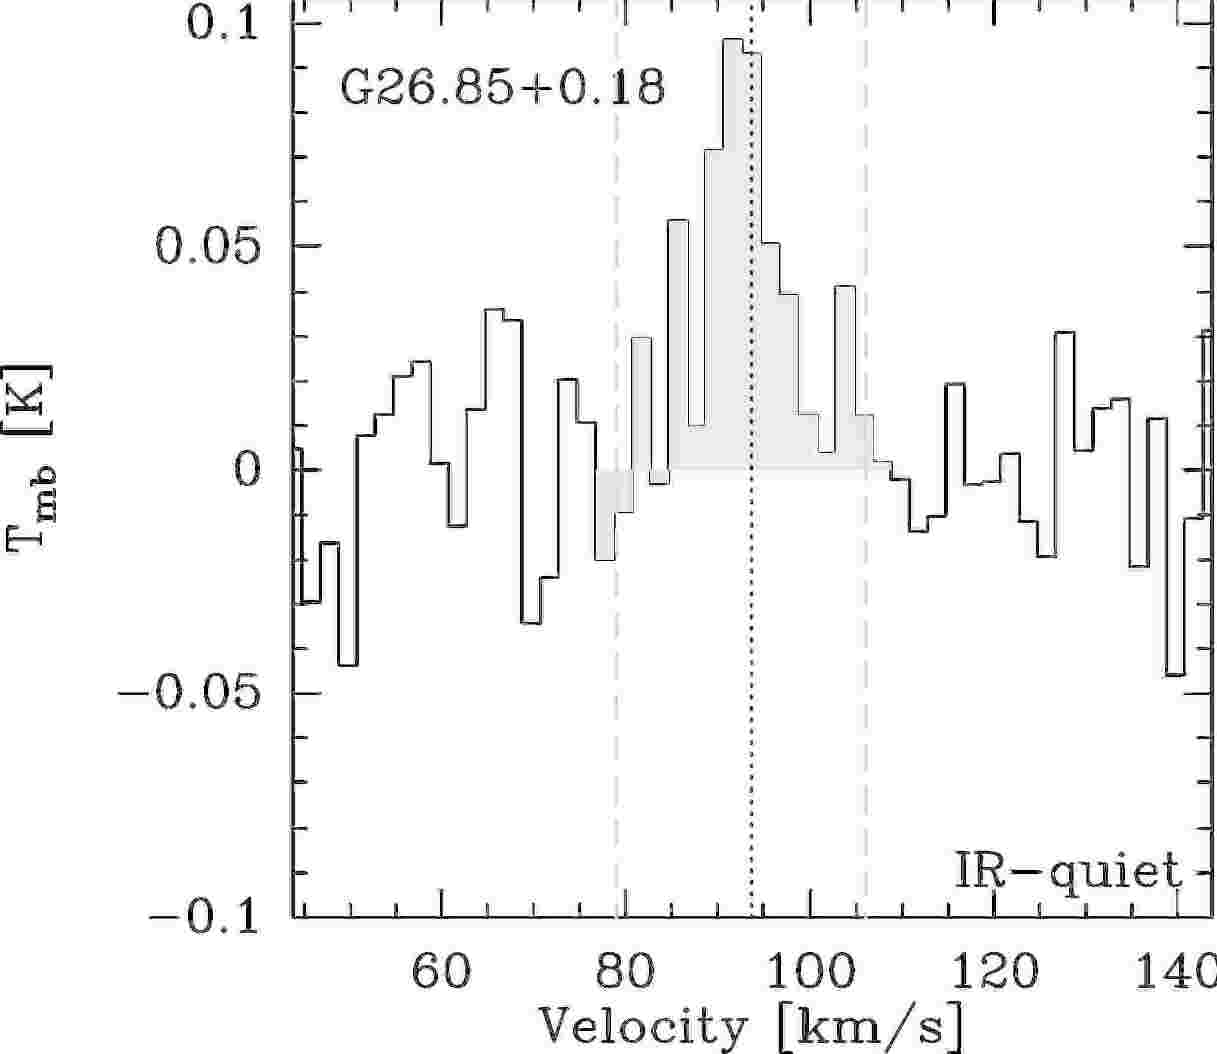
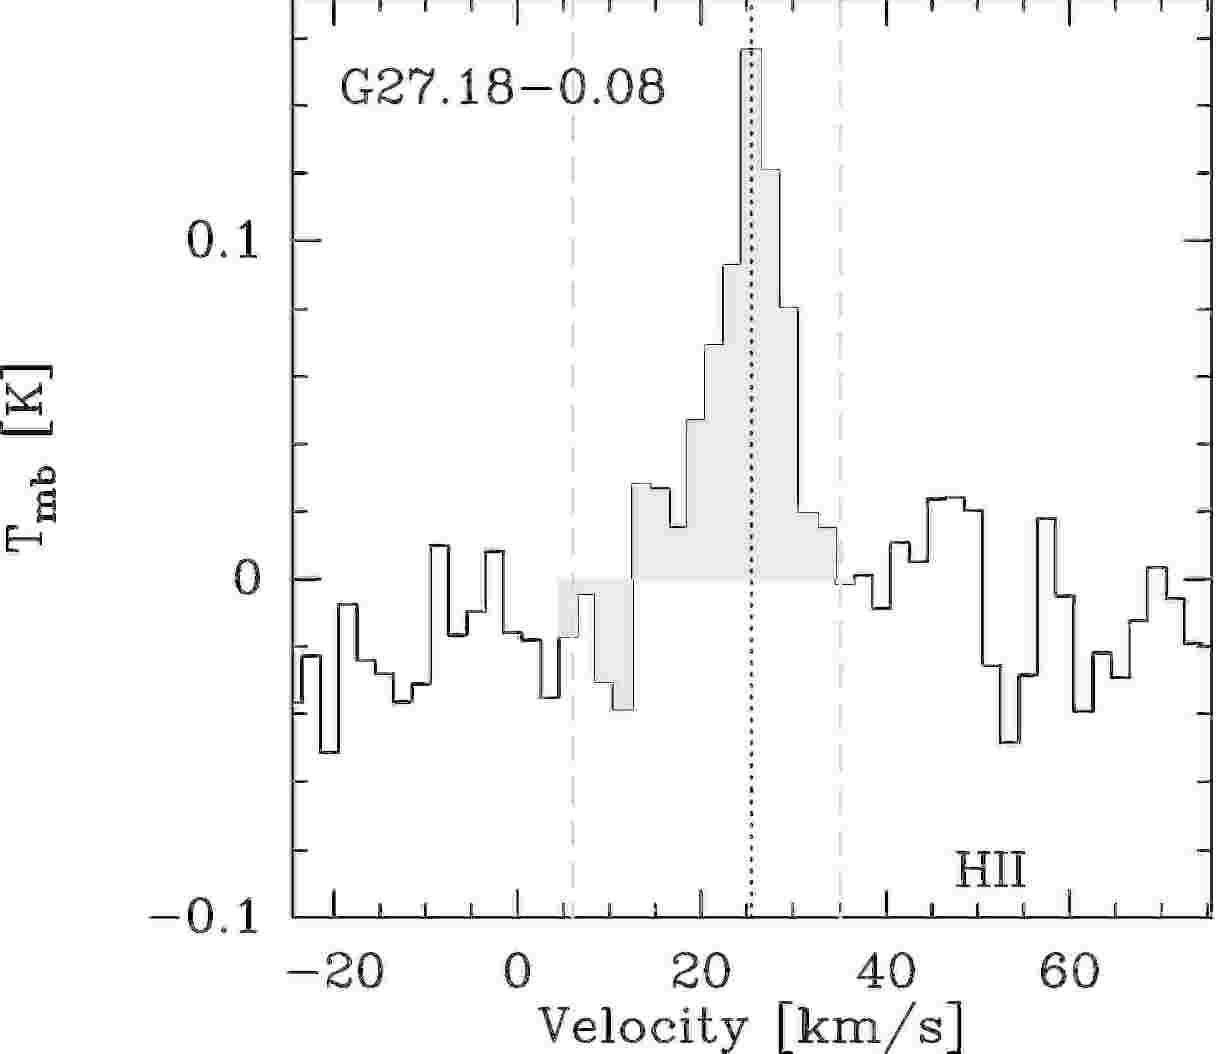
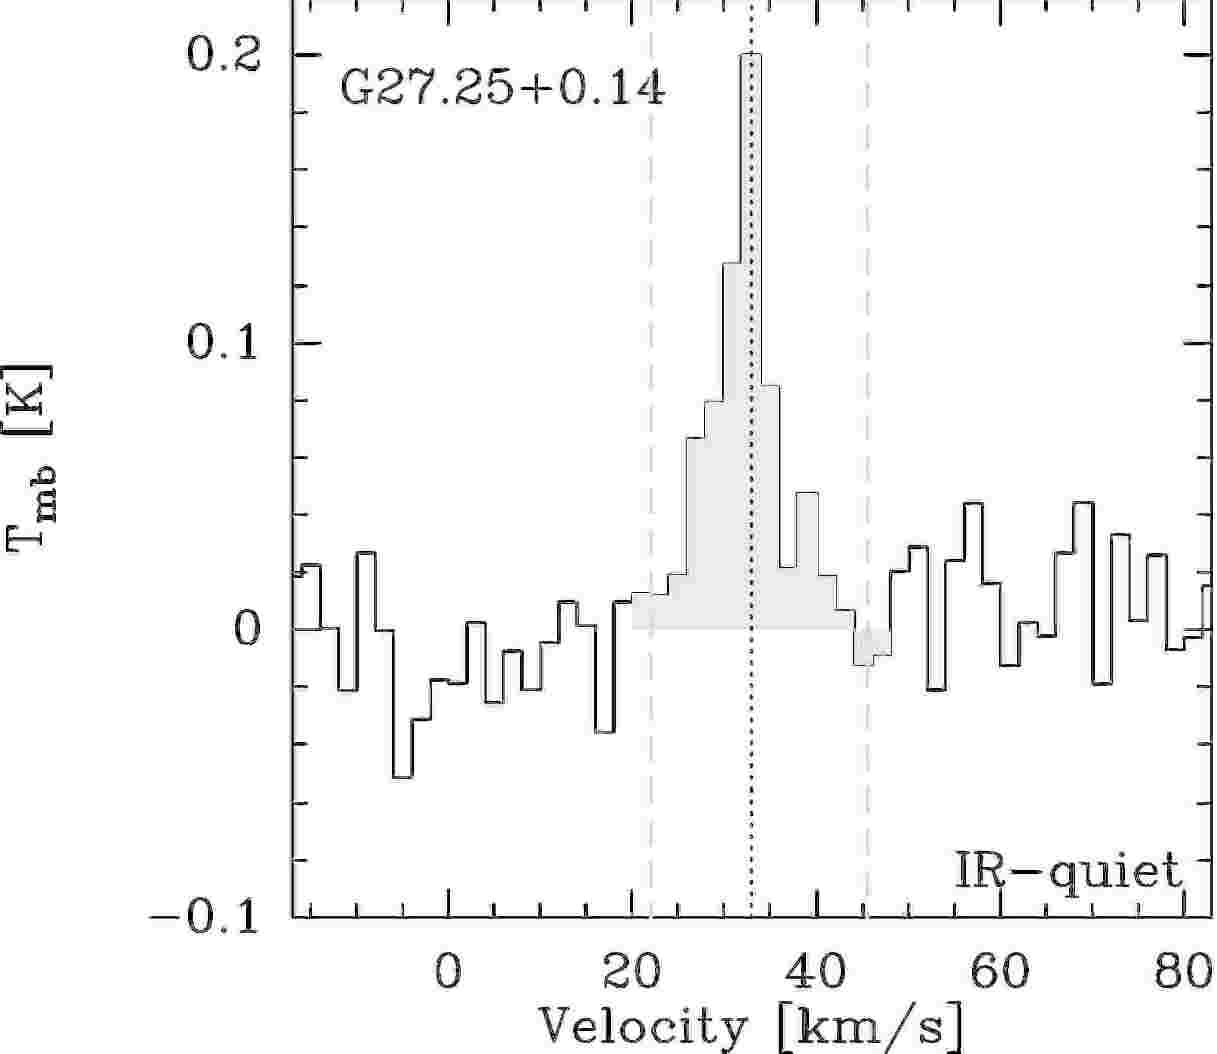
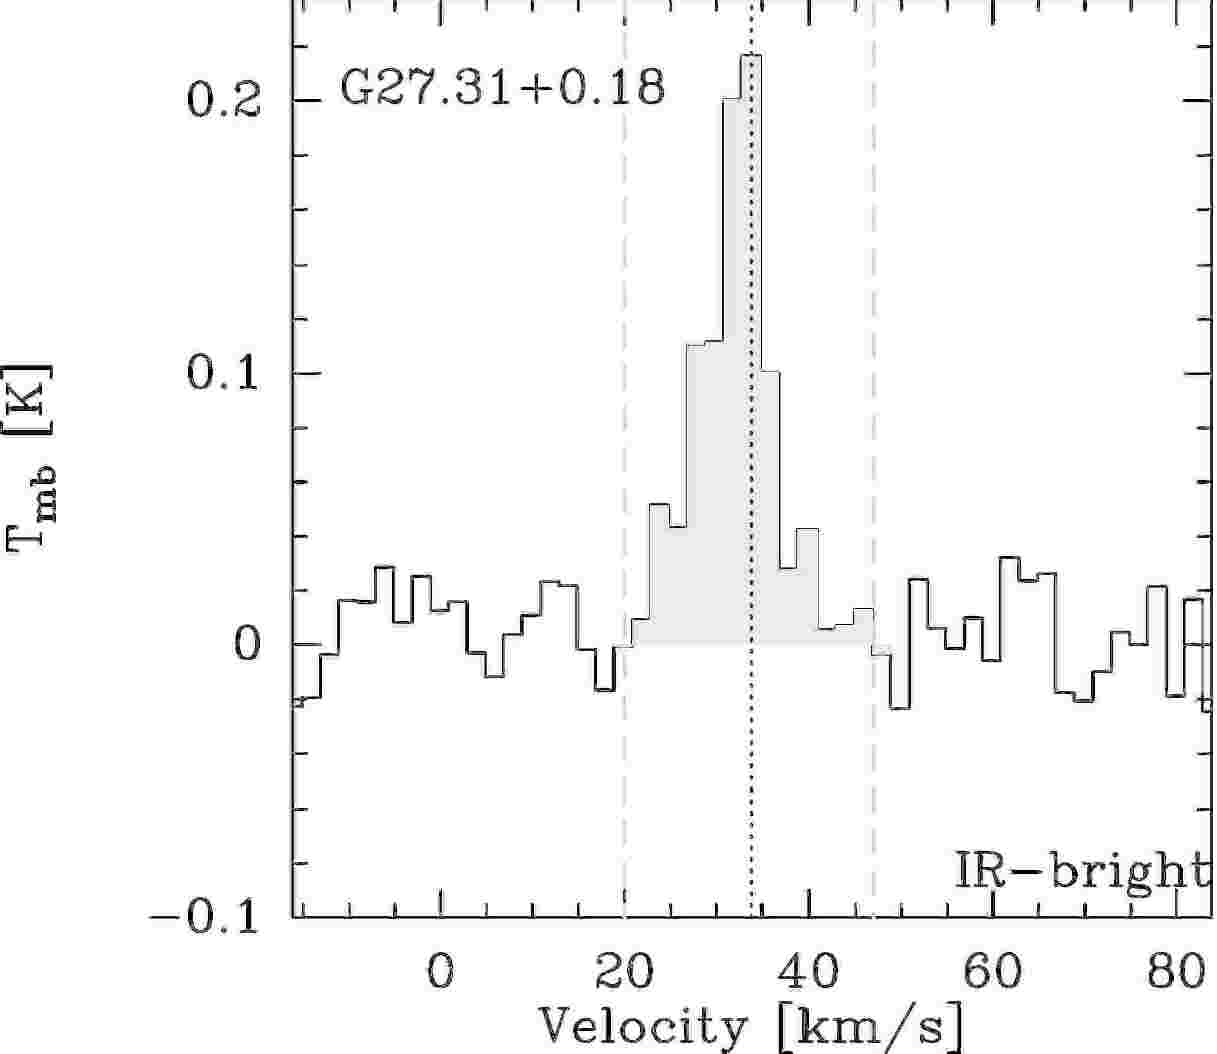
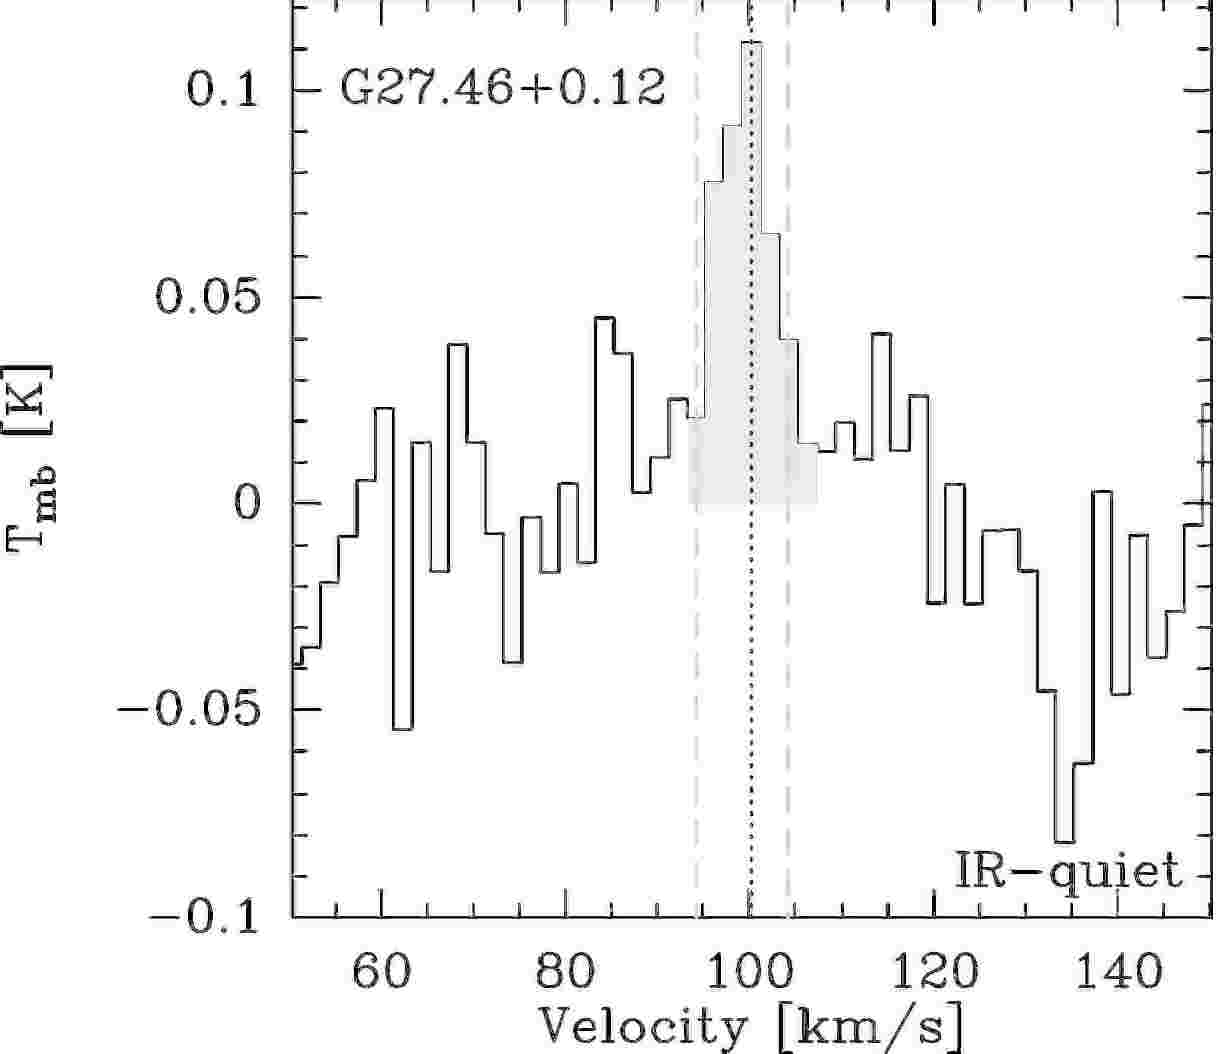
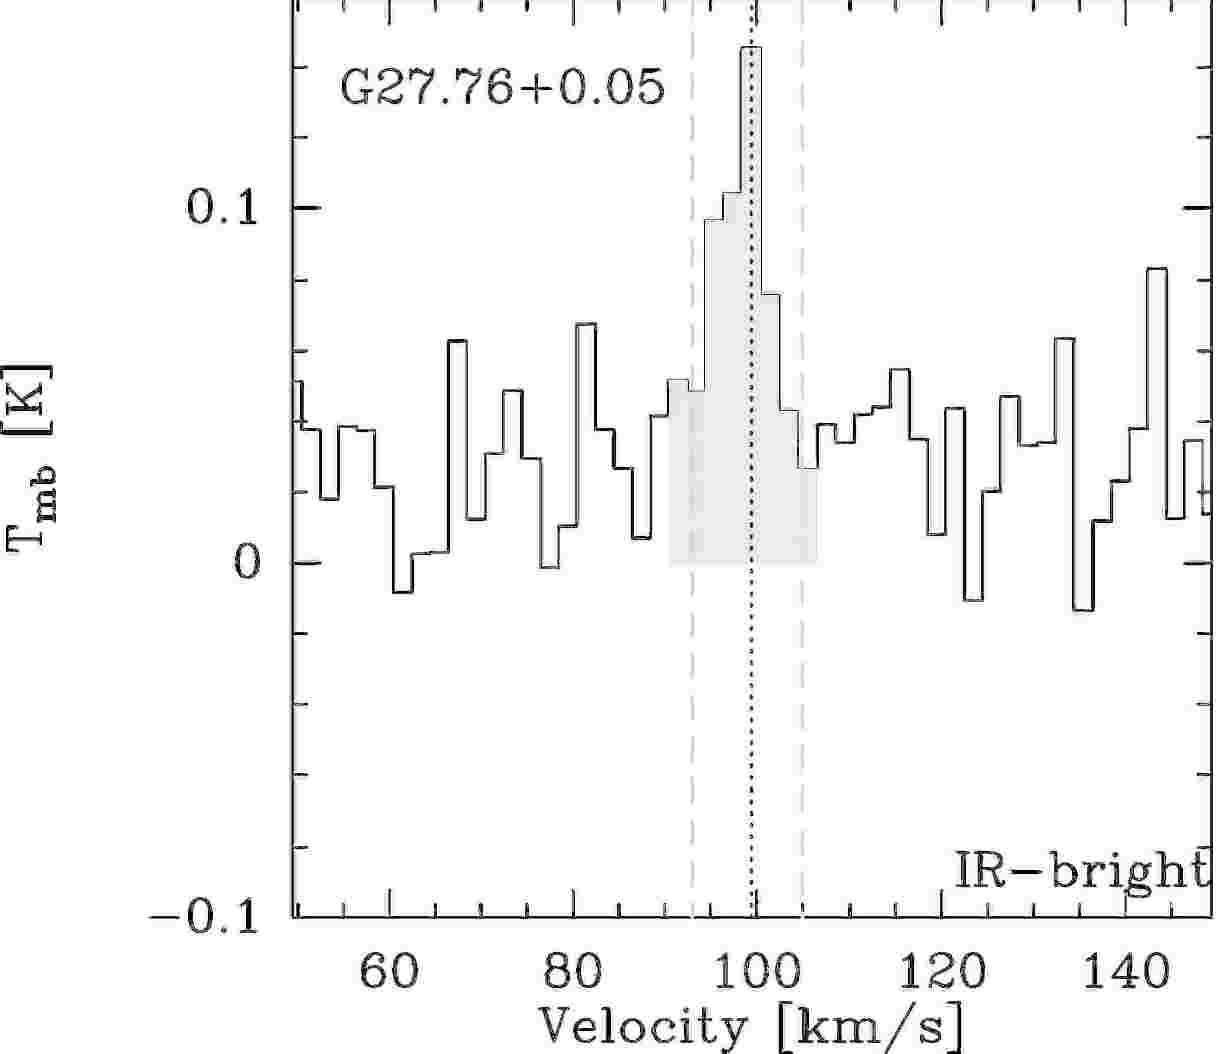
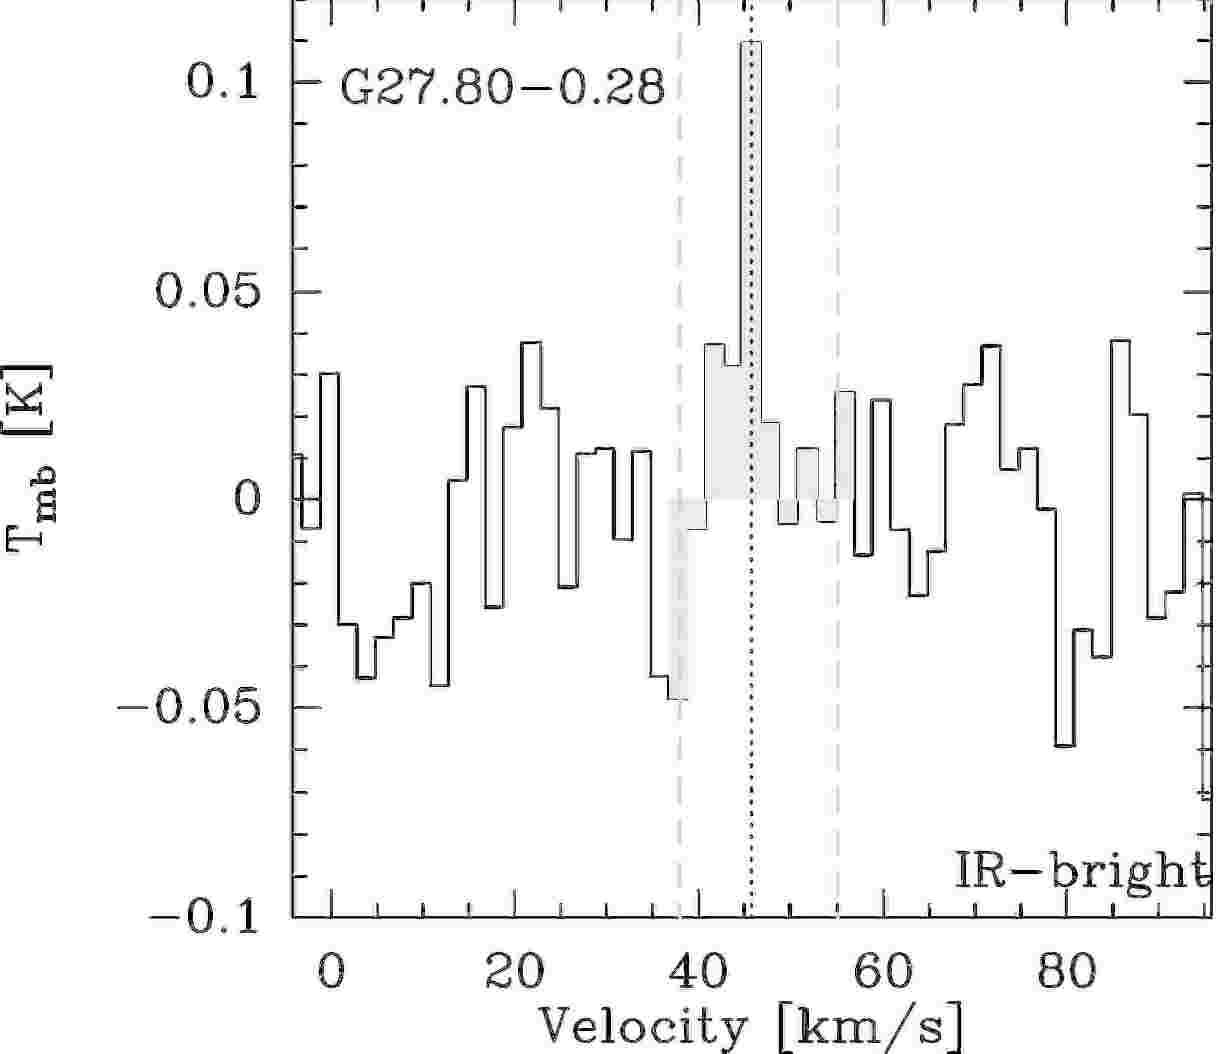
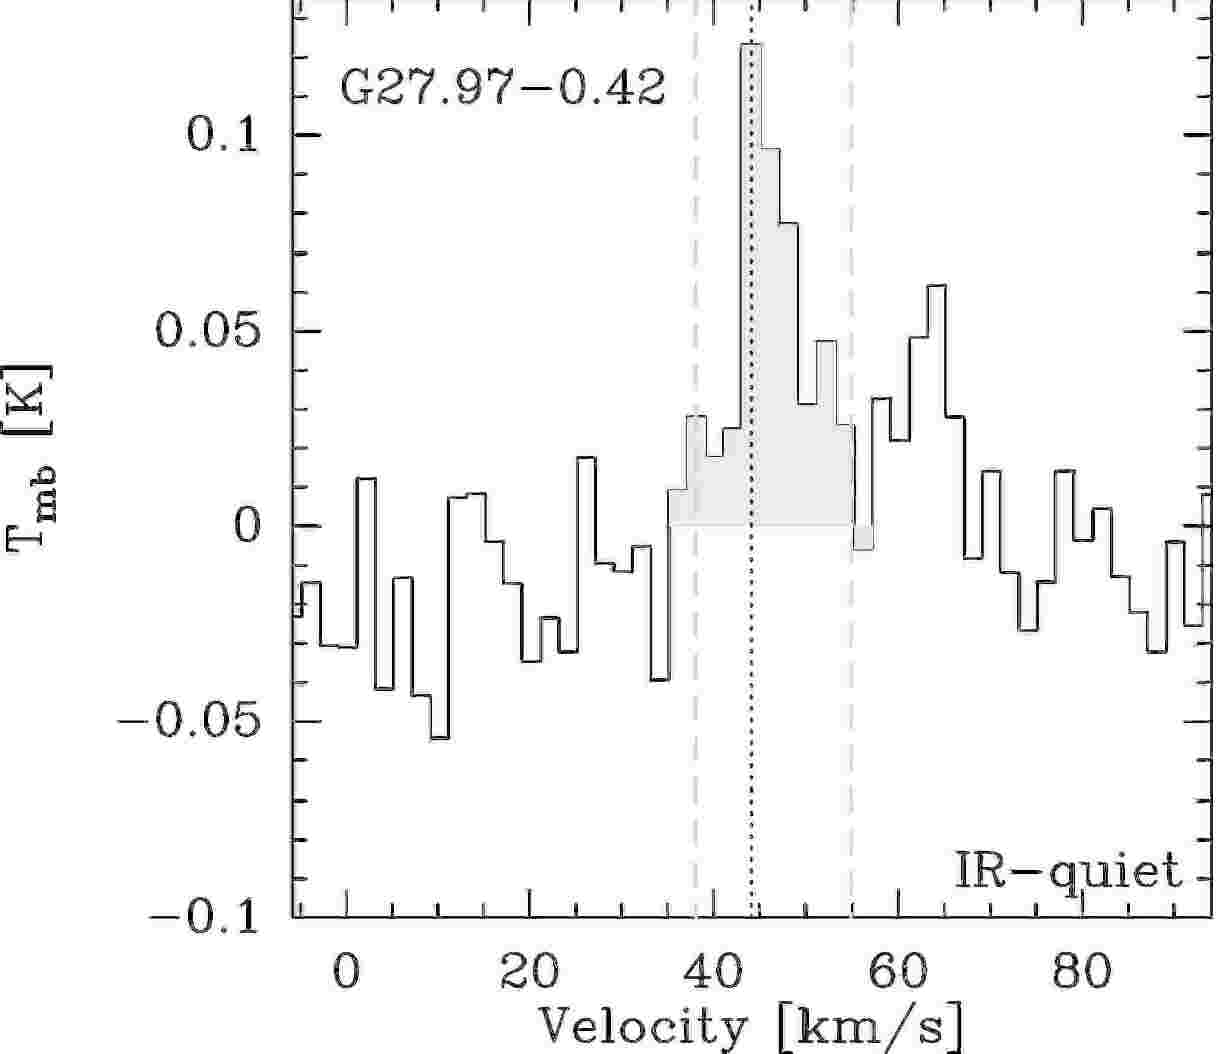
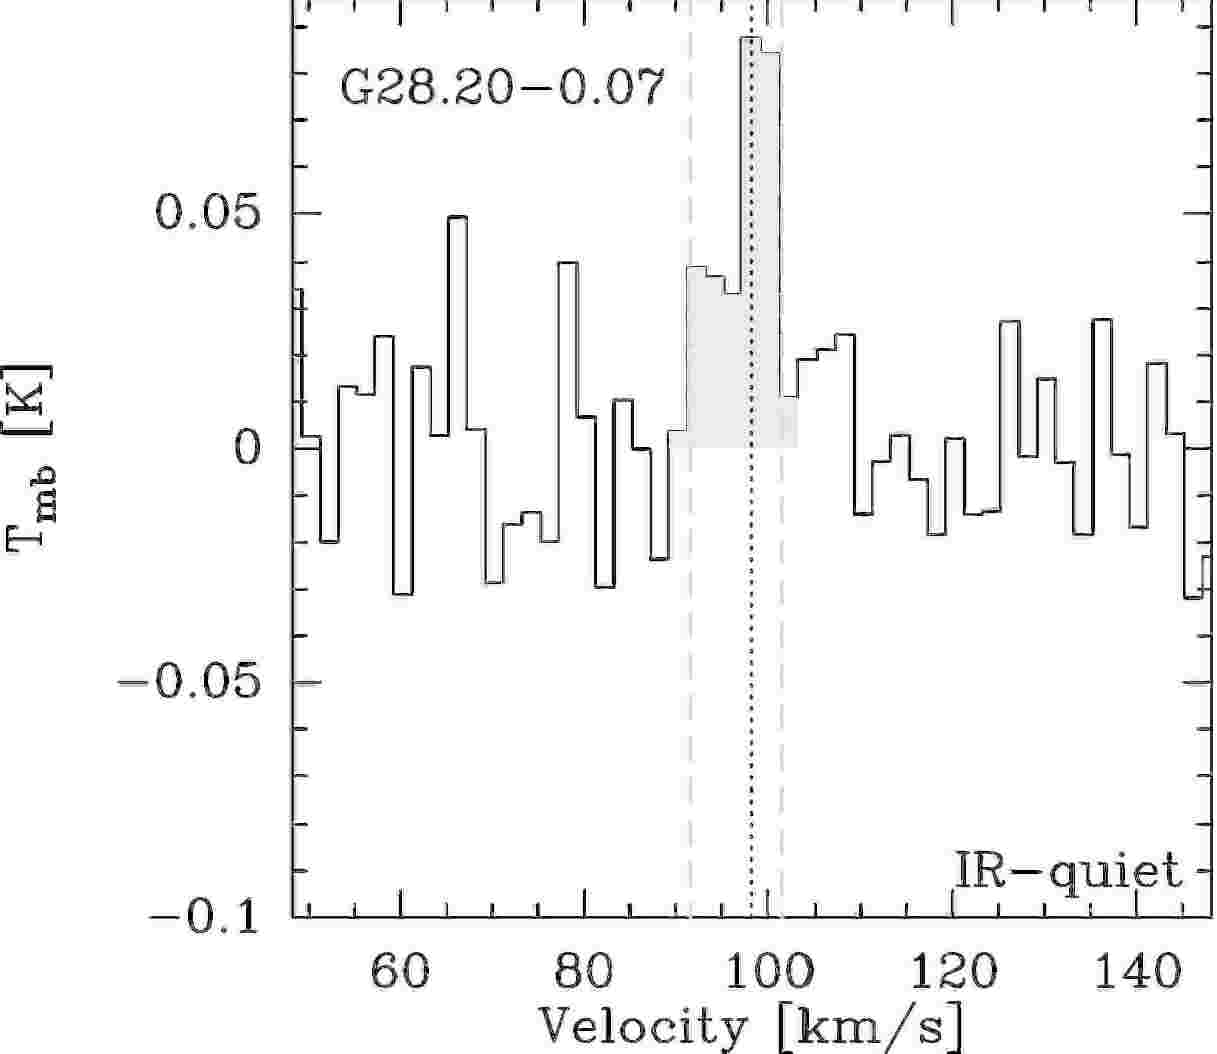
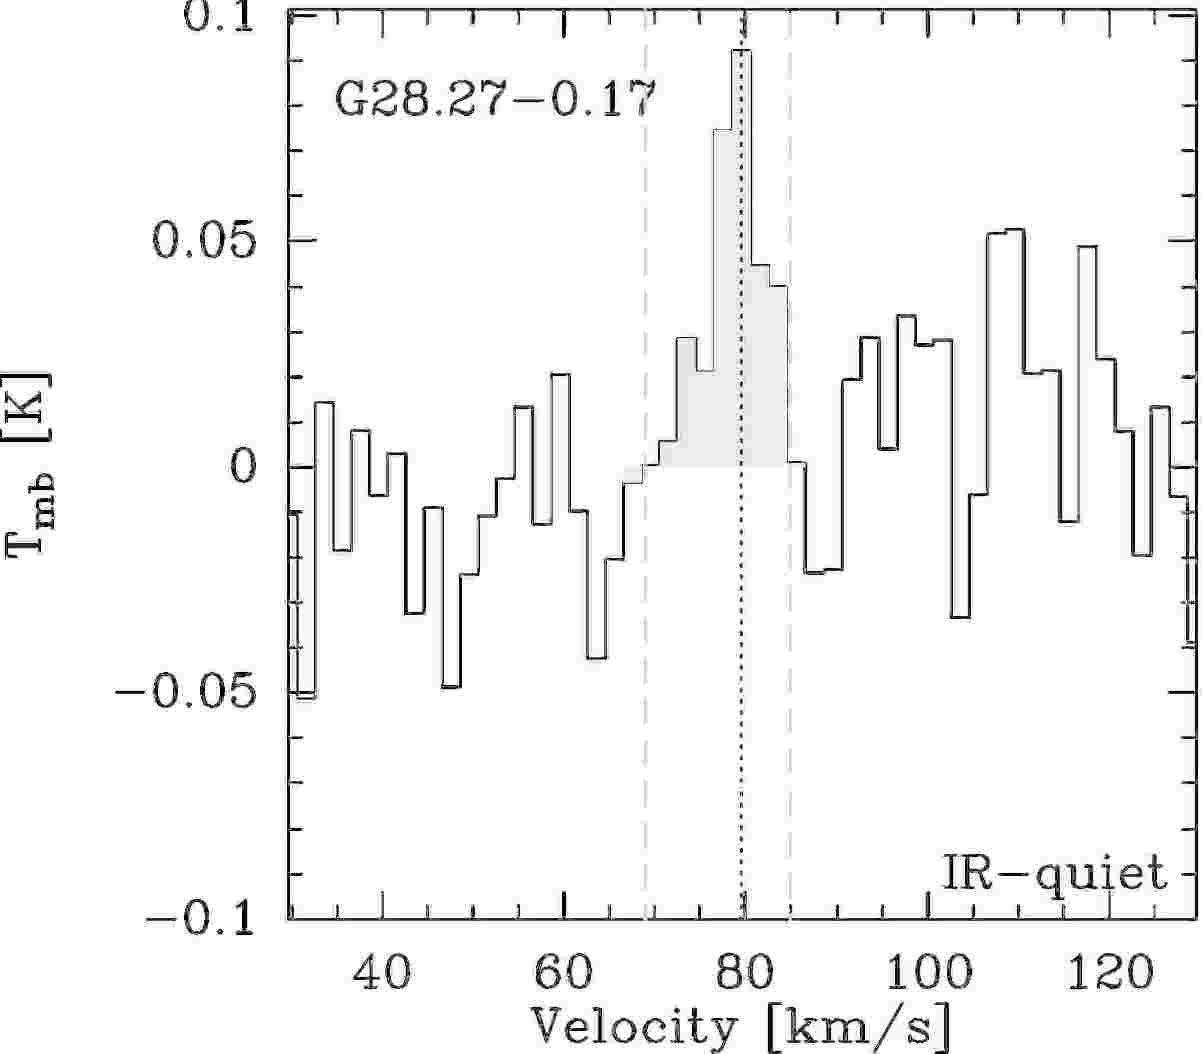
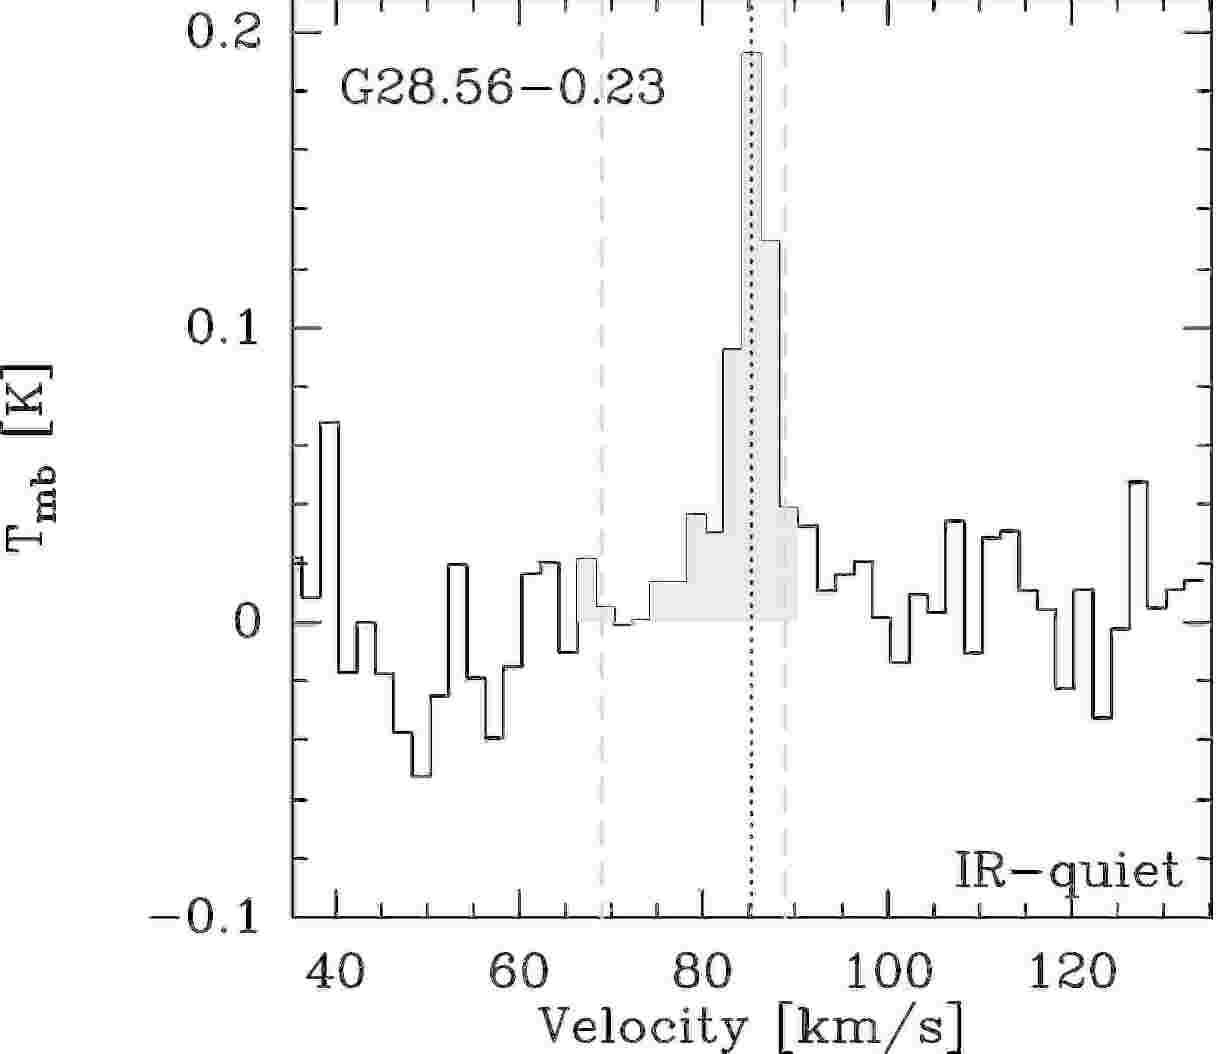
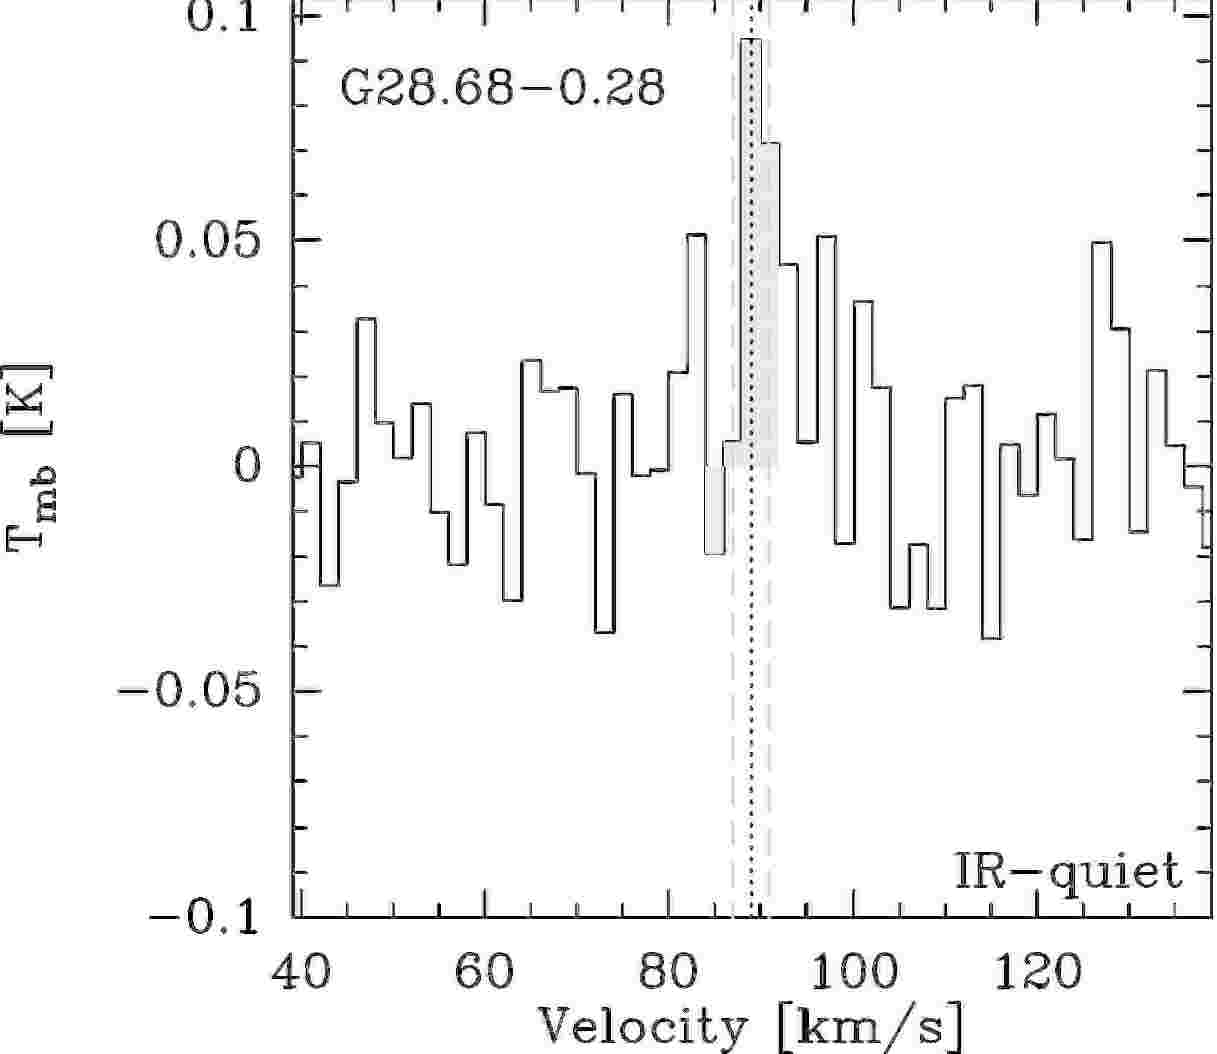
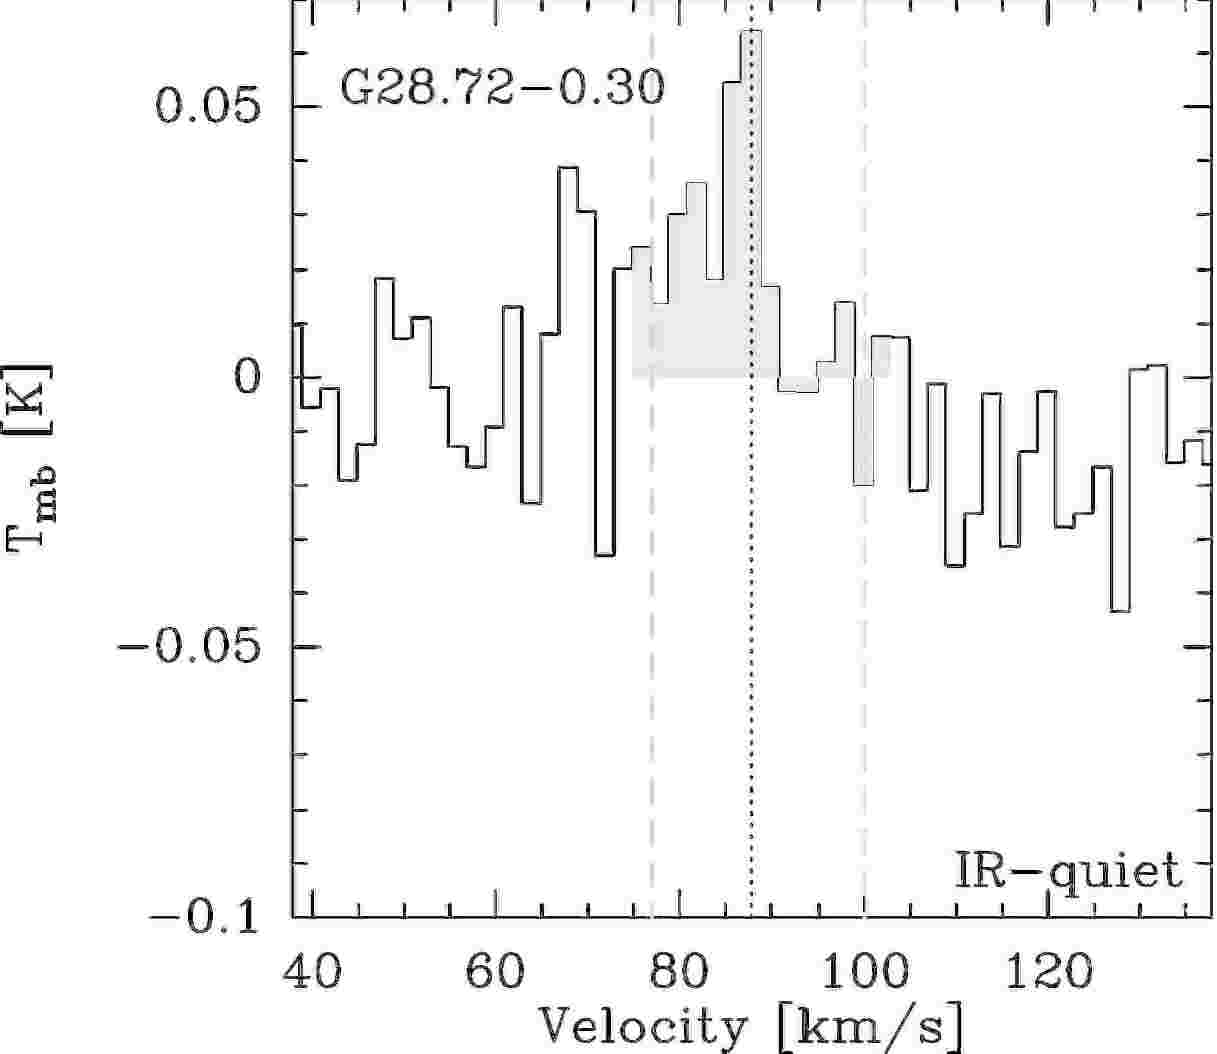
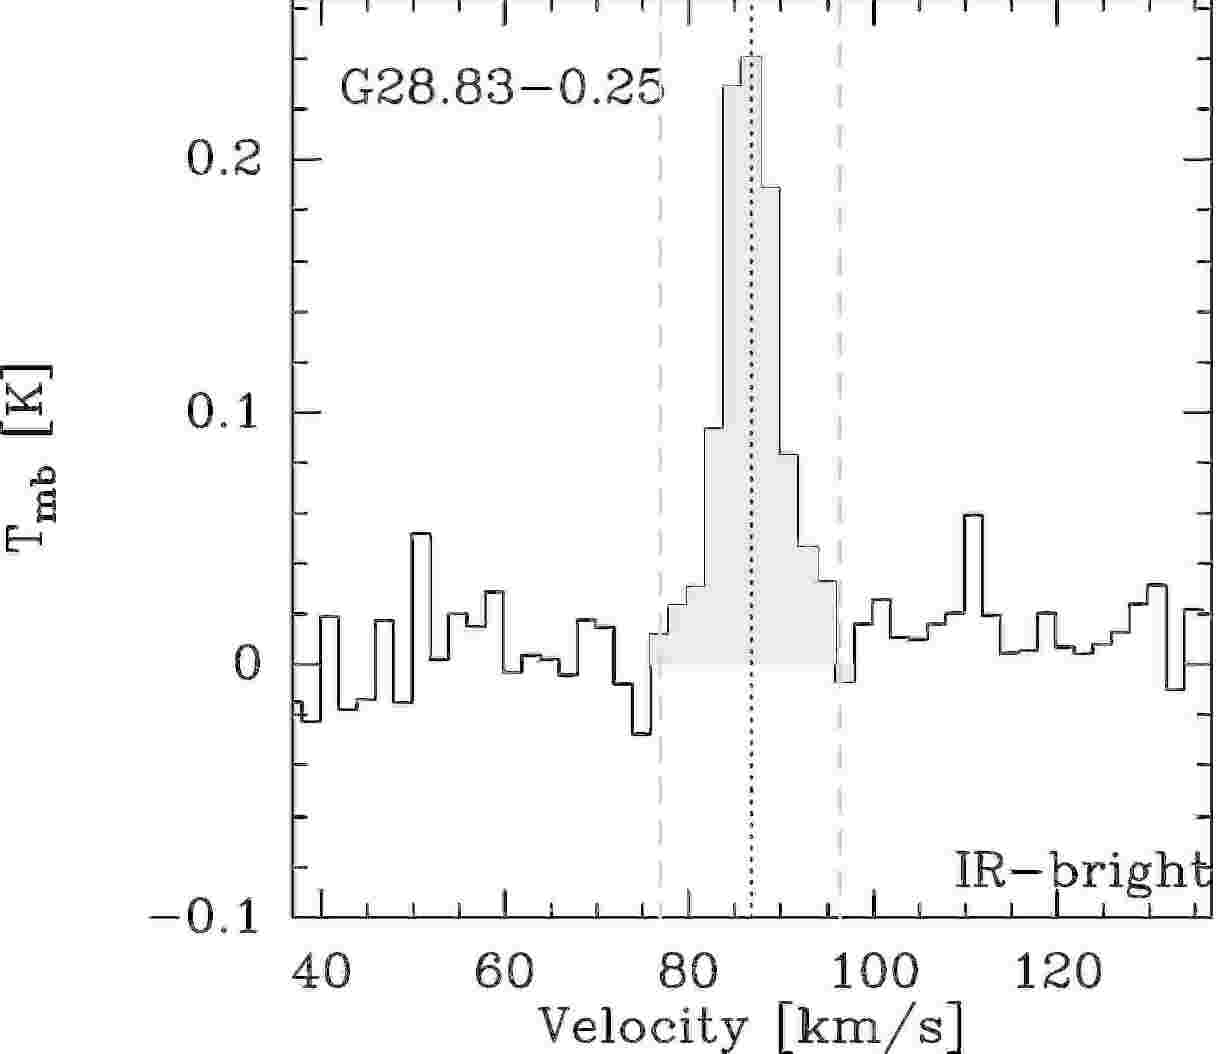
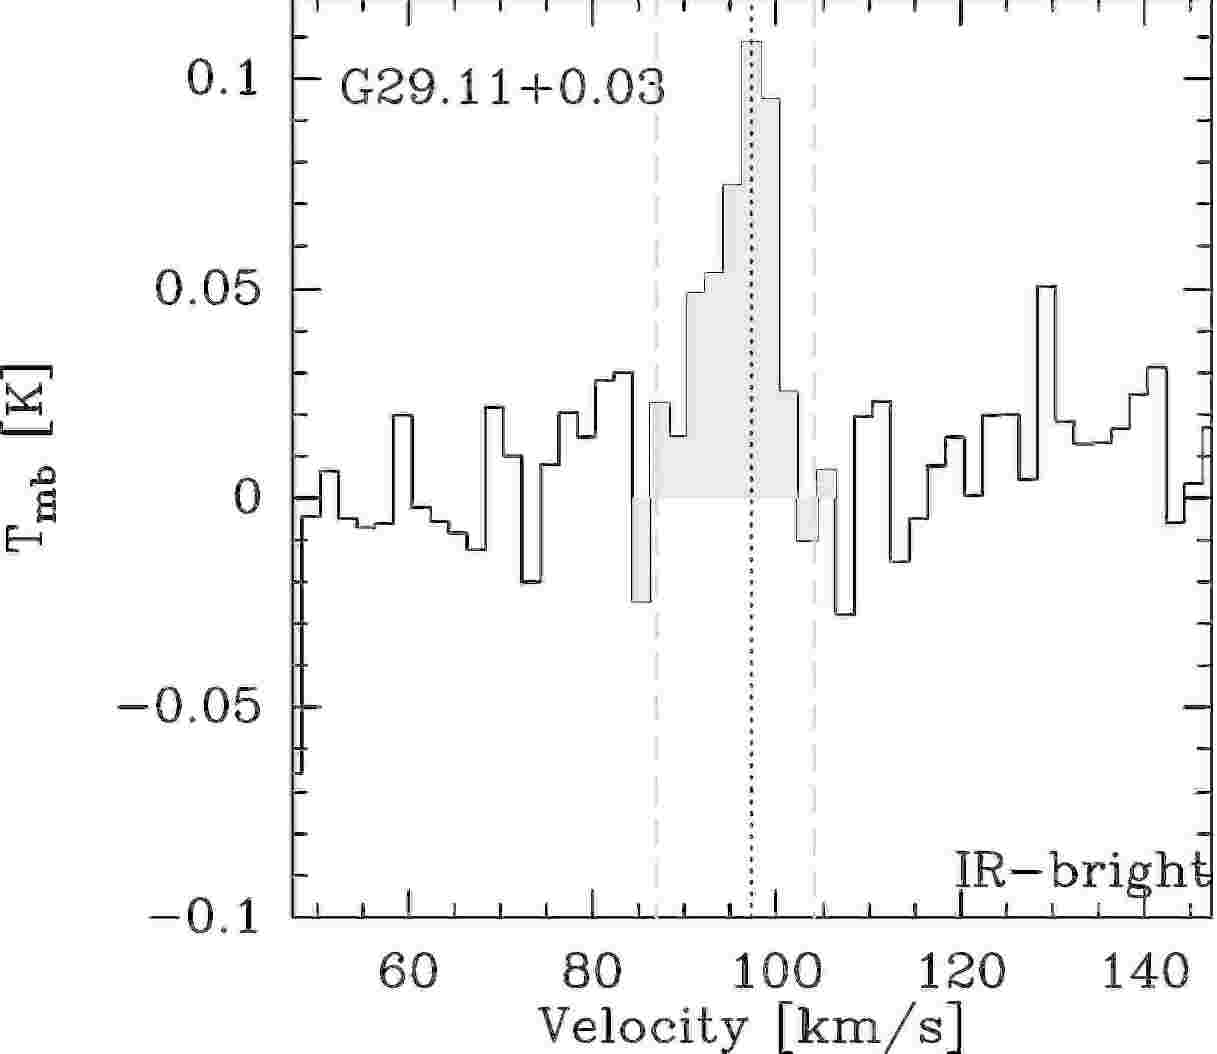
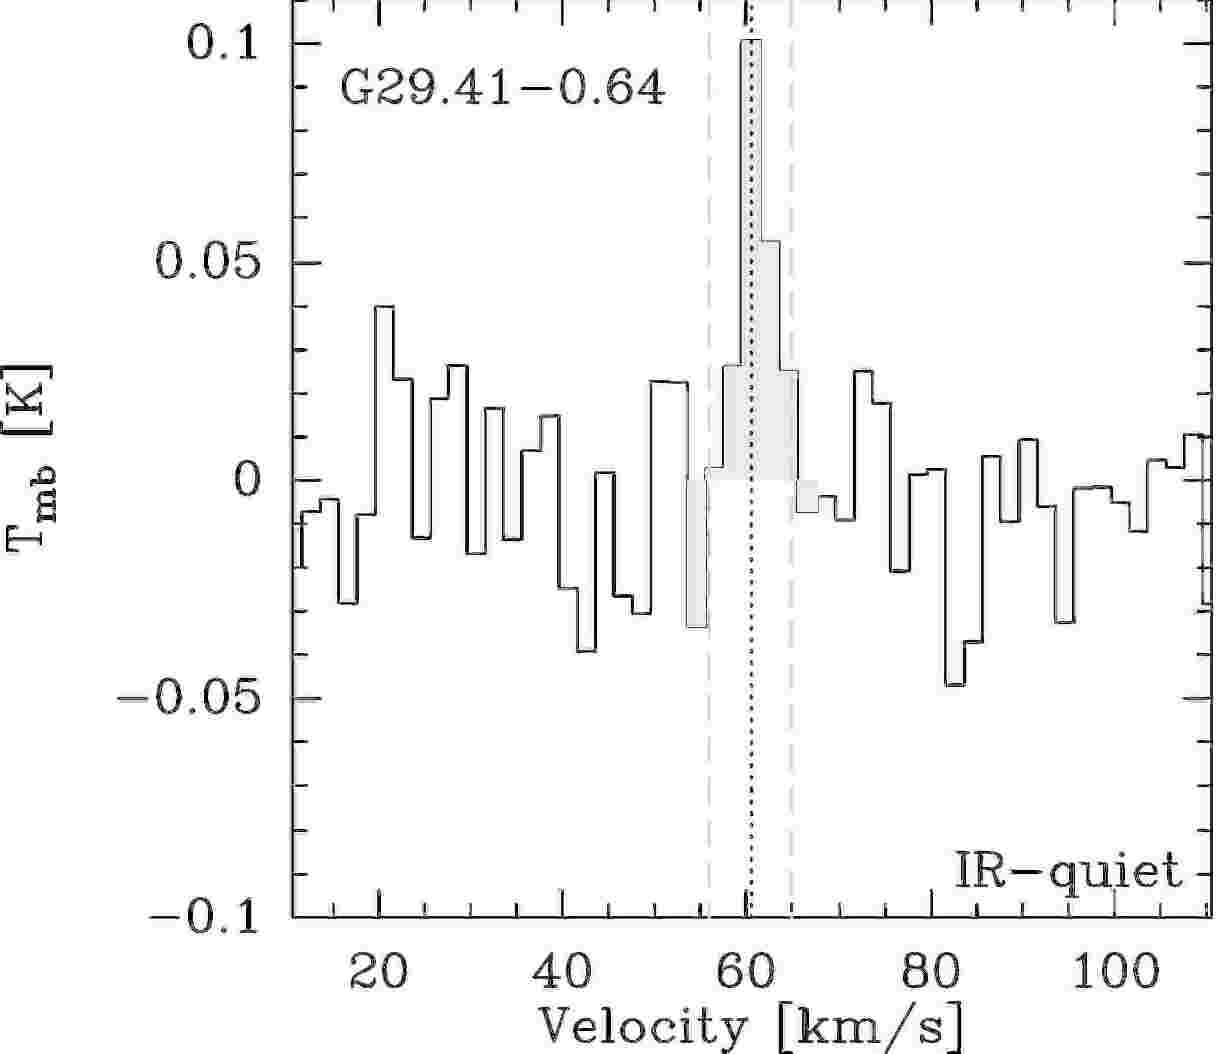
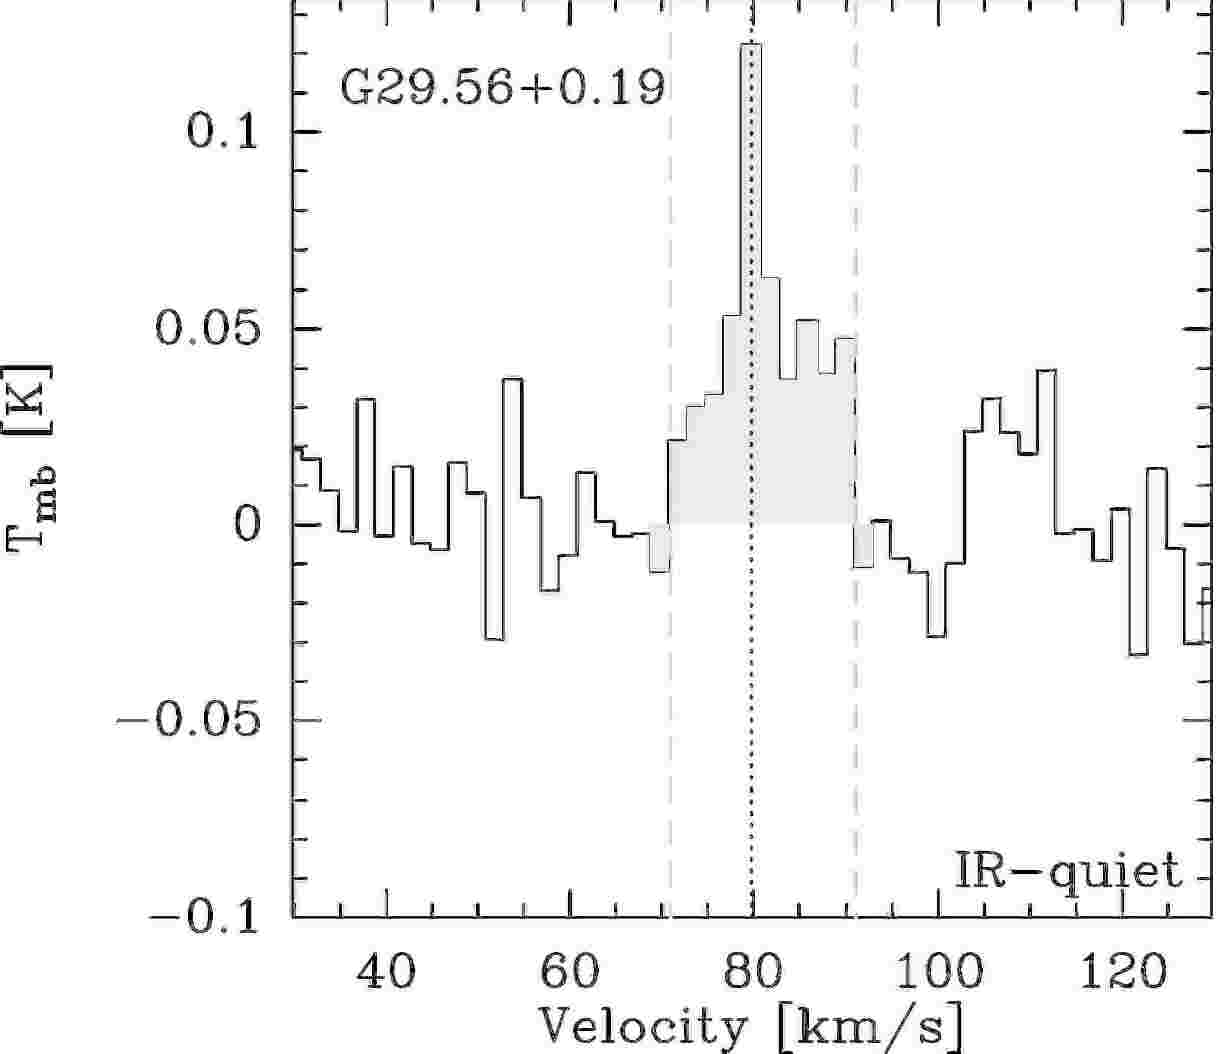
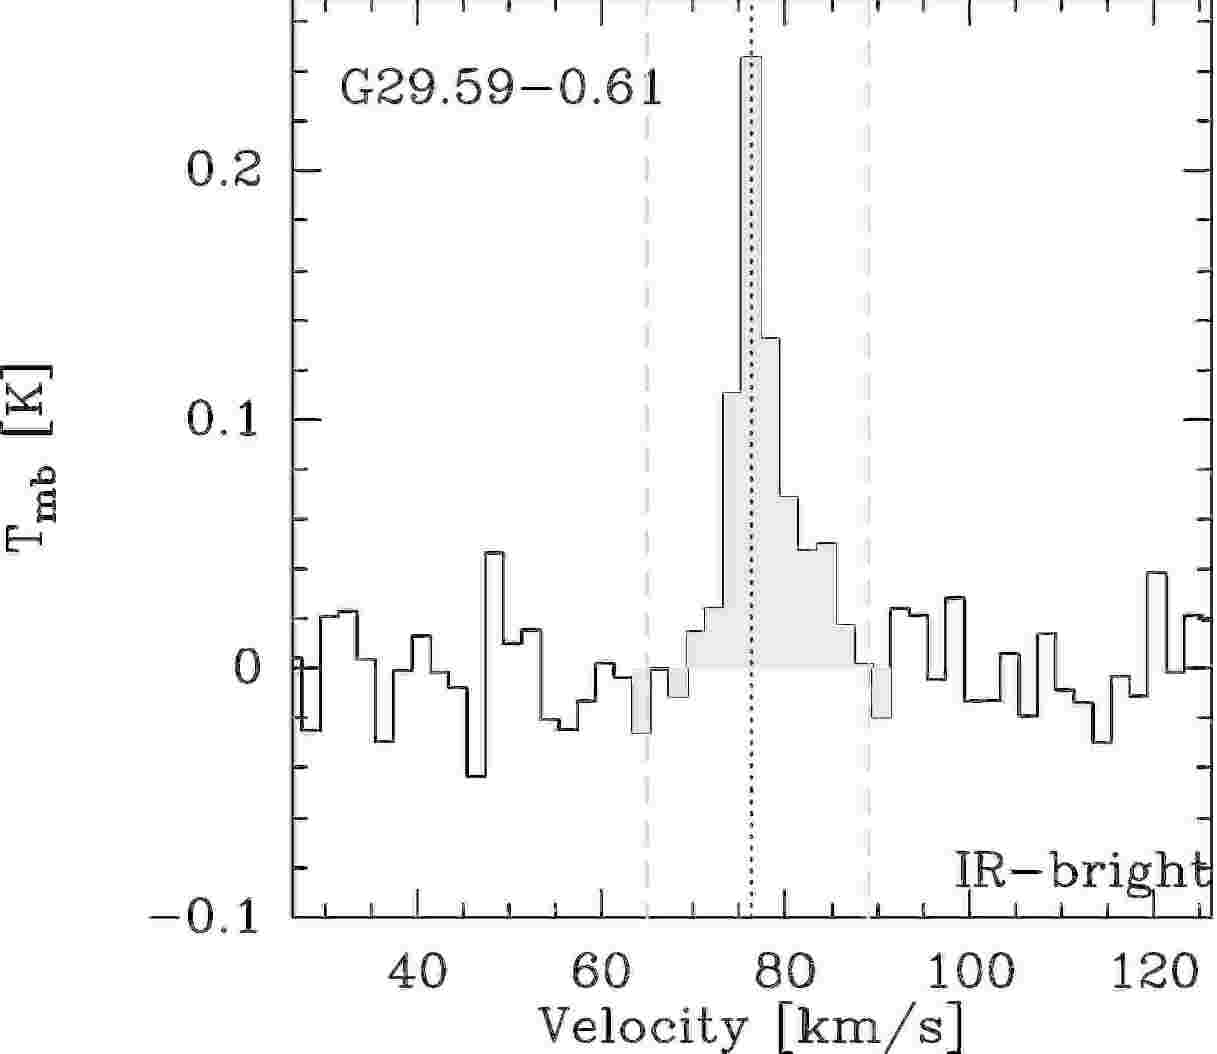
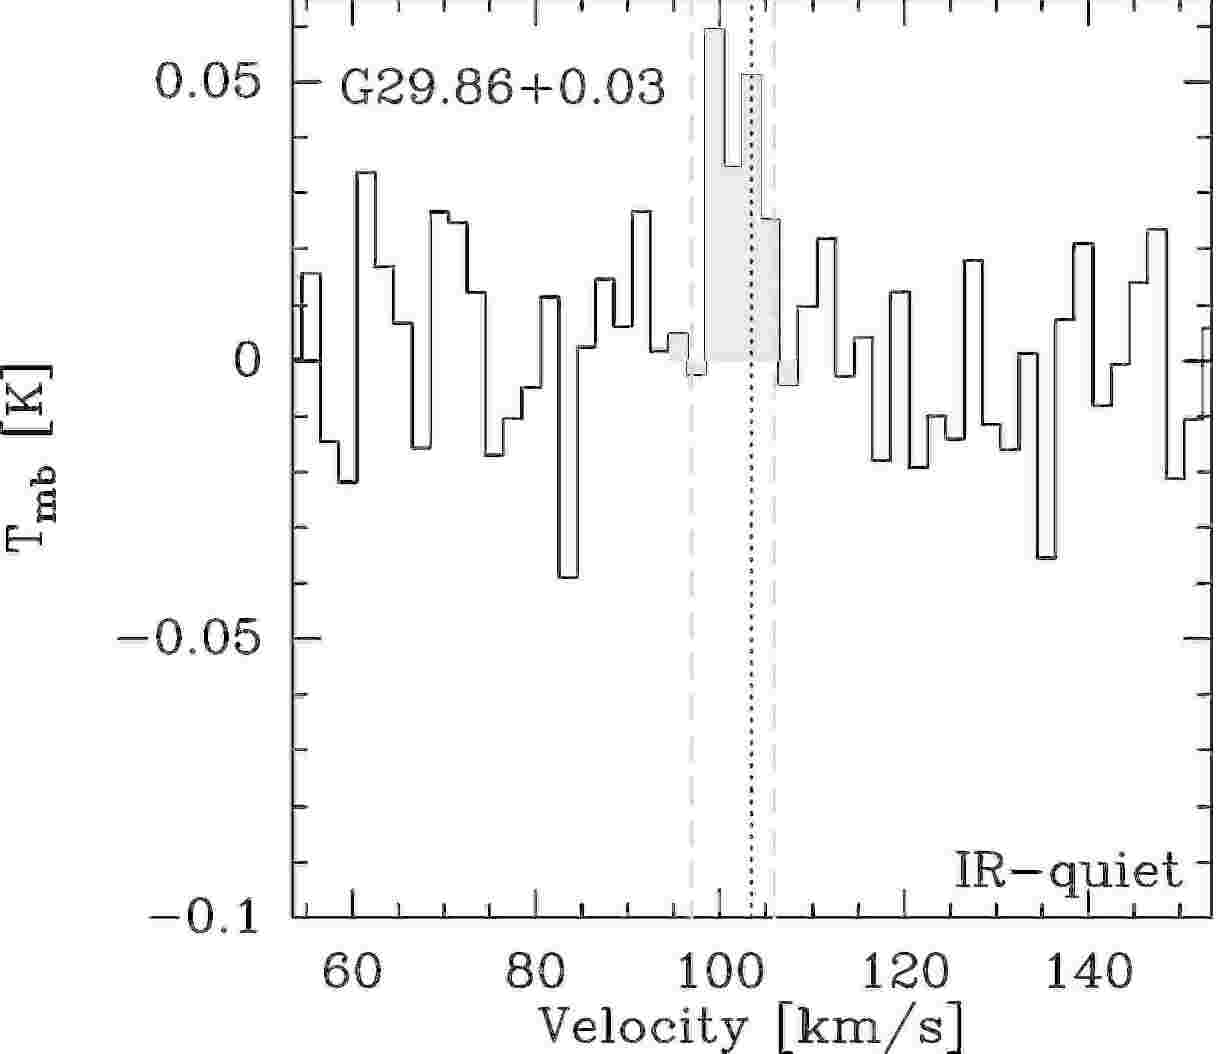
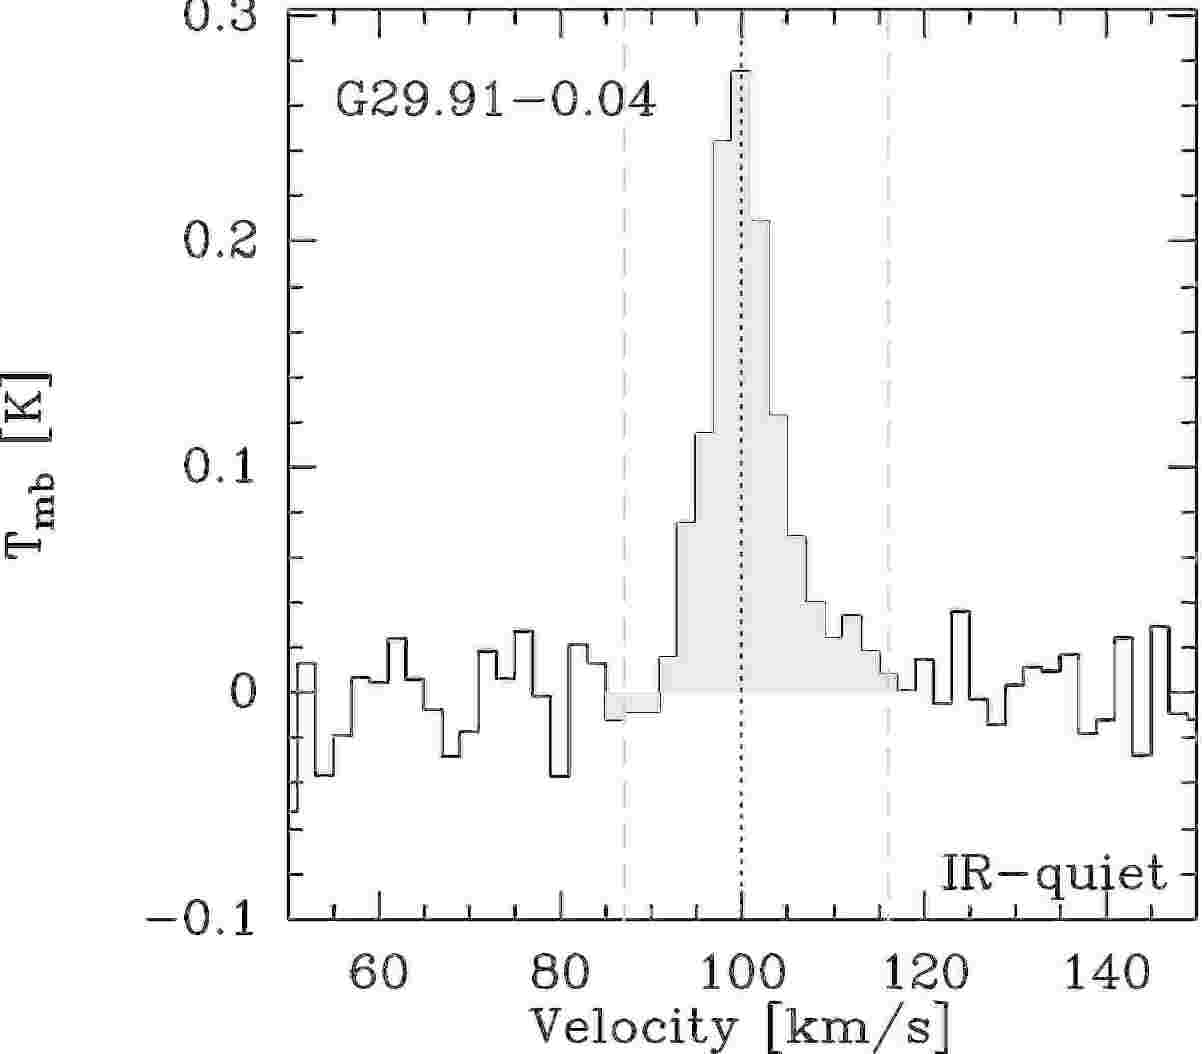
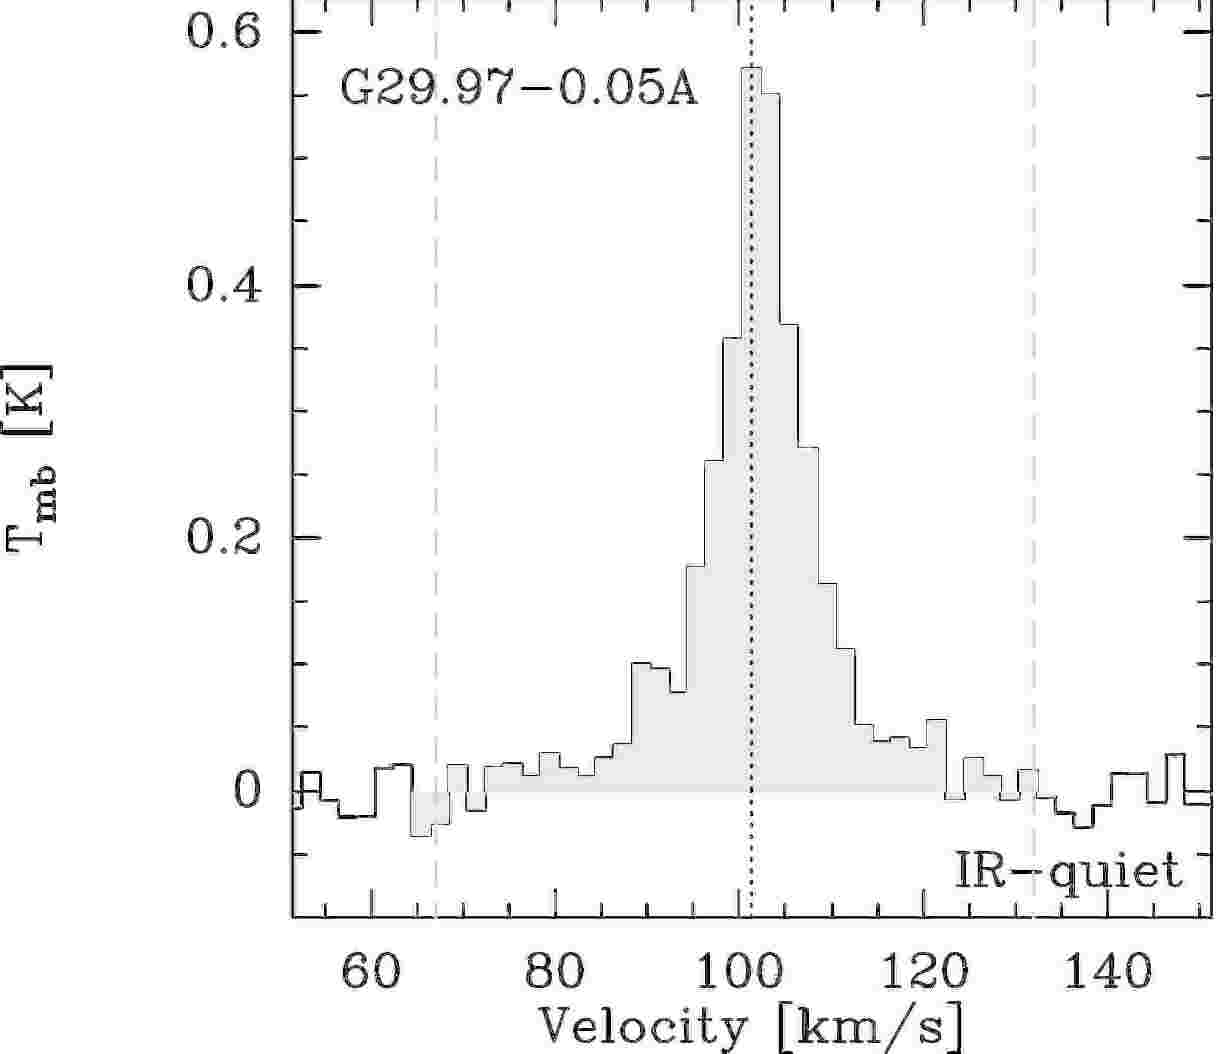
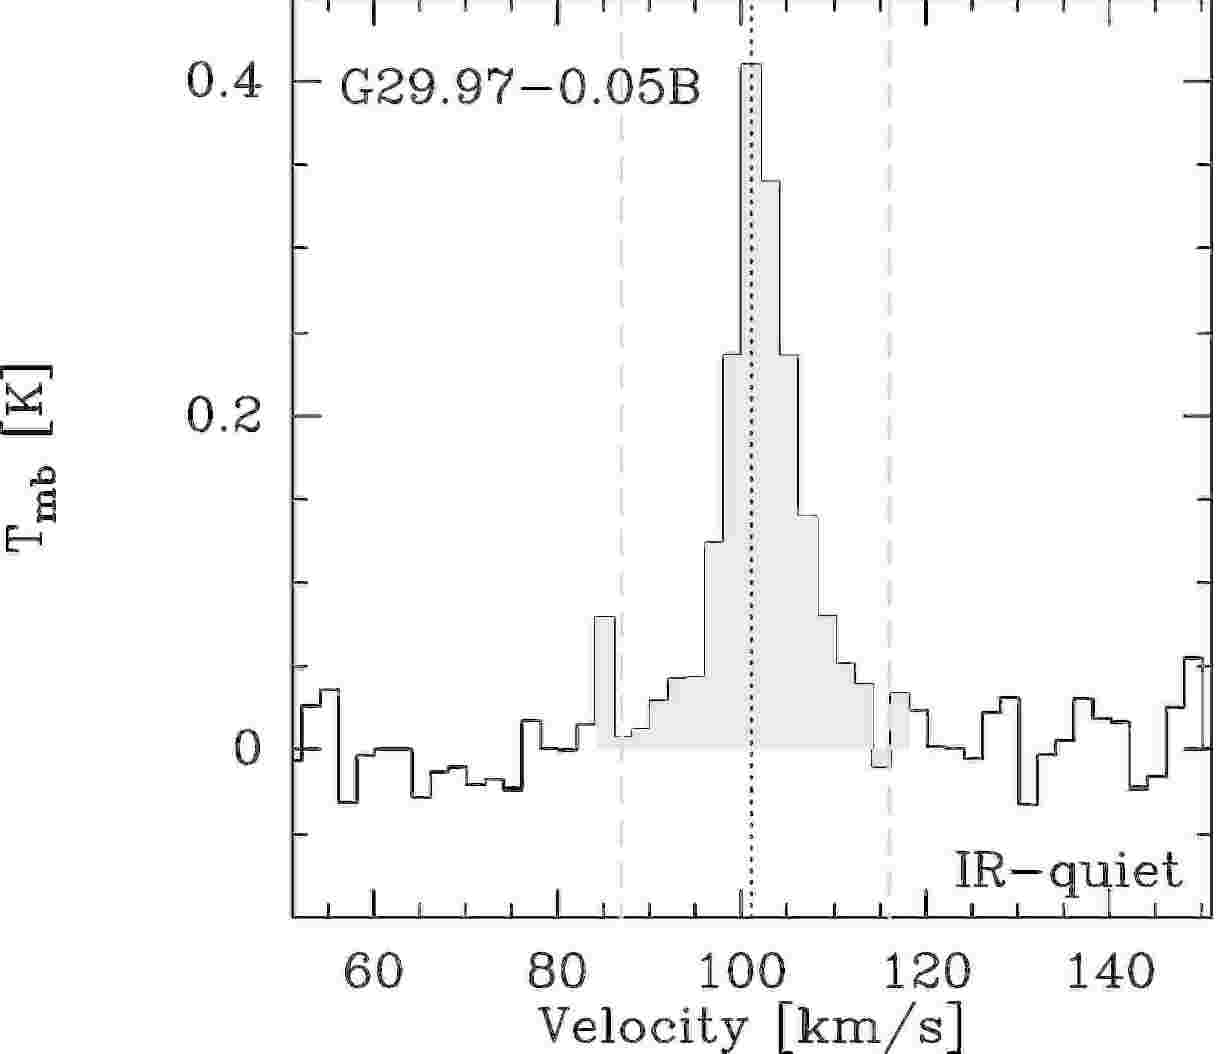
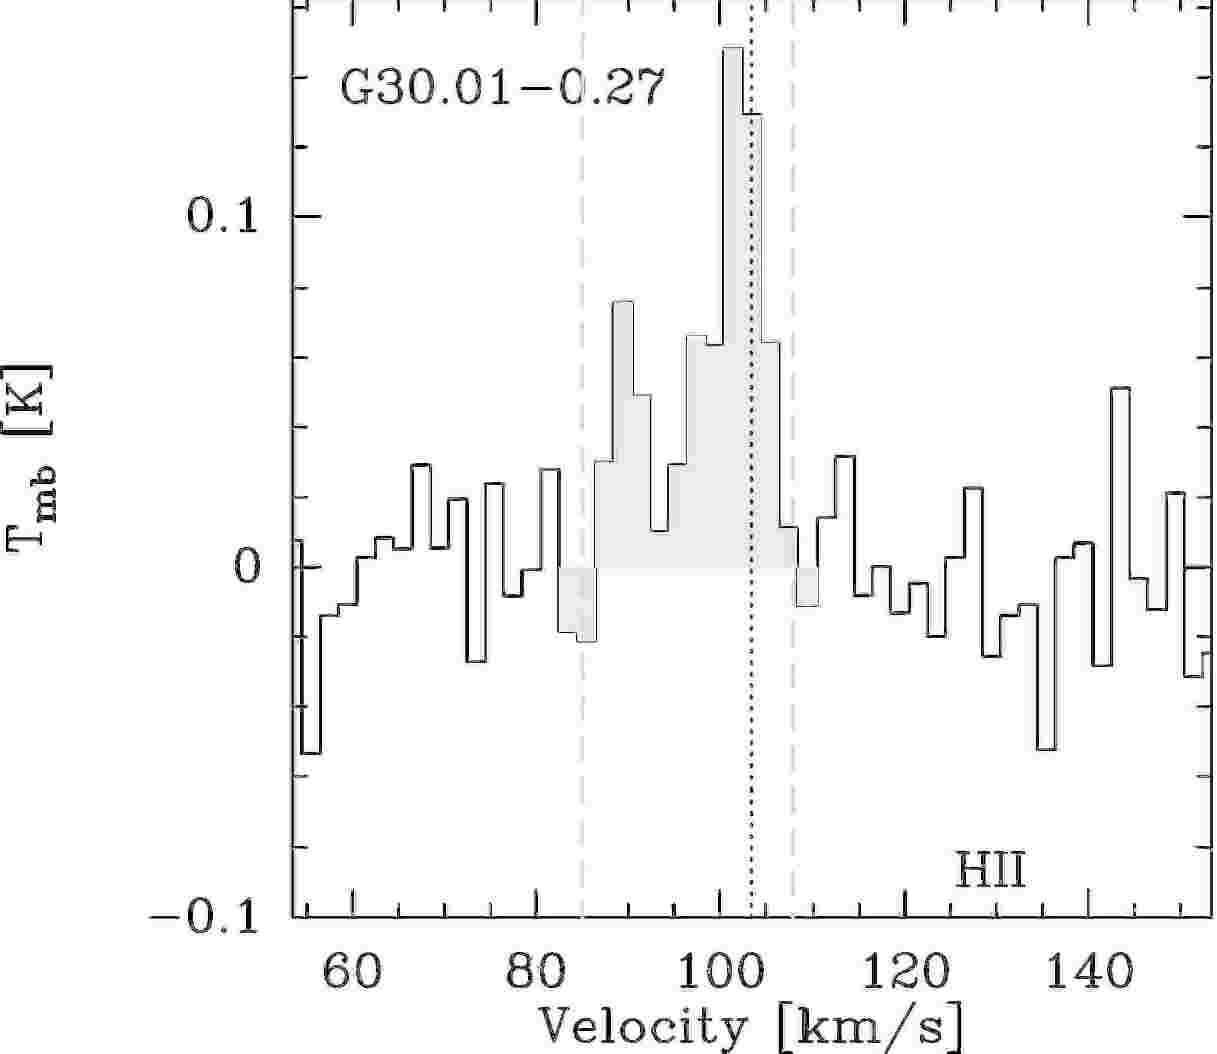
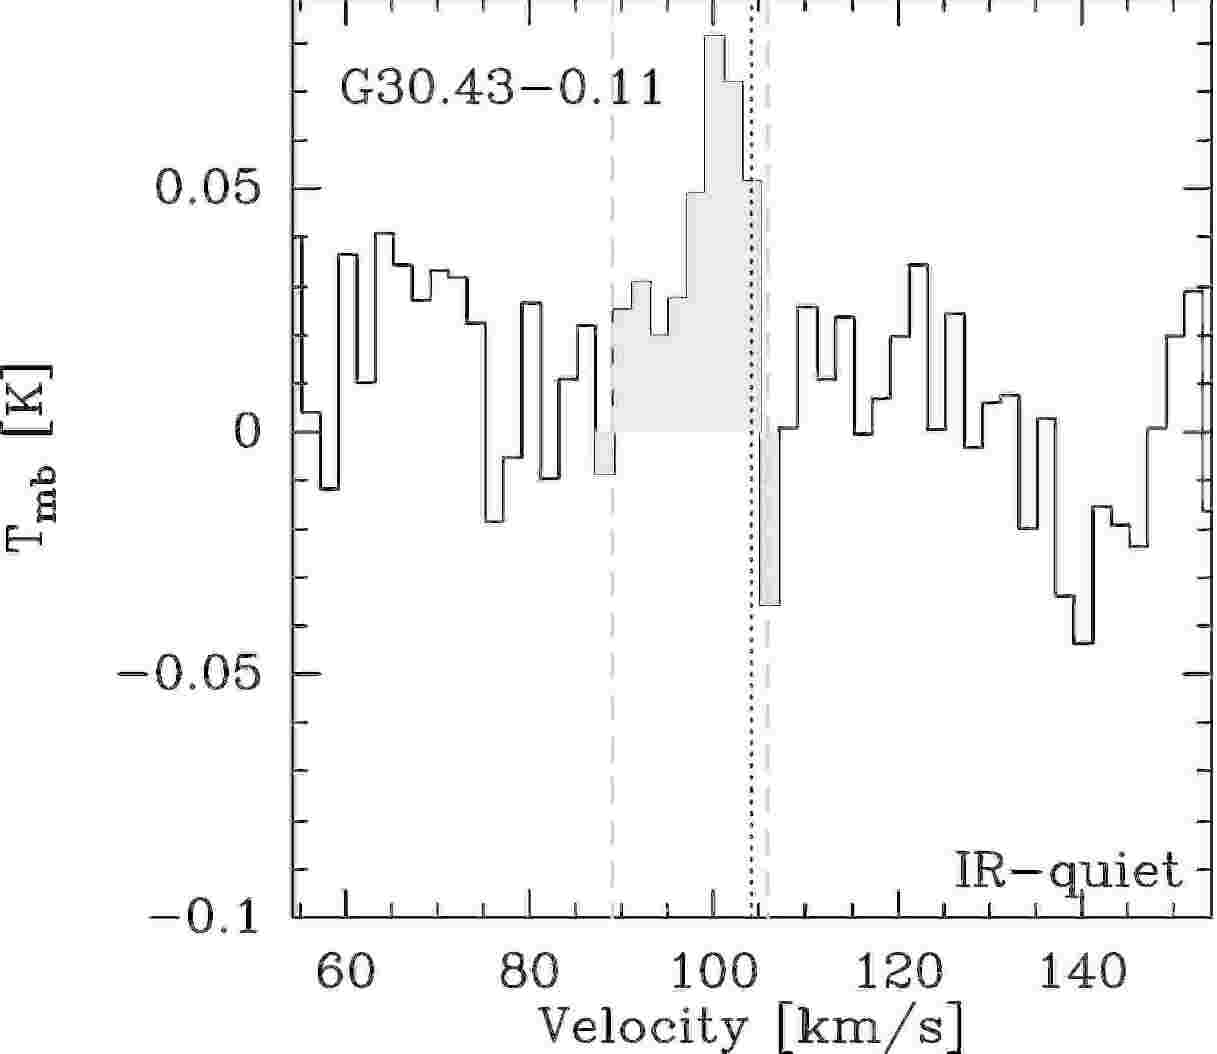
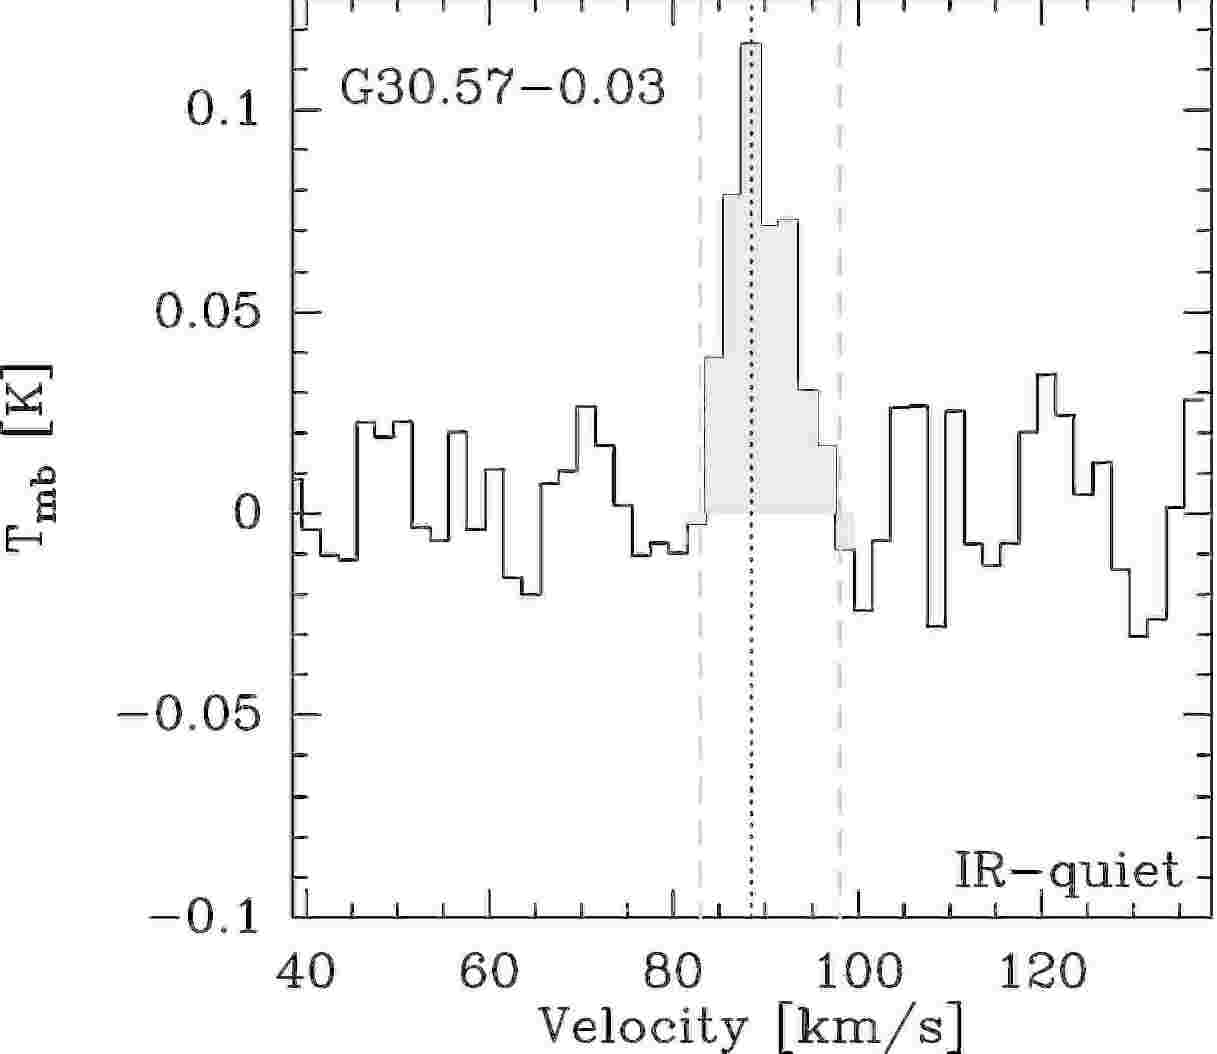
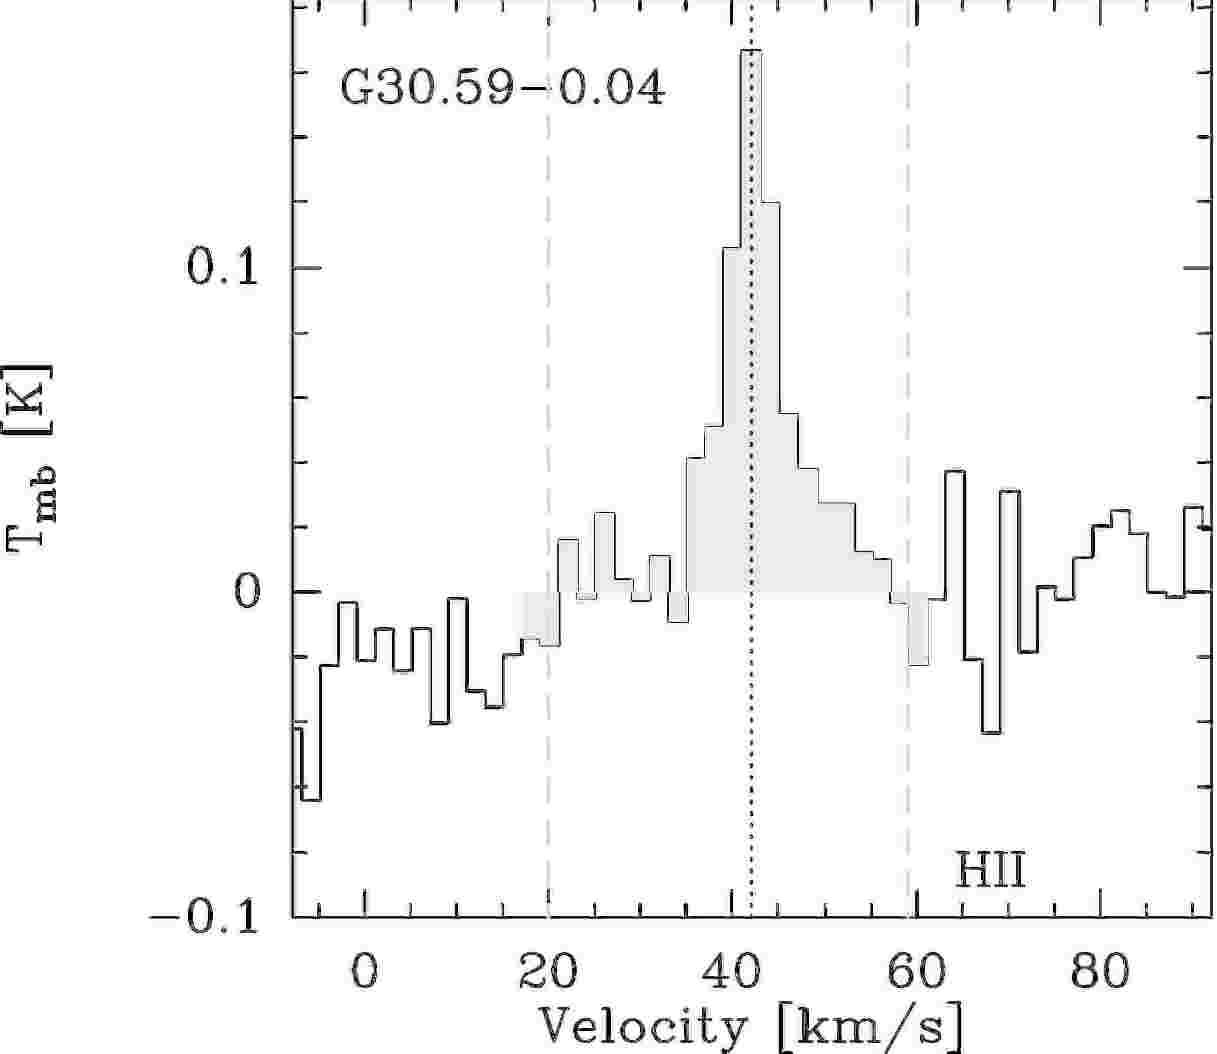
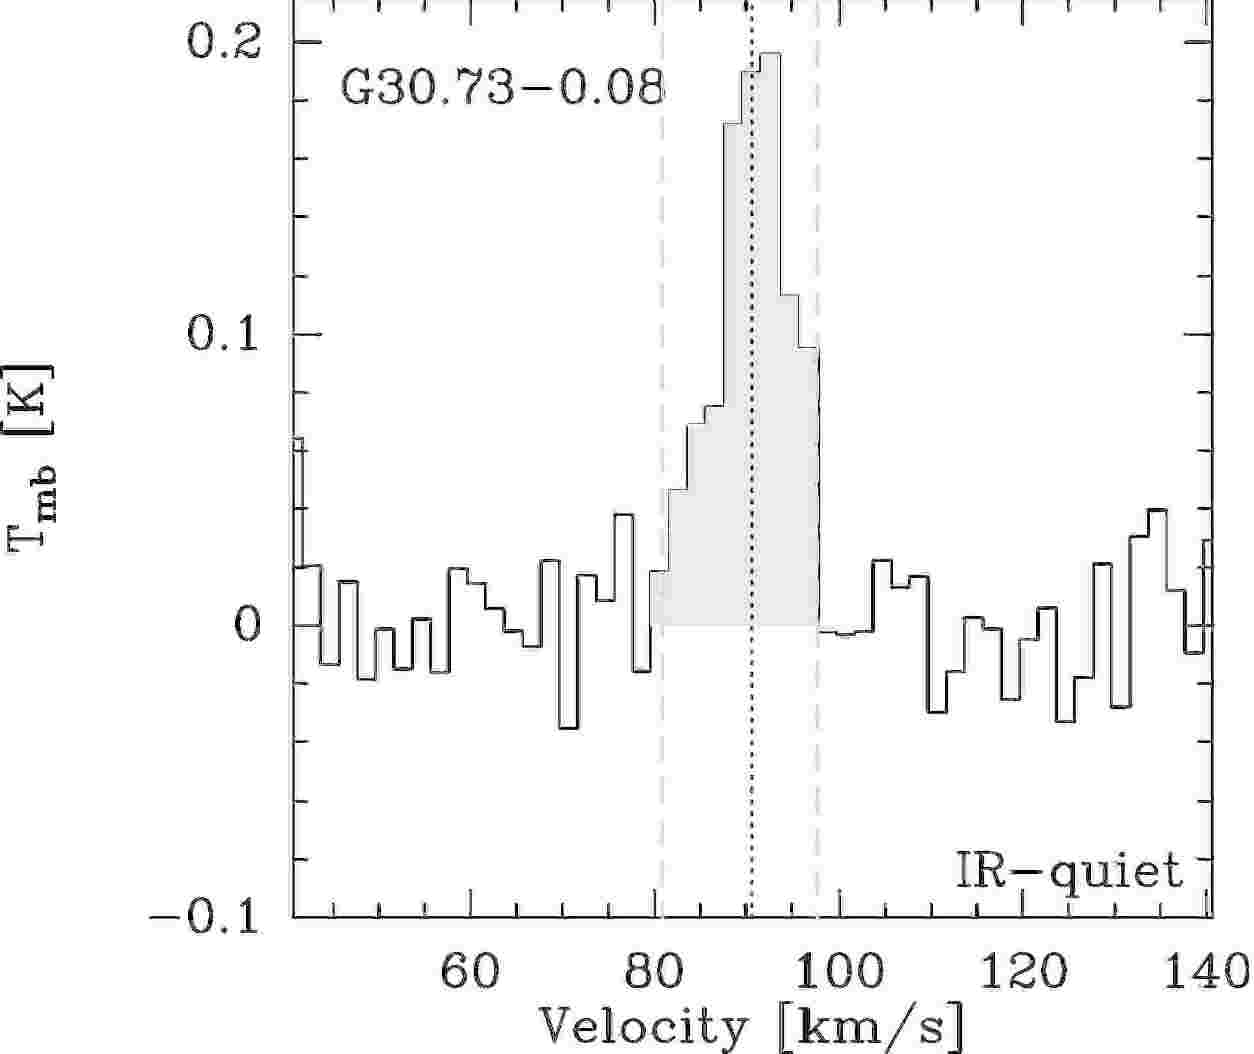
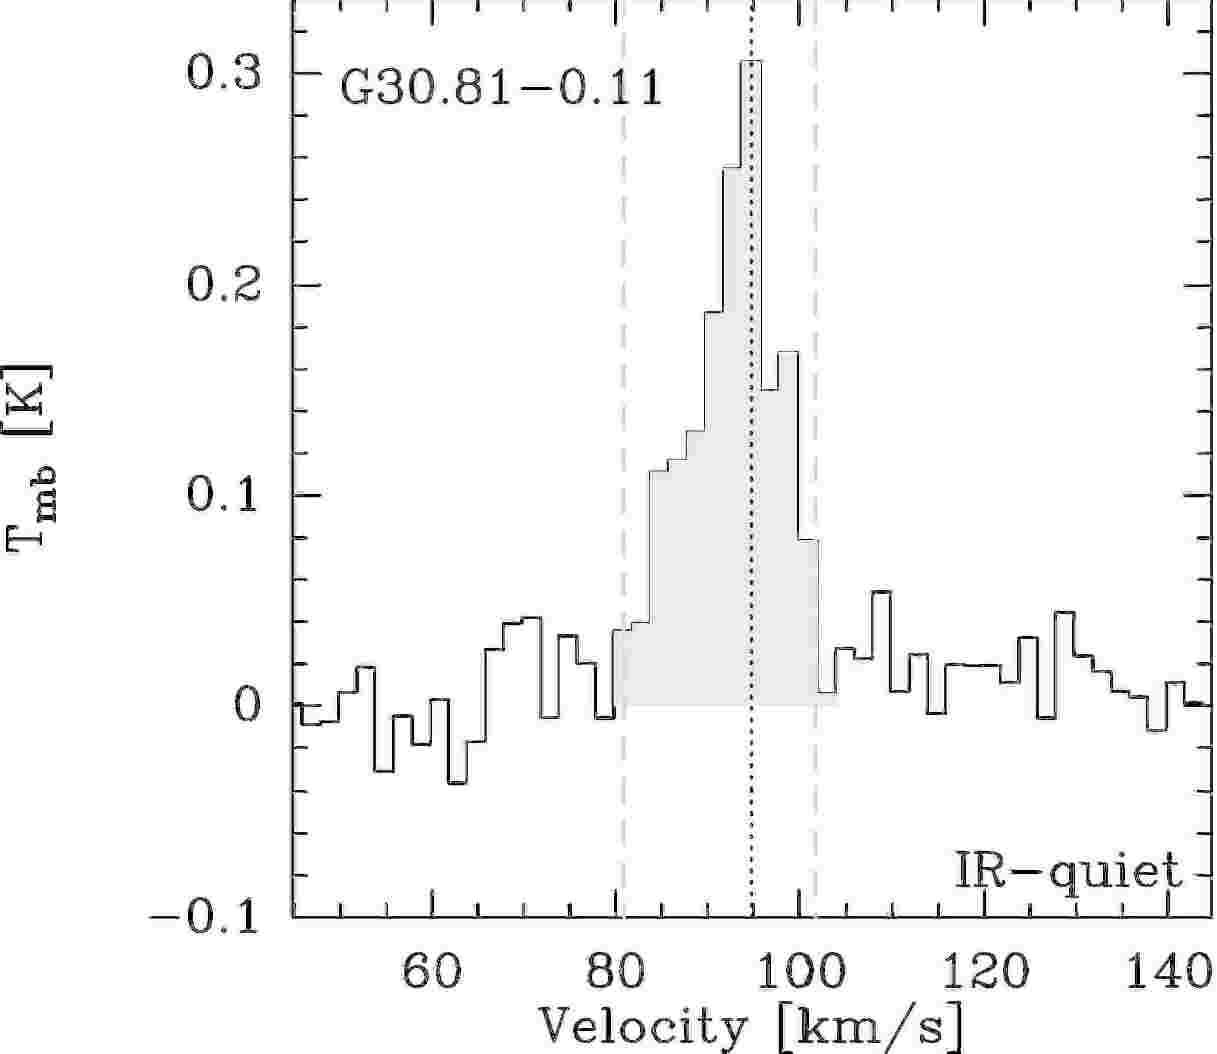
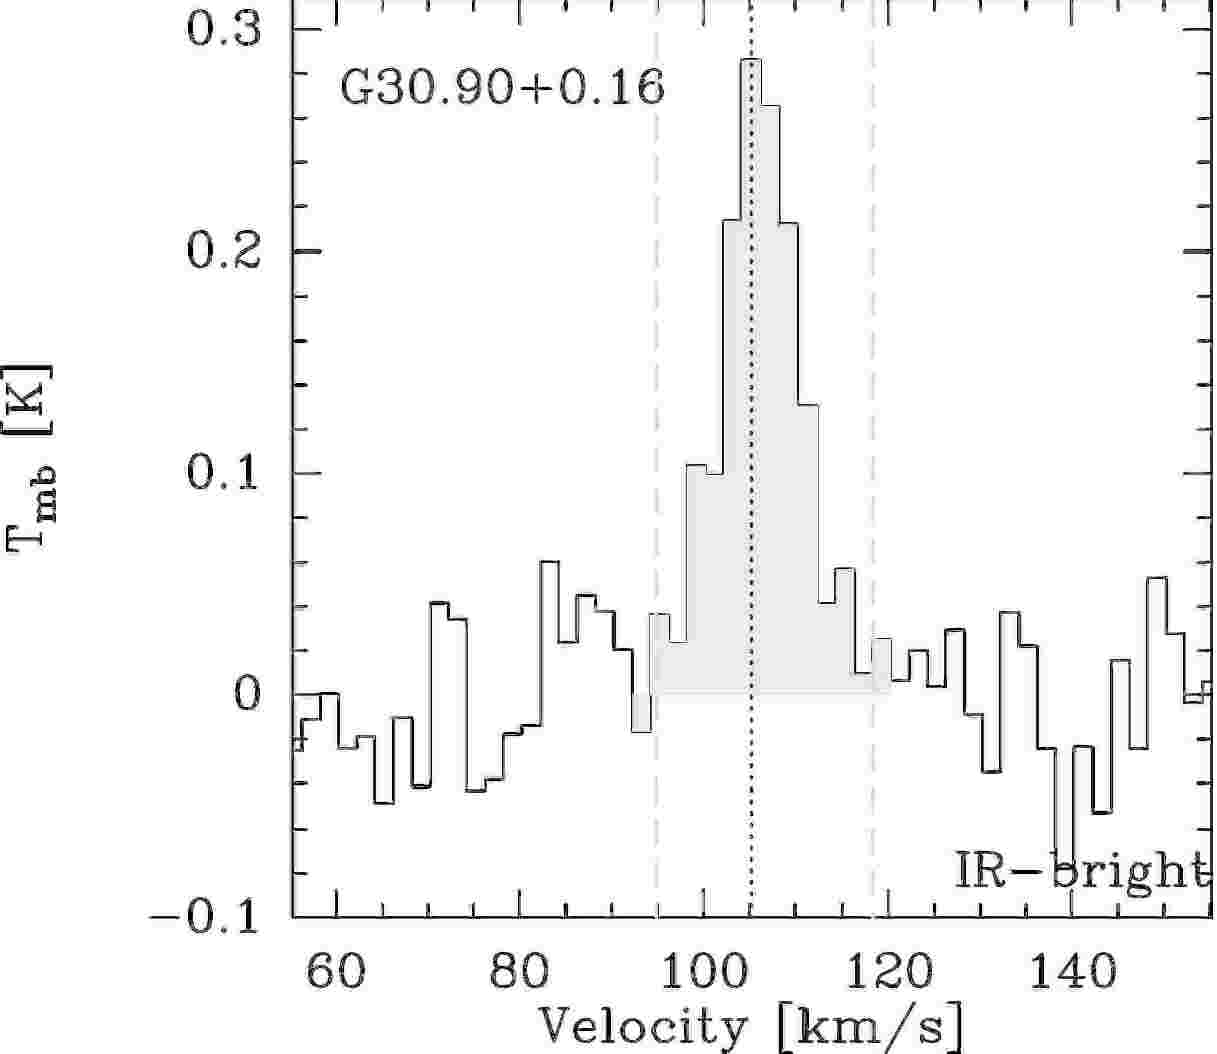
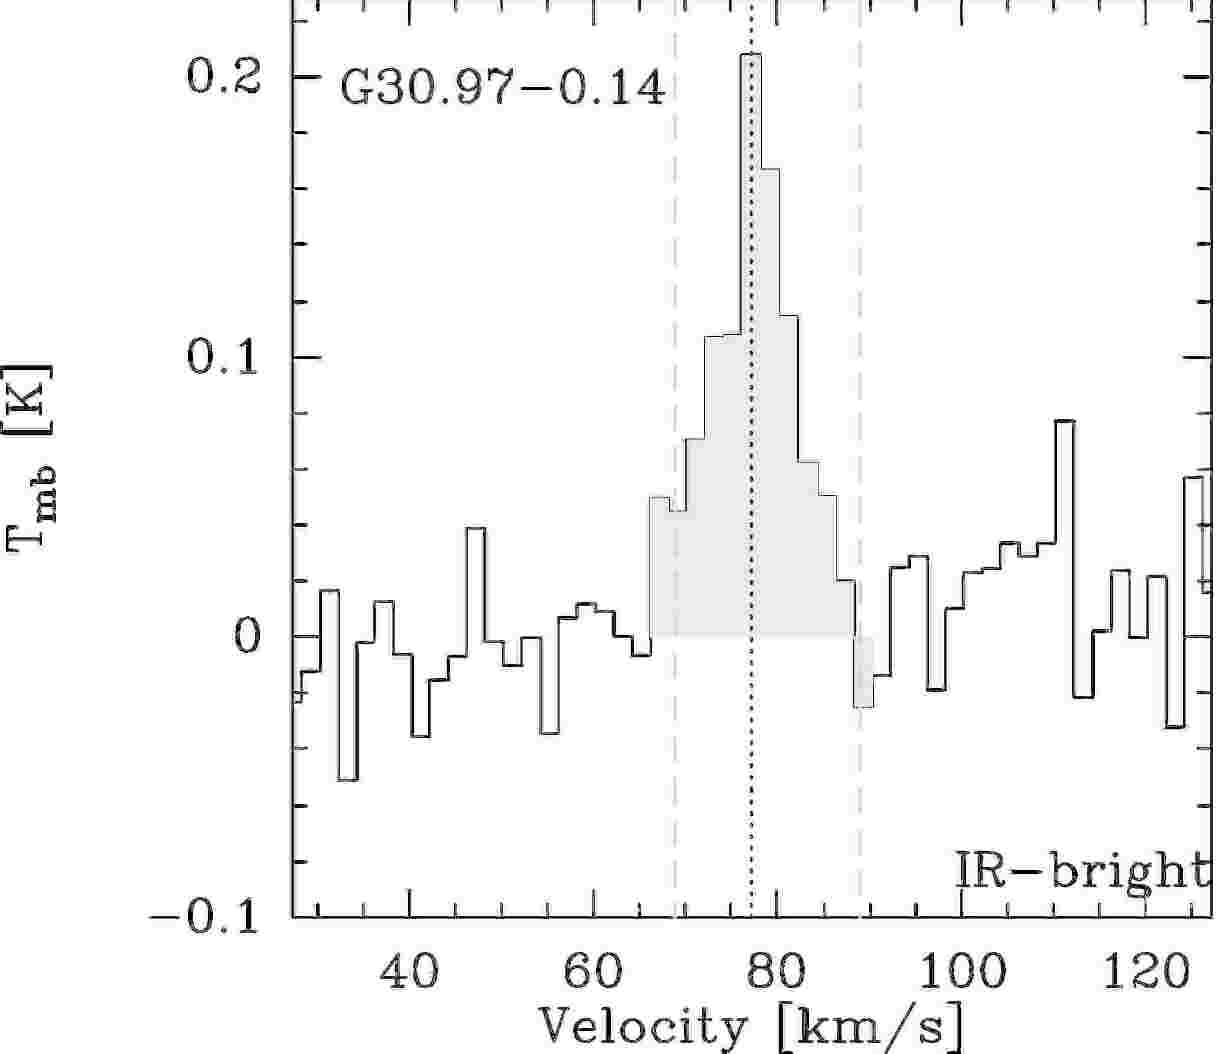
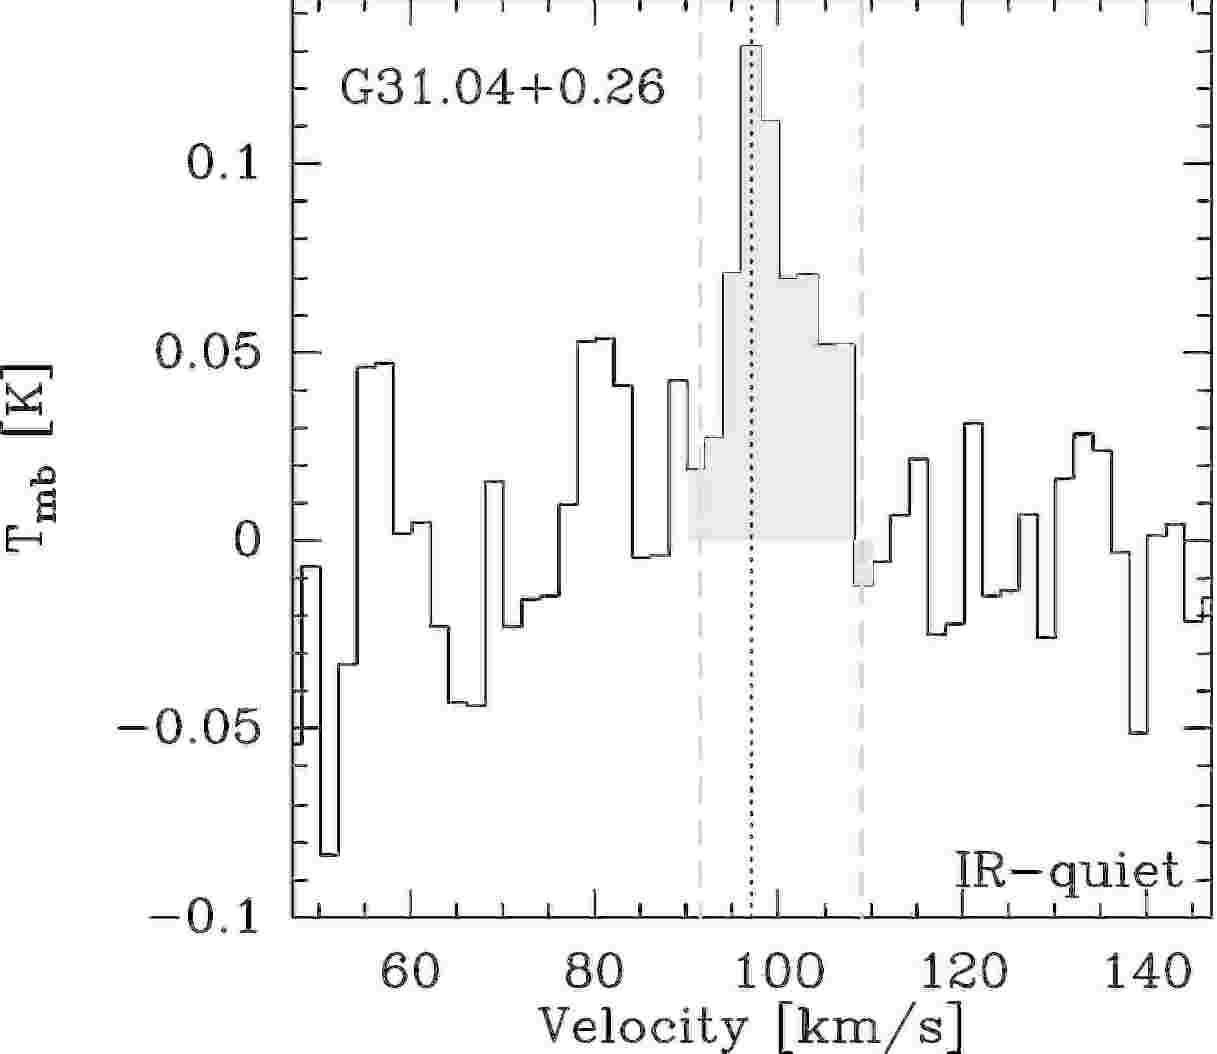
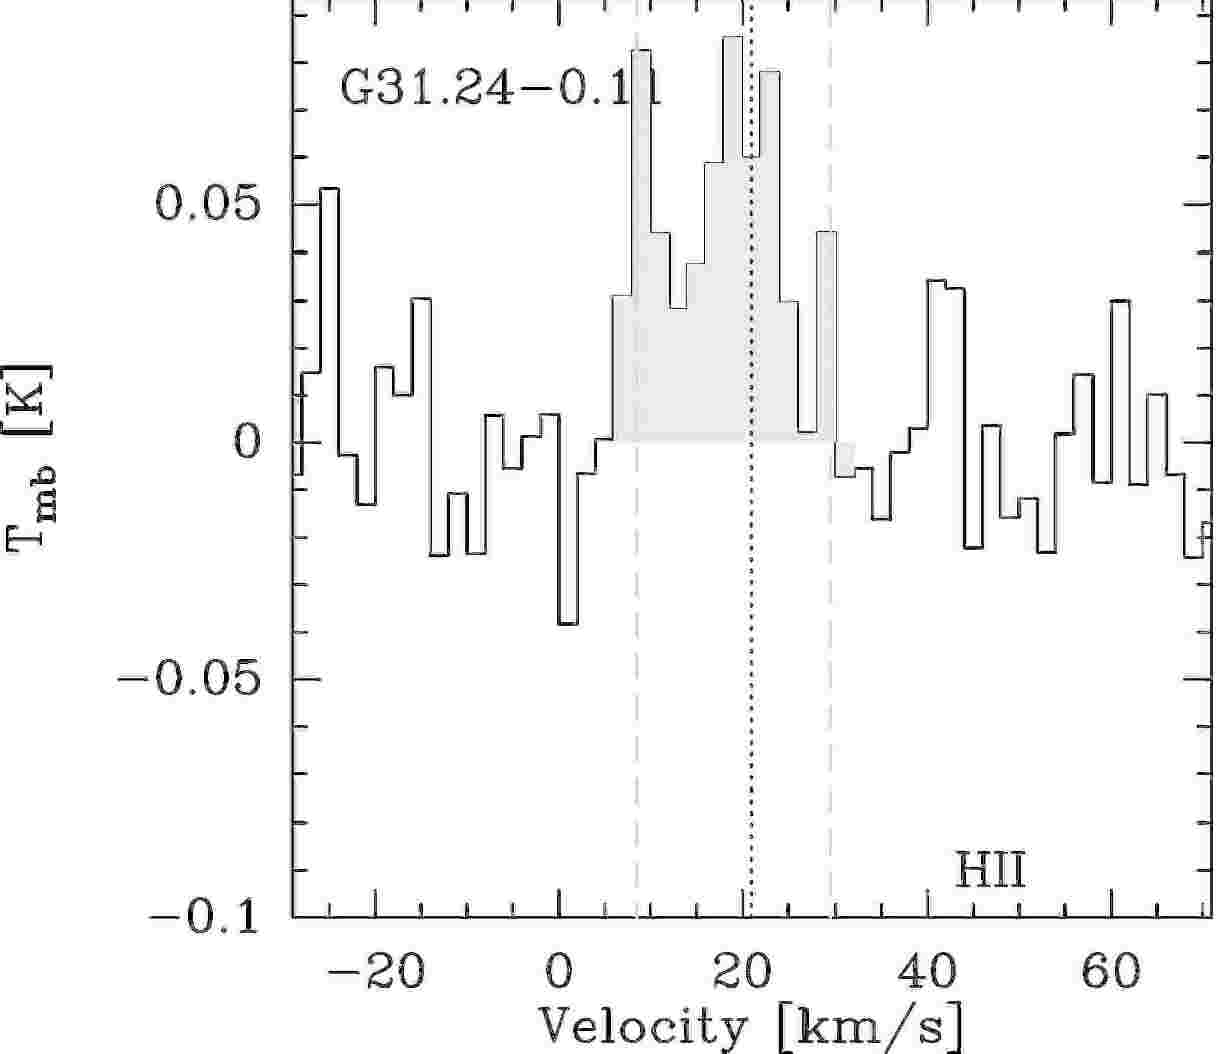
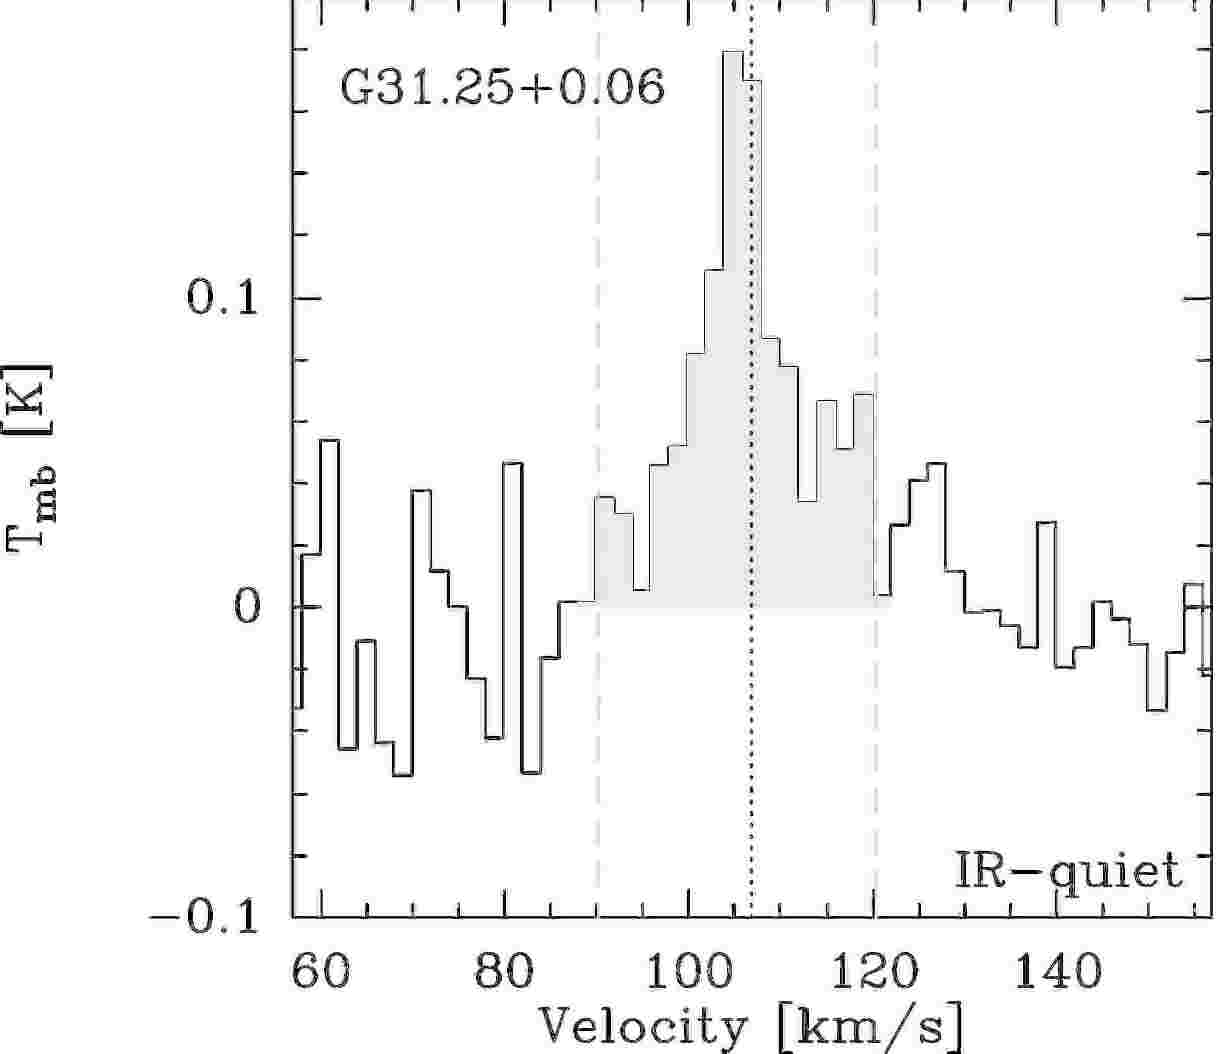
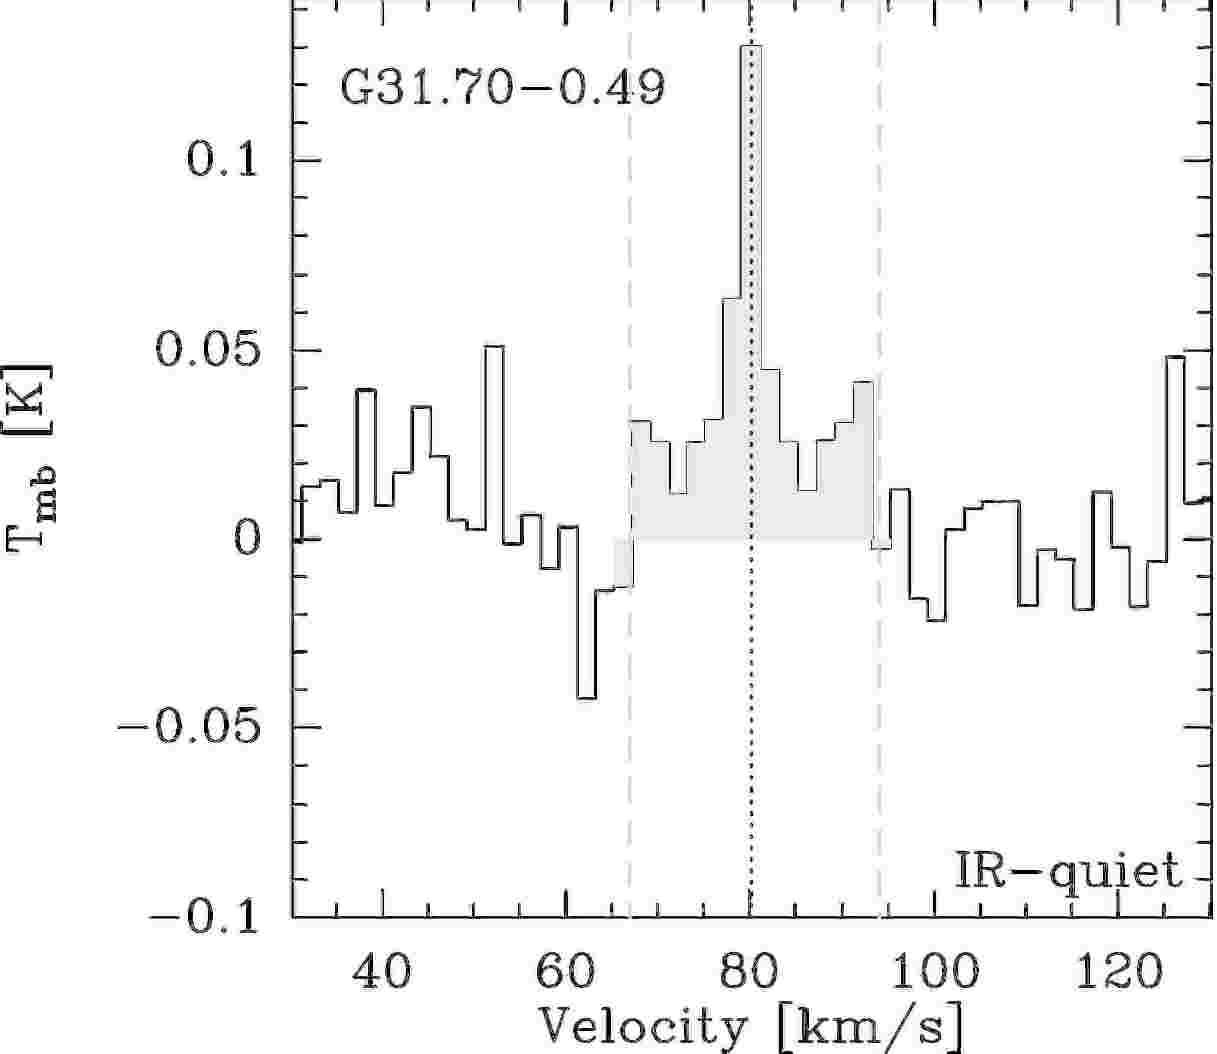
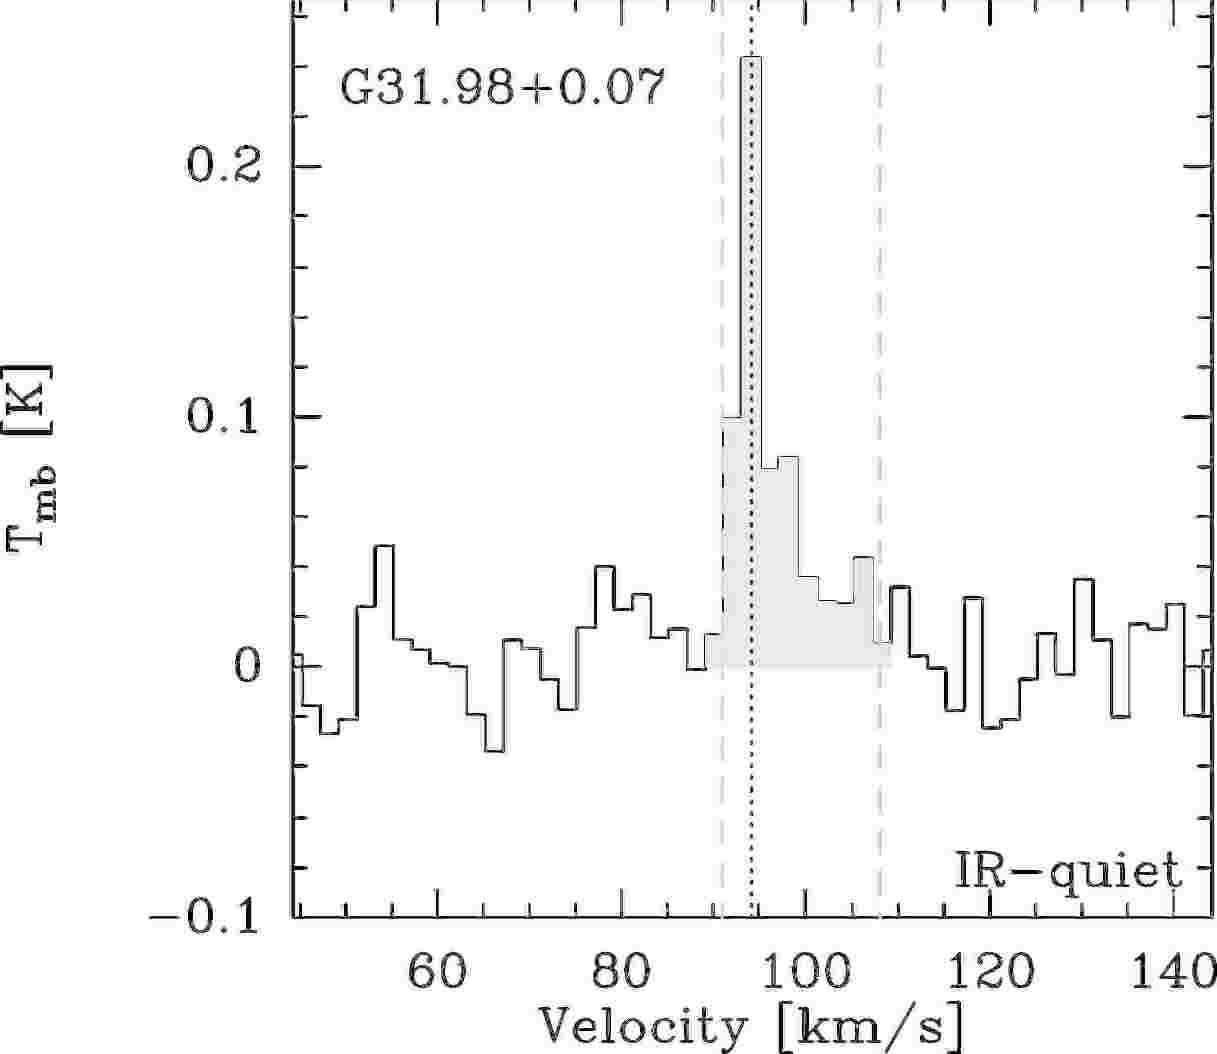
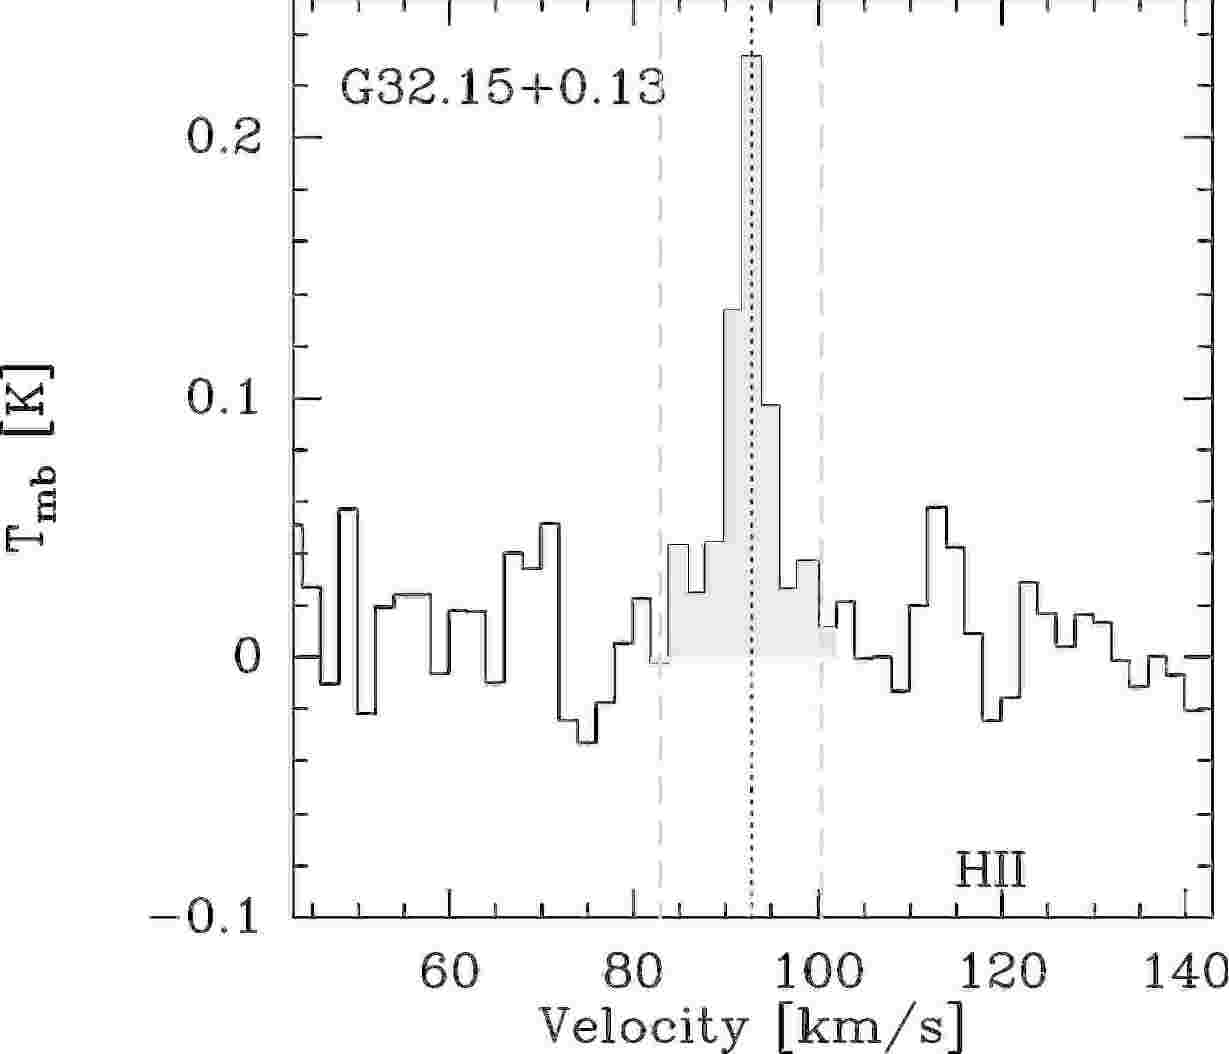
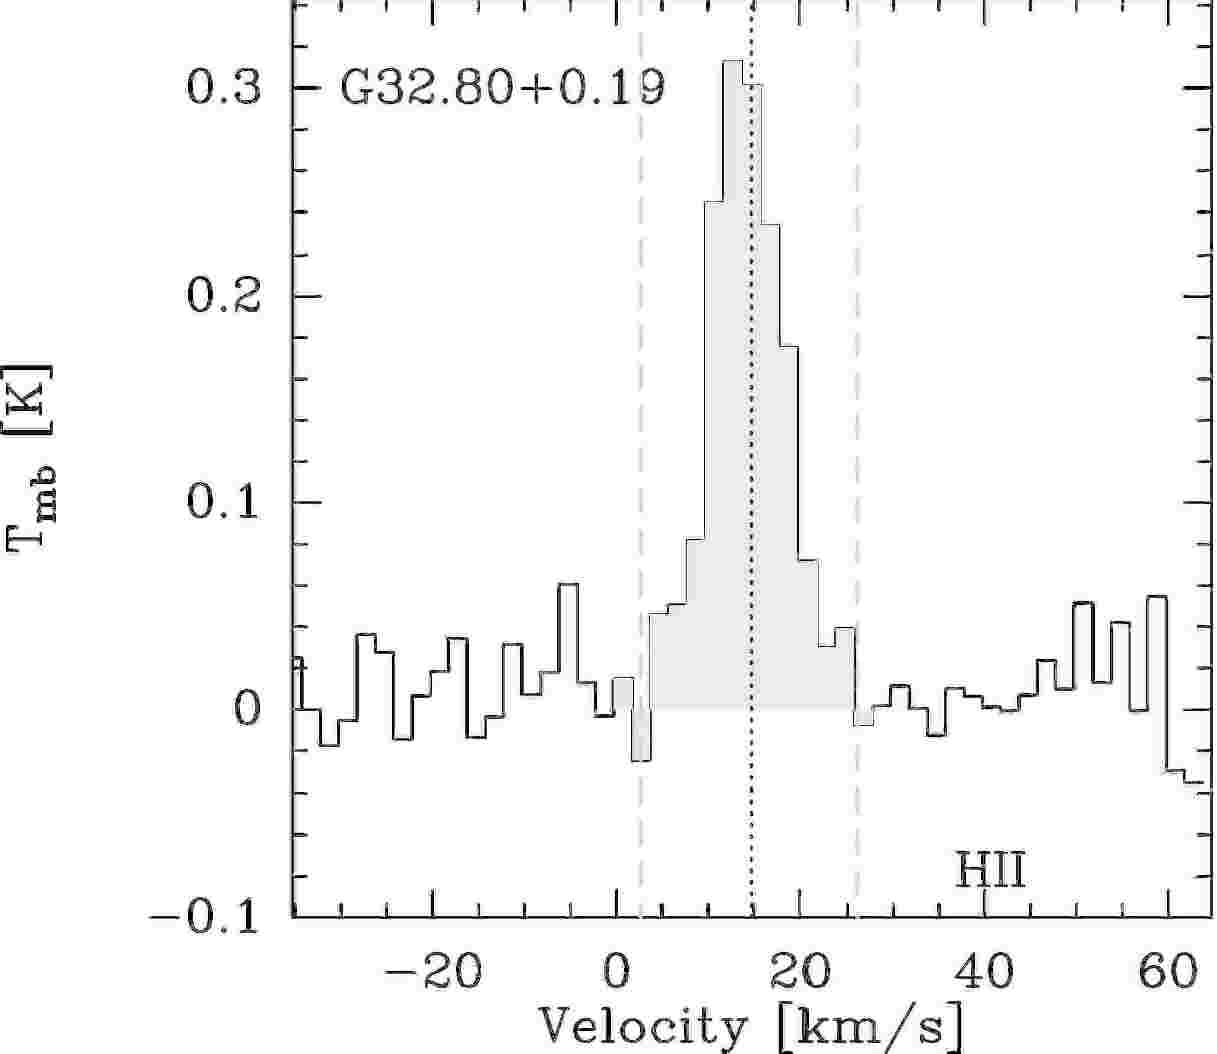
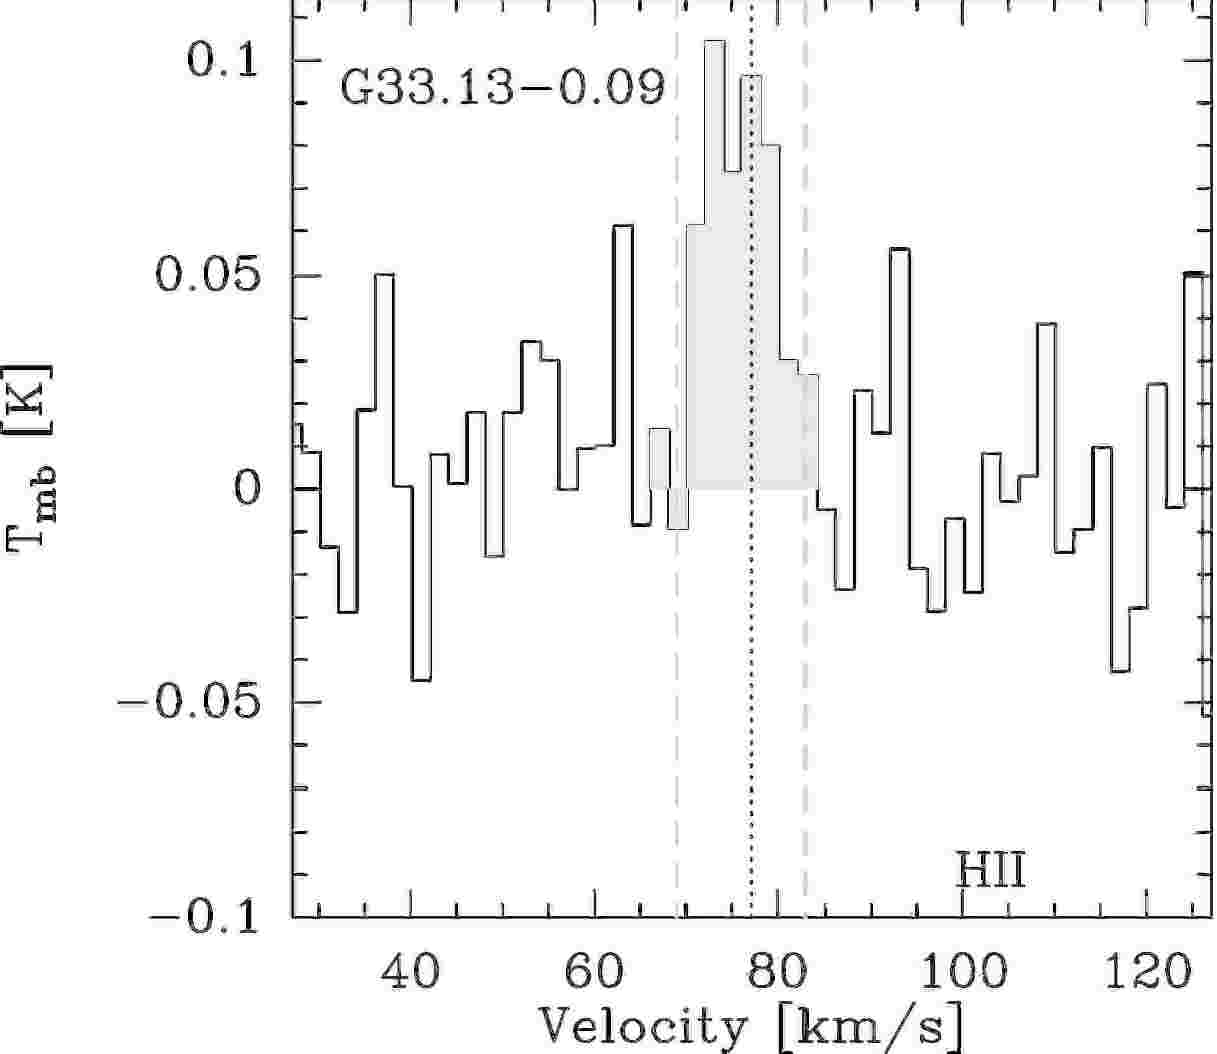
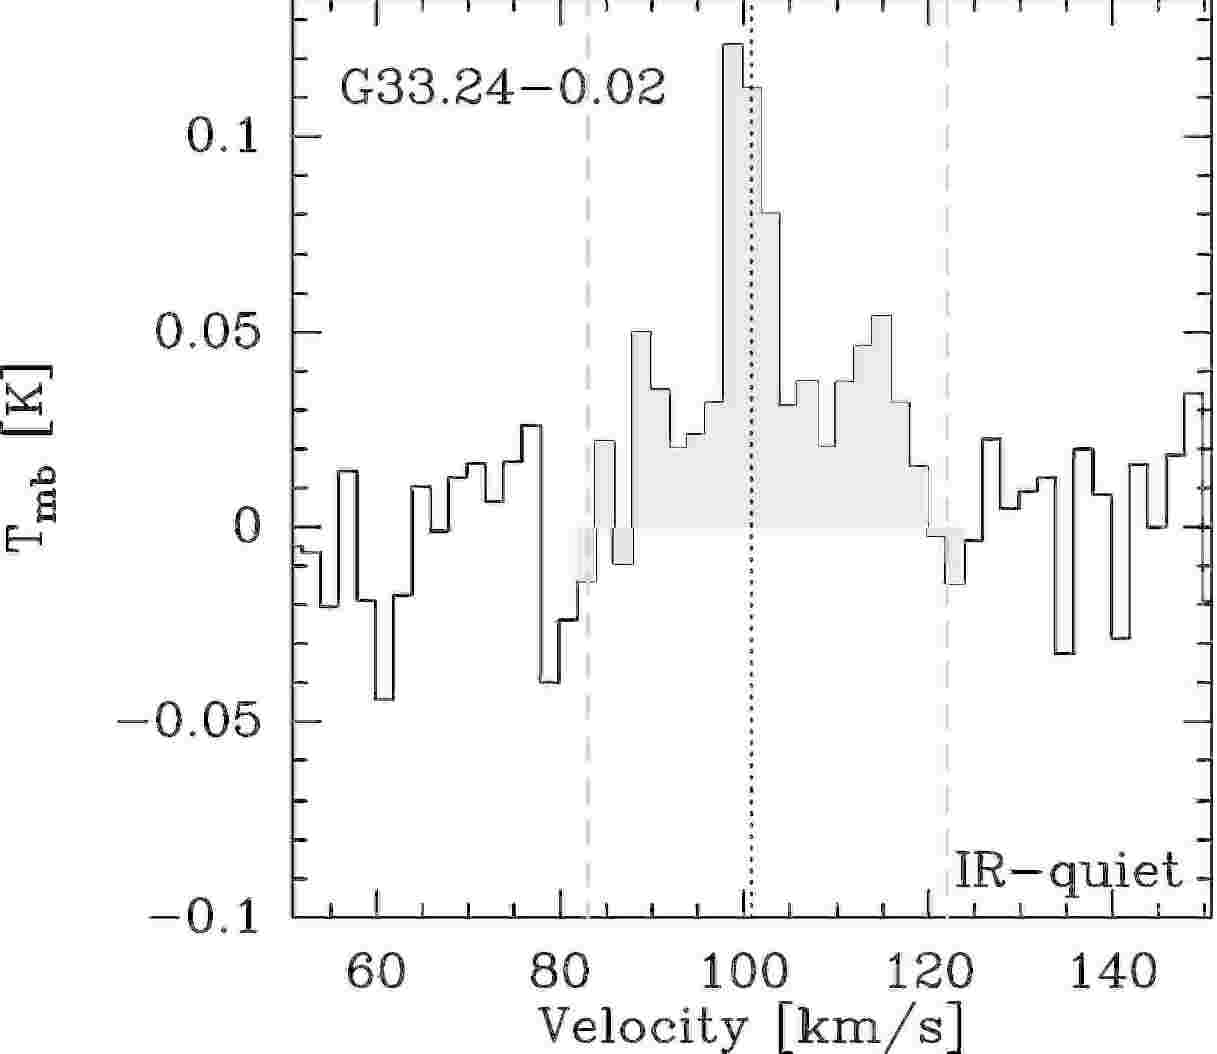
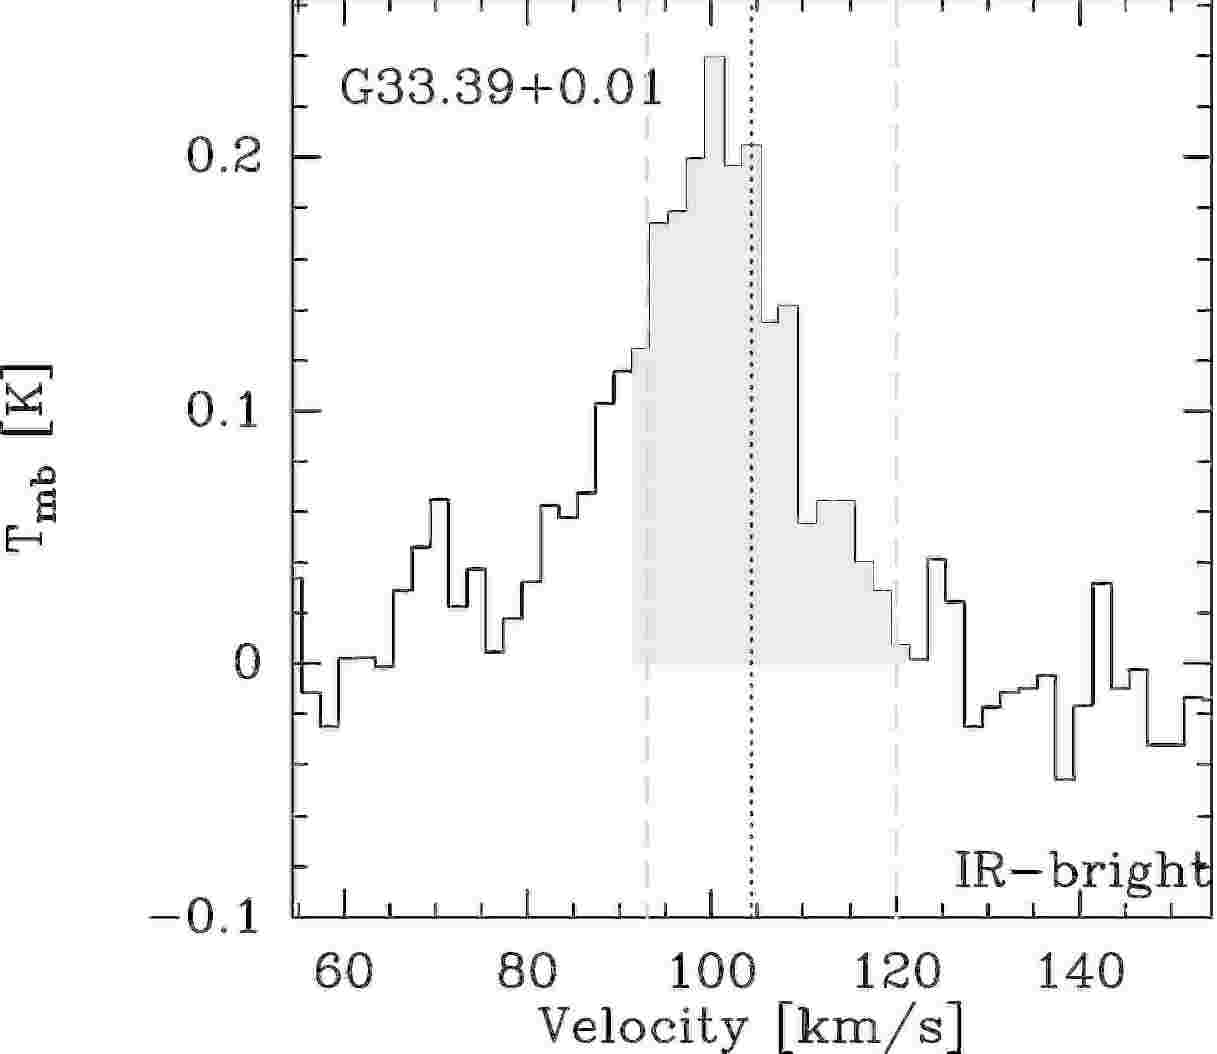
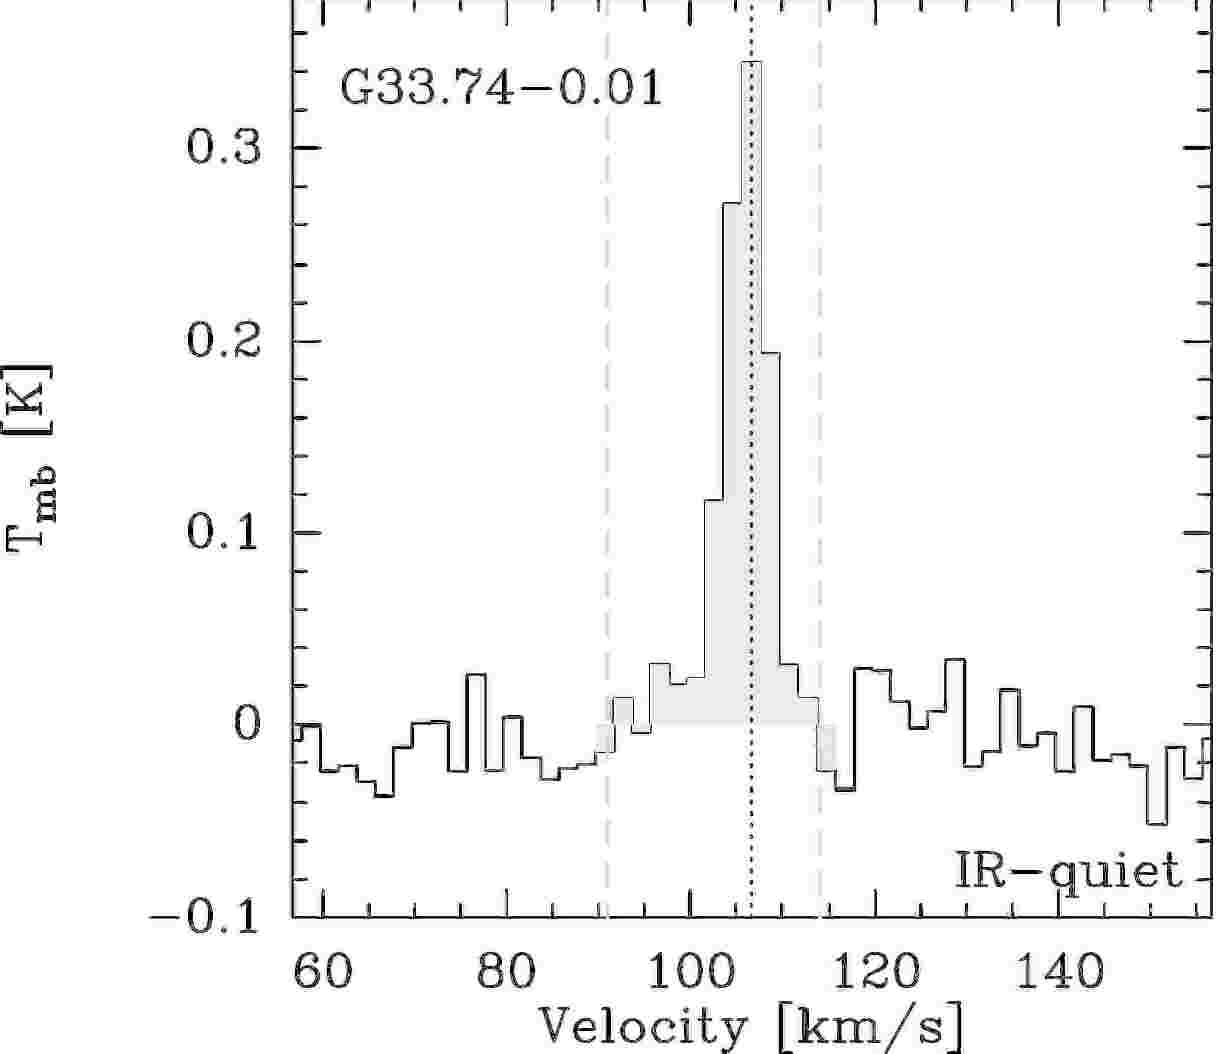
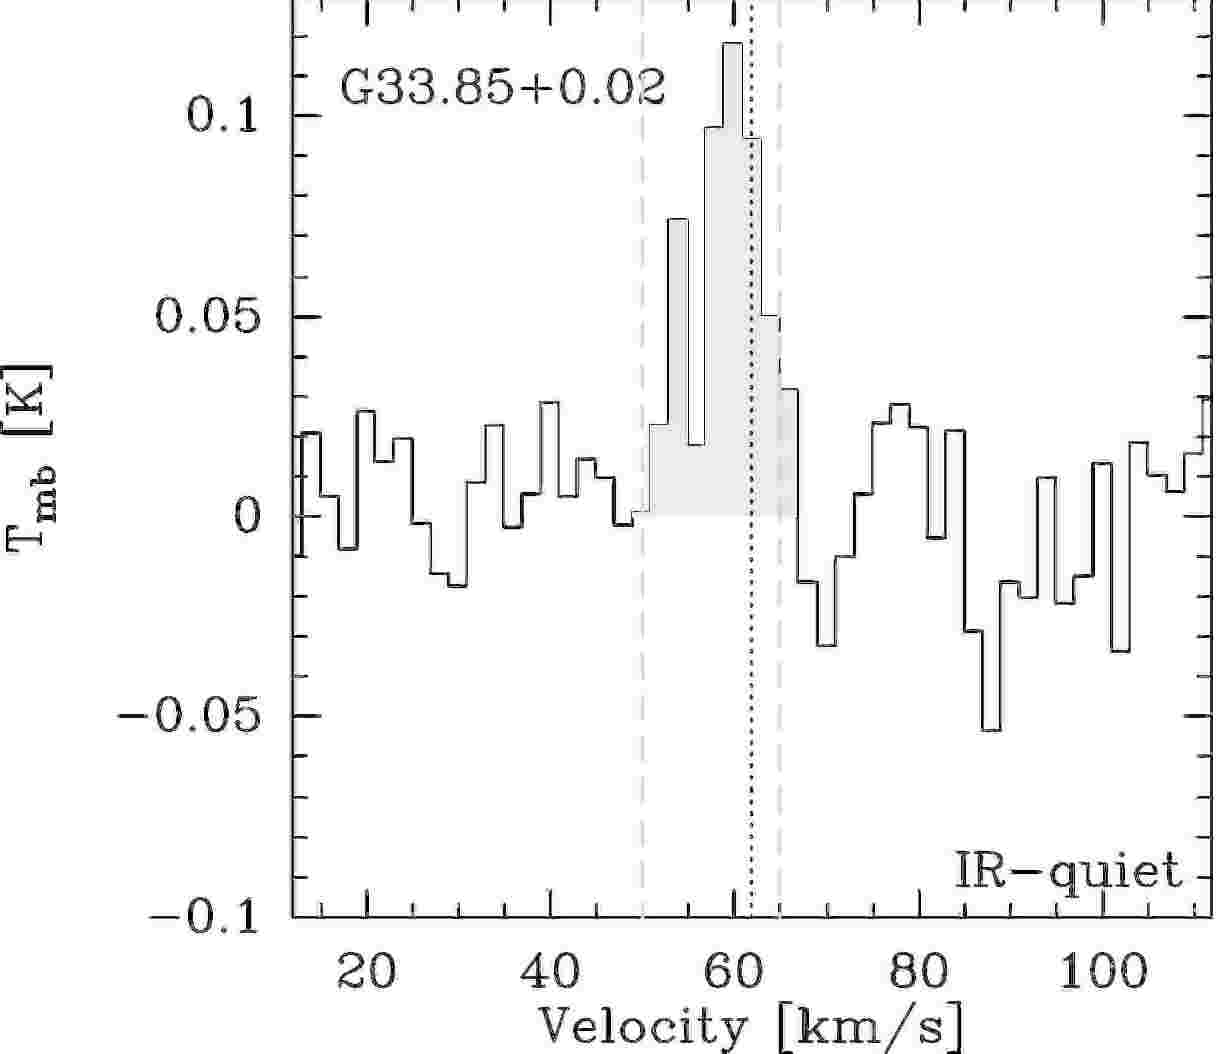
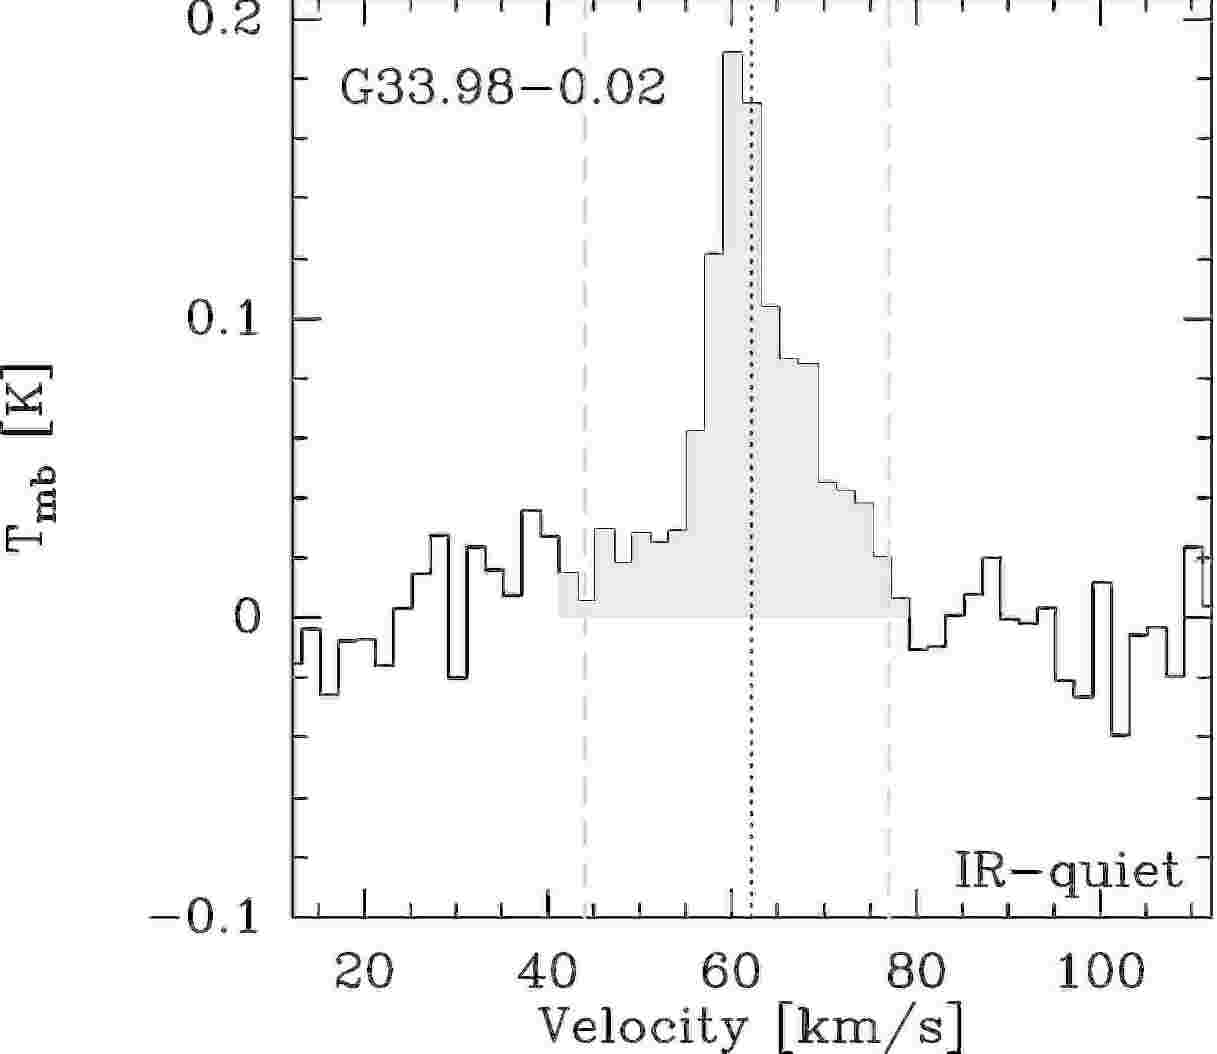
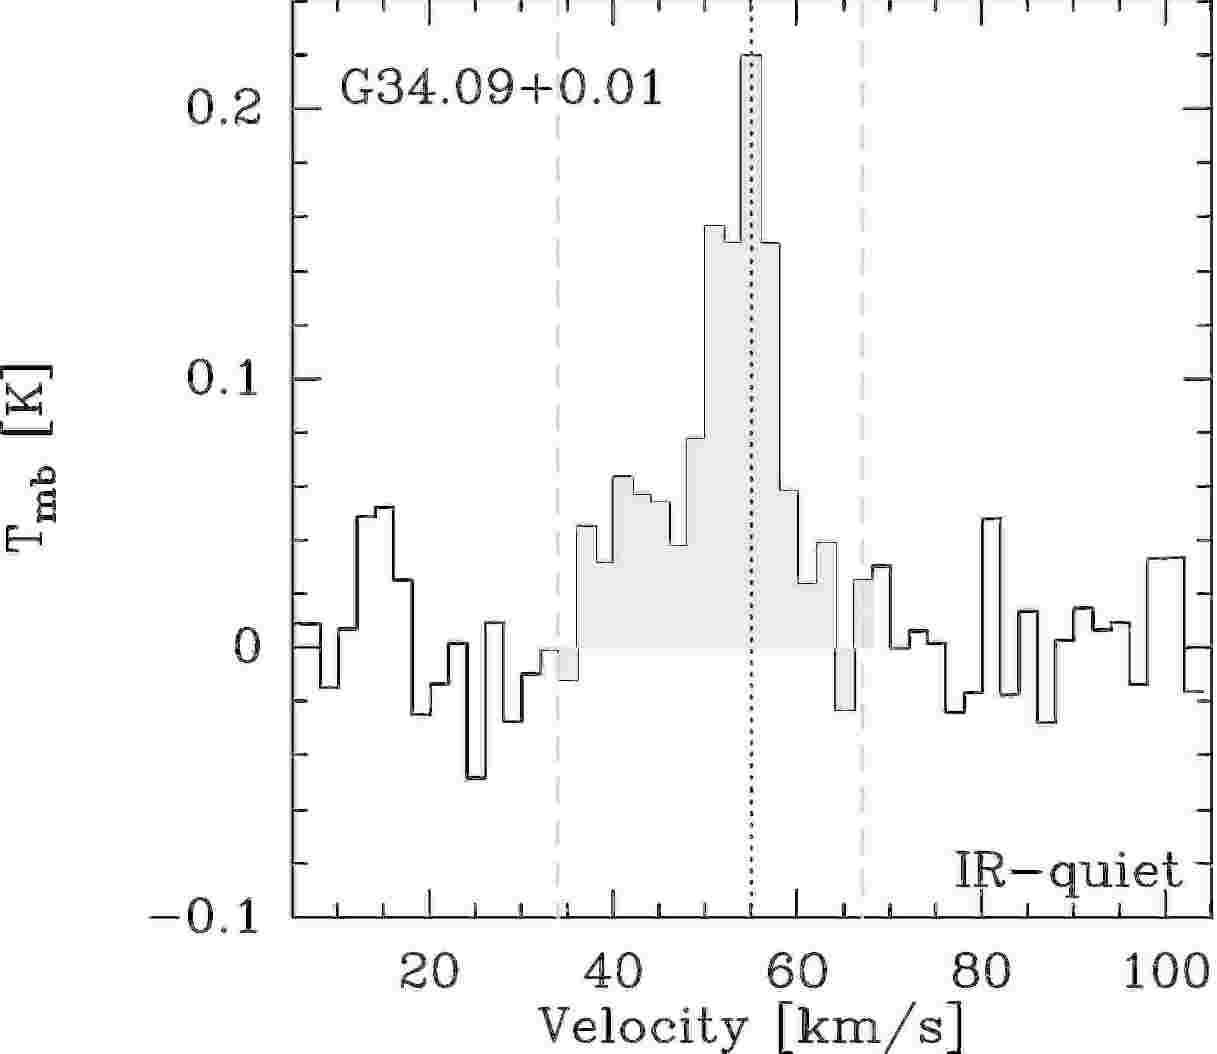
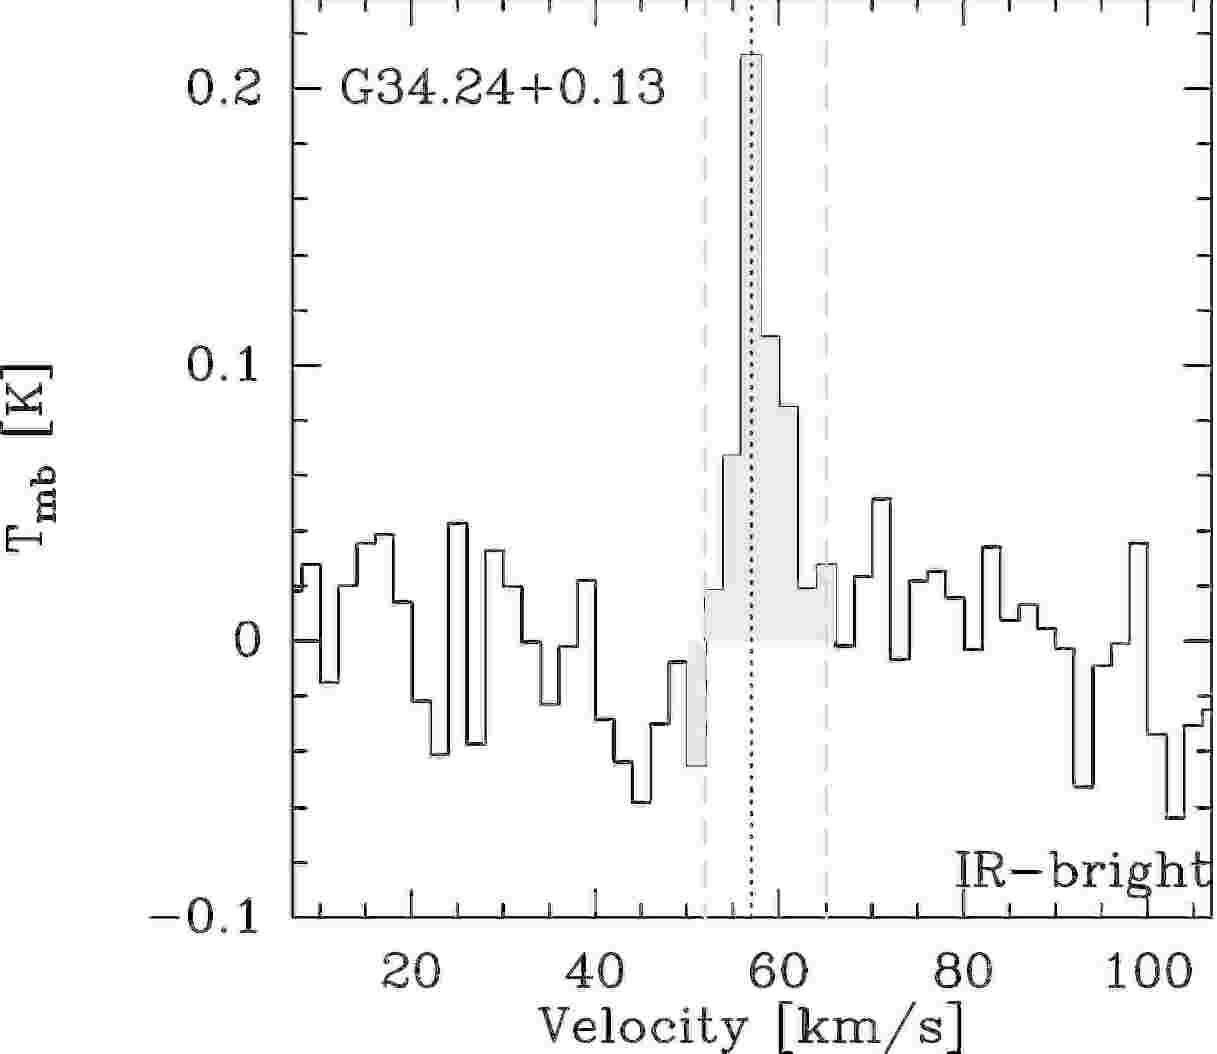
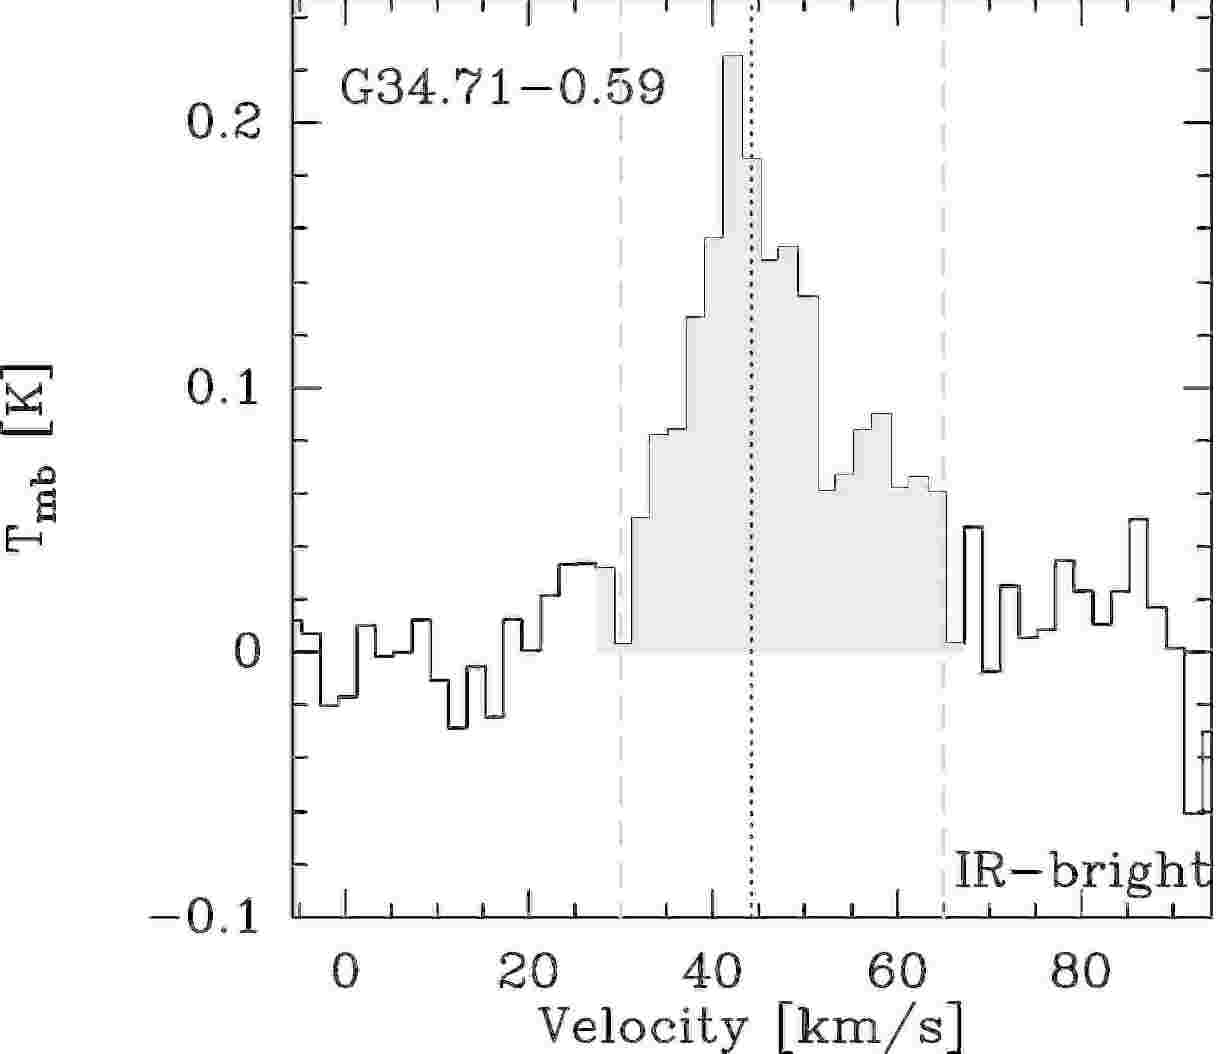
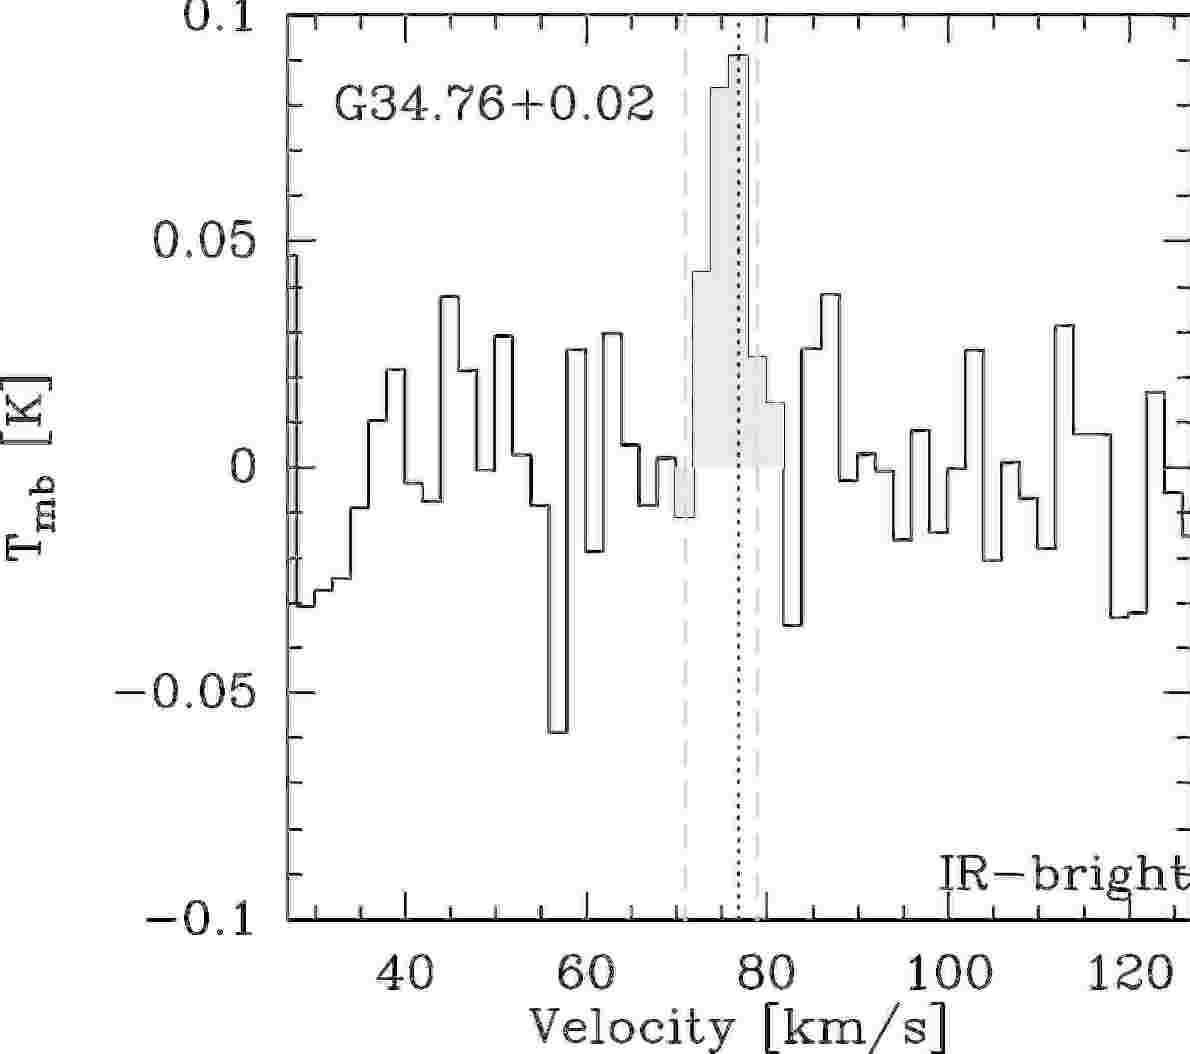
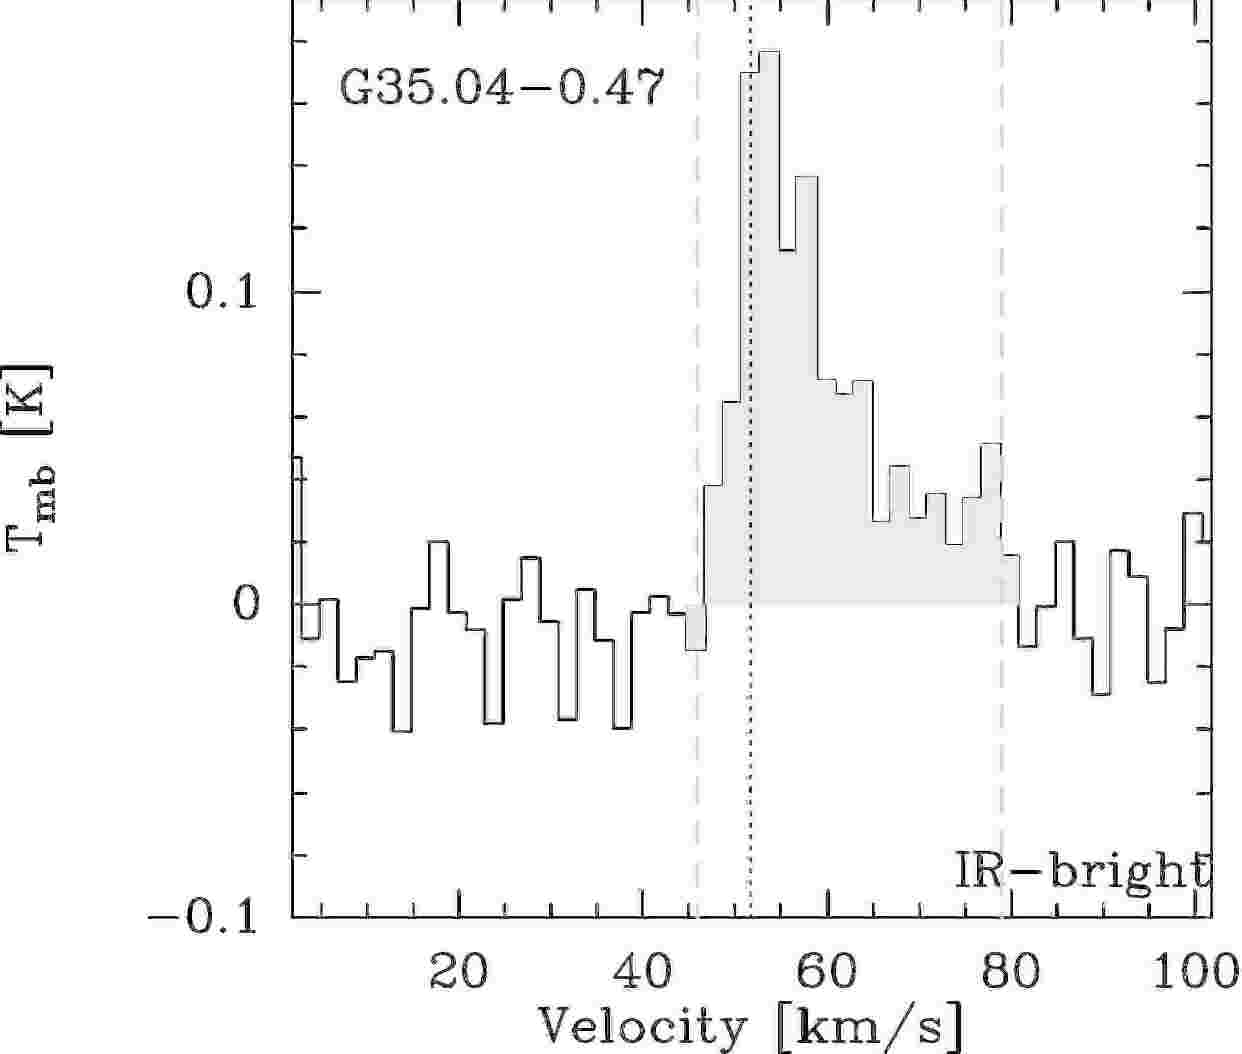
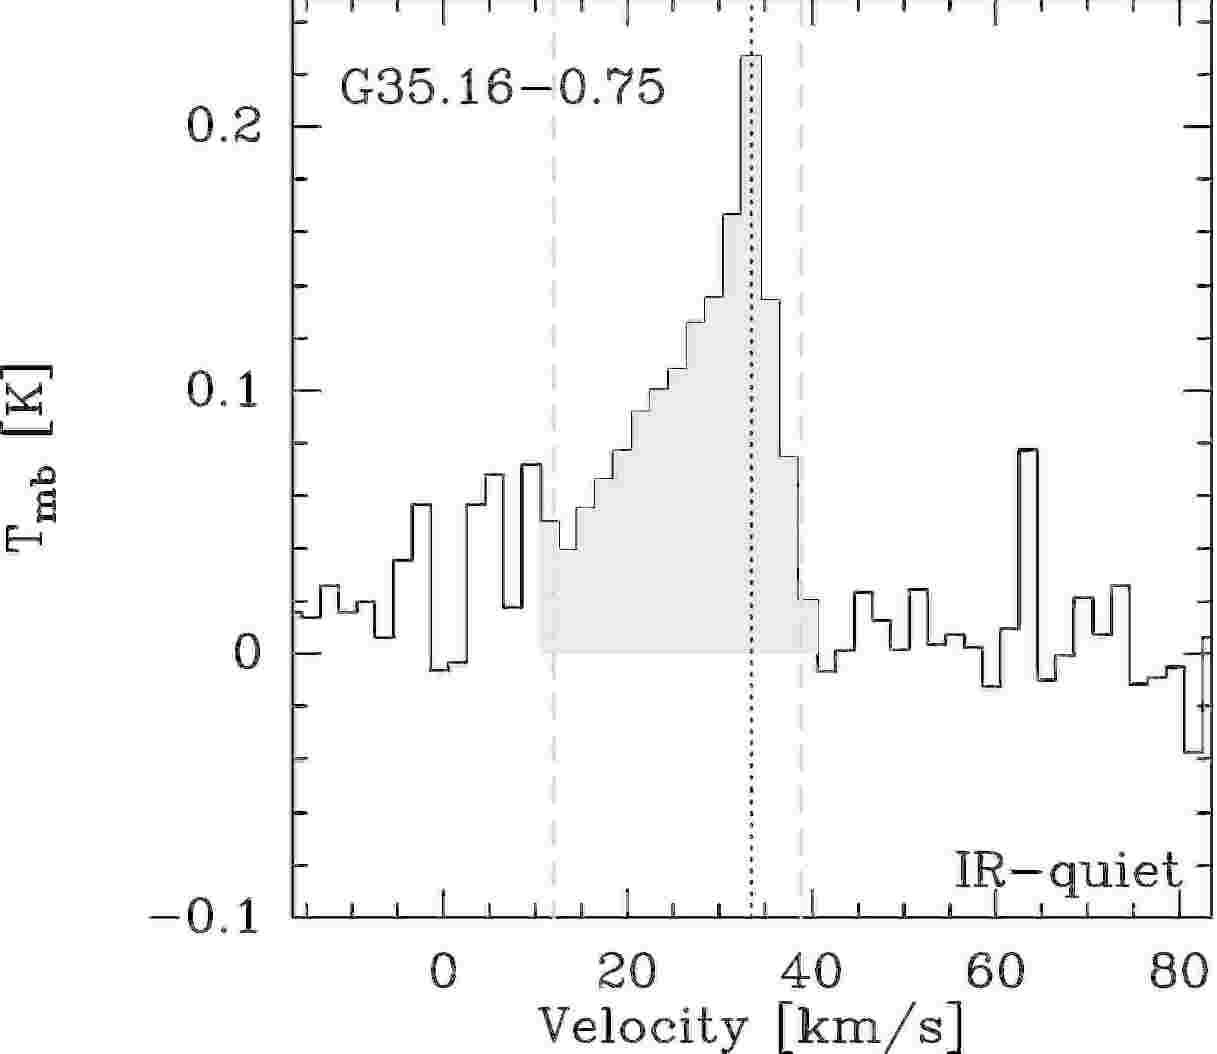
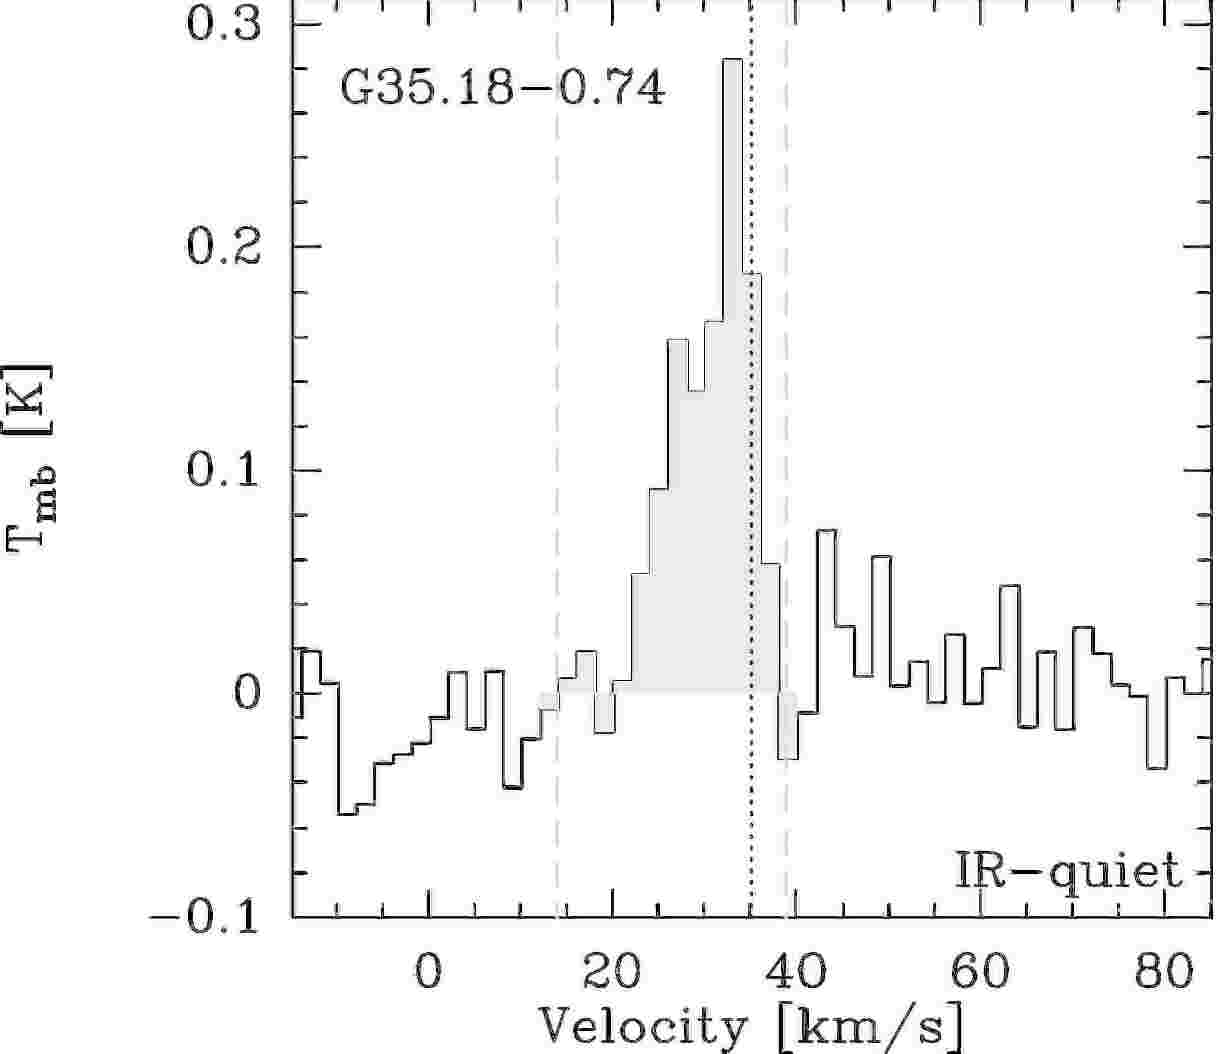
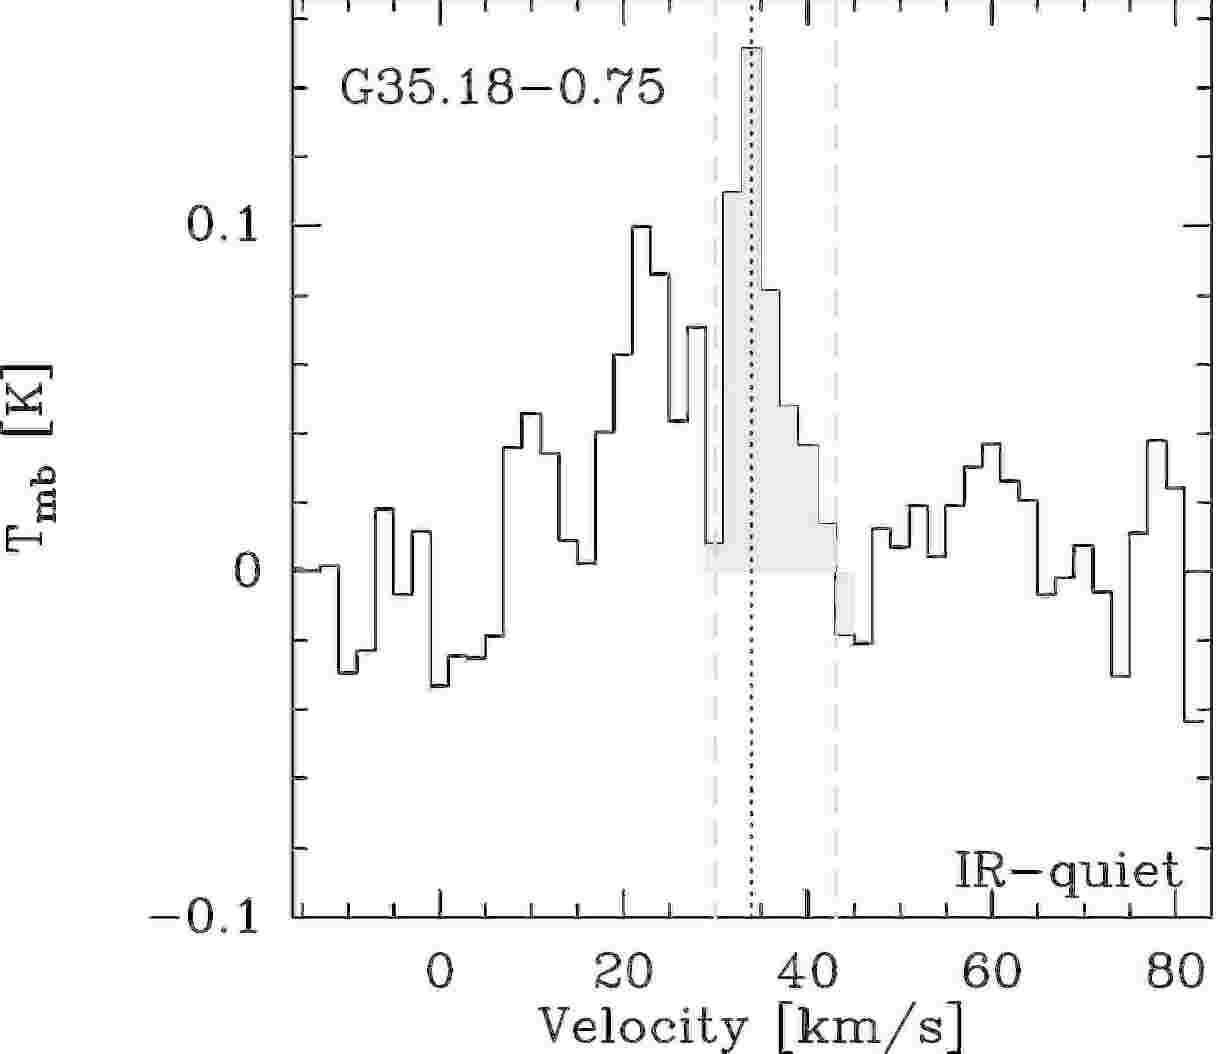
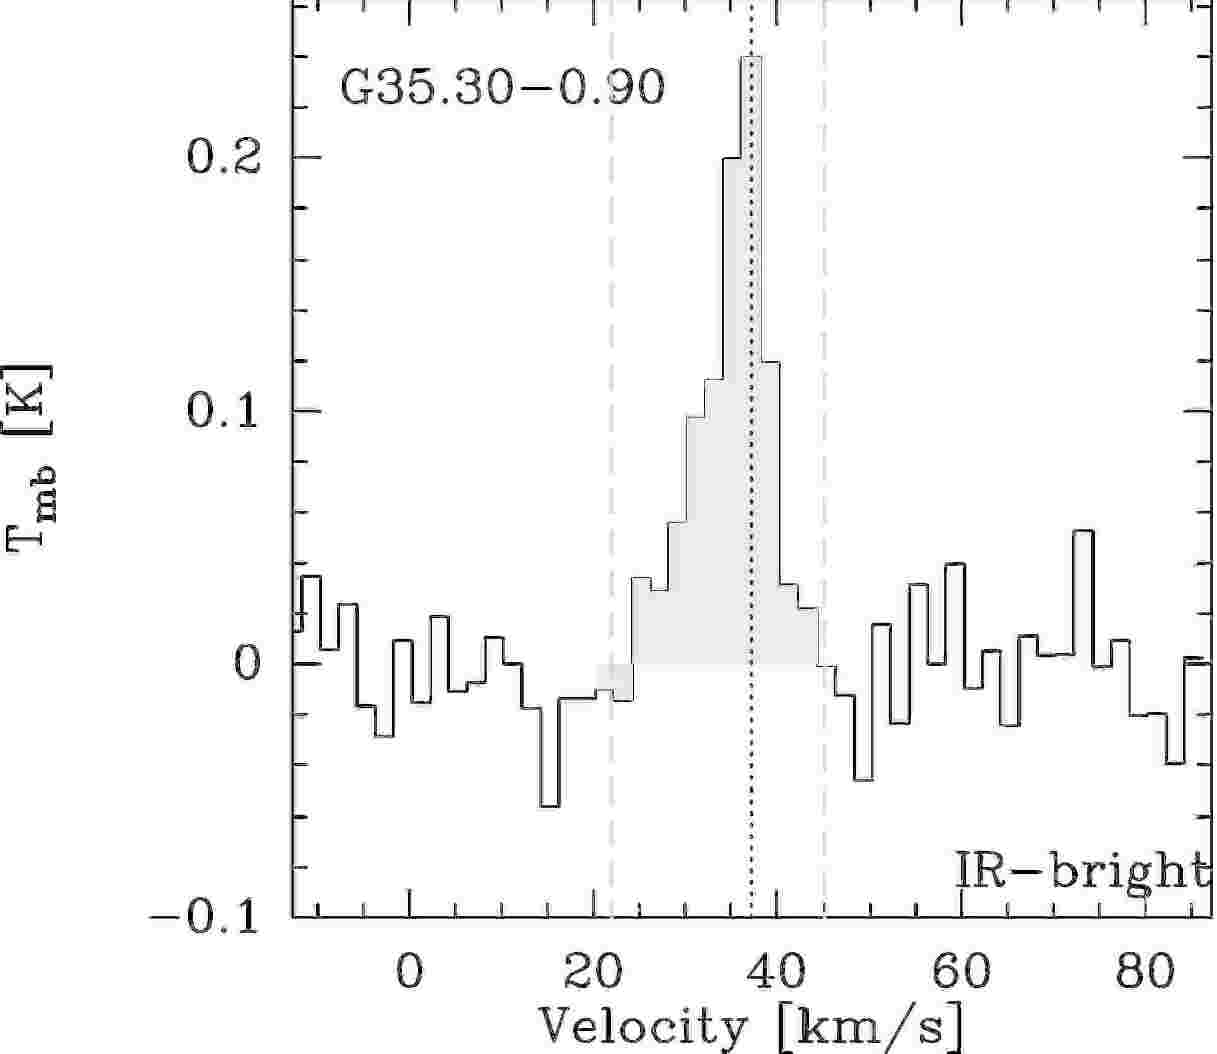
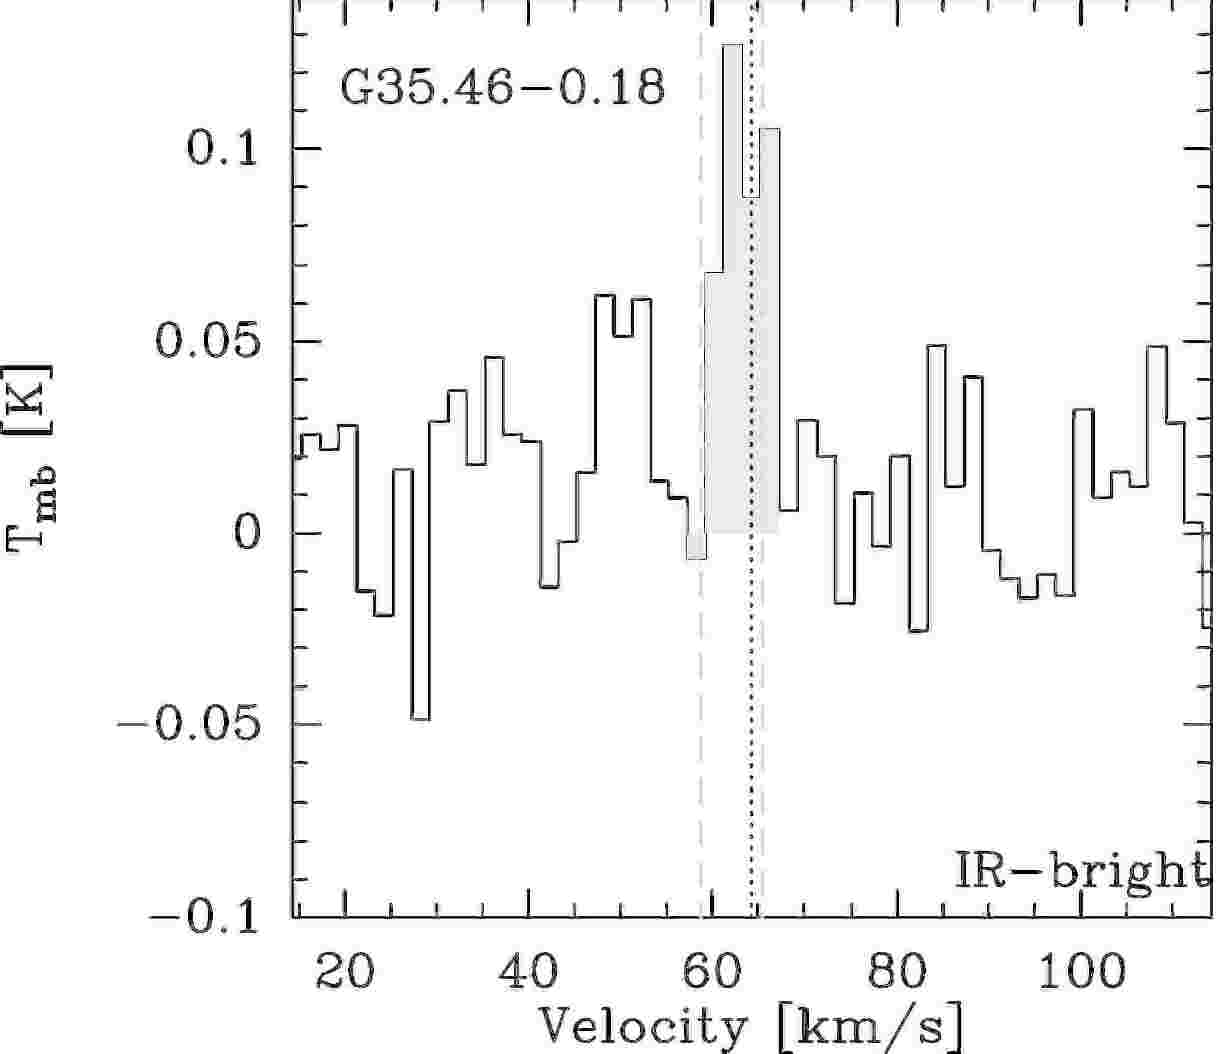
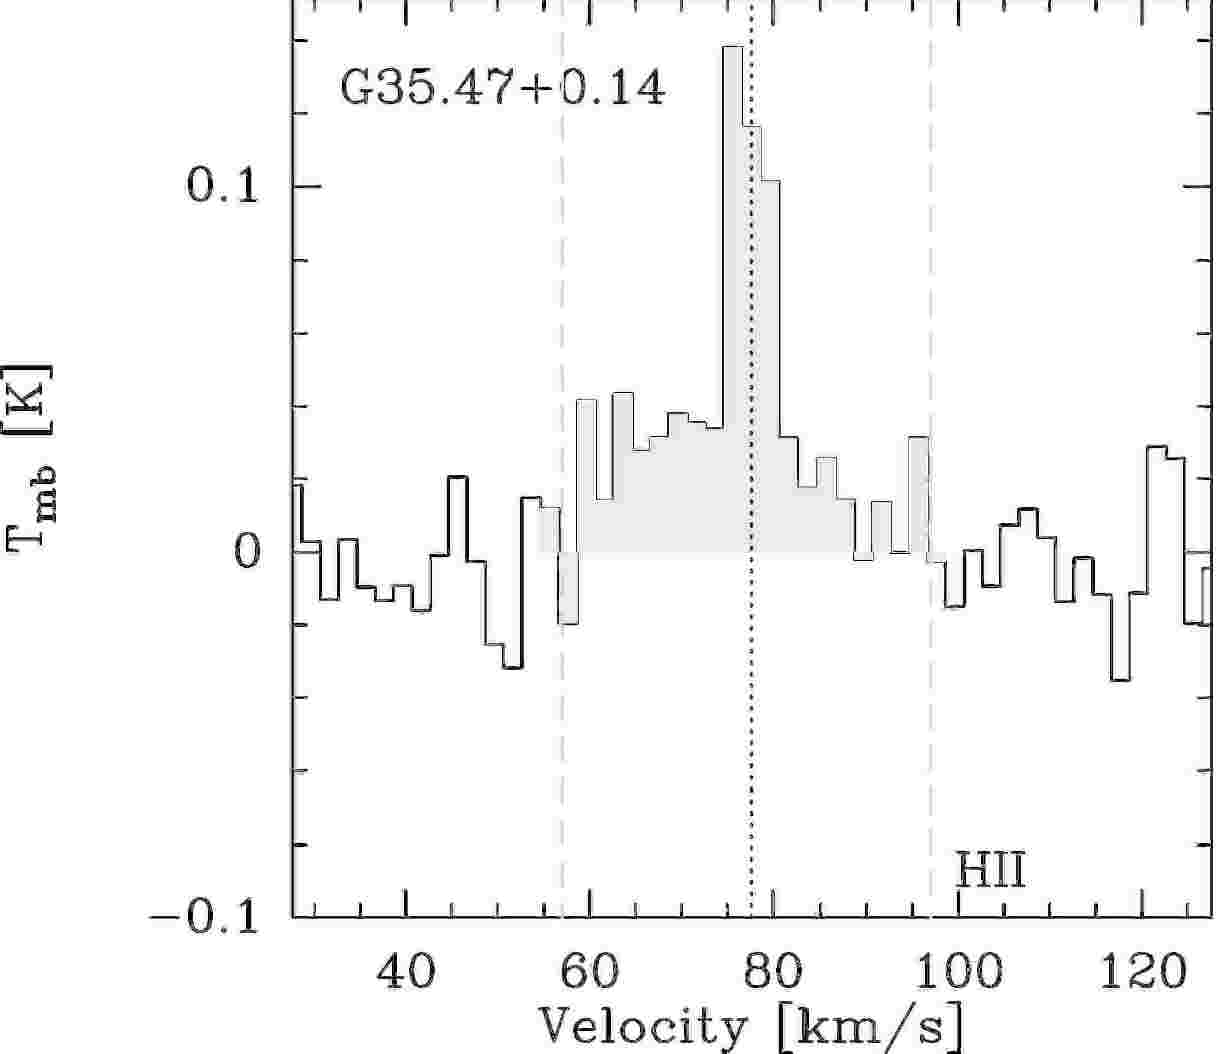
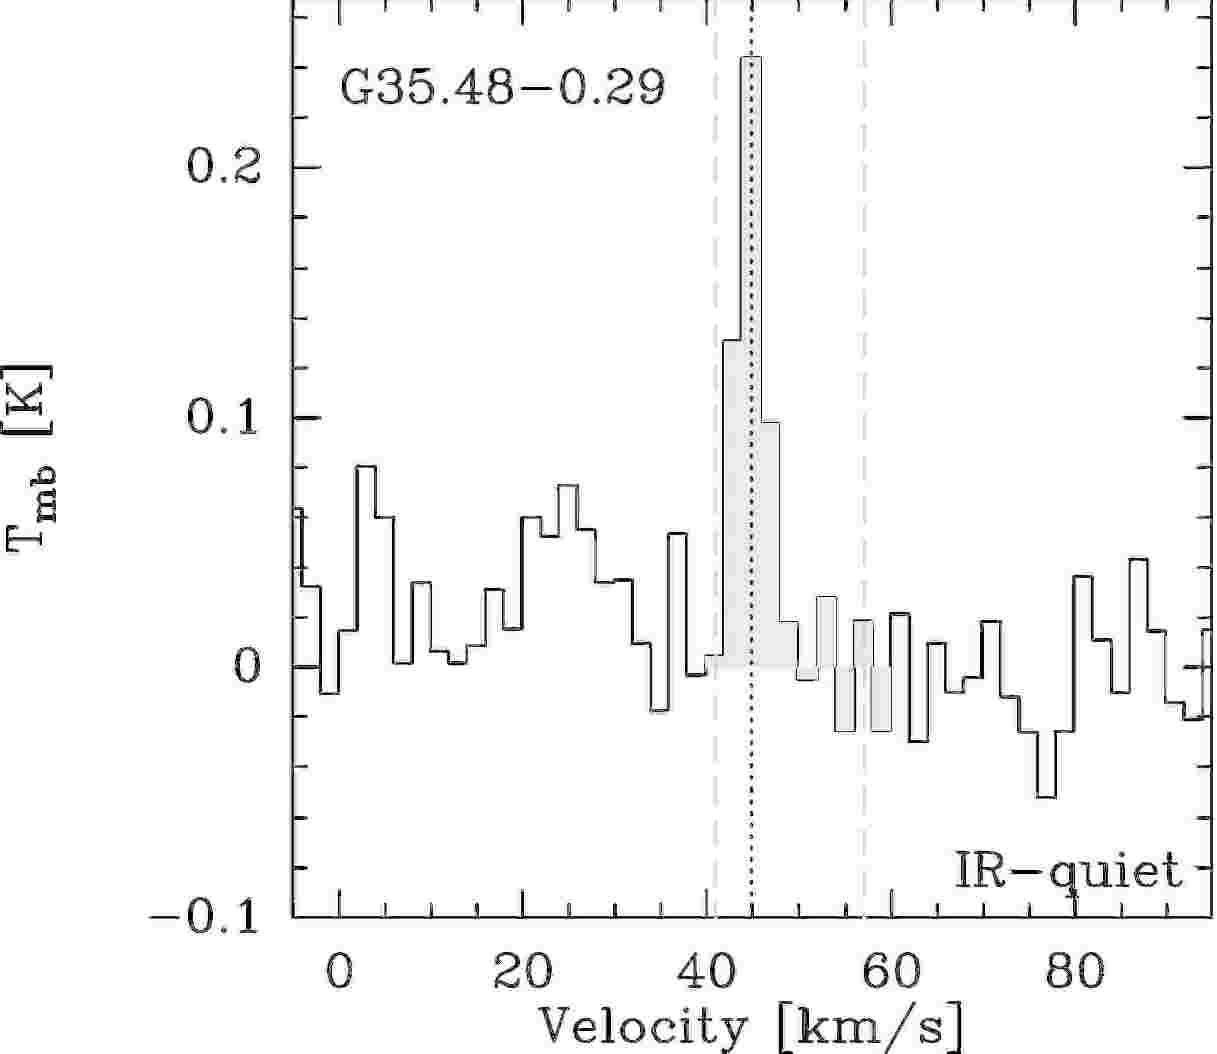
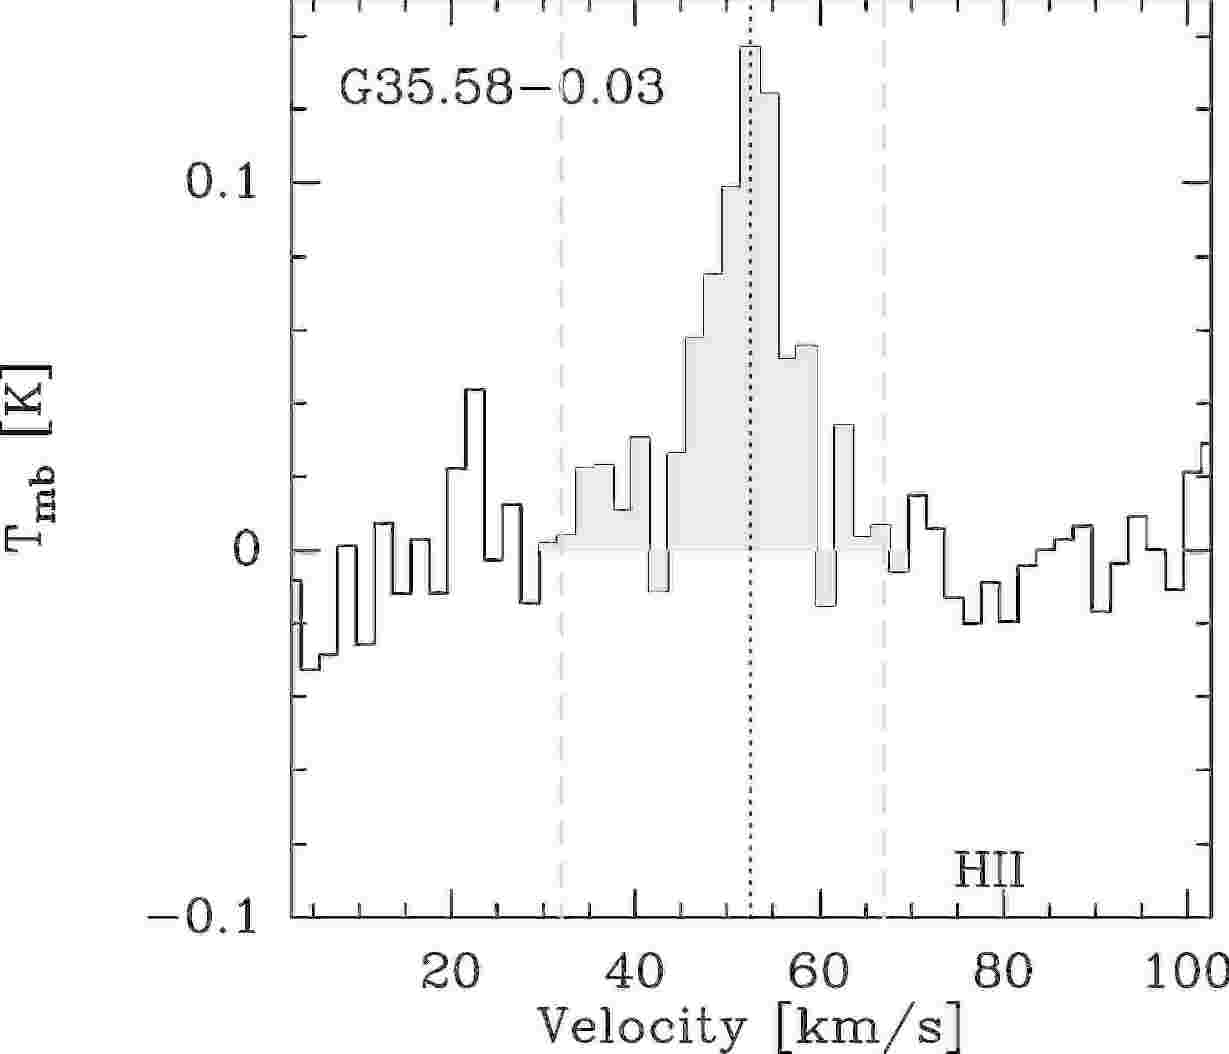
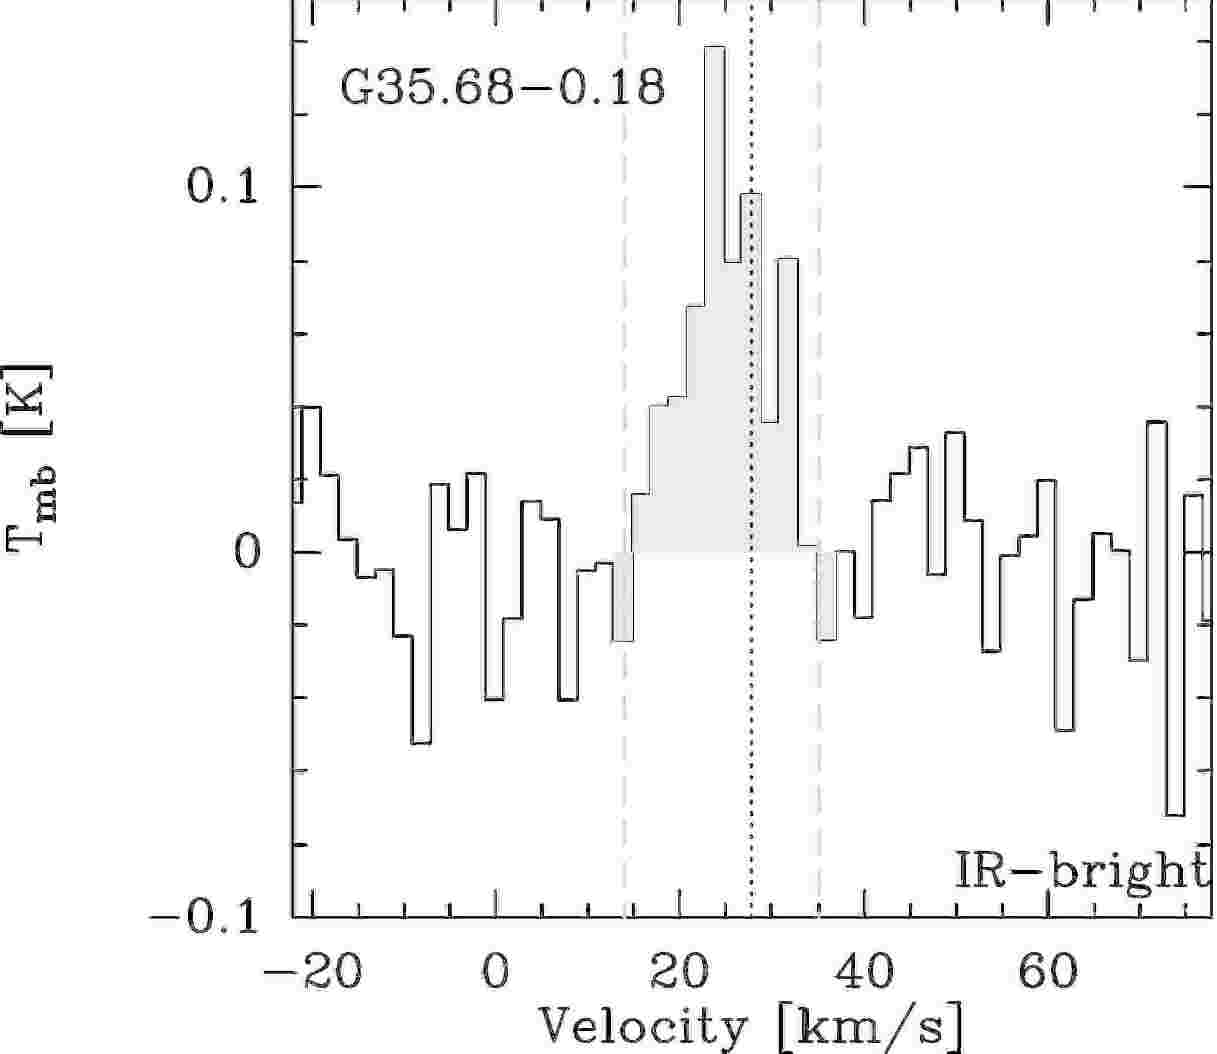
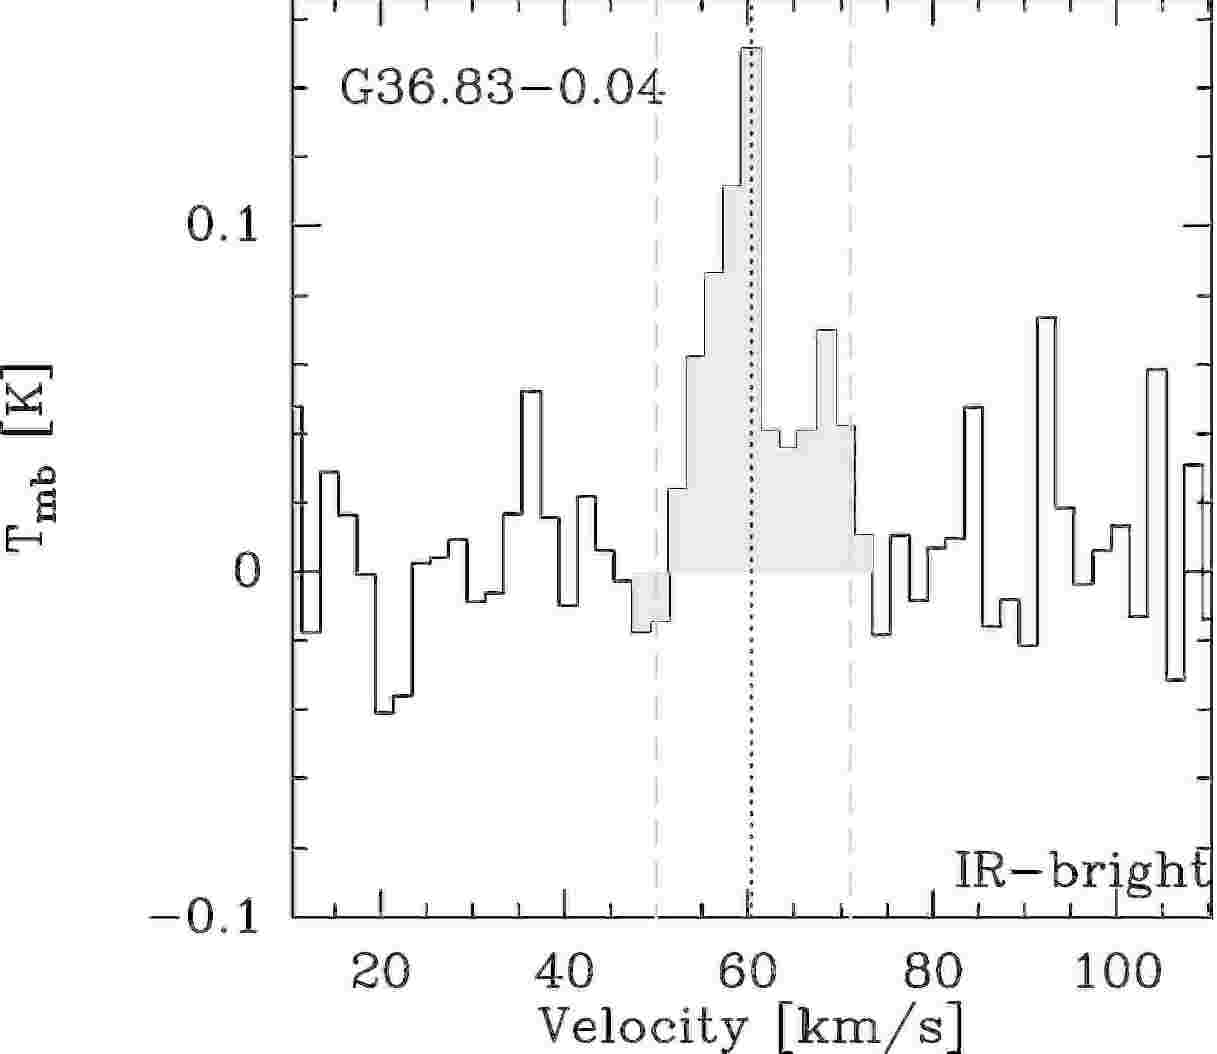
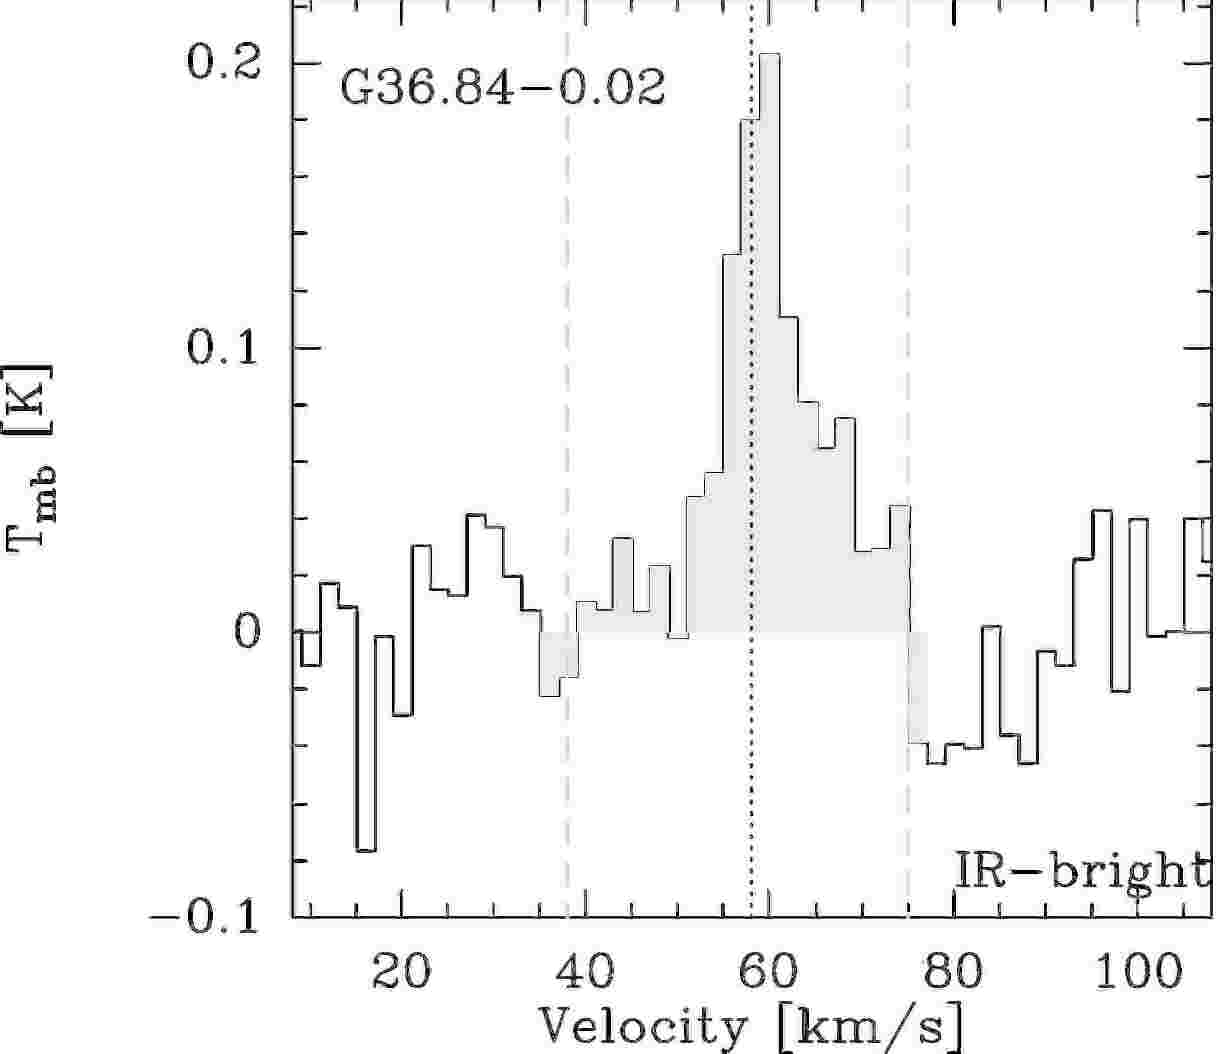
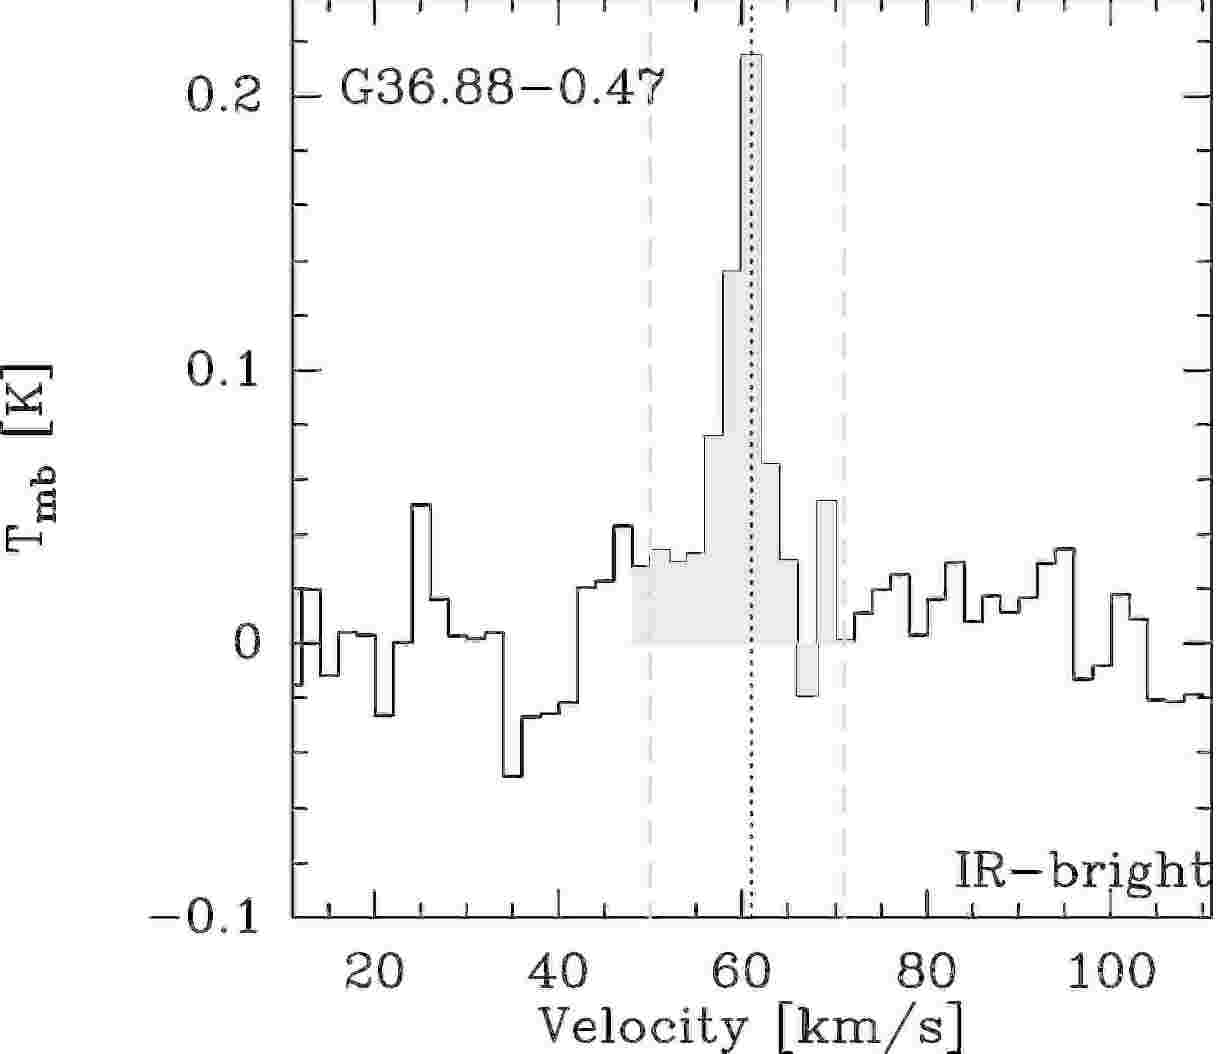
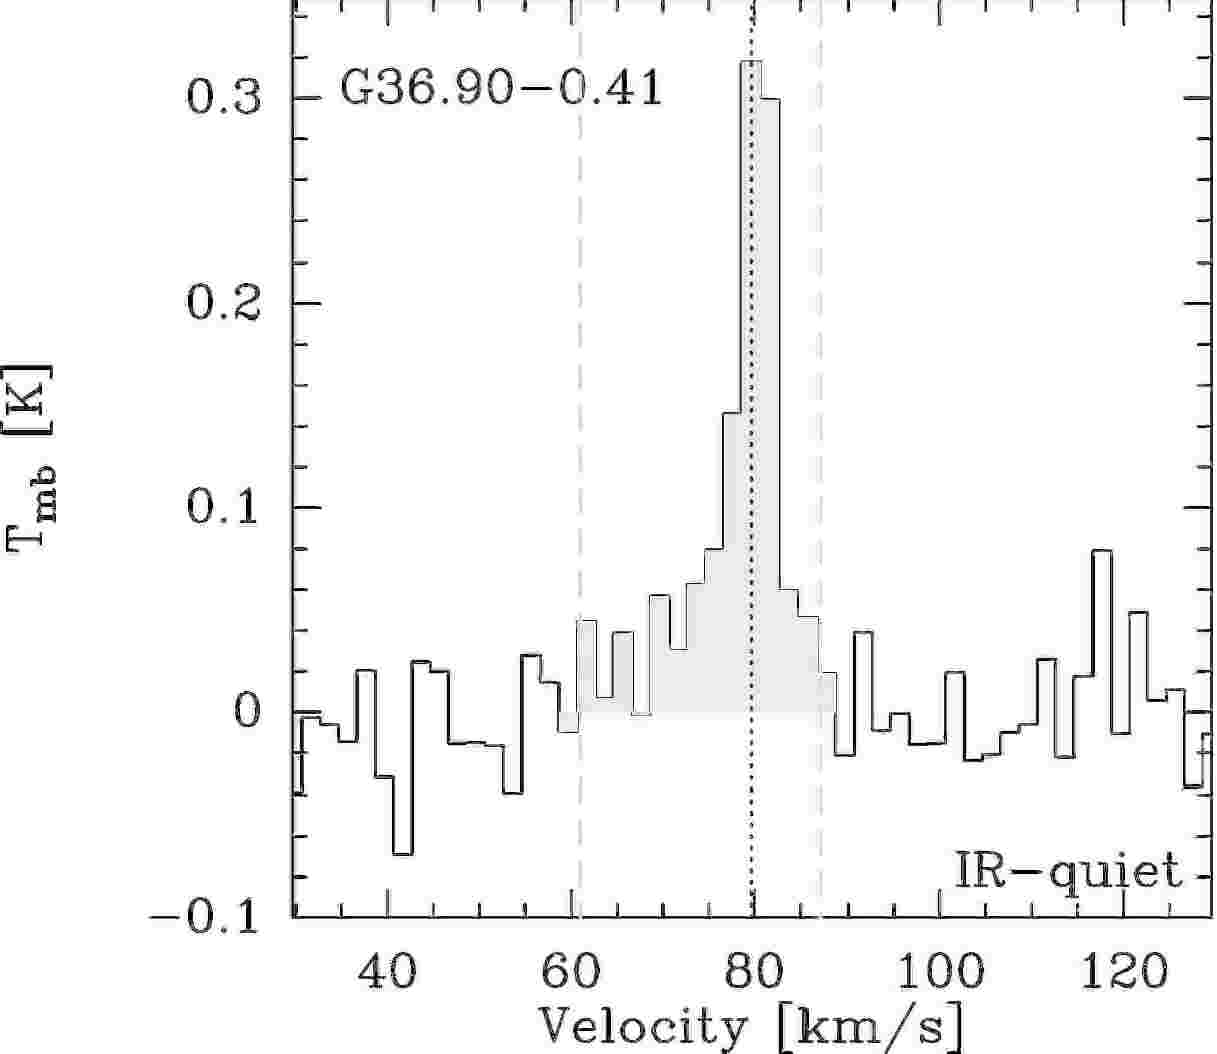
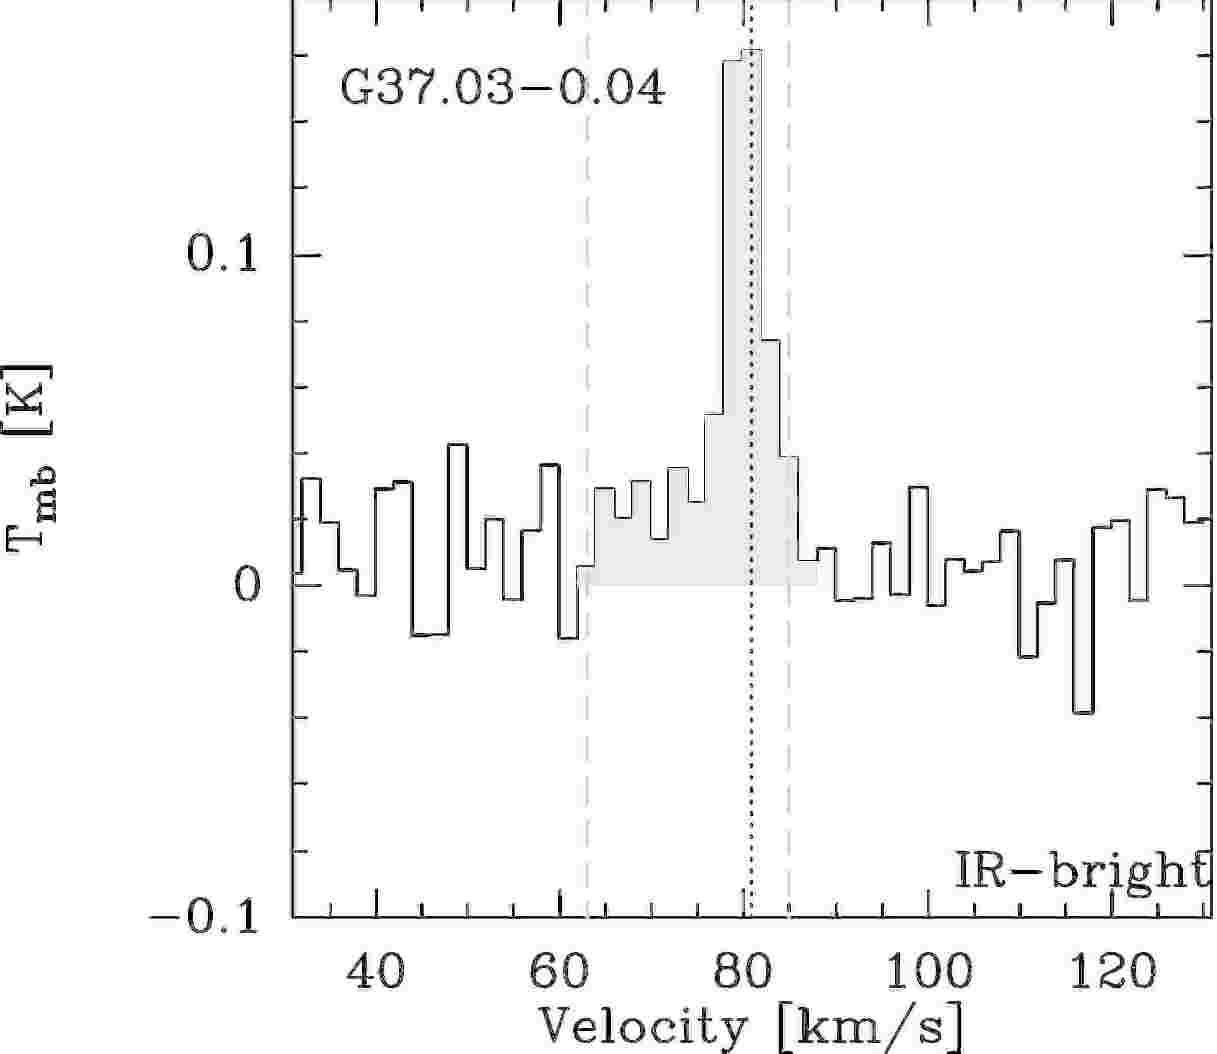
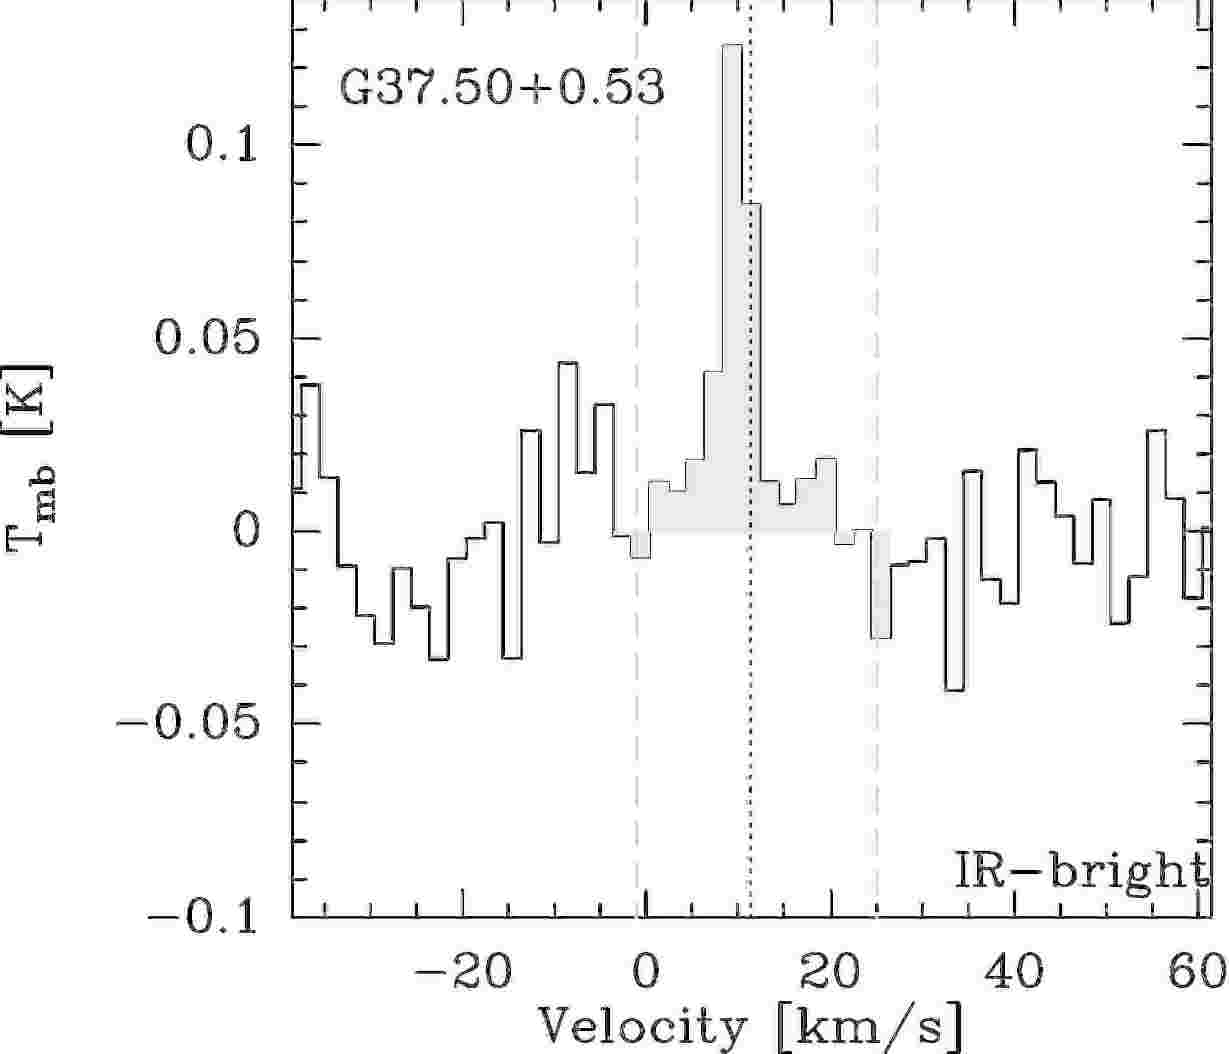
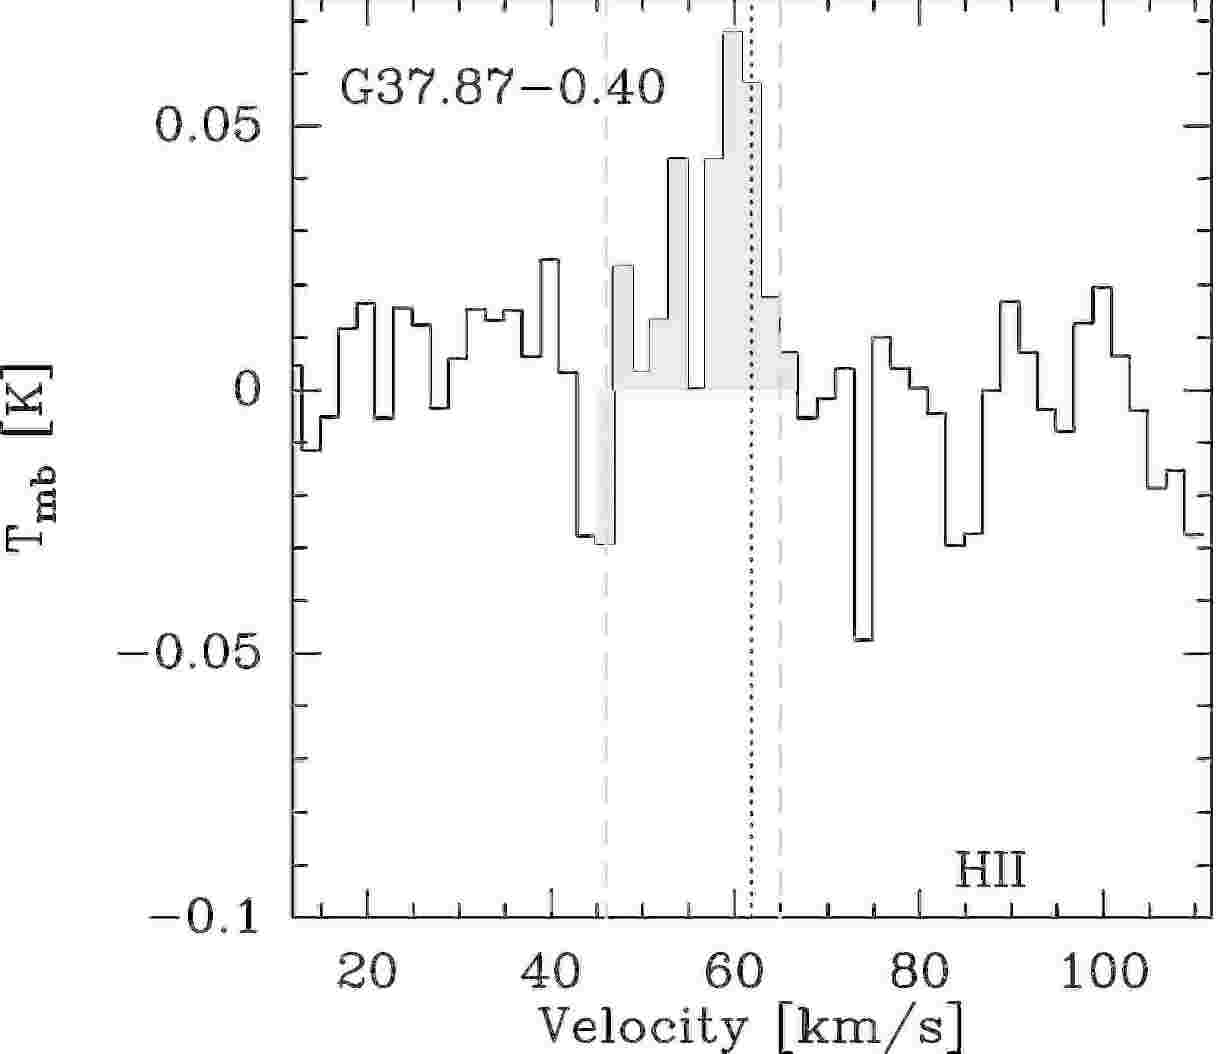
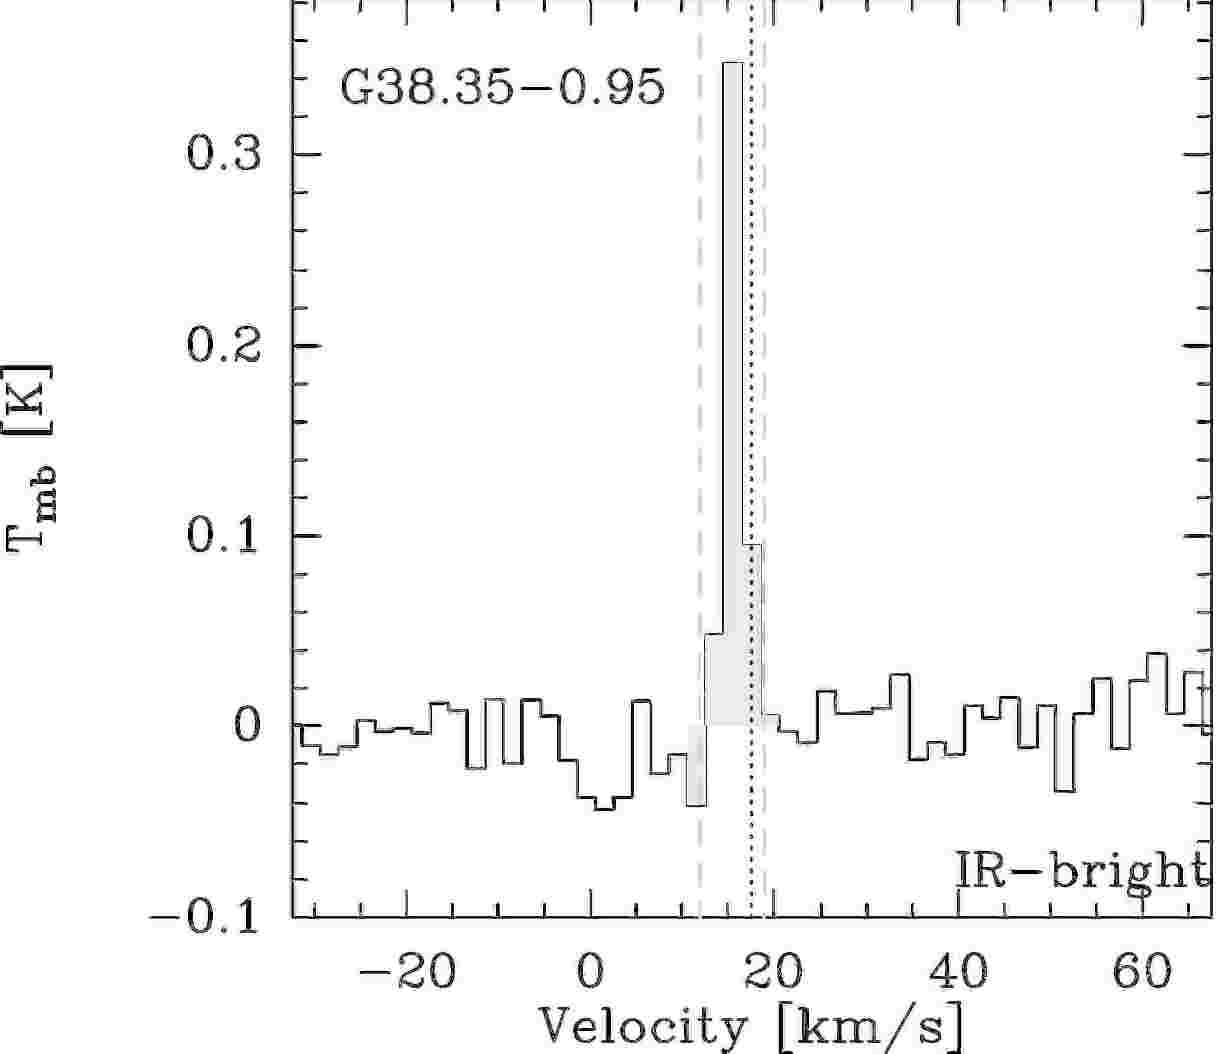
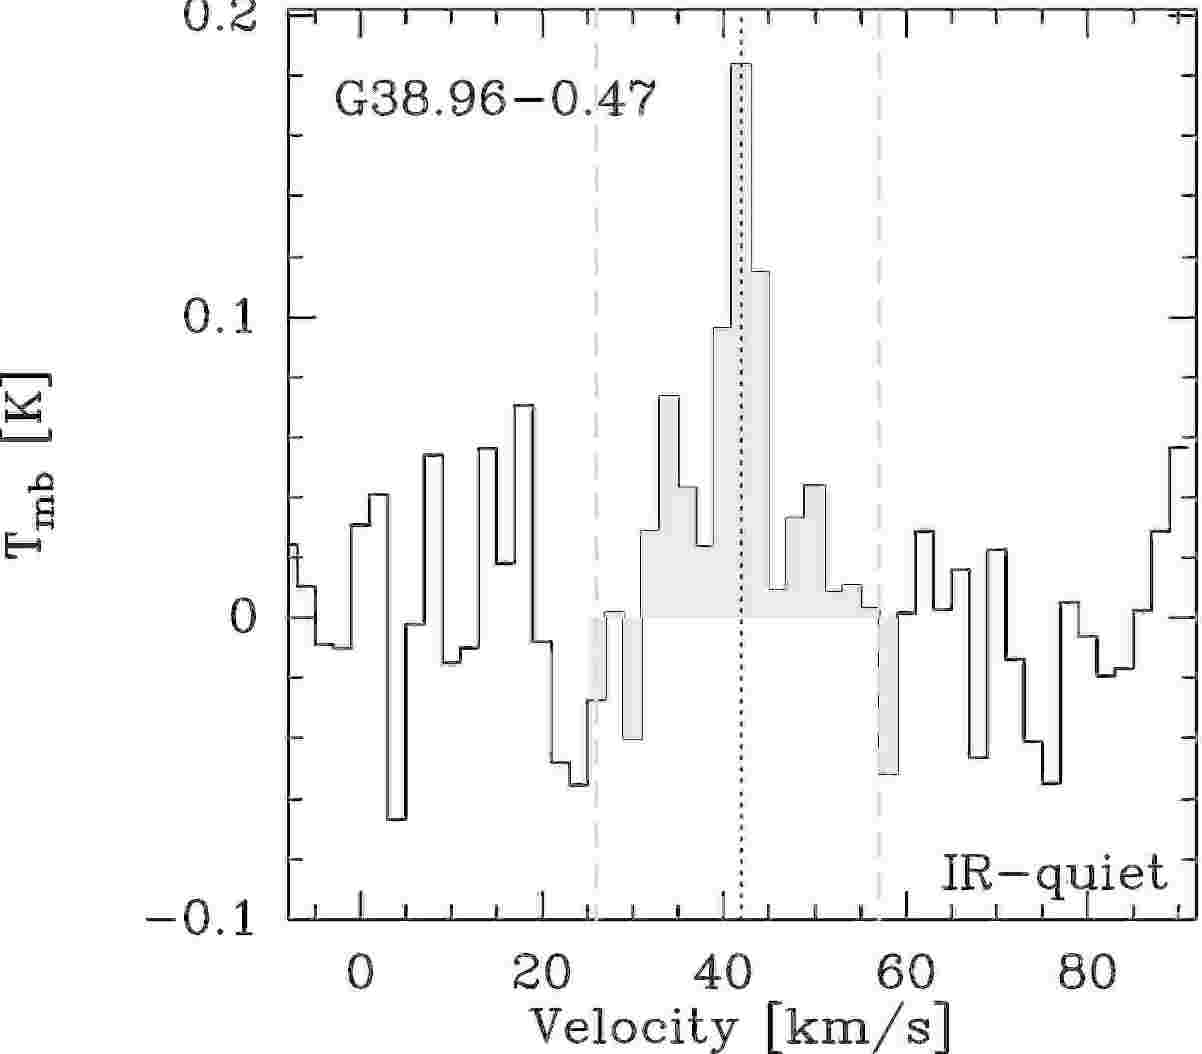
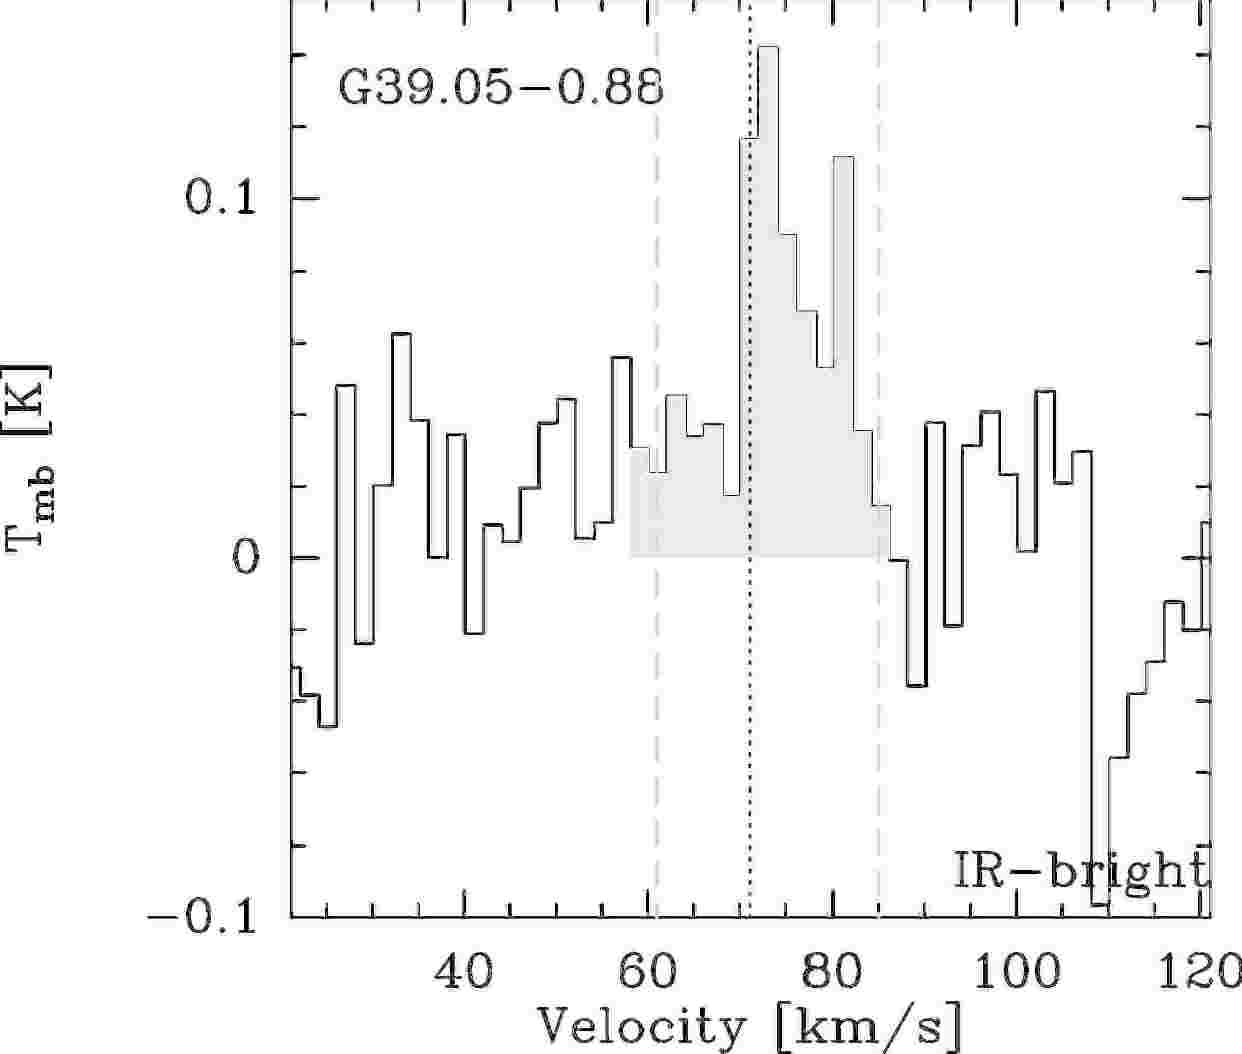
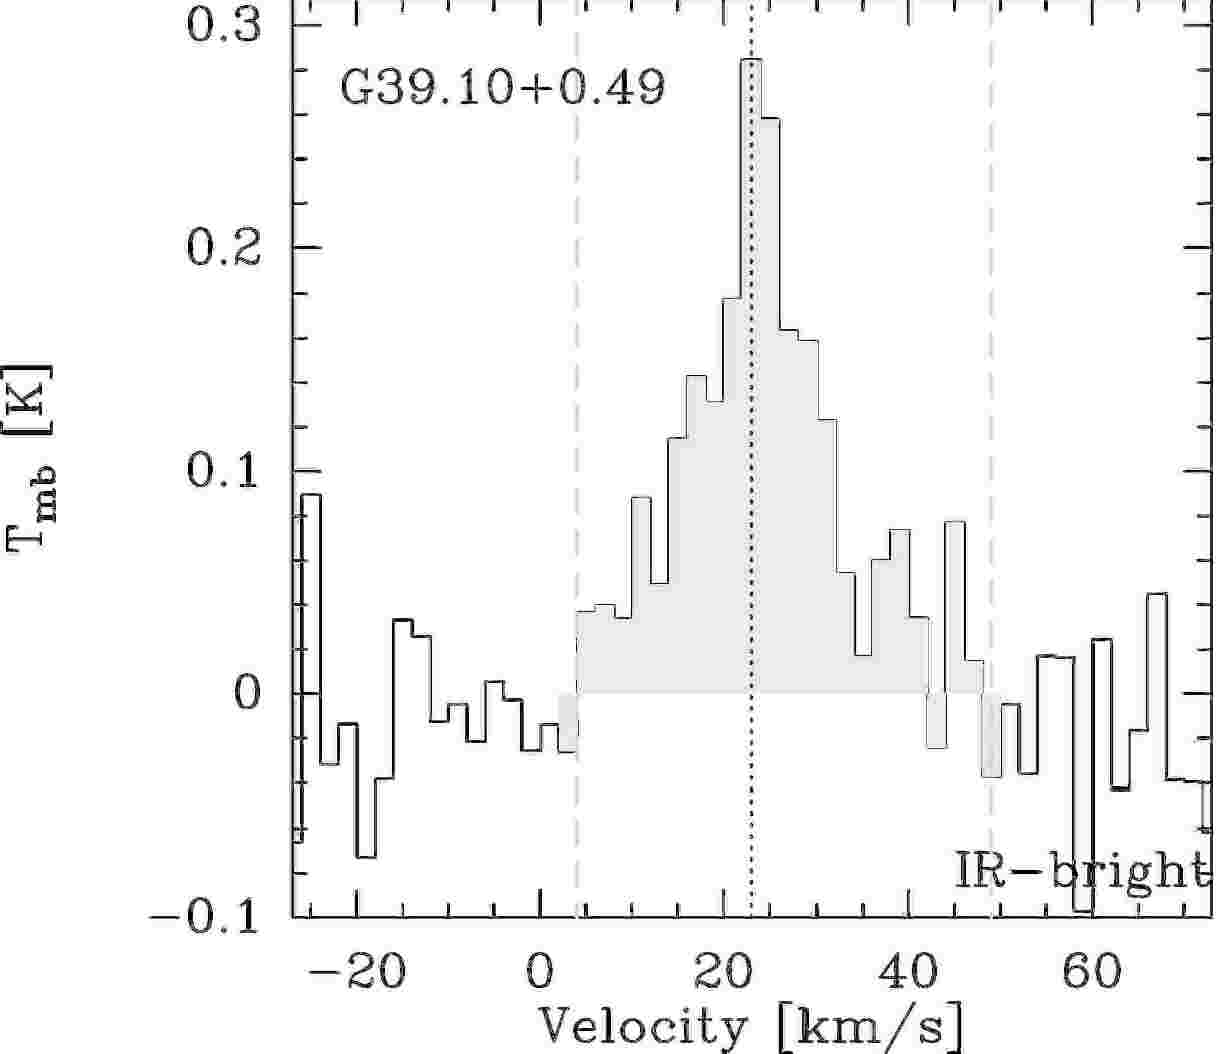
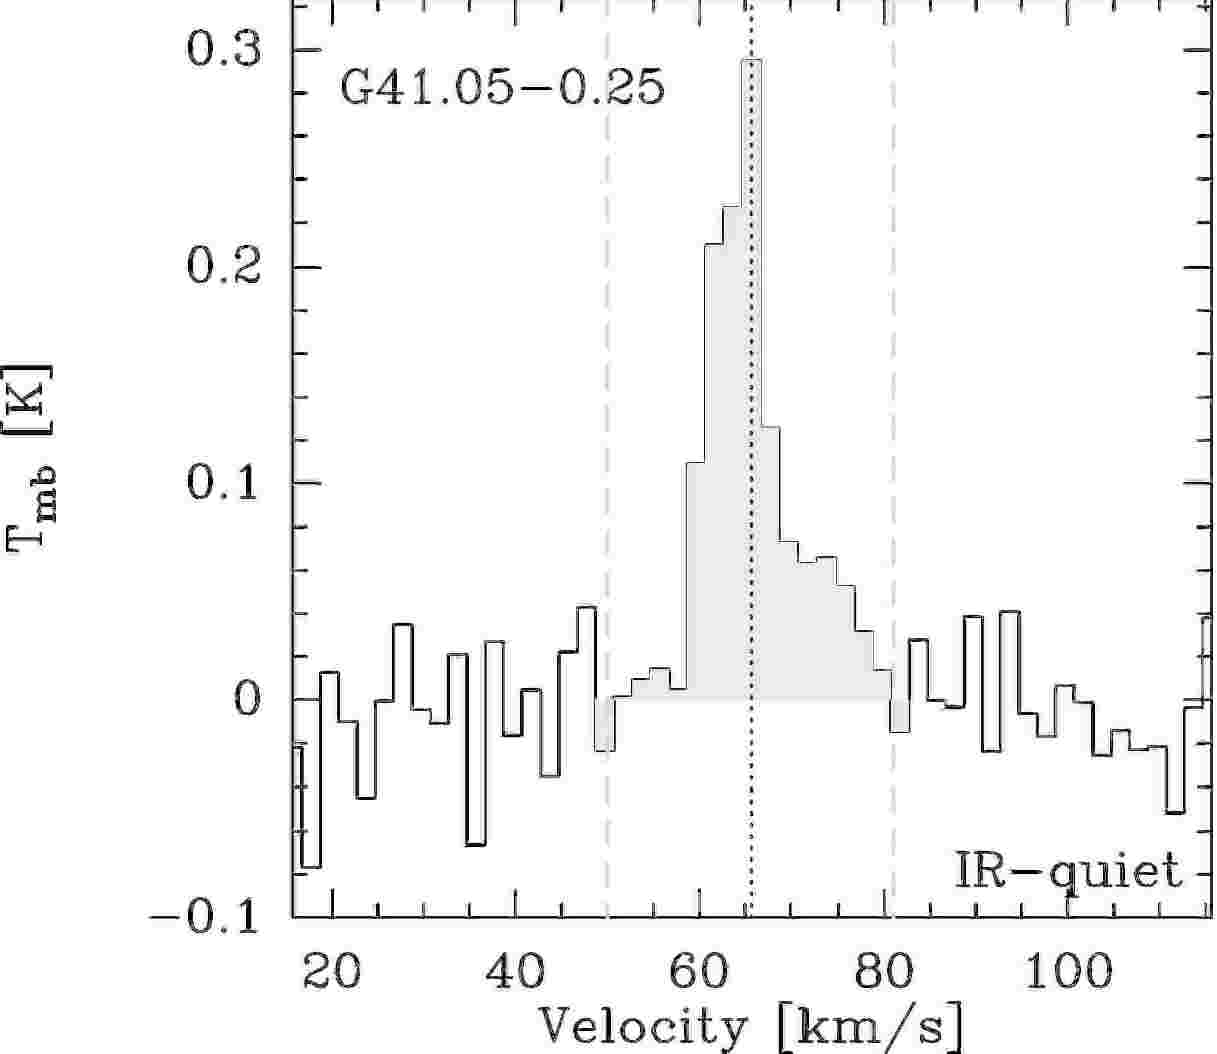
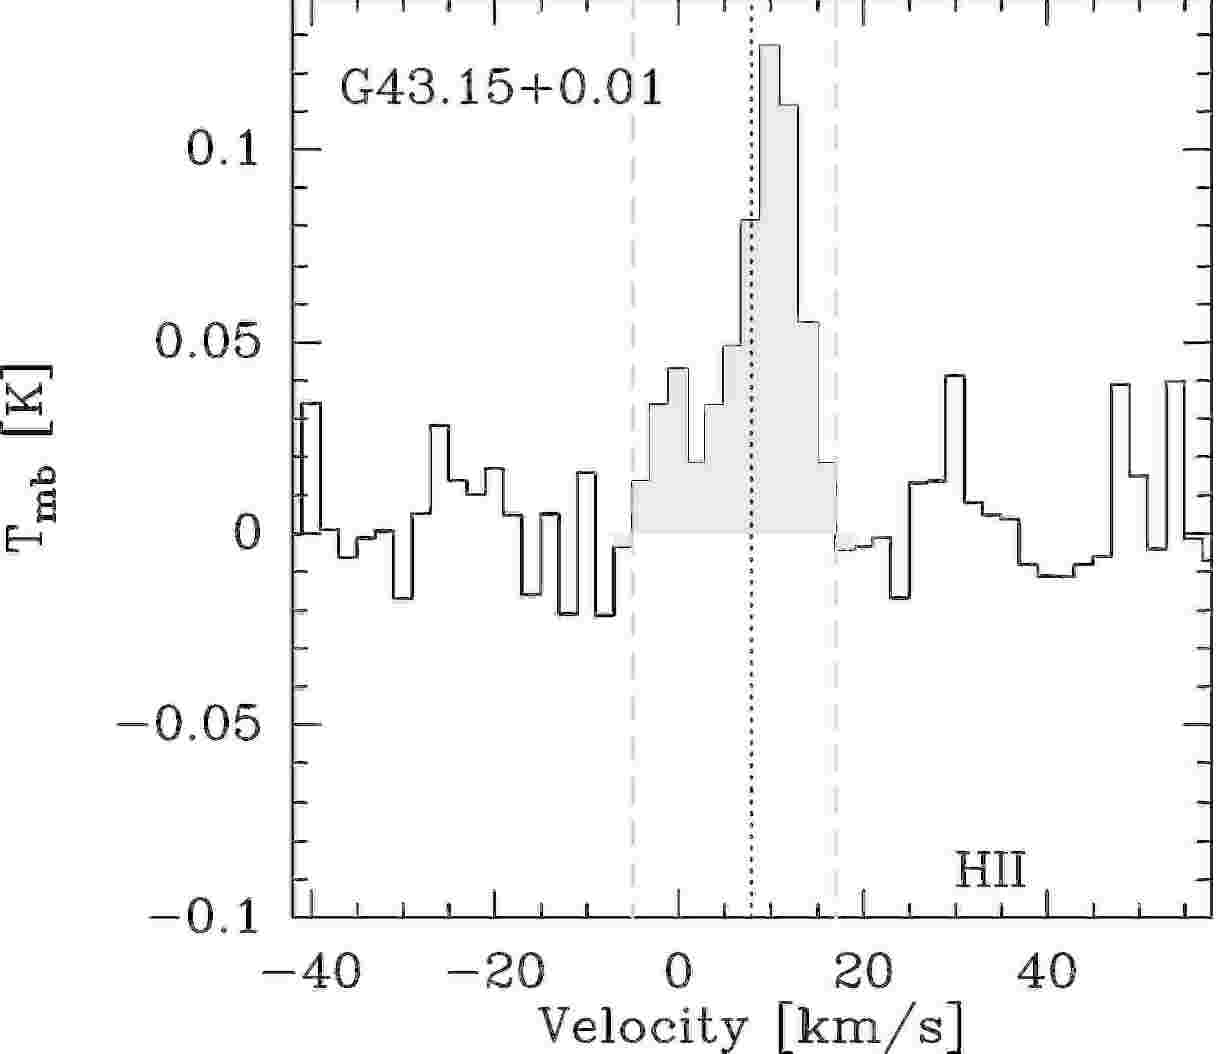
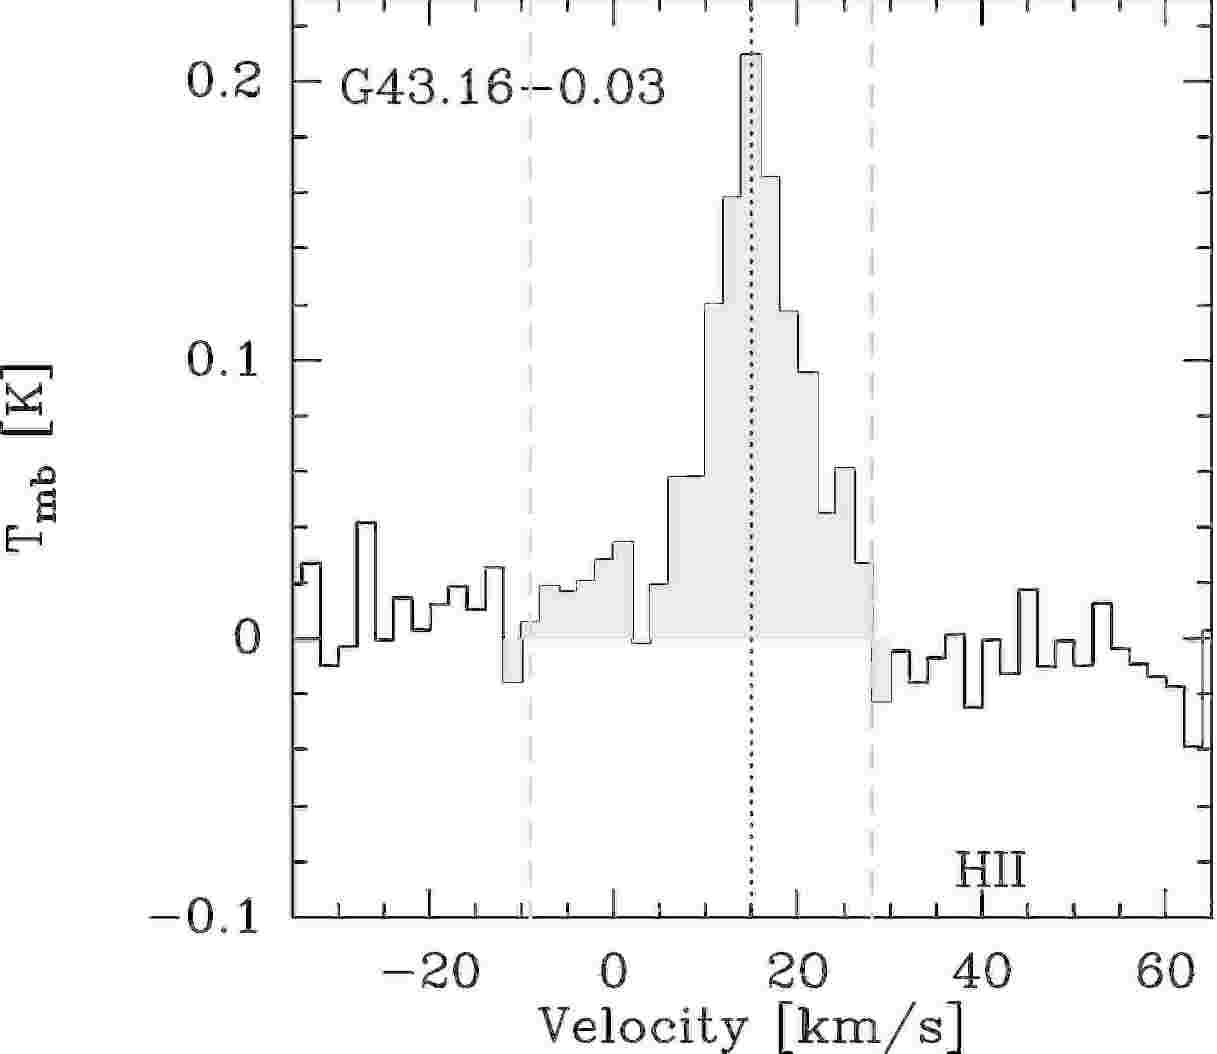
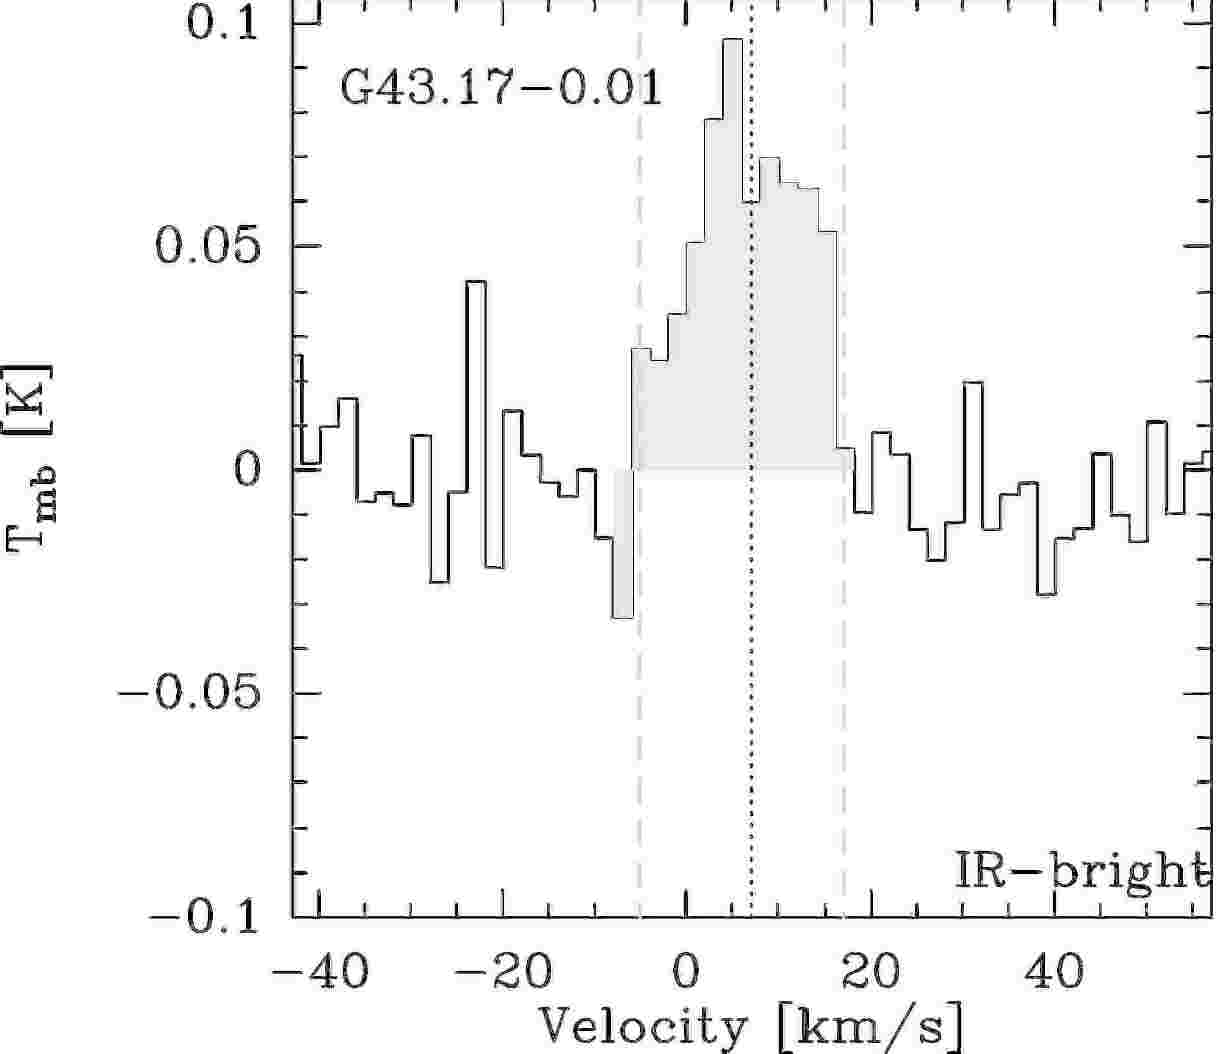
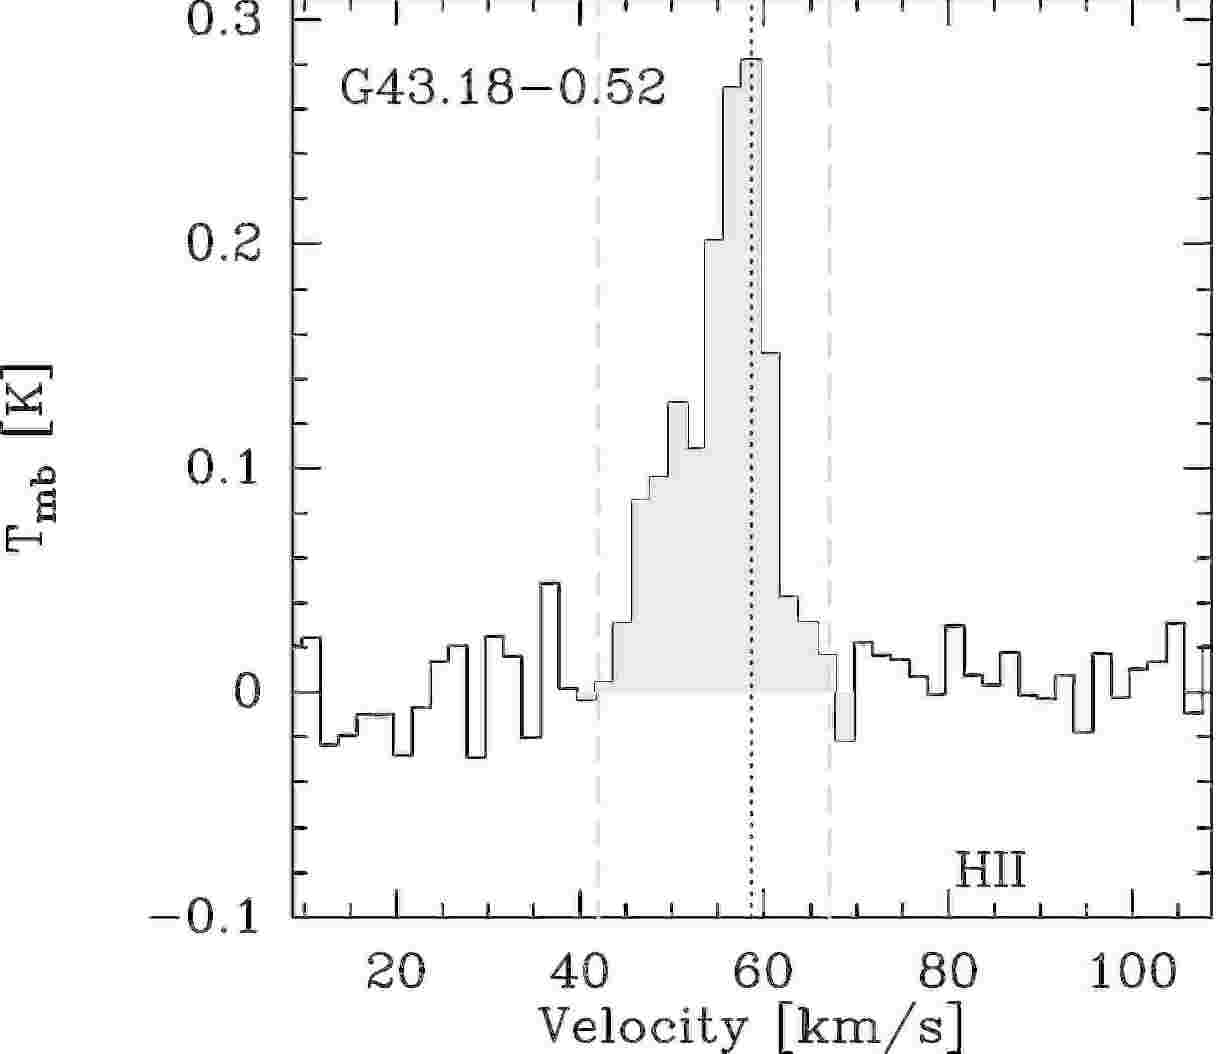
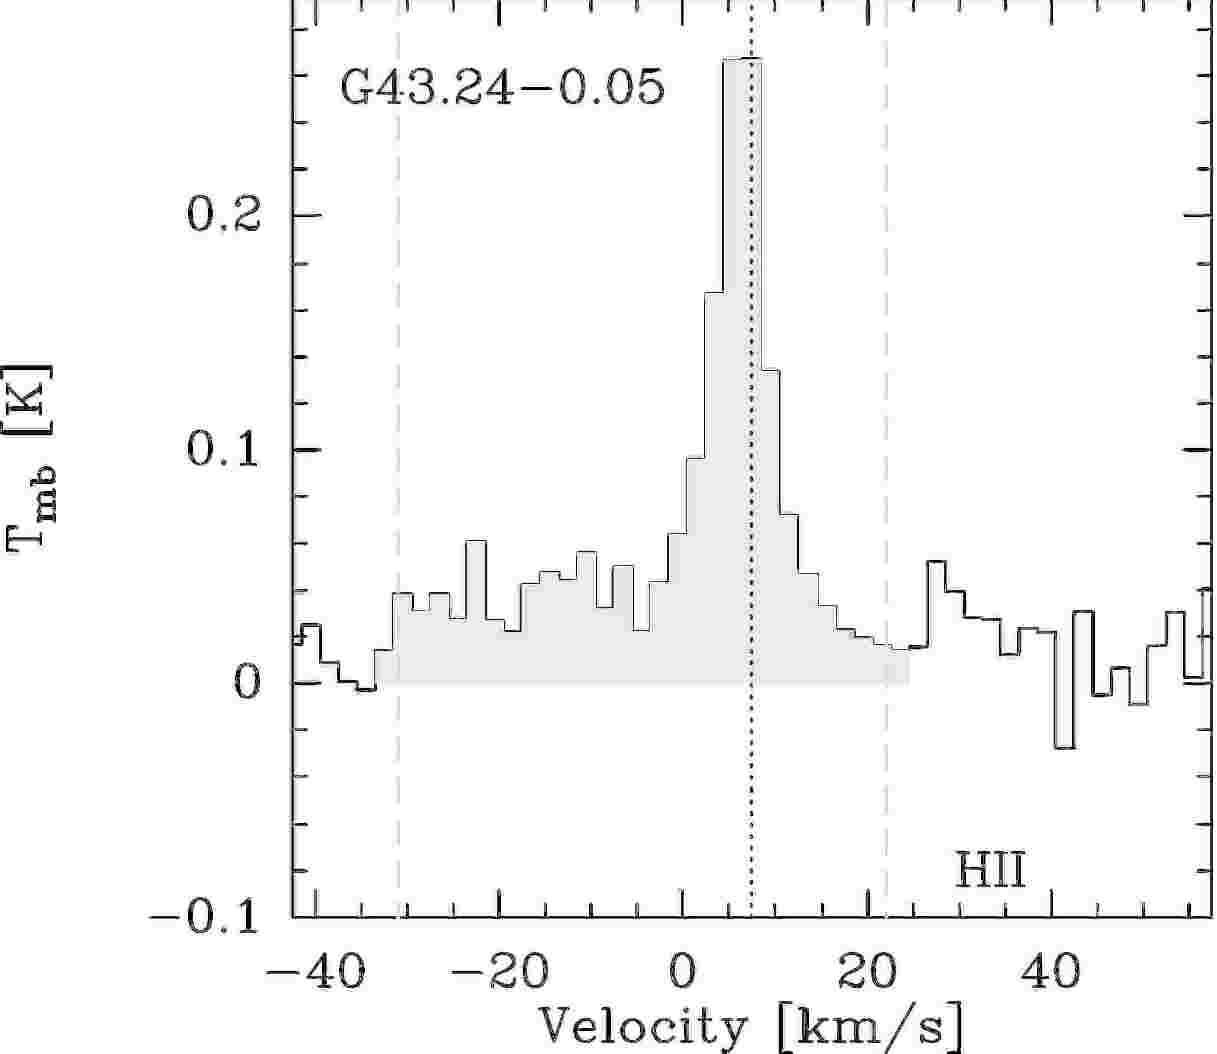
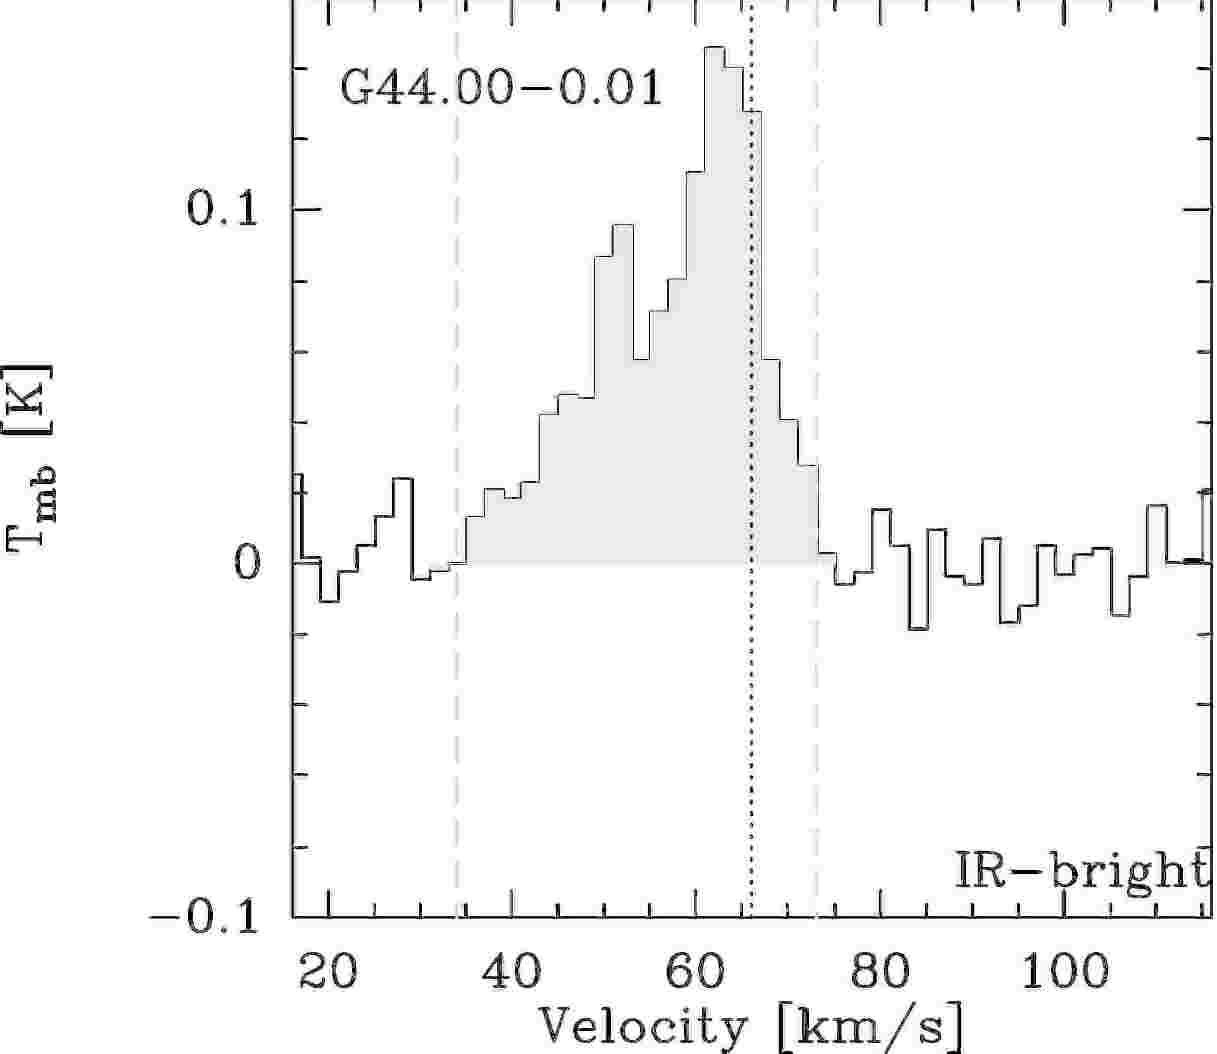
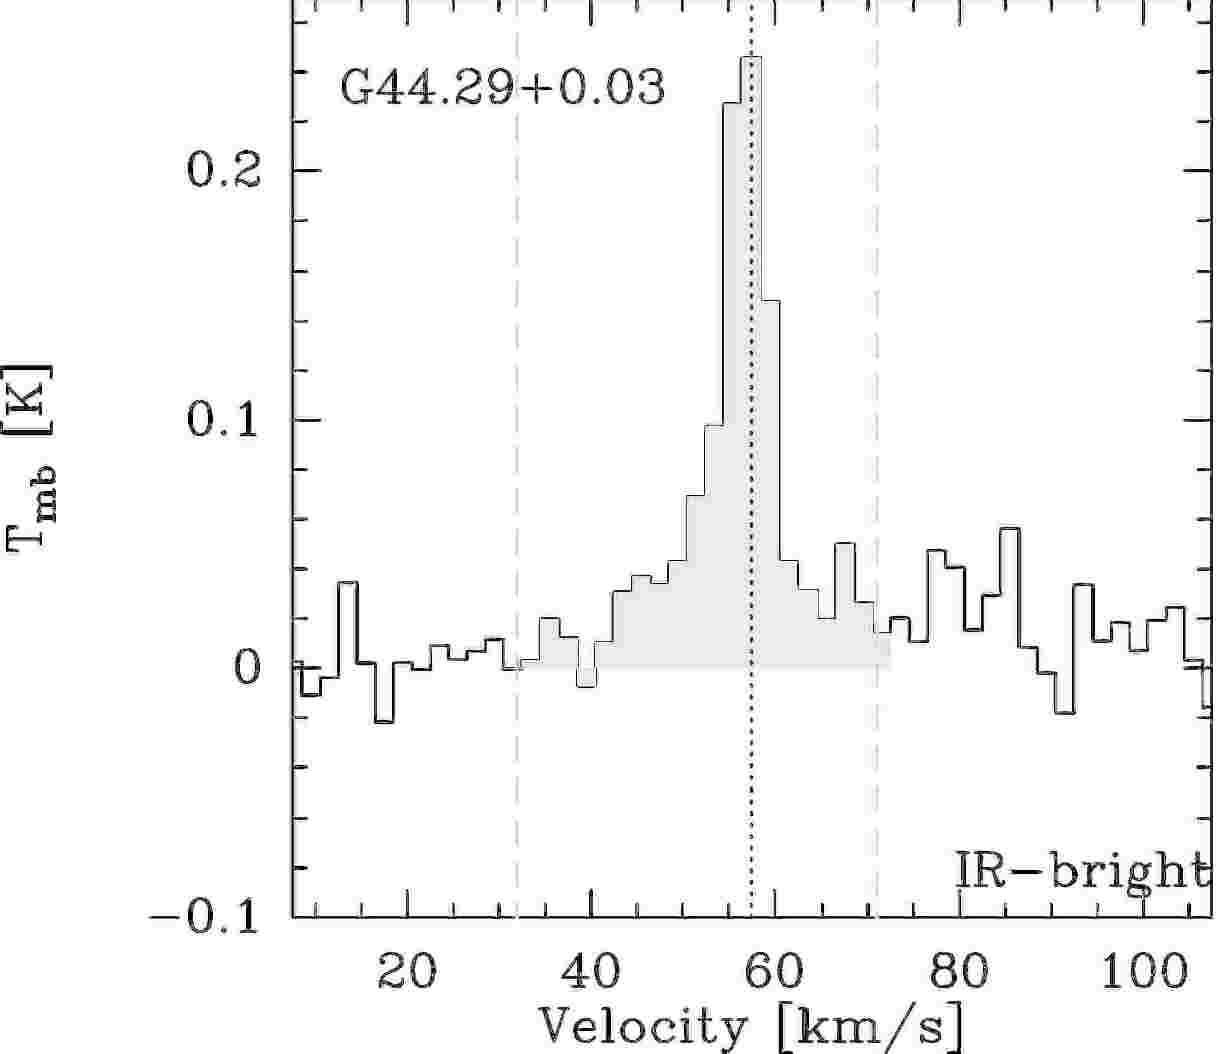
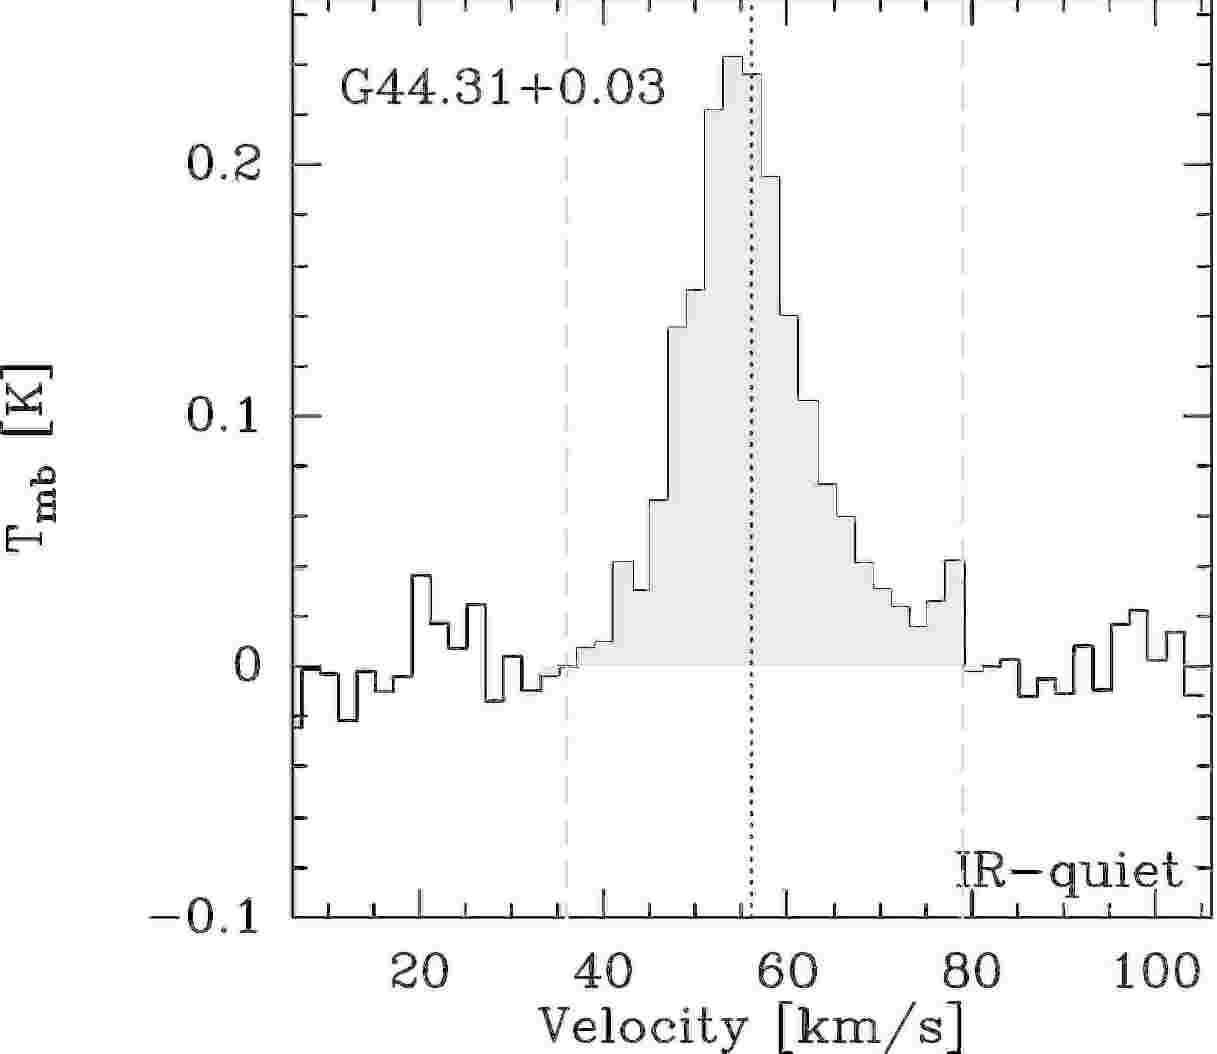
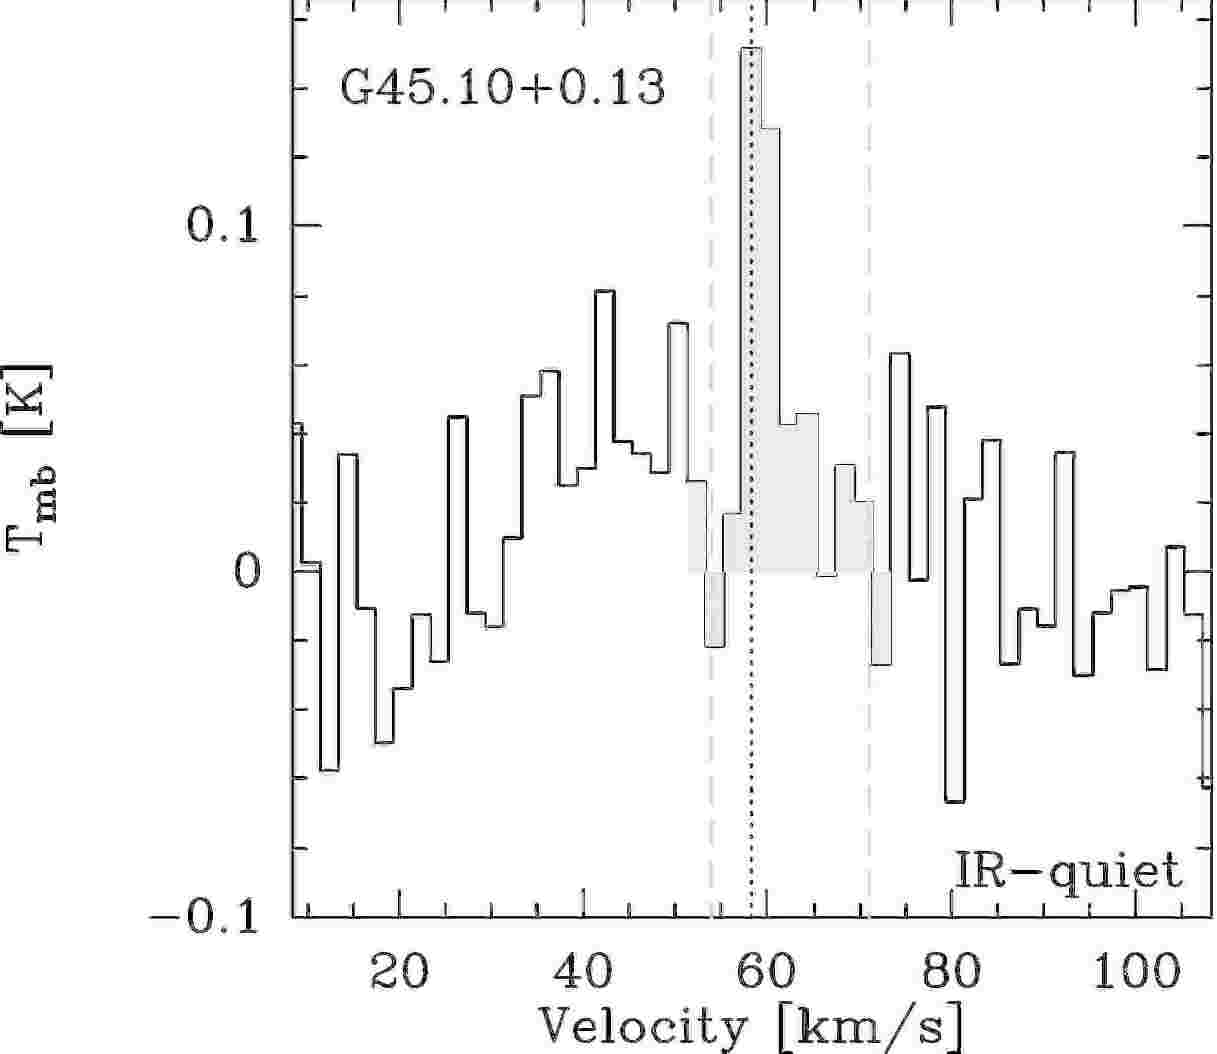
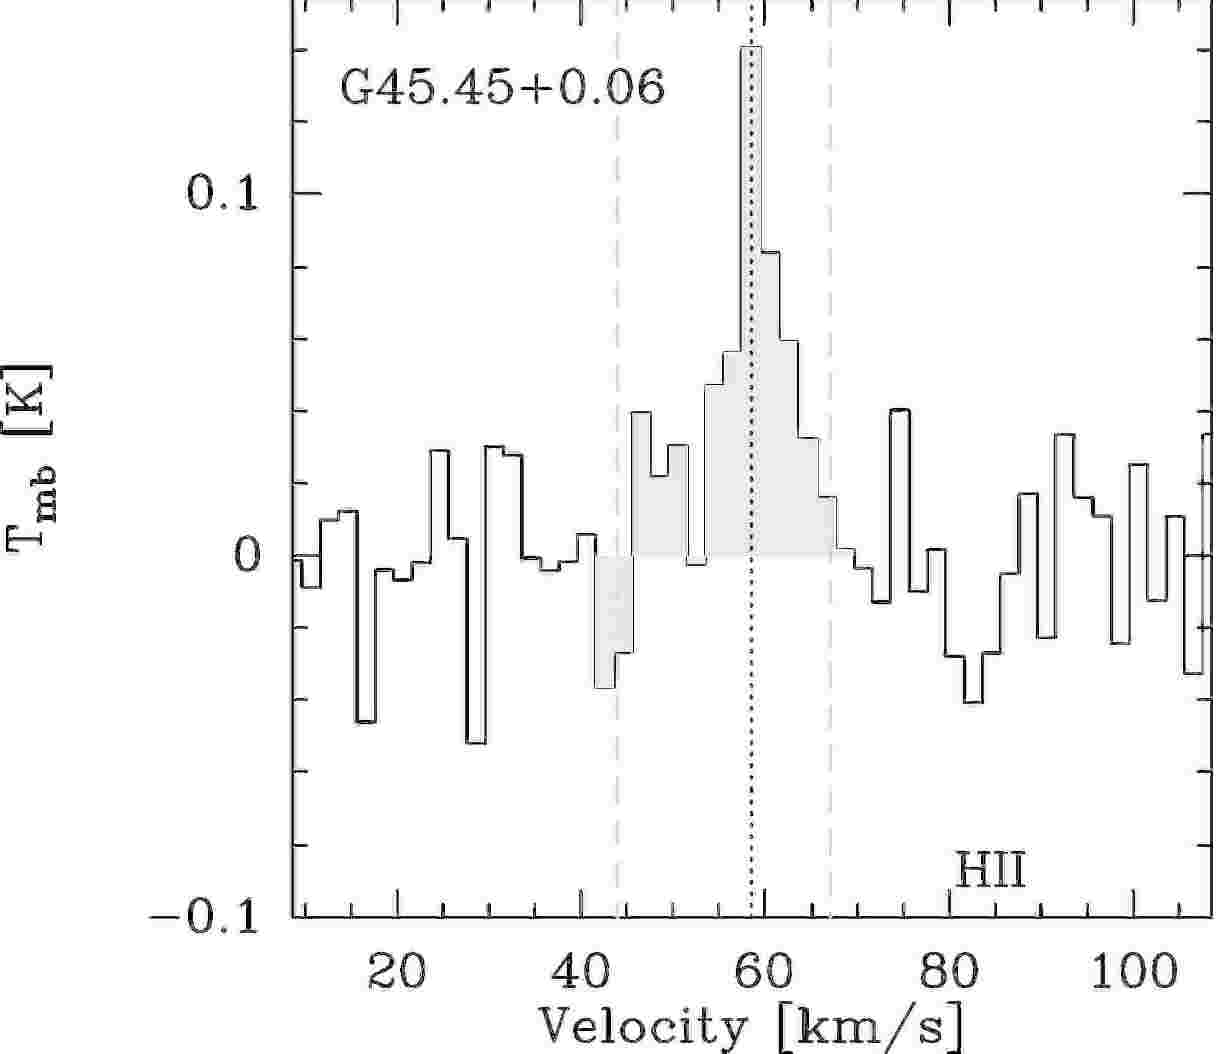
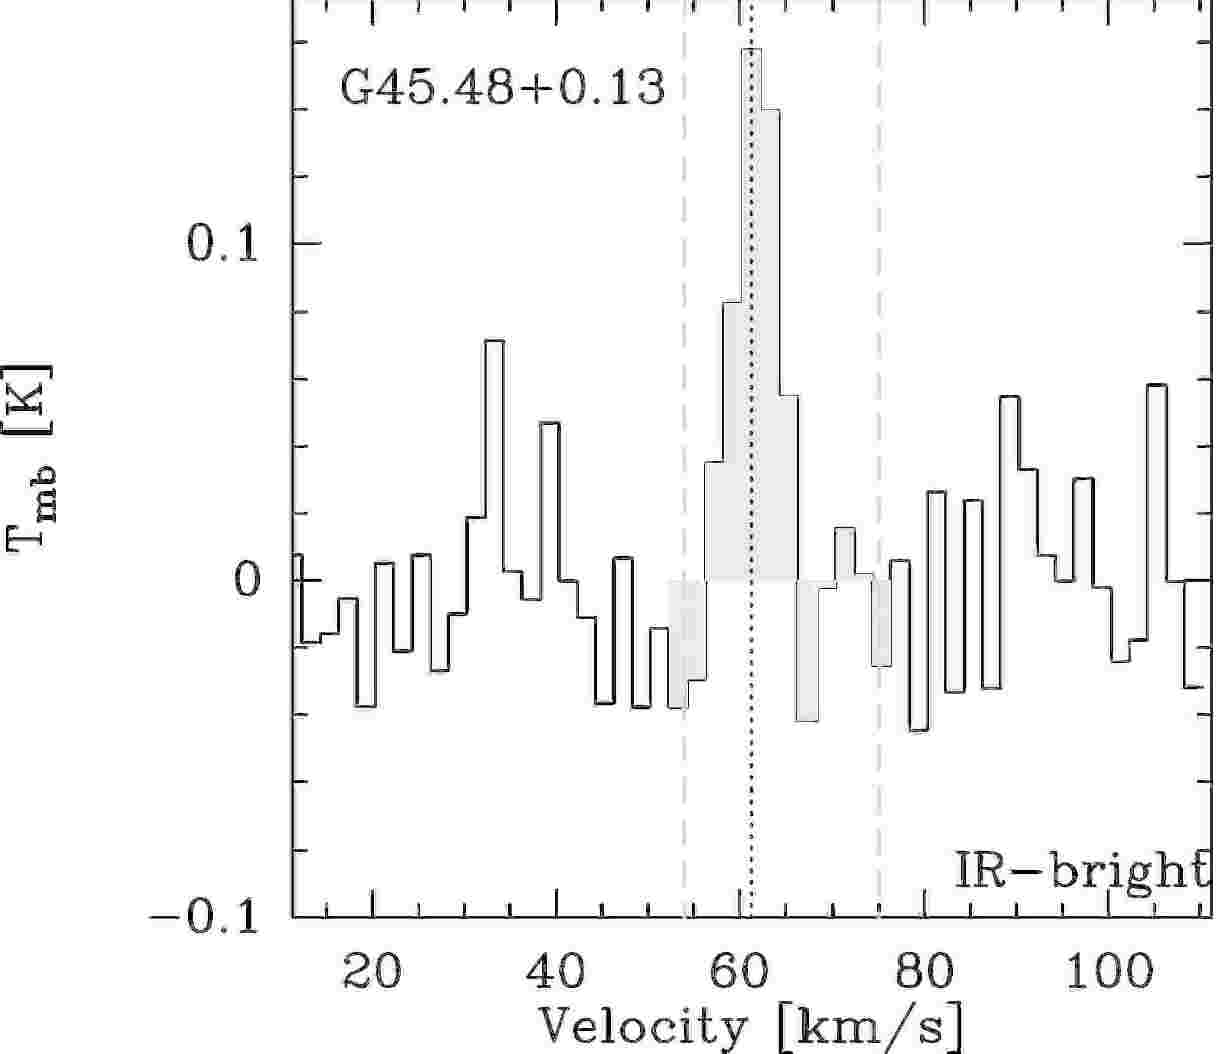
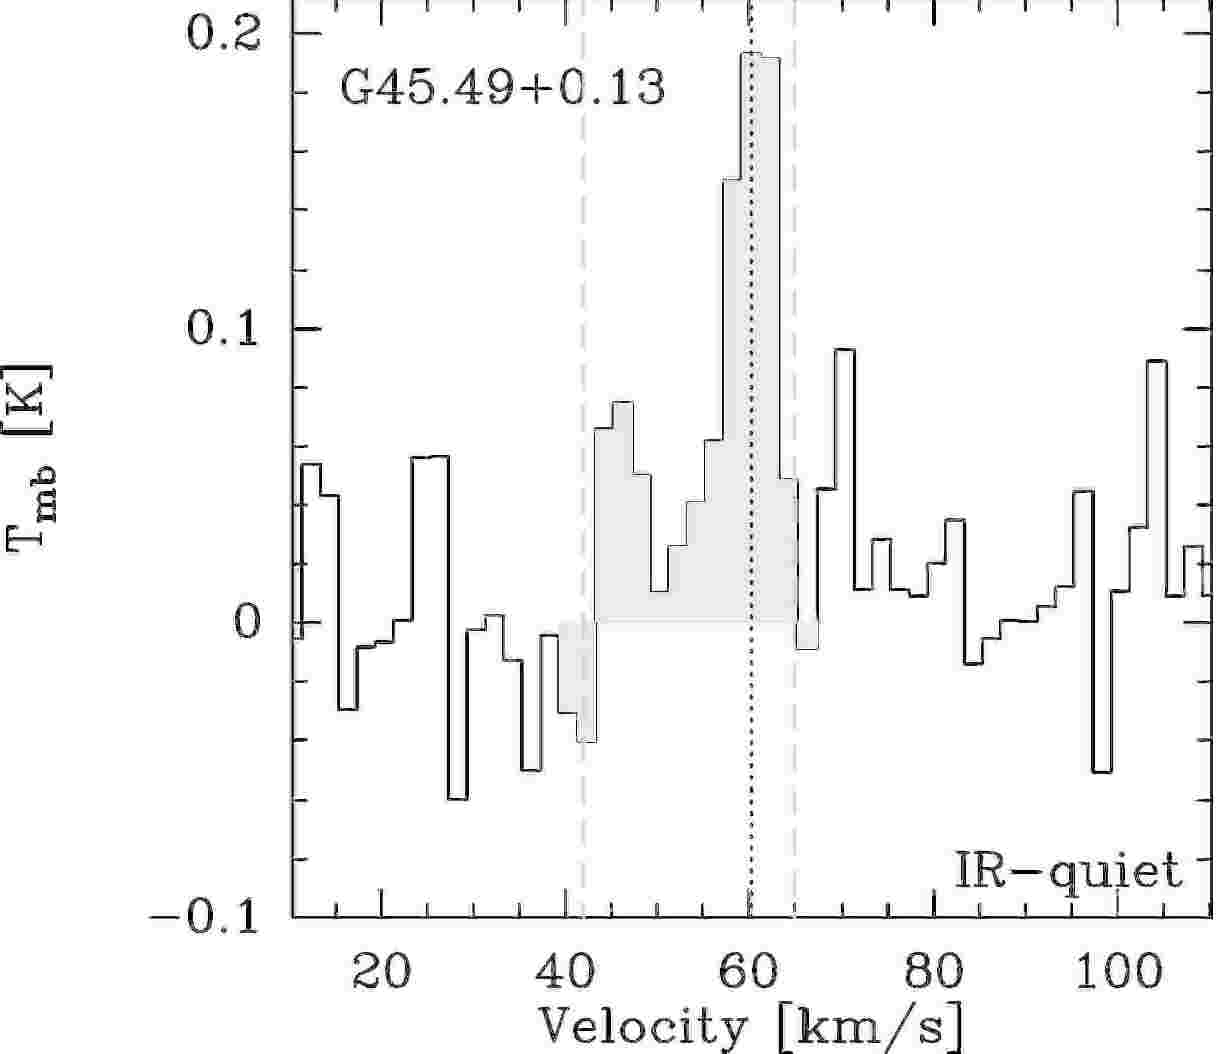
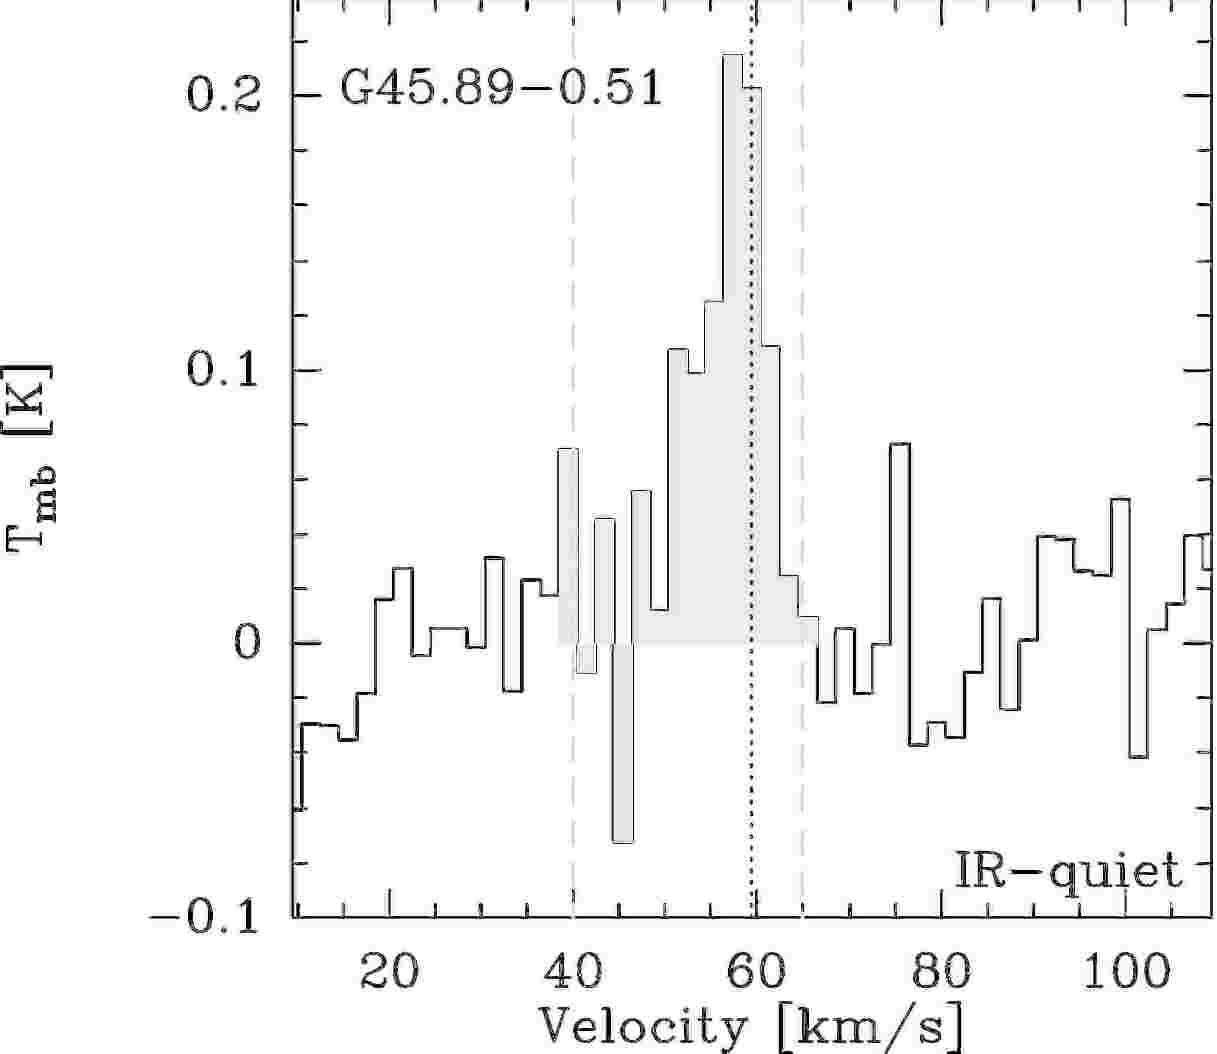
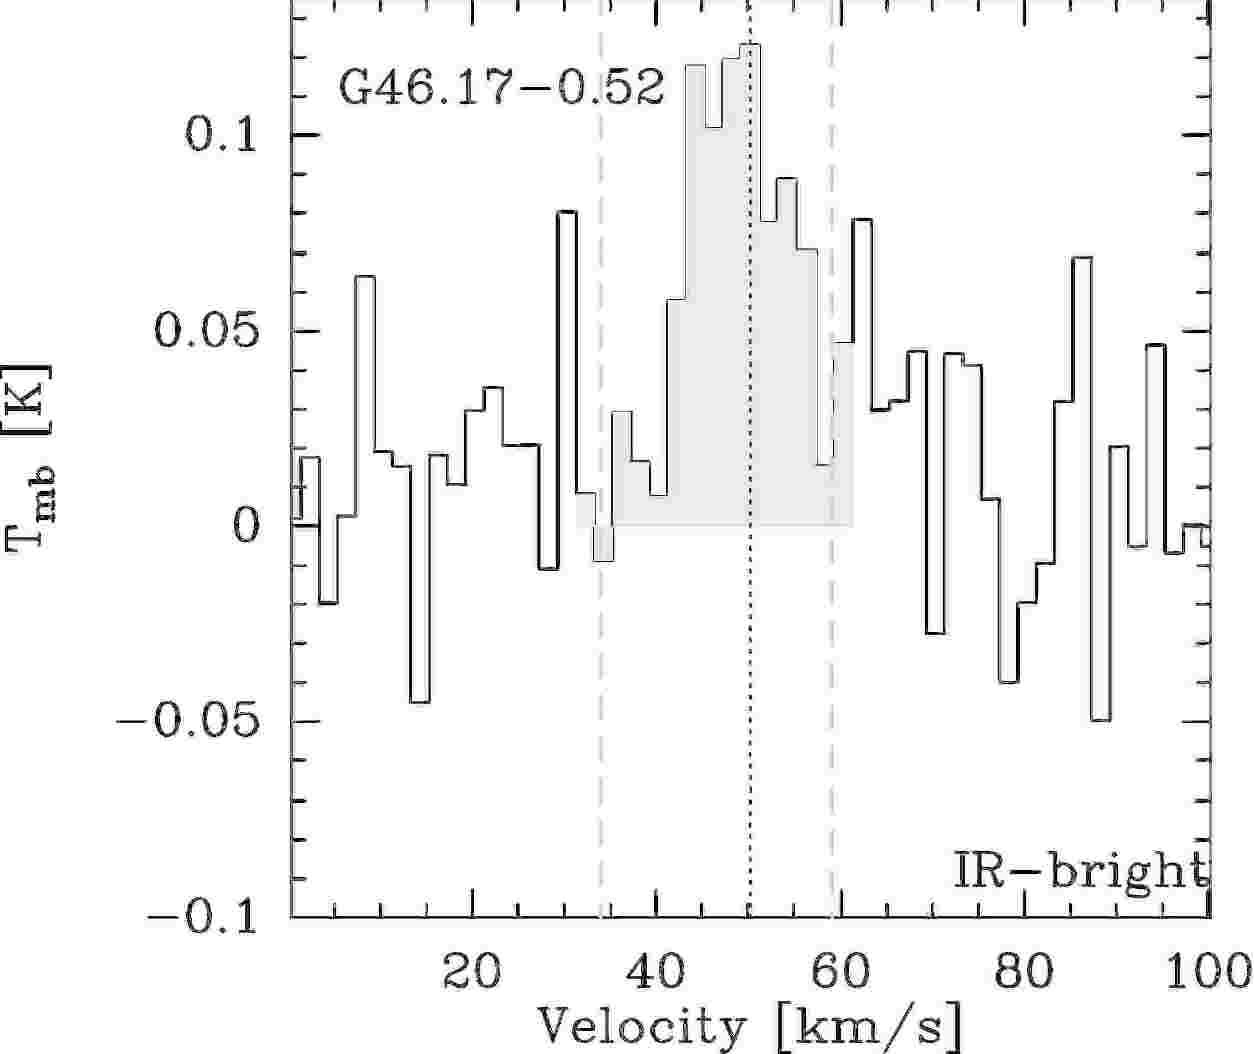
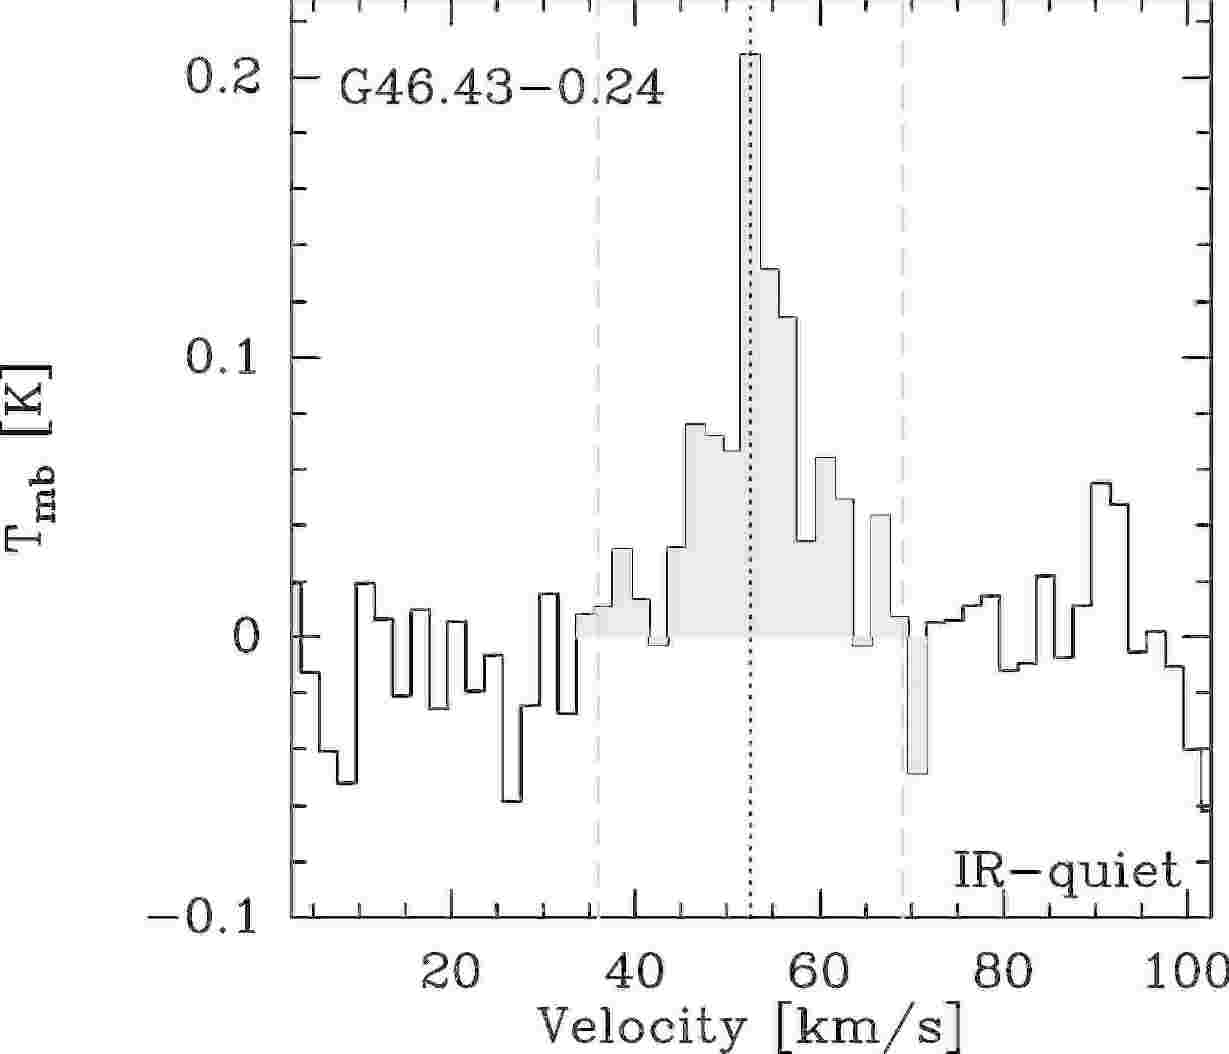
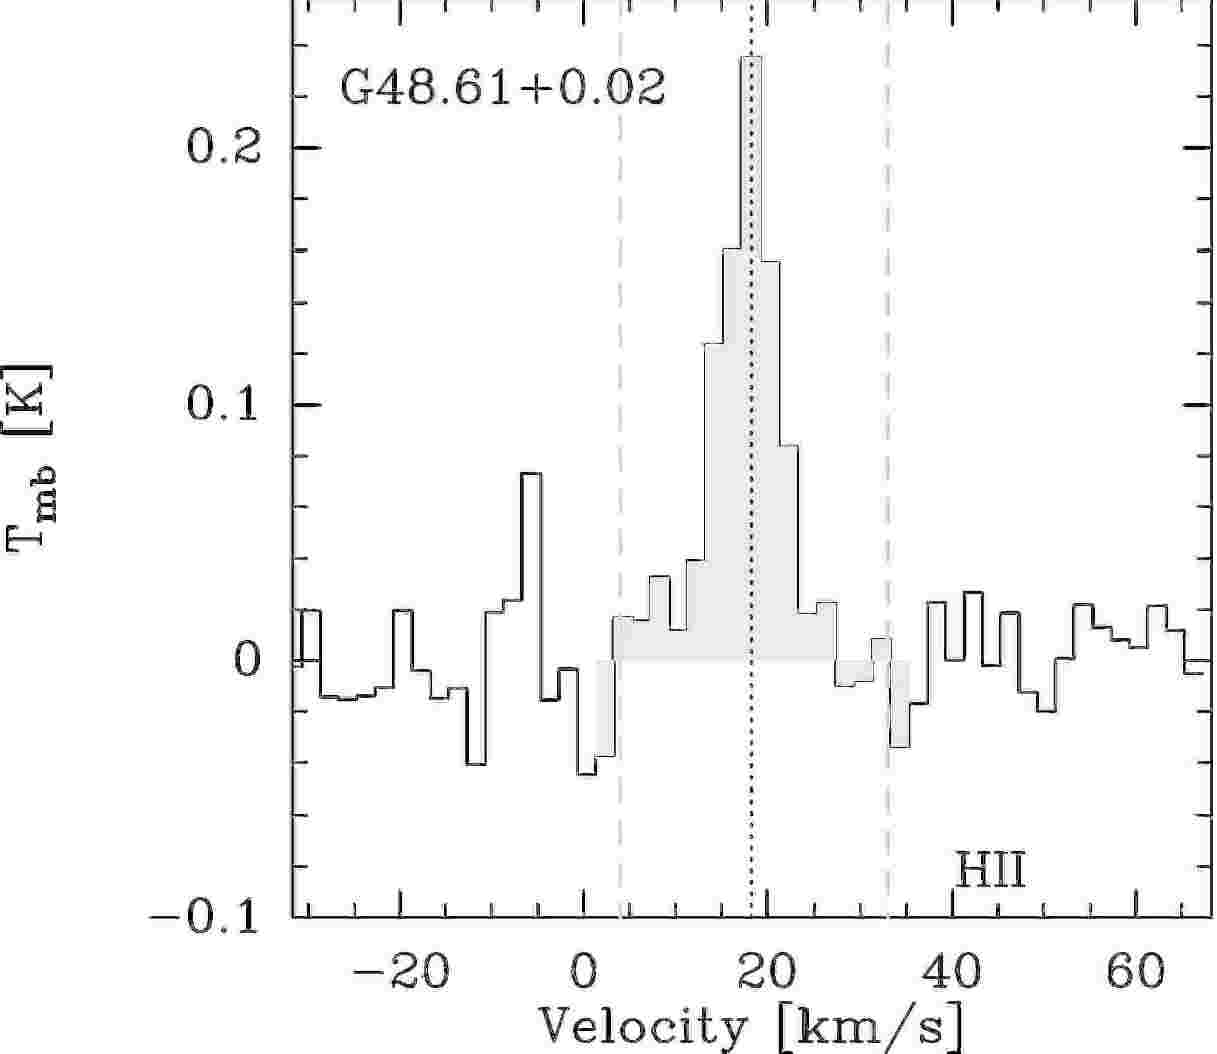
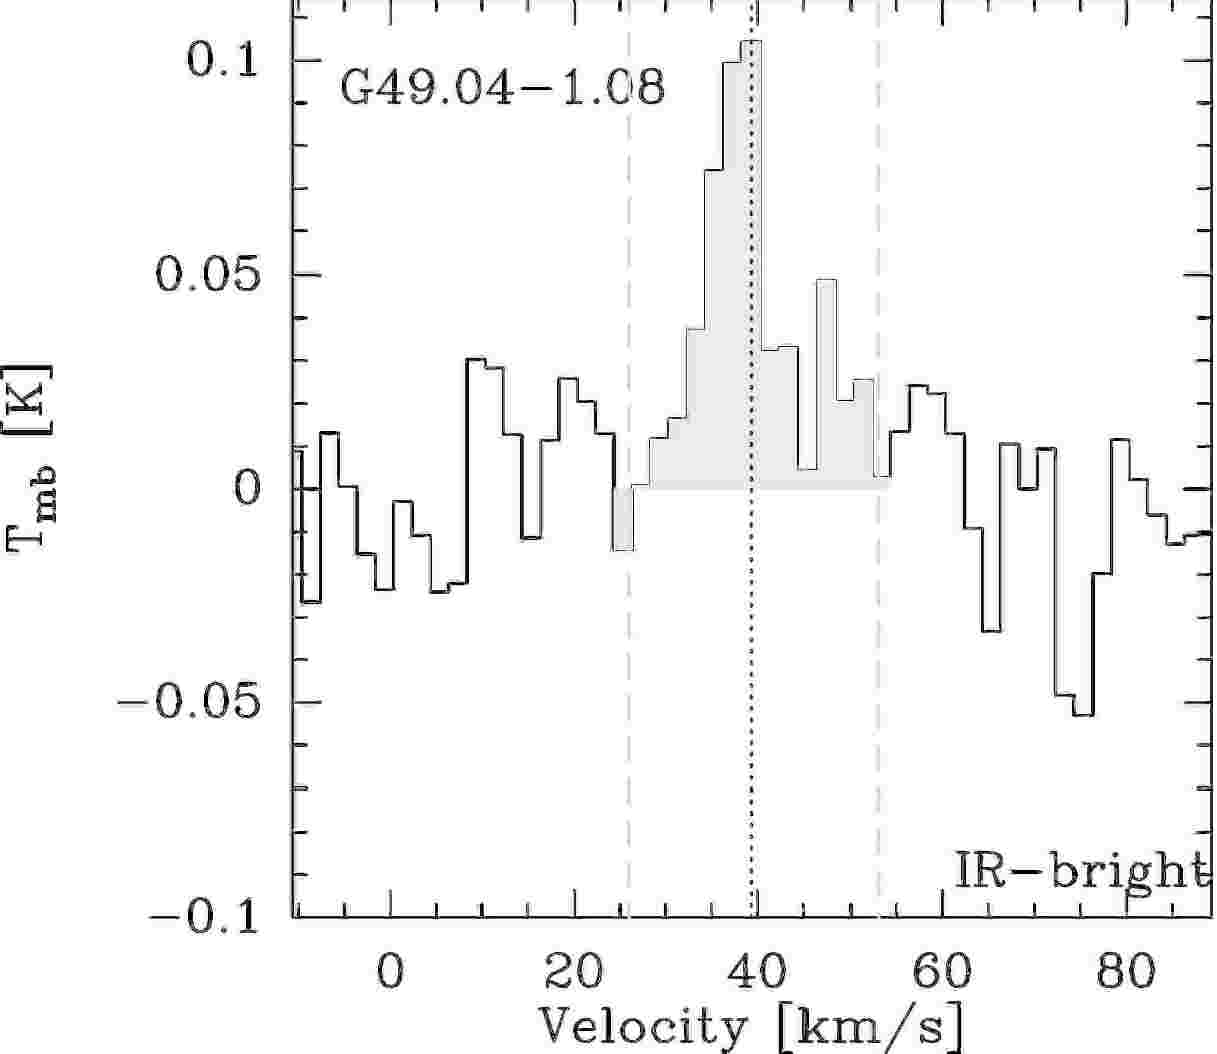
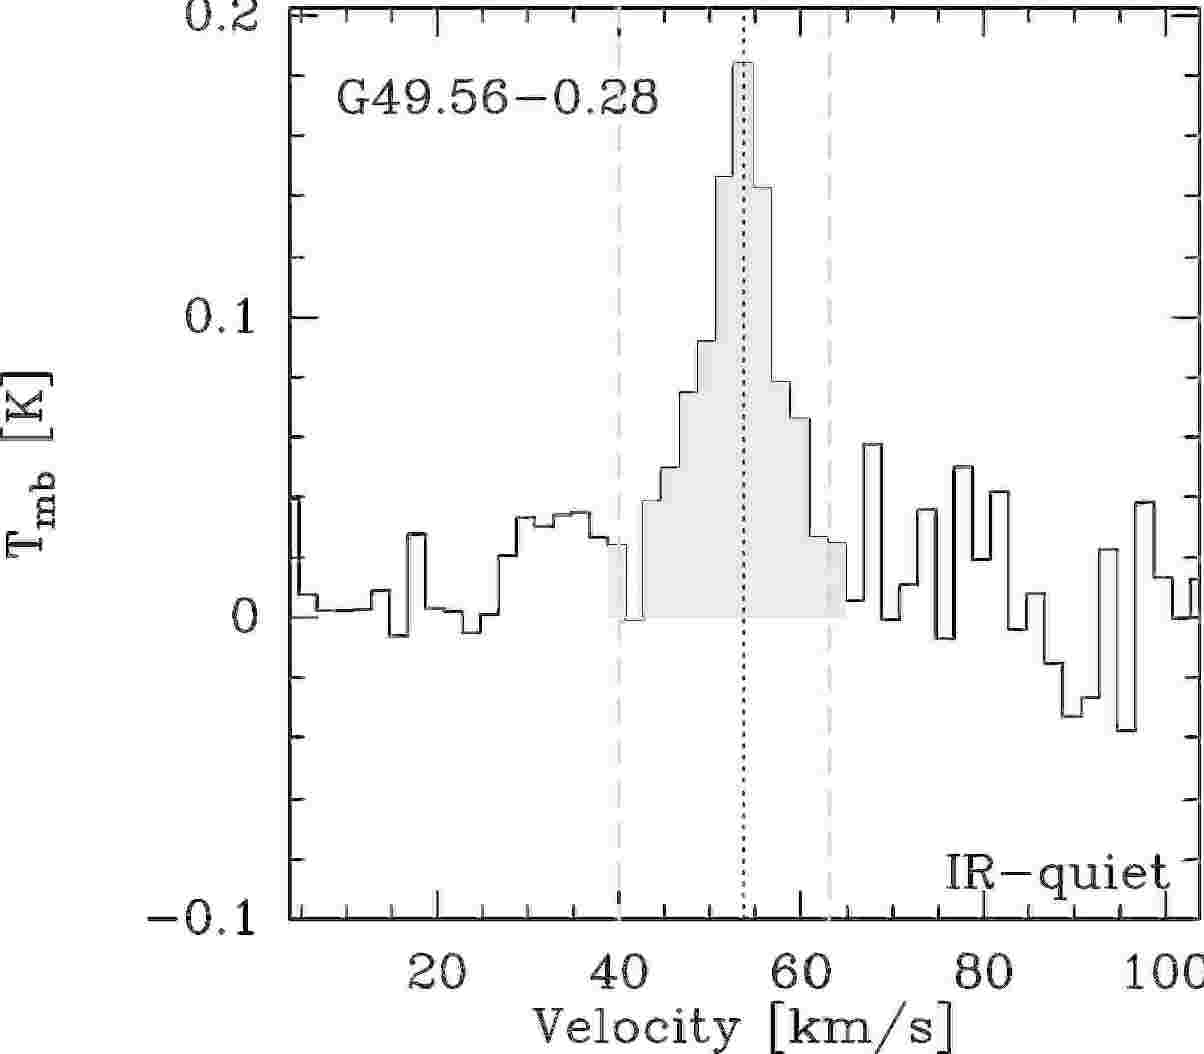
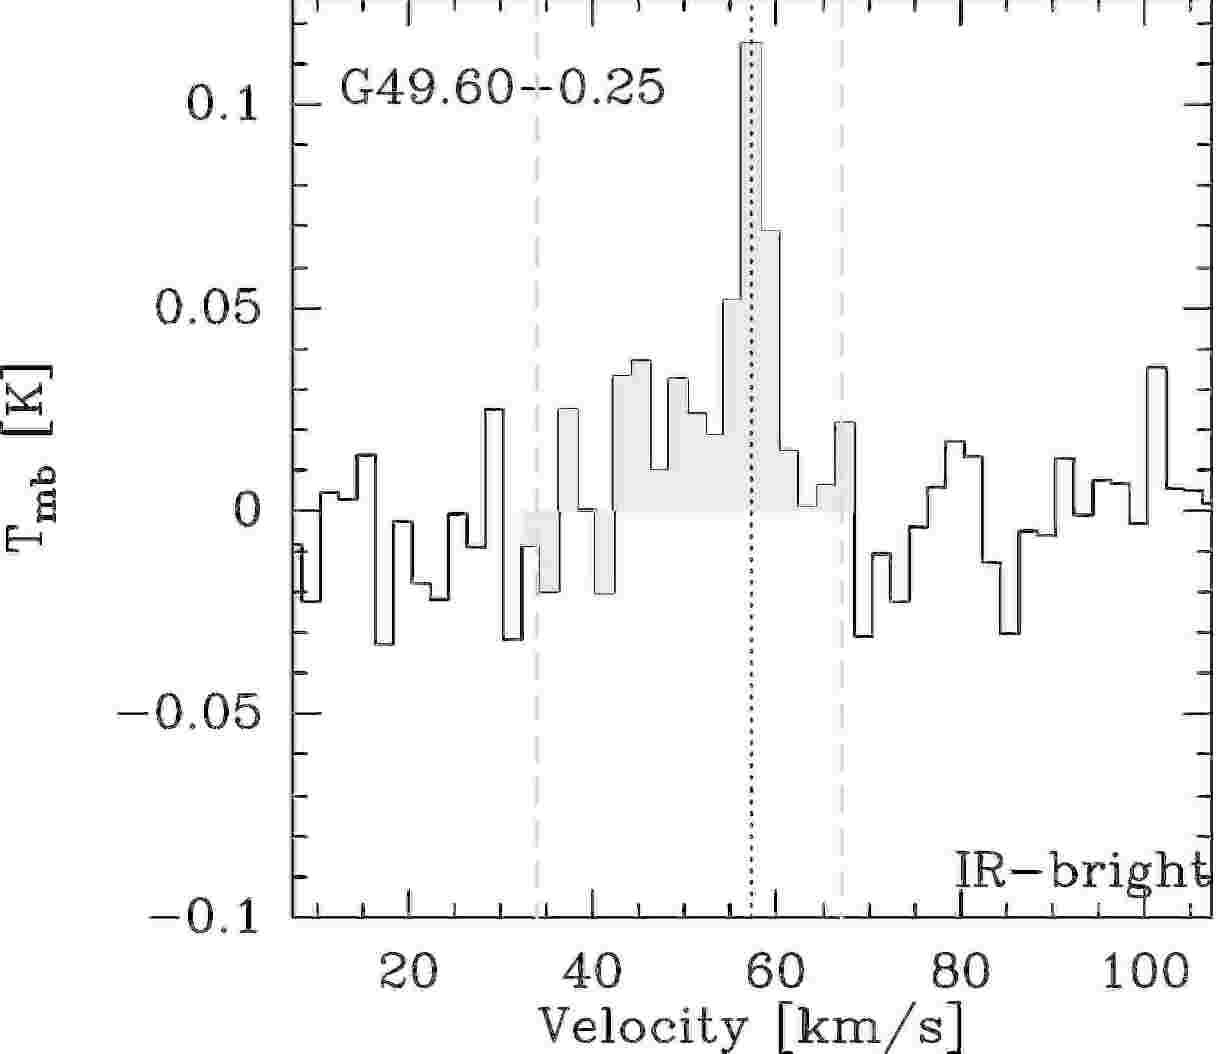
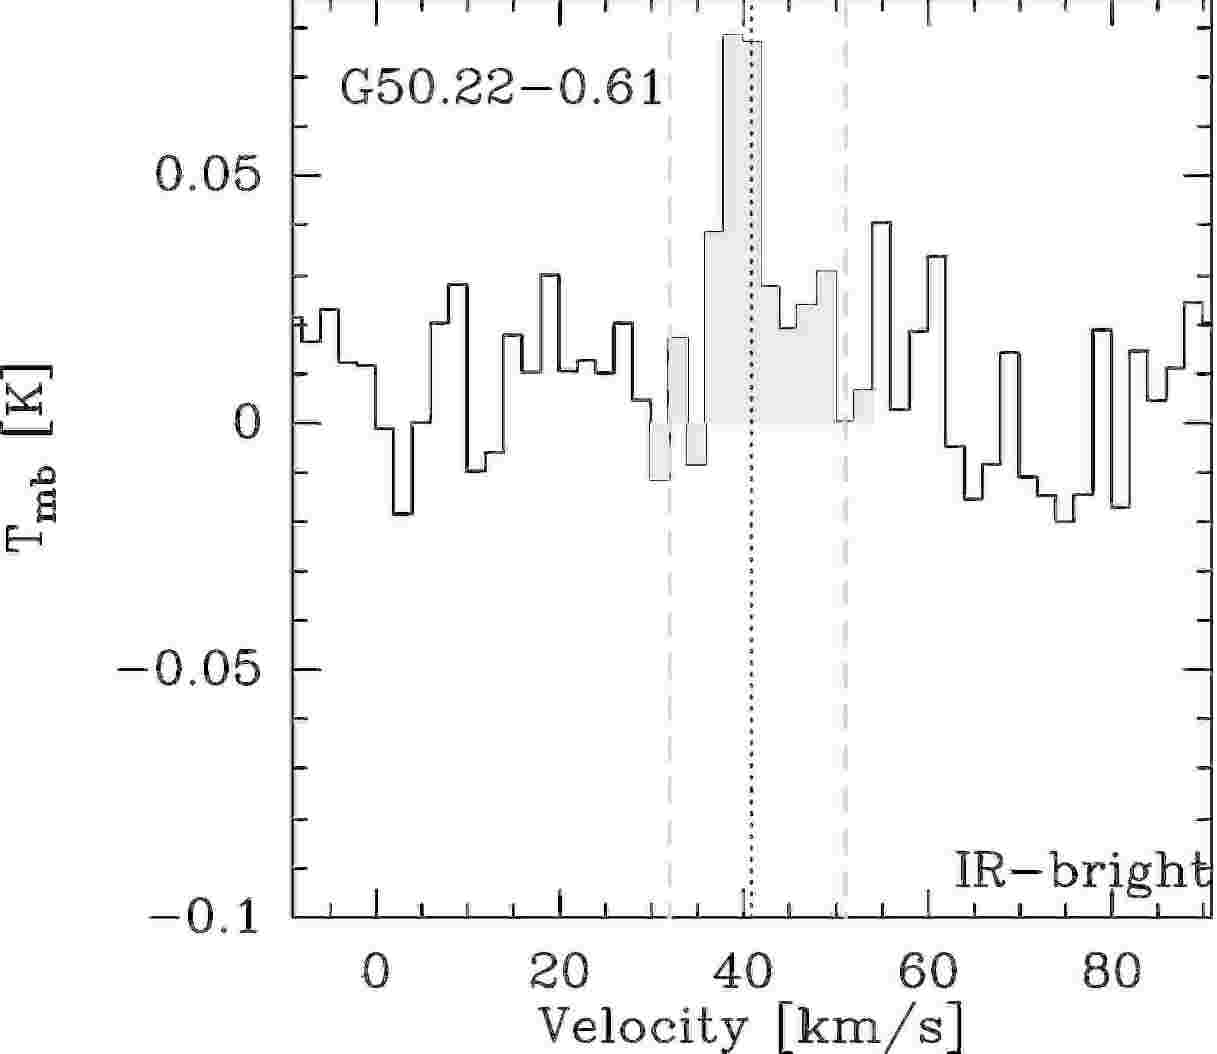

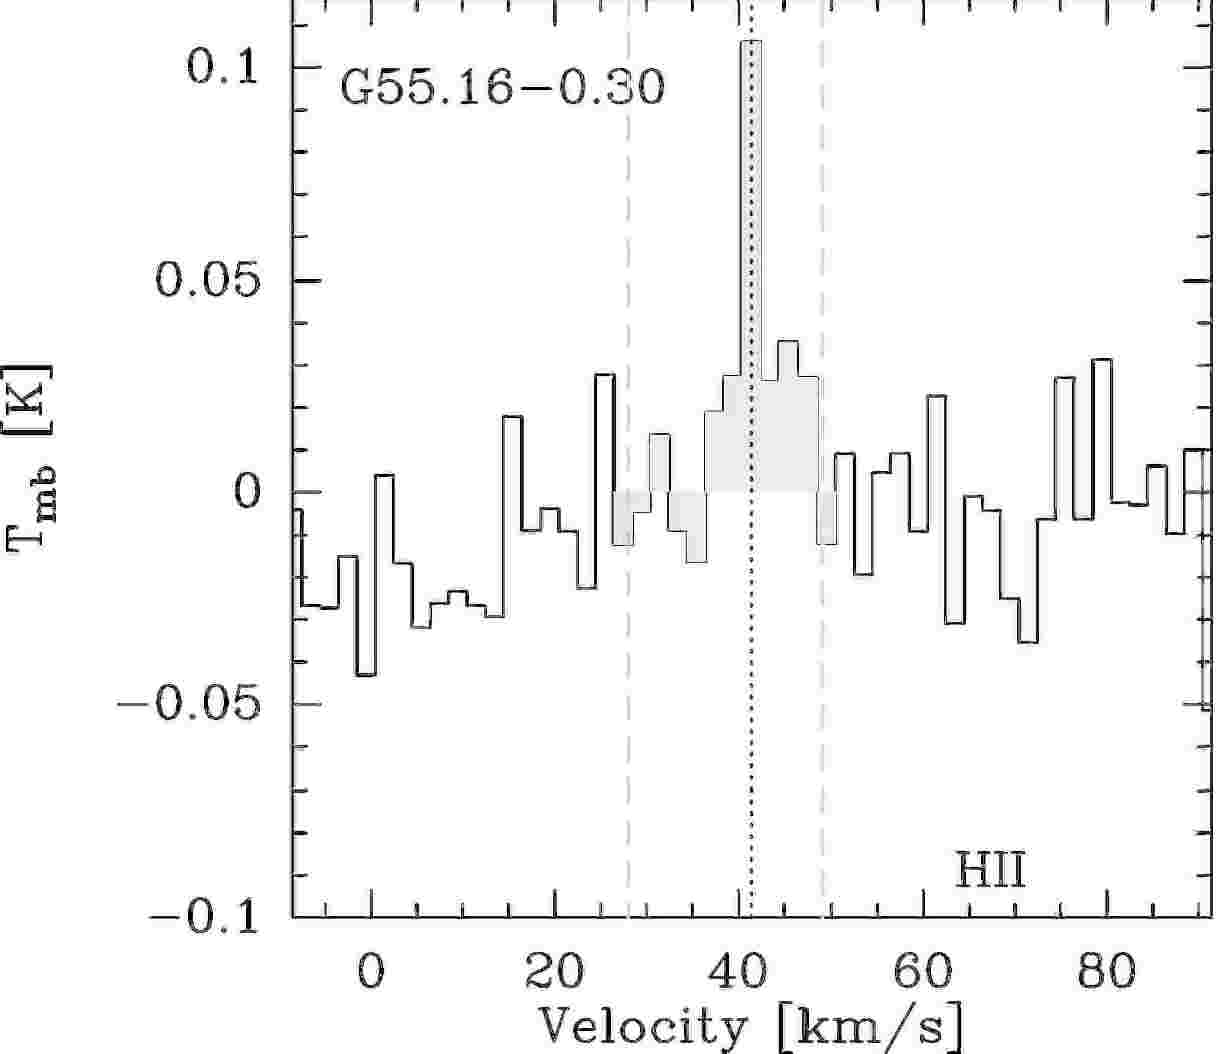
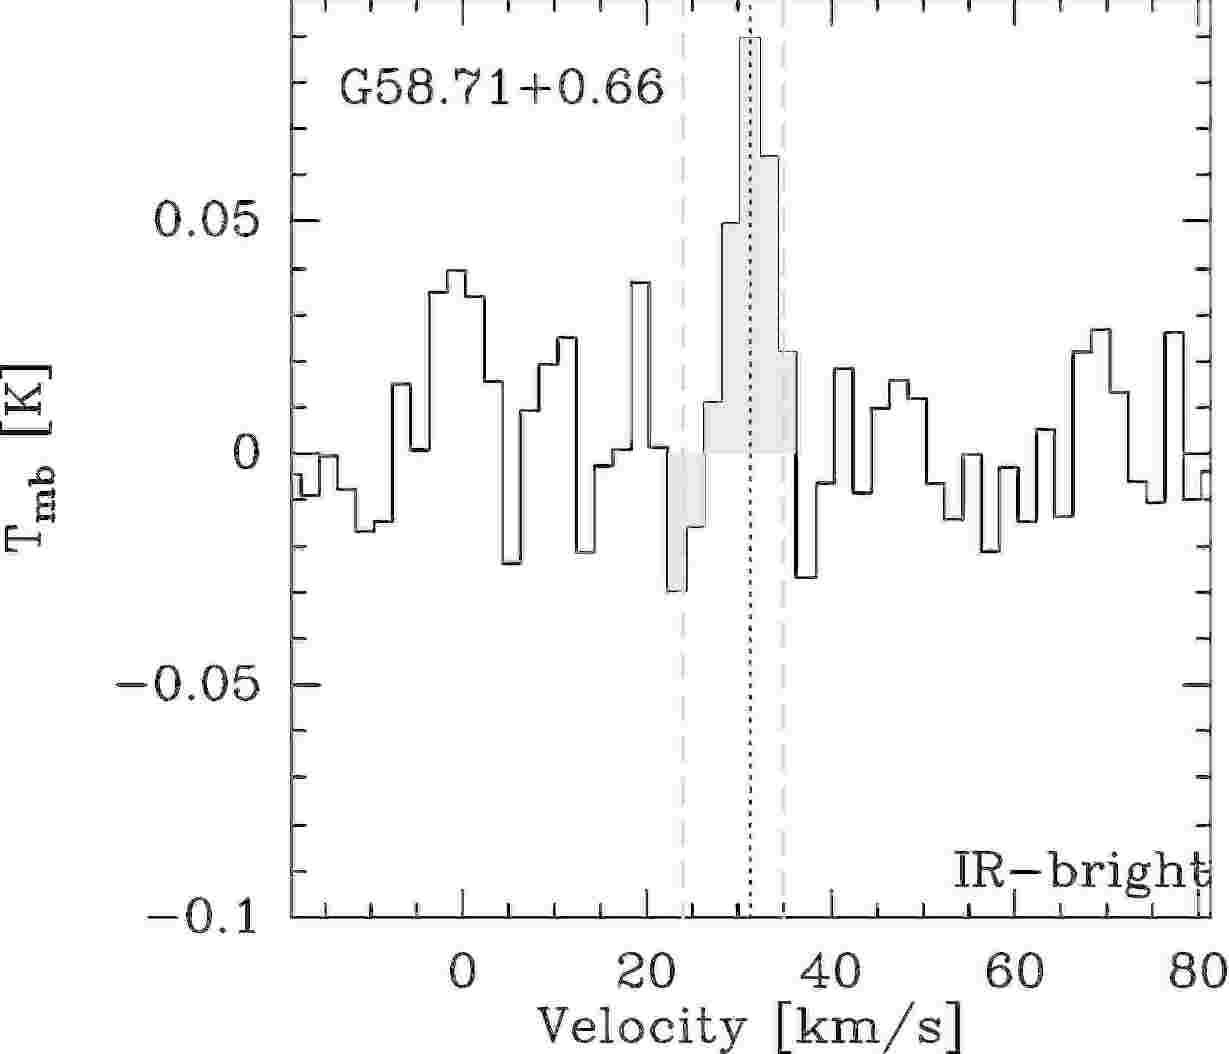
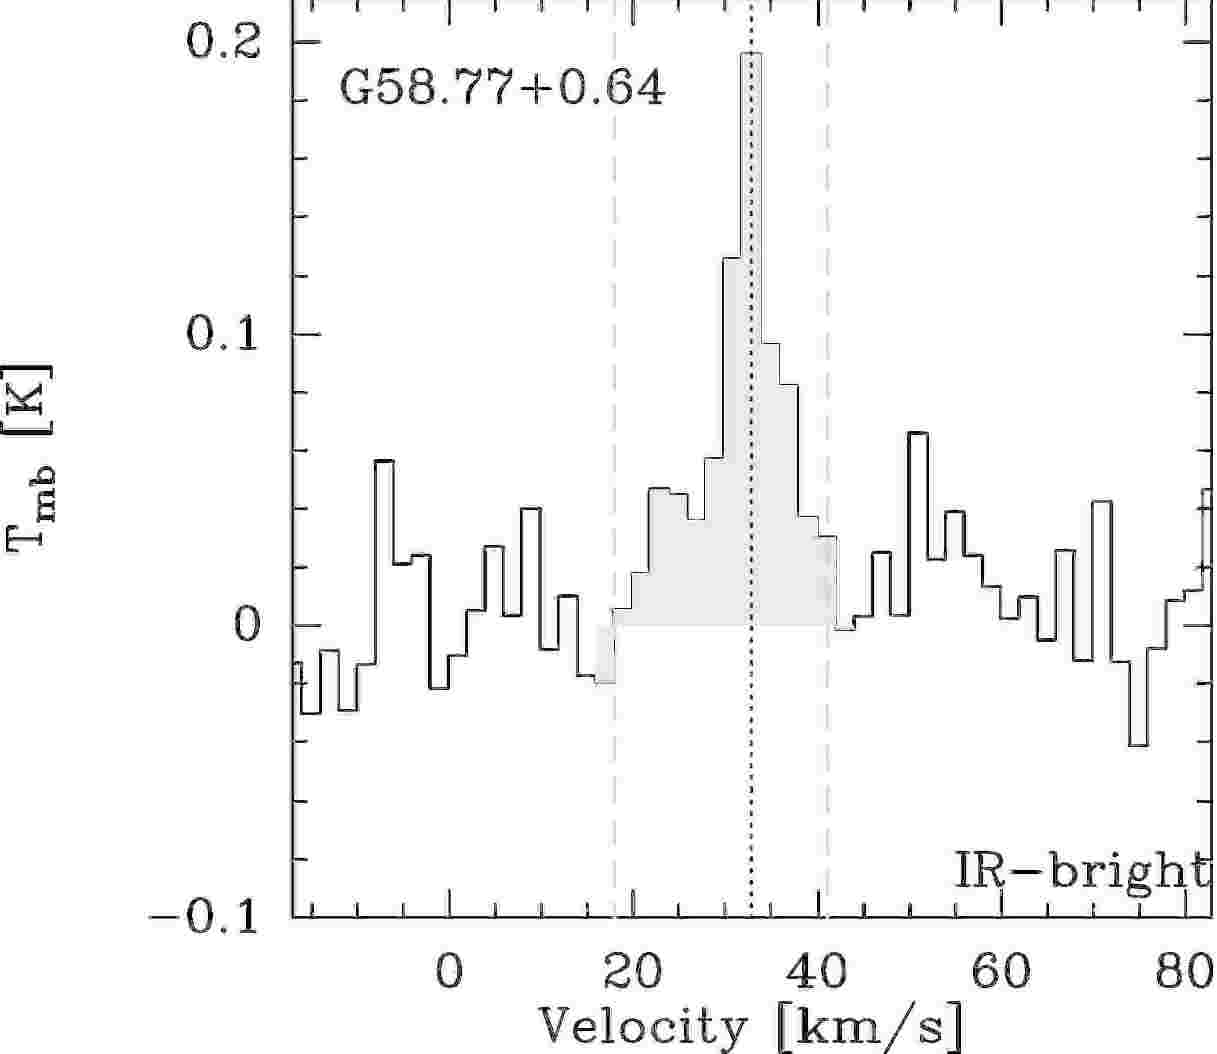
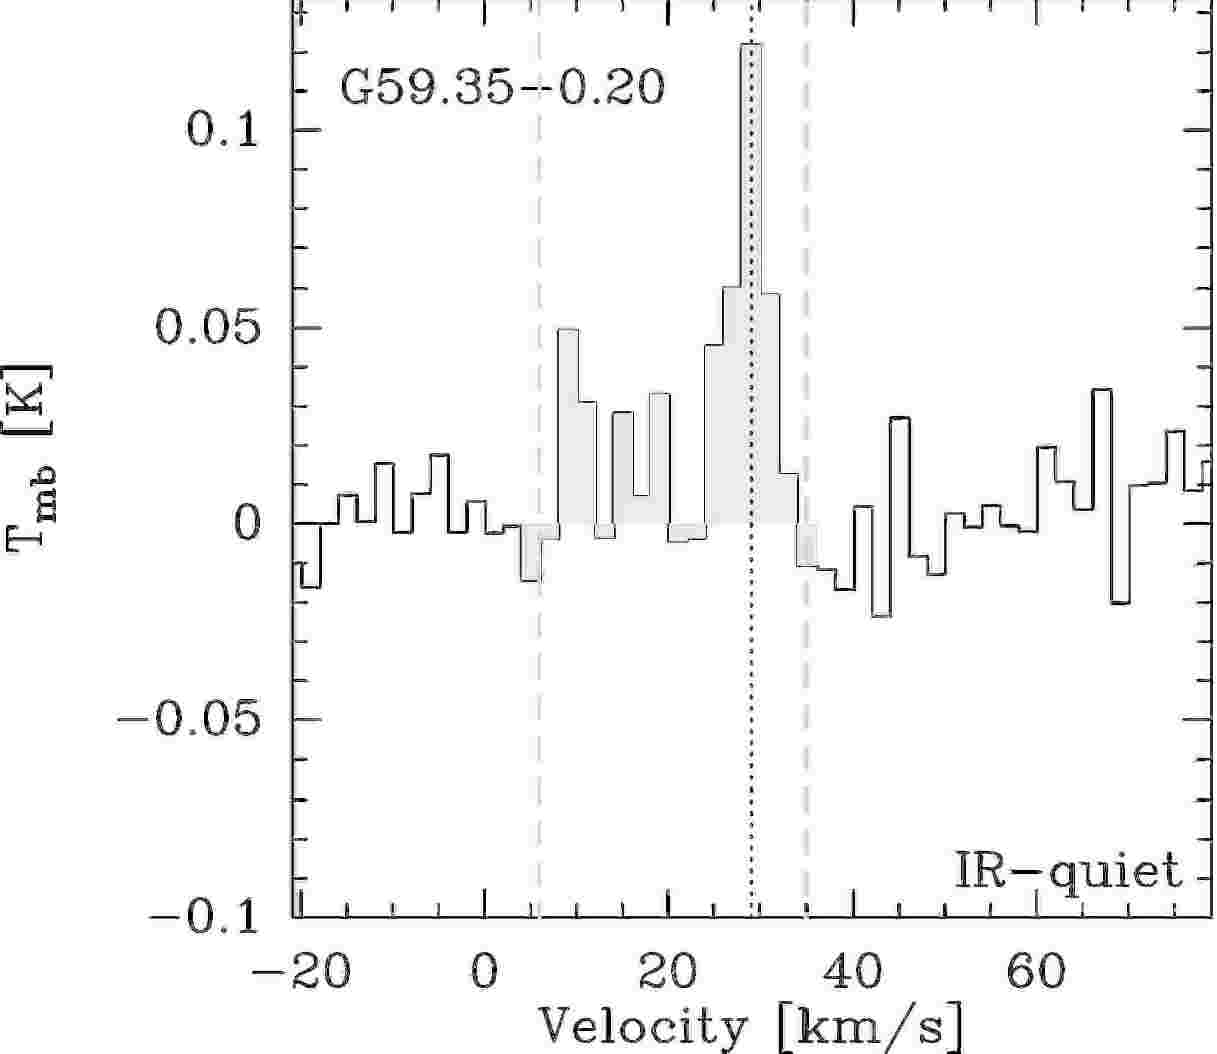
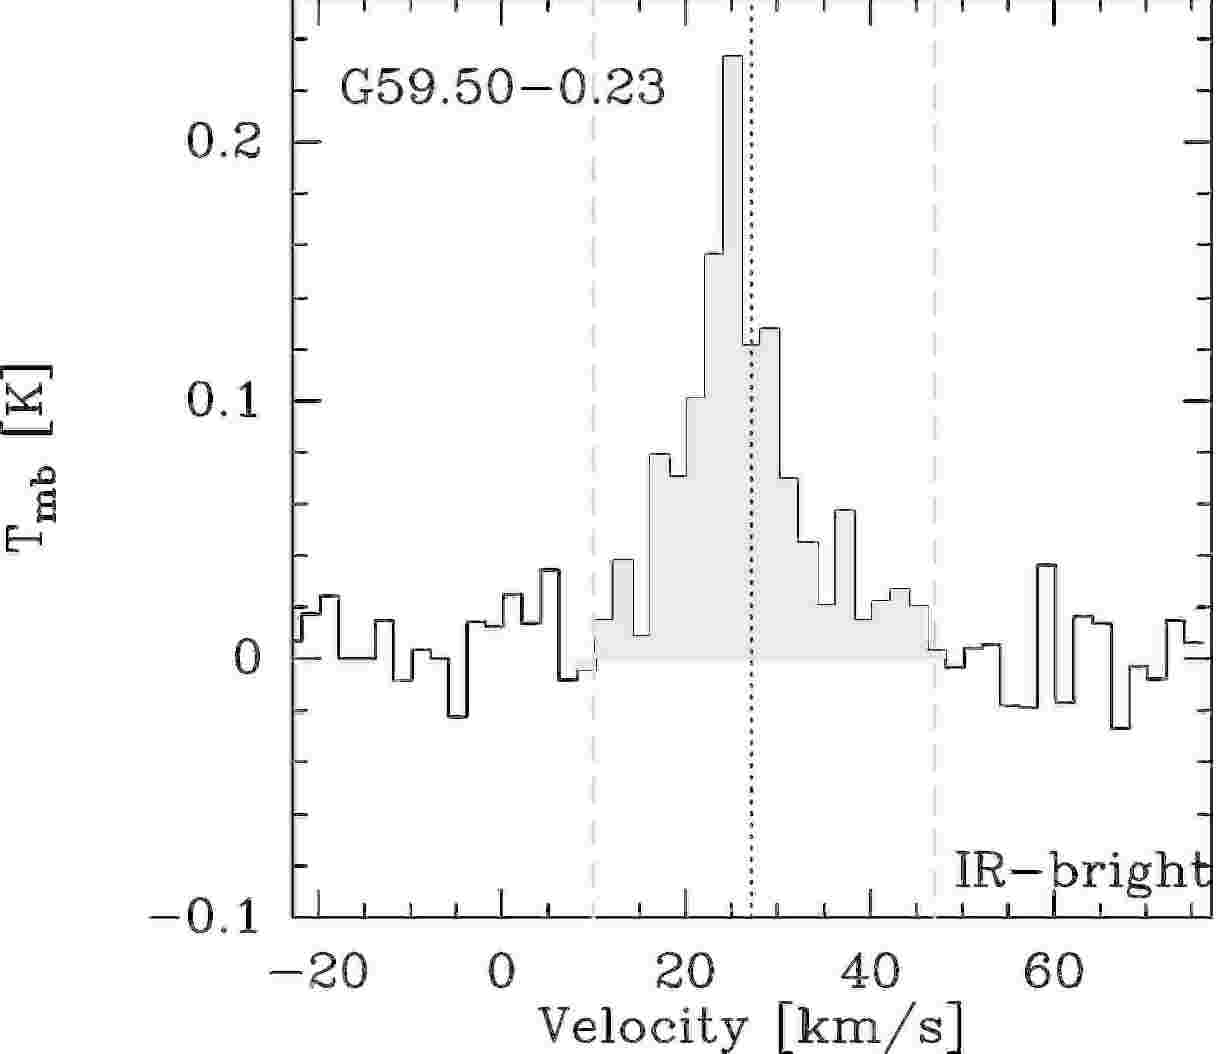
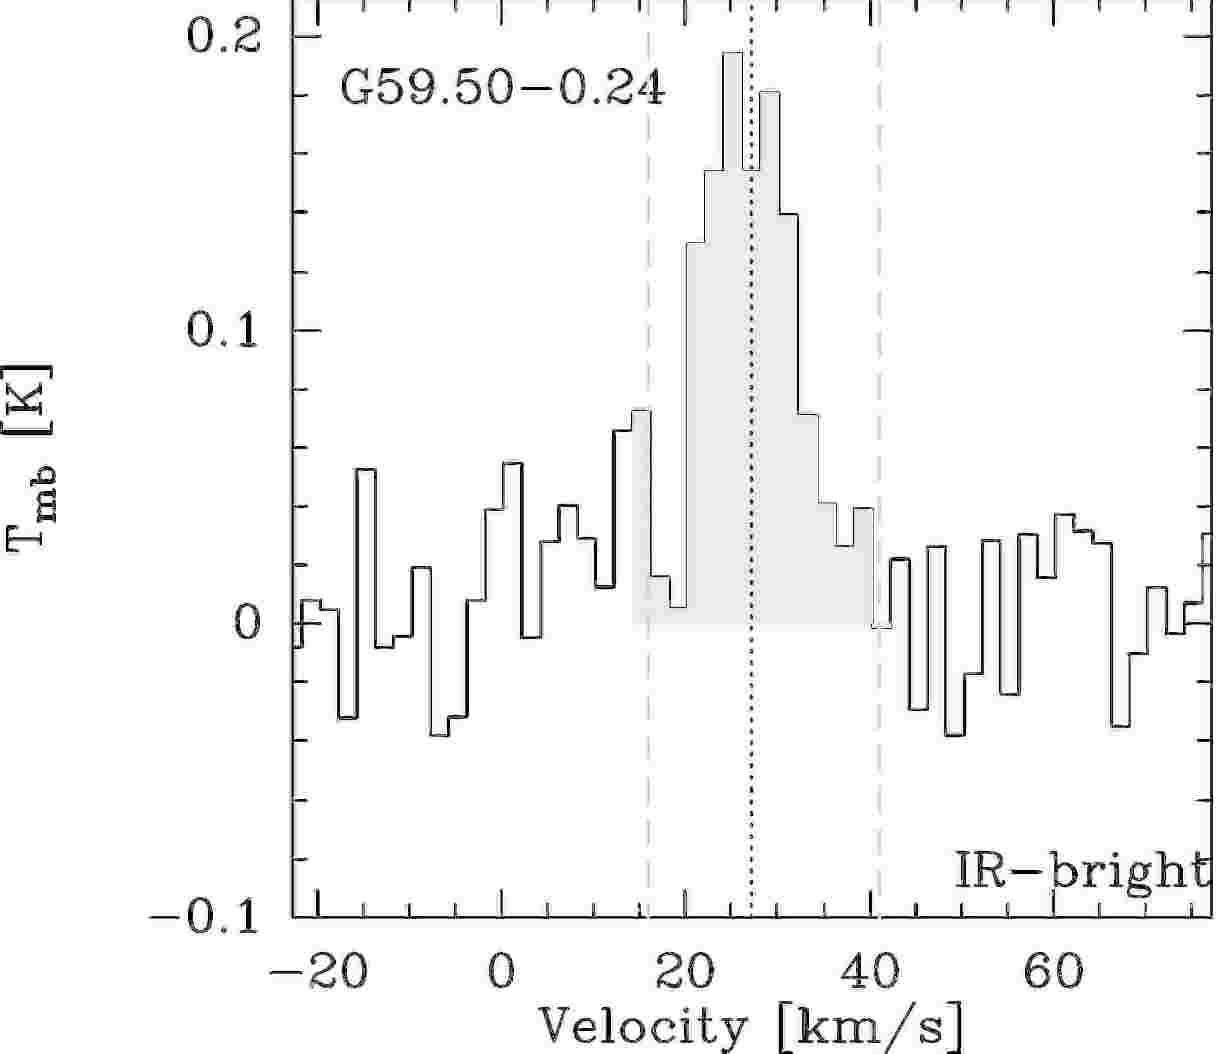
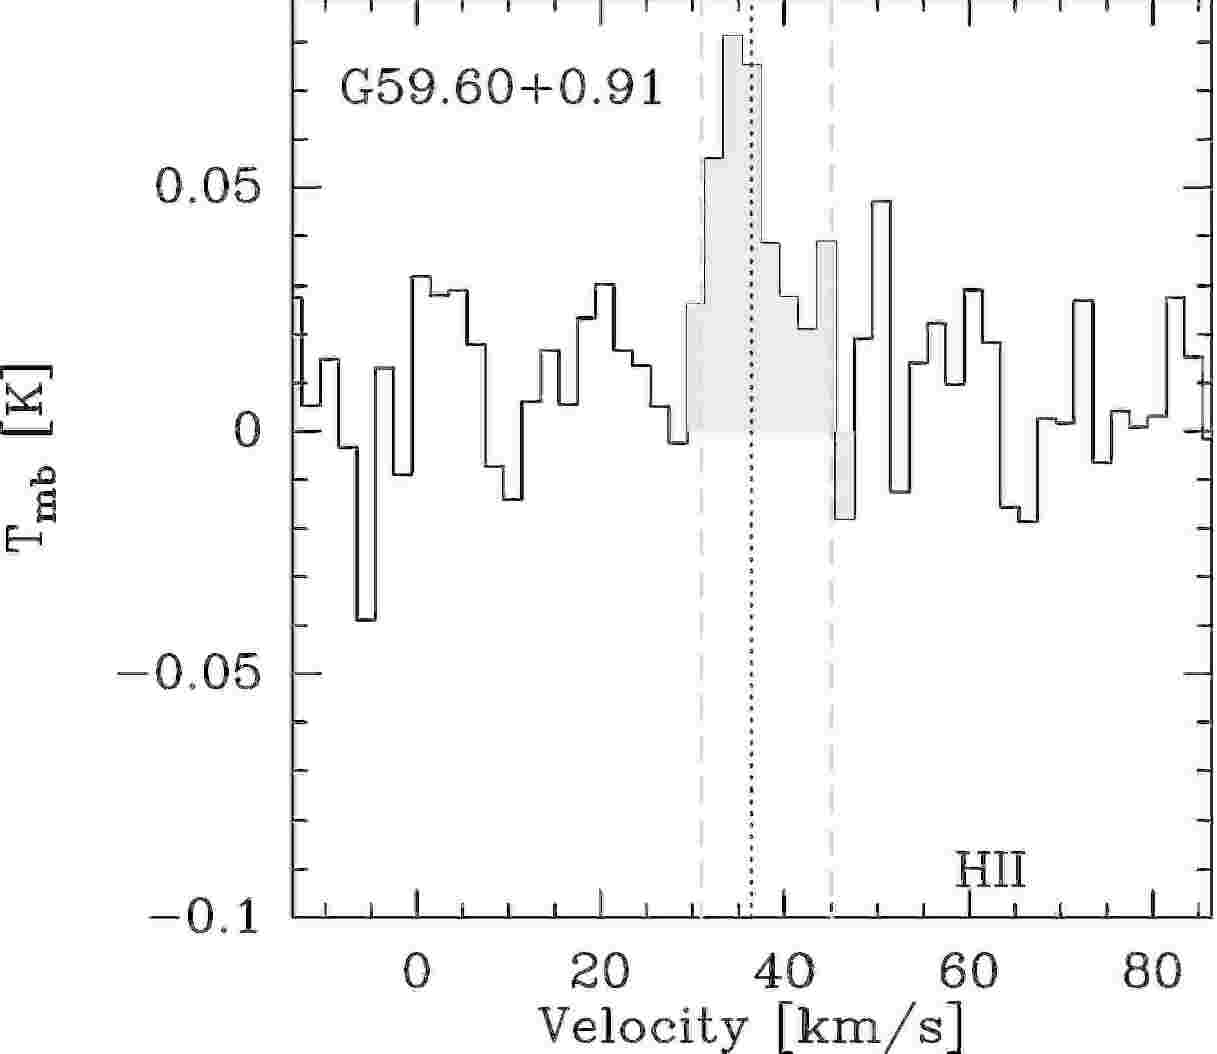
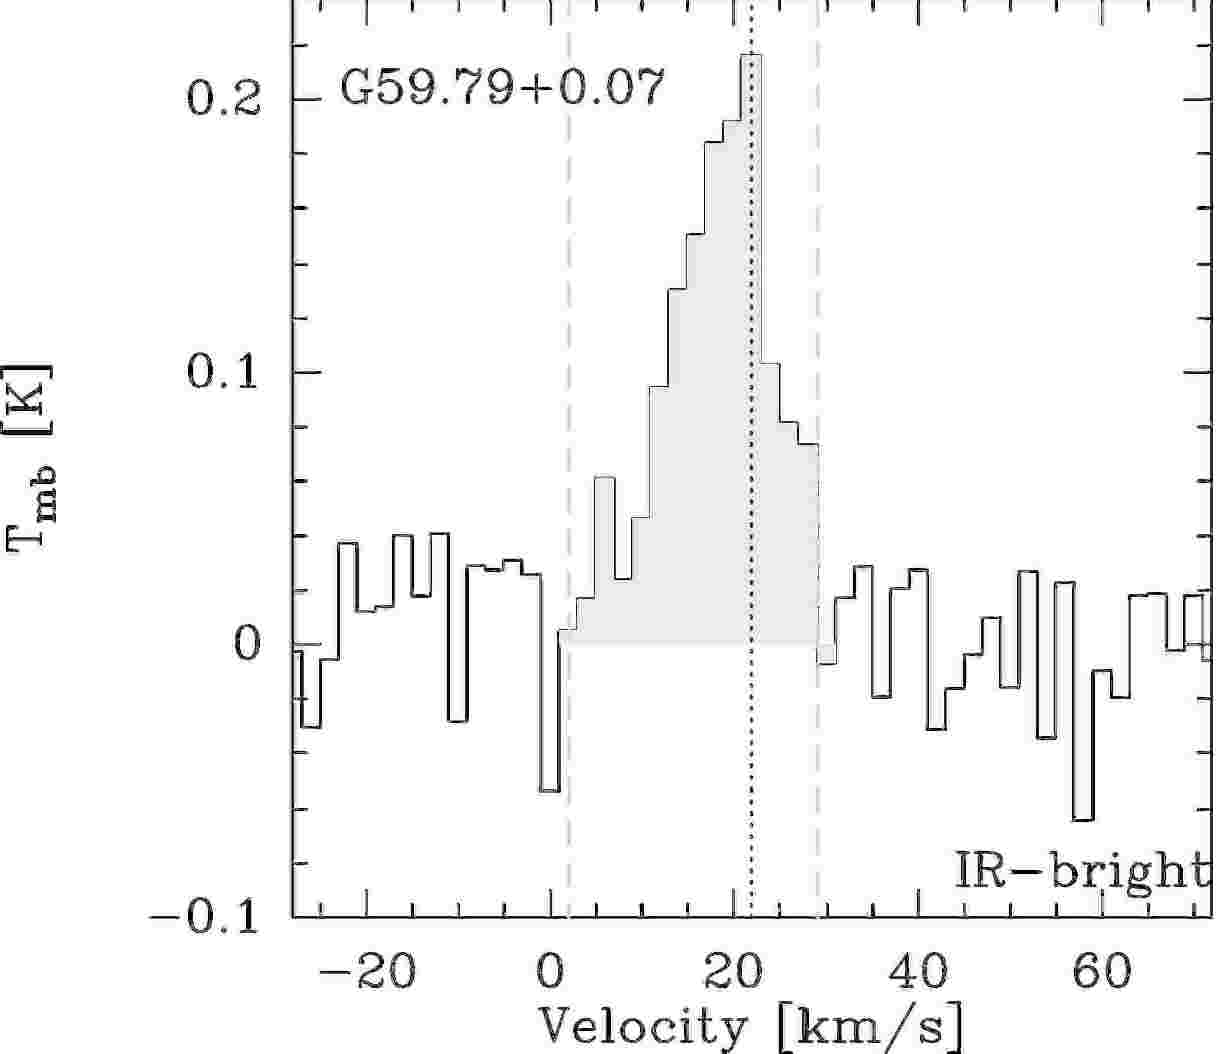
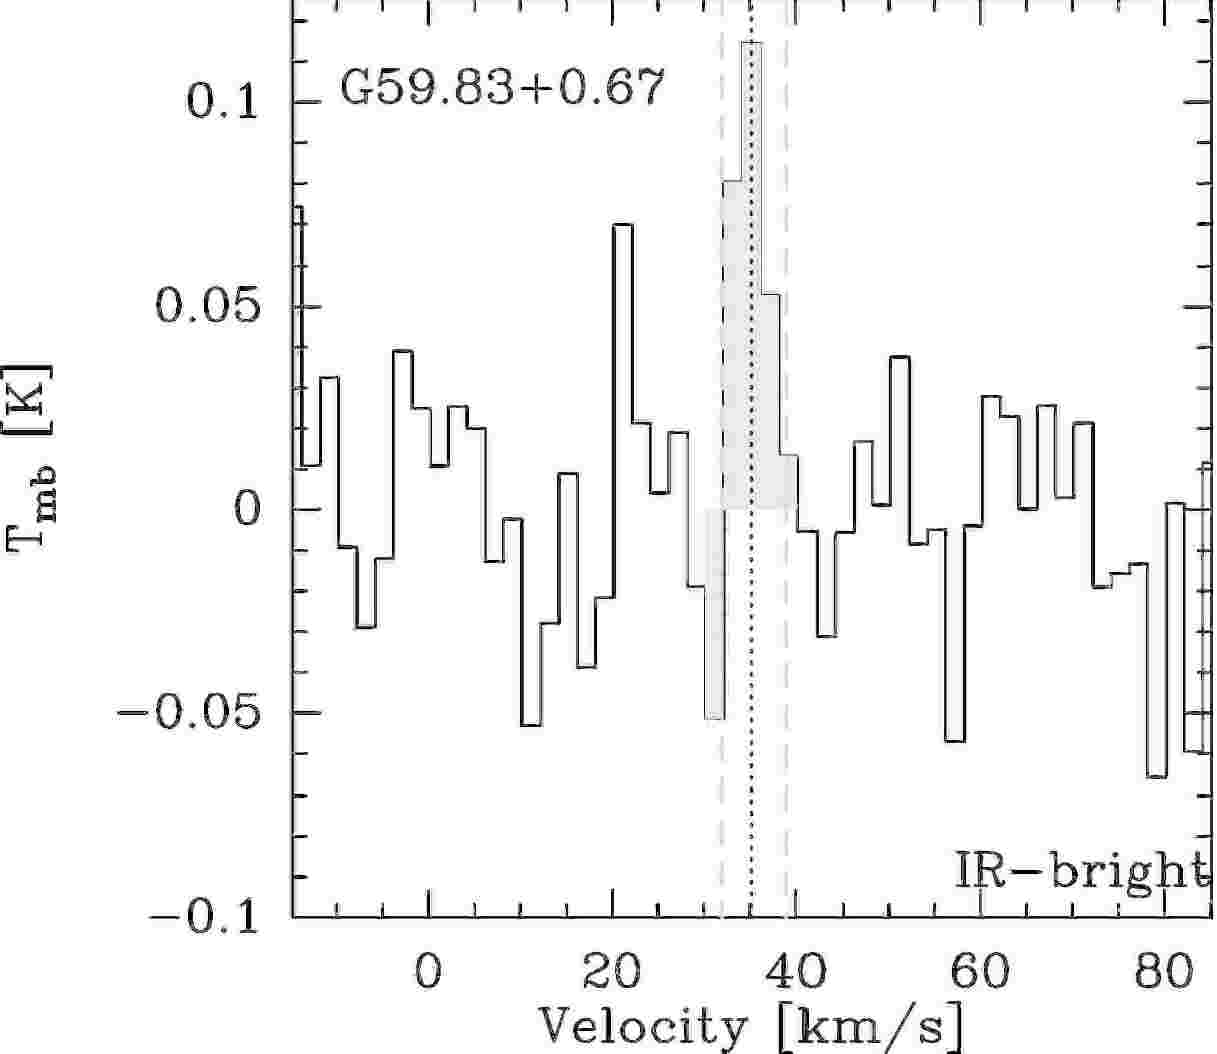
E.3 Spectra of sources with only SiO () observations and non-detections
