A sharp interface method for compressible liquid-vapor flow with phase transition and surface tension
Abstract.
The numerical approximation of non-isothermal liquid-vapor flow within the compressible regime is a difficult task because
complex physical effects at the phase interfaces can govern the global flow behavior.
We present a sharp interface approach which treats the interface as a shock-wave like discontinuity.
Any mixing of fluid phases is avoided by using the flow solver in the bulk regions
only, and a ghost-fluid approach close to the interface.
The coupling states for the numerical solution in the bulk regions are determined by the solution of local multi-phase Riemann
problems across the interface. The Riemann solution accounts for the relevant physics by enforcing appropriate jump conditions
at the phase boundary. A wide variety of interface effects can be handled in a thermodynamically consistent way. This includes
surface tension or mass/energy transfer by phase transition. Moreover, the local normal speed of the interface, which is needed to calculate
the time evolution of the interface, is given by the Riemann solution. The interface tracking itself is based on a level-set method.
The focus in this paper is the description of the multi-phase Riemann solver and its usage within
the sharp interface approach. One-dimensional problems are selected to validate the approach. Finally, the three-dimensional
simulation of a wobbling droplet and a shock droplet interaction in two dimensions are shown. In both problems
phase transition and surface tension determine the global bulk behavior.
Key words and phrases:
Compressible two-phase flow, sharp interface resolution, surface tension, phase transition, Ghost-Fluid method, latent heat1. Introduction
The numerical modeling of multi-phase flow is a very active field of research. In this paper we are interested in models for fully compressible regimes with liquid and vapor bulk phases that cope correctly with phase transition and surface tension effects. Our focus is on the direct numerical simulation where single interfaces separating the bulk dynamics have to be resolved. (See e.g. [1, 2] for alternative homogenized models.)
There are basically two different approaches to model compressible multi-phase flows, the diffuse interface and the sharp interface approach. In the first, a smooth internal layer, that has to be captured by the numerical method, stands for the interface. In particular, artificial mixture states may occur. Typically only one set of equations is solved in the whole computational domain, e. g. the Navier-Stokes-Korteweg systems ([3, 4]). In the second approach, the sharp interface approach, the interface is represented as a discontinuity in the density field, separating the computational domain in two bulk regions. The fluid flow in both of the bulk regions is described by the standard single-phase conservation equations. The interface appears as an unknown interior boundary. Appropriate jump conditions couple the states of the bulk regions at the interface and have to ensure the well-posedness of the overall model.
From this description it becomes obvious where the problems occur in both approaches. For problems in which the width of the physical interface is smaller than the typical grid cell size, the diffuse profile in the diffuse interface approach has still to be thermodynamically consistent with the physics. But, within the diffused numerical interface non-physical mixing states may occur, for which an artificial equation of state has to be defined. In the sharp interface approach the bulk phases are separated to avoid any mixing at the interface, which is in time-dependent problems a big challenge for the numerical framework.
In this paper, we concentrate on the sharp interface approach in the compressible flow regime including phase transition and surface tension. For the fluid flow in the bulk phases we restrict ourselves to a fluid that is described by the Euler equations with the conservative variables mass, momentum and total energy. The equation of state (EOS) is used to calculate the primitive unknowns pressure and temperature. In Section 2 of the paper we review this model and introduce appropriate coupling conditions at the phase interface. In the isothermal case it is well understood that the coupling conditions at a phase interface should consist of the mass conservation relation, a dynamical version of the Young-Laplace law for momentum balance, and an additional Gibbs-Thomson relation to control the entropy production (see [5, 6]). These conditions remain valid in the temperature dependent case that we consider here. However, since there is no mechanism for heat conduction, the release of latent heat has to be modeled in a different way. We suggest to use an algebraic jump condition.
In Section 3 we present a constructive algorithm to solve the generalized Riemann problem for the full Euler equations with initial data from different phases. The solution of the Riemann problem is supposed to include in addition to the standard waves (shock, rarefaction, contact wave) a discontinuous wave that obeys exactly the relations from Section 2. This wave represents the phase interface. The design of the Riemann solver is a complex issue not only due to the non-standard jump conditions across the phase boundary but also since the hyperbolicity of the Euler equations breaks down and an elliptic spinodal region occurs for two-phase fluids, see e. g. [7, 8]. Let us note that the analysis of the Riemann problem for two-phase problems has been a very active field of research in the past decade (see [9] for a general theory and e.g. [10, 11, 12, 13, 14, 15] for specific examples) but is mostly restricted to either the isothermal case or to homogeneous coupling conditions that neglect surface tension, latent heat, and entropy production. The resulting coupling conditions are combined with a ghost-cell approach as the basic building block in our sharp resolution of a phase interface.
Our overall numerical approach relies on the idea to use local properties of the interface (local speeds, adjacent bulk states).
The essential tool to compute these quantities is the generalized Riemann solver from Section 3
for input states from different bulk states.
The other core building block of the numerical scheme with sharp interface treatment is introduced in Section 4.
It is
a compressible bulk flow solver combined with a tracking method for the interface. Precisely we use a discontinuous Galerkin scheme
with a finite-volume sub-cell resolution (see [16]) for the flow and the level-set equation that governs
the interface tracking. To avoid any numerical smearing at the interface, the ghost-fluid approach from [17]
is adapted to our situation. For much simpler isothermal phase transition models a similar approach can be found in
[18, 19, 12]. The focus and the novelty in this paper is the extension of the method to handle realistic flow regimes, that
are governed by possibly non-isothermal phase change and surface tension effects.
The capability of our method to cope with such scenarios is demonstrated in the final
numerical Section 5 that provides also a
validation of the numerical method. As an application to physically realistic droplet dynamics we consider evaporating droplets, a
wobbling droplet, and a shock-droplet interaction.
Finally, we compare our model to experimental results from Simoes-Moreira&Shepherd [20] and Reinke&Yadigaroglu [21].
2. The mathematical model and the basic numerical approach
2.1. Governing equations
In a sharp interface method for multi-phase flow the basic assumption is that the width of the physical phase interface is much smaller than one grid cell. The implication is then to model the dynamical interface as a moving discontinuity within the flow field. Let us assume that this interface separates the computational domain into the two domains and called bulk regions. Here, “vap” stands for vapor and “liq” for liquid. We assume that the flow is inviscid and it is described in both bulk regions by the Euler equations
| (4) |
with suitable initial and boundary conditions. Here, the variables are fluid density , velocity and the specific total energy , which is related to the specific internal energy via .
The system (4) is closed by an equation of state that connects the pressure to the other variables and considers thermodynamic effects. In the bulk regions and we assume that the fluid is in local thermodynamic equilibrium, which means that the state of the fluid is determined by any two independent thermodynamic state variables. Note that we use in the sequel the same symbol for some thermodynamic variable, even if they are considered to depend on different arguments. For instance we use
where , , and , are specific volume, entropy, and temperature, respectively.
Let us concentrate for a moment on the specific internal energy and consider pressure and temperature to be given by
| (5) |
while the specific Helmholtz free energy and the specific Gibbs free energy are related through
| (6) |
We consider fluids below the critical point such that only liquid and vapor states exist. The state space of the liquid region and the state space of the vapor region consist of states such that is strictly convex. As a consequence, a positive real function for the speed of sound is obtained in both phases, because we have
| (7) |
To illustrate the set-up, Figure 1 shows the isentropes for a constant value of entropy . Note in particular that the isentropes are monotone decreasing in the liquid and the vapor phase. The area between , is called the elliptic or spinodal region and refers to unstable thermodynamic states.
Furthermore we require that a saturation curves exist, that takes surface tension into account. We assume that for any mean curvature value , there is a liquid saturation curve and a vapor saturation curve , such that
| (8) |
holds, where is the constant surface tension coefficient. Note that we can parameterize the curves with temperature, liquid/vapor pressure or specific Gibbs free energy. Furthermore, we introduce the functions , with , , , , that are the (saturated) temperature and pressure, respectively, evaluated on the saturation curve.
For hyperbolic systems the notion of weak entropy solutions is widely believed to be the correct solution concept. Hence, we look for integral solutions that satisfy the entropy condition
| (9) |
weakly in the bulk regions and . Using the convexity of in one readily checks that the mathematical entropy is convex as a function of for all states in the bulk regions and .
2.2. Jump conditions for the liquid-vapour phase boundary
We complete the mathematical model with the Euler model (4) for the bulk regions by coupling conditions for the phase boundary . Let be arbitrary but fixed and let some be given. We denote the speed of in the normal direction by . The normal vector is always chosen as pointing into the vapor domain . Across the interface the following trace conditions, which represent the conservation of mass and the balance of momentum and energy in the presence of capillary surface forces and latent heat, are posed:
| (10) | ||||
| (11) | ||||
| (12) | ||||
| (13) |
Thereby and for some quantity defined in . In (11) by we denote the mean curvature of associated with orientation given through the choice of the normal . The constant surface tension coefficient is , and are a complete set of vectors tangential to . Note that in this study we assume constant surface tension such that tangential variation of along the interface is ignored. With (12) we assume there is no slip tangential to the interface.
It remains to comment on (13). In the conditions (10)–(13) the effects of higher order heat fluxes are ignored. However, the amount of heat energy that goes into evaporation or that is liberated in the inverse condensation process has to be taken into account. The interface source term in (13) accounts for that release or absorption of latent heat. We assume that it can be expressed by
| (14) |
For isothermal phase transitions, expression (14) is just the definition of latent heat. Here, it is assumed that (14) holds also for non-isothermal transitions, with respect to some reference temperature . This temperature can for instance be chosen equal to some ambient system temperature or to the average temperature of the bulk phases at the interface. If it is reasonable to consider an ambient system pressure one may use instead of (14).
A discontinuous wave with
| (15) |
is called a planar phase interface if conditions (10)–(13) hold. In this work, we are interested only in interfaces that are non-characteristic and subsonic, i. e. the adjacent states satisfy
| (16) |
Otherwise it will not be possible to solve the Riemann problem close to equilibrium states (see Remark 2.1 below).
For the isothermal case it is known (see e.g. [5, 22]) that well-posedness of the free boundary value problem requires an additional condition.
The same holds for (4) with van der Waals fluids (see [23]). We assume that this is also necessary for more general
equations of state fulfilling (5).
One possible choice is yet another algebraic coupling condition.
In the literature, kinetic relations have been suggested (see [5, 22]), which control the entropy change explicitly.
Under the presence of latent heat, the local entropy balance corresponding to (9) reads
where is the interface entropy production. This construction lets the entropy production vanish, if the mass flux
| (17) |
across the interface vanishes. On the other, the second law of Thermodynamics implies that is not negative. Thus a simple constitutive law is that uses the previously defined reference temperature and an entropy production constant . With (13) the kinetic relation
| (18) |
follows.
We conclude the description of the mathematical model under consideration with the following remarks:
Remark 2.1 (Kinetic relation and supersonic phase interfaces).
- (i)
-
(ii)
There are also solutions of (10)–(12) connecting densities in different phases where the corresponding shock wave is supersonic (i.e. (16) is in particular violated). Then an additional kinetic relation like (17) is superfluous to solve e.g. the Riemann problem. However it appears not to be physical to have supersonic phase interfaces.
Remark 2.2 (Static phase boundaries and latent heat).
-
(i)
A static phase boundary () satisfies
- (ii)
-
(iii)
Ngan & Truskinovsky show in [24], that static phase boundaries satisfy , , in the limit of zero heat conductivity. We find the same conditions neglecting the latent heat (). Note that, assuming , usually leads to high temperature jumps.
2.3. Numerical modeling
In the following we briefly sketch the numerical modeling to motivate the next sections with a detailed description. The structure of the numerical approximation follows the mathematical model in the previous subsections. For the solution of the Euler equations (4) in the liquid or vapor region, a flow solver is needed that allows the treatment of a real equation of state. Let’s assume this is a finite volume scheme with any numerical flux. In the bulk regions no interface phenomena have to be resolved and the numerical flux may be based on any finite volume flux calculation. We use a Godunov-type scheme with an approximate Riemann solver. Away from the position of the phase interface the solution of the Riemann problem is the usual (single-phase) one with four constant states. In addition to the flow solver for every bulk region we need a coupling procedure that takes care of the jump conditions (10)–(13) at the interface, and we need information about the position of the phase interface. Hence, the numerical modeling consists of the following four building blocks for the sharp-interface resolution of two-phase flows:
-
(i)
Interface tracking method,
-
(ii)
Compressible flow solver for the bulk phases,
-
(iii)
Two-phase Riemann solver that takes surface tension and phase transition into account,
-
(iv)
Coupling method of the bulk regions at the interface.
The interface tracking provides us with the actual position of the interface at each time step. From the flow field we can interpolate values to this position from both sides, from the liquid and from the vapor region. The solution of a two-phase Riemann problem then estimates the velocity of the phase interface. This information is needed to calculate the time evolution of the interface in the tracking step. The two-phase Riemann problem solver also provides the time evolution of the states at the interface. These states from the left and right hand side at the interface are used for the coupling to the flow solver in the bulk phases. To avoid any mixing of liquid and vapor, a ghost fluid technique [17] is applied, by which the grid cells that contain the interface have two states – a liquid and a vapor state as given by the solution of the two-phase Riemann problem. With this information the bulk solver calculates the flow field in the liquid and the vapor region separately. The ghost cell approach avoids unphysical mixed states, for which an thermodynamic consistent mixing equation of state has to be designed.
The solution strategy is visualized in Figure 2. On the left-hand side, the part of the flow solver within the bulk phases are listed and the right side shows all interface related tasks. Assuming that the location and the geometry of the interface is known, the interface curvature is evaluated. The state in the liquid and vapor bulk phase at the interface as well as the curvature are used to determine the local solution based on a two-phase Riemann solver. This local solution is used to couple the bulk regions within a ghost fluid approach as well as for the definition the interface velocity that is needed to transport the interface, as already mentioned before.
In the following, Section 3, we first describe the most important building block in our list: The two-phase Riemann solver for the coupling of the bulk regions at the interface position. The treatment of the bulk phases is described in 4.1 followed by a short description of the interface tracking method in 4.2. A detailed description of the coupling method at the interface is given in section 4.3.
3. The two-phase Riemann problem
The coupling procedure that takes care of the jump conditions (10)-(13) at the interface uses the solution of a two-phase Riemann problem whose solution includes phase change and surface tension. This solution also provides the information about the interface velocity for the interface tracking method. The initial data of the Riemann problem is evaluated at the approximated position of the phase interface. This is described in detail in the following Section 4.3. Here we consider first the solution of the two-phase Riemann problem in the interface-normal direction.
In a local coordinate system, the Riemann problem states are , and an associated curvature value . The one-dimensional liquid and vapor state spaces are defined as
where is the normal component of the fluid velocity with respect to the phase boundary. With the Riemann solver we compute the interface bulk states , which result from the local interaction of the input data based on a chosen kinetic relation and on the reference temperature for the latent heat. From the technical point of view, the output of this section will be mappings of the type
| (21) |
The Riemann problem under consideration is now
| (22) |
Right: Typical wave structure for the exact two-phase Riemann problem with waves. The additional wave is the subsonic phase boundary.
We expect that the solution of this two-phase Riemann problem consists of four waves, one wave being an subsonic phase boundary with adjacent states , see Figure 3 right for some illustration. Exact Riemann solvers of this type can be found in [25, 15]. Note however that they do not cover the general kinetic relation (18) nor surface tension or latent heat.
We now provide the exact solution of the Riemann problem using an iterative scheme. The purely hyperbolic solution consists of three waves: two shock or rarefaction waves and a contact wave, as it is shown in Figure 3, left. Because we want to solve a two-phase problem for the kinetic relation (18), we will rely on a different wave fan. We propose to solve the problem by adding an additional phase boundary (see Figure 3, right). This artificial phase boundary is a discontinuous wave that is supposed to satisfy the jump conditions (10) to (13) and (16). In this way we preserve the jump conditions at least for fixed surface tension . All other waves are satisfy the standard Rankine-Hugoniot conditions and Riemann invariants.
The phase boundary is subsonic but might be faster or slower than the contact wave. Thus the phase of the state between the phase boundary and the contact wave is not known in advance. Any iterative scheme, that relies on one fan configuration will fail if the phase of the middle state changes, since ratios of specific volume and entropies are very different in the liquid and the vapor. Furthermore approximate states may belong to the spinodal region where the equation of state can not be evaluated. Note that we do not allow mixture states.
We propose to introduce an additional contact wave to overcome that problem. We start with four intermediate states and as it is shown in Figure 4, which will be determined by the root of a target function. The states and are connected by a left elementary wave (rarefaction or Lax shock wave) and and are connected by a right elementary wave. The states and are connected by the phase boundary. When the phase boundary propagates faster than the characteristic speed, then and are connected by the contact wave . In the other case and are the adjacent state of the contact wave and .
Let us now determine the target function whose root is the solution of the two-phase Riemann problem. Shock, rarefaction and contact waves are computed as in [14, Chapter \@slowromancapii@ Gas dynamics and reacting flows]. The phase boundary satisfies (10)–(13), (16), (18). The thermodynamic unknowns are chosen to be the specific volume and temperature, because we will later on use thermodynamic libraries that compute thermodynamic quantities in terms of .
Algorithm 3.1 (Evaluation of the target function).
Let the constant mean curvature , surface tension , entropy production constant , reference temperature and initial Riemann states , be given as constant input parameters.
Furthermore, assume that arguments of the target function
| (23) |
are given as actual guess.
The following steps determine the residuals for given arguments of . The algorithm returns the residuals and, in addition, an error flag, for , the mass flux and the propagation speed of the phase boundary.
- Step 1:
-
Evaluate pressures, specific entropies, inner and Gibbs free energies
for .
Abort if or and return the error flag.
- Step 2::
-
The left elementary wave determines and .
If , the left wave is a rarefaction wave andIf , the left wave is a shock wave and
- Step 3::
-
The right elementary wave determines and .
If , the right wave is a rarefaction wave andIf , the right wave is a shock wave and
- Step 4:
-
The contact waves determine (normal) fluid velocity and pressure in the adjacent states. Assign
- Step 5:
-
The mass flux through the phase boundary and its speed are
- Step 6:
-
The left contact wave propagates with speed , the phase transition with and the right contact wave with speed . The wave fan configuration is therefore known and the additional contact wave can be rejected, set
- Step 7:
-
The phase transition connects and , thus
with , .
The target function can be solved with a standard multidimensional root-finding algorithm. Note however that the function is not globally differentiable. Furthermore it may happen that the actual guess leads to a state in the spinodal region or the wrong phase. That is recognized by Step 1 in Algorithm 3.1 and an error flag is returned. We apply a damped Quasi-Newton method, that reduces the time step until all states are in the correct phases. The residual computed in Step 6 demands that the additional nonphysical contact wave vanishes, if the root-finding algorithm converges.
Algorithm 3.2 (Two-phase Riemann solver).
Let the arguments , , of function in (21) and the constants , , be given.
- Step 1:
-
Compute temperature from the initial states and assign the constant input parameters of Algorithm 3.1.
- Step 2:
-
Assign an initial guess , , , for the root-finding algorithm such that
holds.
- Step 3:
-
Solve and return , , .
4. Numerical solution strategy for compressible two-phase flow
In this section we describe how to use the solution of the two-phase Riemann problem for a sharp resolution of the interface and how the different building blocks interact. First, we give an overview about the flow solver for the liquid and vapor bulk phases. This is kept short because our flow solver is already described in other papers, [26, 27, 16], and, furthermore, other flow solvers may be used for this task. A description of the interface tracking method based on a level-set approach follows. The main topic of this section is then the consistent coupling of the bulk phase solutions at the interface in a way such that it remains sharp. This is established by the use of the interface Riemann solver in combination with a ghost fluid method.
4.1. Flow solver for the bulk flow
The flow solver in our simulations is a discontinuous Galerkin spectral element method (DGSEM) with a local finite-volume sub-cell refinement at the interface [16]. Within the sub-cells a second order finite volume scheme is applied to increase the interface resolution and stability of the numerical scheme. Note that in both numerical methods the degrees of freedom (DOF) in one cell are equal. Thus, for the description of the numerical resolution in Section 5 we use the general term DOF that is independent of the approximation order used in the DG scheme. One DOF represents one grid sub-cell in the context of finite-volume schemes and one polynomial coefficient in the DG context.
We restrict ourselves to a standard finite volume method for the description of the numerical strategy, which solves numerically the Euler equations (4) in the bulk phases with a general equation of state. For fluid flow without phase transition, this numerical strategy is described in detail in [16].
The finite volume scheme approximates the integral formulation of the conservation equation over every grid cell :
| (24) |
where denotes the vector of the conserved variables, denotes the flux tensor, and denotes the outwards pointing normal vector on the grid cell surface . At the grid cell boundaries within the bulk phases we use numerical flux calculations composed of an approximate solution of the single-phase Riemann problem. In the simulations presented in this paper, the HLLC scheme is applied (see e.g., [28]). At the grid sub-cell boundaries that form the phase interface we apply the solution of the exact interface Riemann solver. This coupling is described in section 4.3. The integrals in (24) are approximated by the midpoint rule. For time integration, we use a standard explicit Runge-Kutta method.
4.2. Interface tracking
For the sharp interface approximation we need an interface tracking method that evolves the interface and provides the actual location. Besides the position, we also need the interface curvature to evaluate surface tension effects. Here, we rely on a level-set method [29]. The level-set function is initialized as an approximated signed distance function. The time evolution of is calculated by
| (25) |
Note that we reformulated the level-set equation into the divergence form and source term that is more convenient for our numerical approach. It is approximated by the same numerical method as the solver for the bulk flow. For the level-set equation we need a velocity field that coincides at the interface with the local interface velocity that is determined by the interface Riemann solver.
The approximation of the level-set equation (25), as well as the estimation of the interface normals and the curvature , is described in detail in [16] and is based on a-posteriori reconstruction of the level-set function. These quantities are estimated using the level-set gradients in the vicinity of the interface.
4.3. Coupling at the interface
Coupling procedure at the interface
The methodology is sketched in Figure 5 within a one-dimensional domain. The interface tracking algorithm provides the position of the phase interface as the zero point . In Figure 5, this position is marked by . To avoid numerical diffusion we shift the phase interface to the grid cell boundary of the nearest neighboring grid cell. The extension to multiple dimensions is sketched for the two dimensional case in Figure 6. At the shifted position we solve the two-phase Riemann problem as described in the previous section. The Riemann solver is applied along the approximated interface normal , evaluated at the integration point of the grid boundary. The solution of the two-phase Riemann problem provides three quantities: The state of the vapor phase, the state of the liquid phase at the interface and the interface velocity in the interface normal direction . The states are then used in the flux calculation and in the liquid and vapor bulk phases. Hence, in Figure 5, the interface liquid state is the left state for the flux calculation in the liquid bulk region, while the gas state at the interface is the right state for the flux calculation in vapor bulk region. The grid-normal part of the fluxes and is then used for the flux summation within the bulk phases. This procedure accomplishes the sharp resolution of the interface and imposes the jump conditions described in (10)-(13). But, of course, the guarantee of the exact conservation of mass, momentum and energy at any time is lost.
Within the bulk phases standard approximate Riemann solvers are applied, whose fluxes are named by in Figure 5.
Computation of the two-phase solution
The application of the two-phase Riemann solver at a quadrature point of the approximated interface position may be split into six steps:
-
(i)
In each bulk phase we extract the states. For simplicity, we name these states at the interface in the liquid phase and in the vapor phase.
-
(ii)
For the states and the mapping (21) to the two-phase Riemann solver framework is applied to compute
The states and are then the input data for the two-phase Riemann solver of Algorithm 3.2. The interface normal vector is estimated using the level-set field (see Section 4.2) evaluated at the position of the surface integration point on the approximated phase interface.
-
(iii)
With the data and the solution of the two-phase Riemann problem (as described in section 3.1) is solved.
- (iv)
-
(v)
We use the solution states and for the flux calculation and calculate the numerical fluxes and for the liquid and vapor phase.
-
(vi)
In a last step, we project the numerical flux onto the grid normal direction
For the advancement of the bulk flow we consider only the grid normal component of the interface flux. This is consistent with the evaluation of the Riemann solution normal to the grid cell boundary in the single-phase case. Note that we use the flux solely for the propagation of the liquid phase and the flux solely for the vapor phase.
Interface update
With the solution of the fluxes at the surface integration points of the numerical interface, we have all information needed to advance the bulk flow in time. Using the information about the interface advection velocity we update the position of the interface and compute the corresponding interface normal vectors as well as the interface curvature . These approximations are the input for the calculation of the two phase Riemann solution in the next time step.
Interface movement
If the tracked interface position, as defined by the zero level of the level-set function, has moved across one grid cell, the numerical interface is updated accordingly. This implies that the state in this cell has to be re-defined according to its new fluid affiliation. As no information is available, the state is defined by using information from the surrounding grid cells
| (26) |
with
| (27) |
This state averaging is done for all surrounding nCell cells of the same fluid phase (in 3D: nCell ). As the extrapolation occurs in small cells at the interface, it has only a minor impact on the solution.
5. Validation of the Riemann solver, the numerical method, and numerical examples
In the first part of this section the influence of parameters on the solution of the Riemann problem as obtained by Algorithm 3.2 is studied. In particular, entropy production coefficient , reference temperature and surface tension are varied. This is followed by a convergence study of the numerical method and a verification of the long-time behavior within a closed, domain. In a second step the mass transfer modeling is validated based on experiments for rapid evaporation processes. In all these cases, we restrict ourselves to one-dimensional simulations. To validate the multi-dimensional implementation the results for a two-dimensional simulation of an evaporating droplet are compared to a one-dimensional simulation in cylindrical coordinates. The approximation of surface tension effects is validated by an oscillating droplet test case and the features of the numerical two-phase method are shown by a shock- droplet interaction.
The numerical validation is performed for the fluid n-dodecane. An EOS was introduced by Lemmon&Huber [30] for this fluid that predicts the thermodynamic fluid behavior within wide pressure and temperature ranges. Due to n-dodecanes retrograde behavior, adiabatic evaporation waves may appear, which have been investigated experimentally, e. g. by Simoes-Moreira&Shepherd [20].
We estimate the entropy production constant in the kinetic relation (18) at the interface using density functional theory estimate of Waibel [31]. The values are obtained numerically for the fluid octane. In the following we assume that the computed value is a proper estimate of for the whole family of alkanes.
5.1. Parameter study for the Riemann solver
We apply the Riemann solver as introduced with Algorithm 3.2 in Section 3. All results refer to the EOS for n-dodecane.
5.1.1. Influence of entropy production coefficient
The first example addresses the influence of the entropy production coefficient on the solution of the Riemann problem. The initial conditions under consideration are
| (28) |
with . We have give here and below the initial data in (overdetermined) primitive form to plain the thermodynamical conditions. The surface tension coefficient and the reference temperature are chosen to be
The pressure of the Riemann problem solution as described in Section 3 is shown in Figure 7 for different values of entropy production (one of them being the generic value from the introductory remark). The solutions start with a rarefaction wave followed by an evaporation wave (phase boundary), a contact discontinuity, and finally a shock wave. Note that the slope of the rarefaction wave is quite strong in the chosen spatial scaling. The results indicate how the variation in influences the predicted mass flux rates and the interface speed. In fact, the speeds of the evaporation wave are
5.1.2. Influence of reference temperature and surface tension
For the second test problem we vary the reference temperature and the constant curvature . We consider the initial states
| (29) |
with .
The entropy production rate is (18) with and the surface tension coefficient is .
The solution has the same wave pattern as in the previous example.
Figure 8 shows the solution for different values of the reference temperature and surface tension.
Differences in the reference temperature result only in slightly different solutions. The corresponding results are plotted
in black as straight or dashed lines.
The structure of the solution is quite the same, but the values of the constant states are different. The speed of the evaporation wave
varies and is
The gray lines in Figure 8 correspond to solutions with different .
As expected, the capillarity forces affect the pressure of the solution in particular. Temperature and fluid velocity nearly coincide with the solutions obtained for . The amount of surface tension in the first case (gray solid line) corresponds to a droplet of m diameter. The gray dashed line corresponds to a bubble with the same diameter as only the sign is altered.
5.2. Validation of the numerical method on exact solutions of the two-phase Riemann problem
Up to now we considered only the exact multi-phase Riemann solver 3 for varying parameters. Next we validate the numerical method from Section 4 in the one-dimensional case. The test problem is the same shock-tube problem with resolved evaporation effects as used in Section 5.1.1 for entropy production coefficient , and reference temperature K. The benchmark solution is now computed from Algorithm 3.2.
The initial states induce an overheating of approximately K on the liquid side and an overheating of K on the vapor side, which results in a strong evaporation rate at the interface.
In Figure 9 the comparison between the numerical (small circles) and the benchmark (continuous line) solution is plotted at s. The numerical solution was obtained using 200 degrees of freedom (DOF) in the unit interval. The exact solution and the approximate two-phase Riemann problem solution coincide very well. The wave pattern is also correctly recognized by the numerical scheme. A shock wave runs to the right hand side and is smeared out by the numerical dissipation over a couple of grid cells. The phase boundary is sharply resolved and can be clearly seen either in the density, or in the velocity plot. Both the contact and phase boundary are close together – the right jump is the contact while the left one is the sharp phase boundary. The left running (steep) rarefaction wave is clearly visible in the pressure plot.
The error norms and the order of convergence are shown in Table 1. Although the phase boundary is sharply resolved across one cell the experimental order of convergence is only with respect to the -norm. This is due to the occurrence of the contact wave in the Riemann pattern.


| # DOF | -error | EOC |
|---|---|---|
| 40 | 5.4111e-03 | |
| 80 | 3.7964e-03 | 0.5113 |
| 160 | 2.7627e-03 | 0.4585 |
| 320 | 1.9751e-03 | 0.4842 |
| 640 | 1.4203e-03 | 0.4757 |
| 1280 | 1.0240e-03 | 0.4720 |
5.3. Validation of the numerical method by long-time behavior
The purpose of the this test case is to study the long-time behavior of the numerical method for a one-dimensional domain. If appropriate boundary conditions (see below) are applied it is expected that the exact solution converges for to a static two-phase equilibrium.
The long-time behavior is investigated using a closed one-dimensional computational domain. In the numerical method we apply wall boundary conditions that imply that the velocity is zero at the boundaries.
Thus, the total mass and energy inside the computational domain is conserved.
We performed a simulation for the initial conditions (28) over a
physical time of . For the final time, the numerical solution remains static and the states are summarized in Table 2. This equilibrium solution is compared with the saturation states , , evaluated for the liquid temperature K.
It can be observed, that for long simulation times the states at phase equilibrium are reproduced. Due to evaporation effects, the density increased in the vapor phase and decreased in the liquid phase to their respective saturation values in accordance with the theory. The remaining temperature gap is due to the non-unique static interface, see Remark 2.2.
| numerical method | Phase equilibrium | |||
|---|---|---|---|---|
| vapor | liquid | vapor | liquid | |
| Density [] | 5.802 | 584.027 | 5.801 | 584.024 |
| Pressure [bar] | 1.294 | 1.294 | 1.294 | 1.294 |
| Temperature [K] | 499.99 | 500.03 | 499.99 | 499.99 |
5.4. Comparison to experiments with explosive evaporation/boiling
The numerical model is compared to published literature data for explosive boiling/evaporation for the fluids n-dodecane, propane and butane. Note that in these experiments fast phase change processes take place. We compare quantitatively the results of the present approach to the experiments of Simoes-Moreira&Shepherd [20] for the fluid n-dodecane and to the experiments of Reinke&Yadigaroglu [21] for the fluids propane and butane.
5.4.1. Shock tube experiments with n-dodecane
We compare the phase velocity of the evaporation front to the measurements of Simoes-Moreira&Shepherd [20]. They investigated stable evaporation waves in superheated liquid n-dodecane (critical temperature K, molar mass ) at different initial temperatures. These experiments have been chosen also by Saurel et al. [1] and Zein et al. [2] for the numerical validation of their phase transition method. Their approach is based on the homogenized Baer-Nunziato model, together with a thermodynamic relaxation procedure to account for phase transition effects.
For initial conditions it is assumed that the liquid is in the saturation state at the given initial temperature of the experiment, as described in [20]. On the vapor side, a constant (low) pressure of bar is assumed. These initial conditions correspond to the experimental measurements.
In the experiments of Simoes-Moreira&Shepherd [20], the liquid n-dodecane is relaxed into a reservoir with low pressure resulting in an evaporation wave with choked flow on the vapor side (“choked series”) for various initial liquid temperatures. In the experiments, the pressures on both sides of the evaporation wave as well as the speed of the evaporation wave are measured. However, it was not possible to measure directly the densities in the bulk phases. In our numerical simulations the evaporation front speed is estimated as the speed of the phase boundary based on the jump conditions at the interface. The estimated wave speeds of the evaporation wave are visualized in Figure 10 (top figure) for different initial liquid temperatures including a comparison to the simulations of Saurel et al. [1] and Zein et al. [2].
For low investigated temperatures the experimental results are well reproduced underestimating slightly the measured front speed of the evaporation wave. For higher temperatures there is a slighter increase of the speed compared to the experimental as well as the other numerical results. It seems that the assumed micro-scale model is not accurate for large interface pressure jumps. This might be related to the modeling of the entropy production coefficient for these conditions or the discontinuous temperature at the interface.
The comparison for the isothermal series at K in [20] is shown in the lower diagram of Figure 10 using different reservoir pressures . Note that above a reservoir pressure of bar no stable evaporation waves could be observed experimentally. For reservoir pressures bar our approach reproduces the experimentally observed wave speeds well up to pressures of bar. However, for very low reservoir pressures ( bar) the front speed decreases again, as opposed to the measurements. This might be related to the already discussed inaccuracy for large pressure jumps. For higher pressure we observe a linear decrease of the evaporation front velocity. This should be due to the assumed micro-scale model because static phase boundaries under non-saturated conditions would require a different kinetic relation, see [5].
5.4.2. Butane and propane evaporation experiments
Reinke&Yadigaroglu [21] investigated the explosive boiling of various liquids and developed a correlation for the evaporation front speed from their experiments. They expanded experimentally a saturated liquid at a superheated temperature to a state at ambient conditions ( bar). From the experimental data they correlated the front speed using the nominal superheat as the dependent variable. The nominal superheat is defined as
| (30) |
relative to the initial temperature of the liquid and the saturation temperature of the fluid at bar. For butane this temperature is equal to K and for propane K.
We compare the evaporation front velocities for butane (critical temperature K, molar mass ) and propane ( K, ) during the expansion process for various initial superheats. The temperature dependent values for the entropy production coefficient are taken from [31], evaluated at the corresponding initial temperature of the liquid phase.
The numerical results are plotted in Figure 11 together with the experimental measurements of Reinke&Yadigaroglu [21] and their linear correlation in terms of the nominal superheat . All numerical results for K (butane) and for K (propane) are within the 80 % confidence limits of the experiments. The trend of increasing front speed for increasing superheats is reproduced by the numerical approach.
For low nominal superheats, the velocity of the evaporation wave is slightly overestimated. This is due to the occurrence of phase boundaries under non-saturated conditions. Such conditions would require a different kinetic relation, see [5].
5.5. Two-dimensional validation of the numerical method
5.5.1. Diagonal interface test case
The next test problem for validation uses a one-dimensional Riemann problem, introduced in
Section 5.1, as planar solution in two space dimensions.
We consider an initial setting such that the initial states are separated by a diagonal line at an angle of
(see Figure 12). The grid is a Cartesian grid, such that the exact solution, in particular the phase boundary, is not aligned to the grid.
For the calculation of the discretization error, we consider the following (generic) Riemann problem with phase transfer We consider the setting as in Section 5.1 for the fluid n-dodecane. The initial states are given by
| (31) |
Despite the coarse numerical staircase approximation of the interface, the interface resolution is coincides well with the exact solution. The numerical solution (cut along the normal) is shown in Figure 13 in comparison to the exact solution. Slight disturbances due to the interface approximation are visible directly next to the interface location. They diminish with increasing distance from the interface or by refining the grid.


5.5.2. Circular droplet
The previous test case validates the numerical approach for a simple planar interface but does not take into account surface tension effects.
We compare in the following the numerical method for a two-dimensional circular droplet to the numerical solution solution for the equations in
spherical coordinates. The numerical strategy for the radially symmetric approach is e. g. described in [28].
The initial conditions for the test case are chosen identical to the test case in Section 5.5.1.
Instead of a diagonal interface geometry, a circular interface with a droplet radius of mm is chosen together with a constant surface tension coefficient of , a realistic estimate for n-dodecane.
In the two-dimensional computation 160 DOF are used to discretize the whole droplet while for the one-dimensional reference simulation a total of 400 DOF is used. Hence, the one-dimensional simulation has a much finer resolution and is regarded as reference solution. In comparison to the previous test case, the states between the waves are no longer constant.
The numerical results of the one-dimensional radial-symmetric and two-dimensional approach are compared in Figure 14. The results at a one-dimensional slice along the -axis is presented in Figure 14. The two-dimensional results are in good agreement with the one-dimensional reference simulation assuming spherical symmetry. Some over- and undershoots in the two-dimensional numerical solution are due to the approximation on the coarse grid. But the multi-dimensional implementation reproduces well the results of the one-dimensional approach assuming spherical symmetry. A three-dimensional view of the test case is presented in Figure 15 visualizing the wave structure of the test case and the sharp resolution of the phase interface.


5.6. Oscillating droplet
The inclusion of surface tension forces in the Riemann solver at the phase interface is validated for an oscillating droplet test case. In this investigation, the case with resolved phase transition effects is compared to the case without. In contrast to the mathematical model and the other numerical examples, we account for viscosity and heat conduction in the bulk phases. With phase transition, the Riemann solver described in Section 3 is used. Without phase transition, a simpler linearized Lax-Curve Riemann solver as described in [32] is applied. The influence of evaporation onto the droplet oscillation frequency has been investigated, e. g., by Schlottke&Weigand [33] in an incompressible simulation.
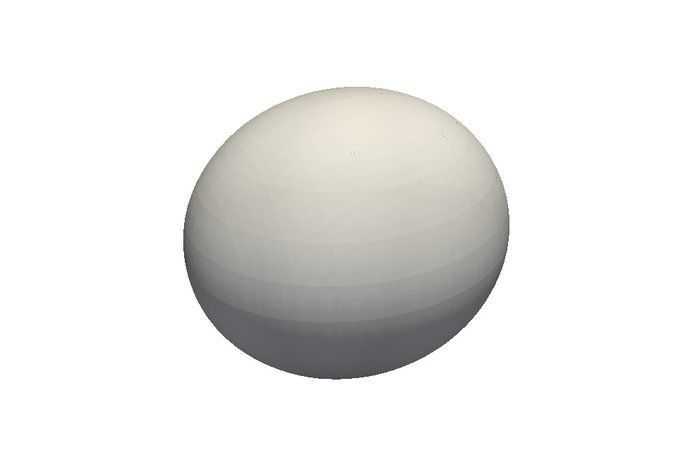
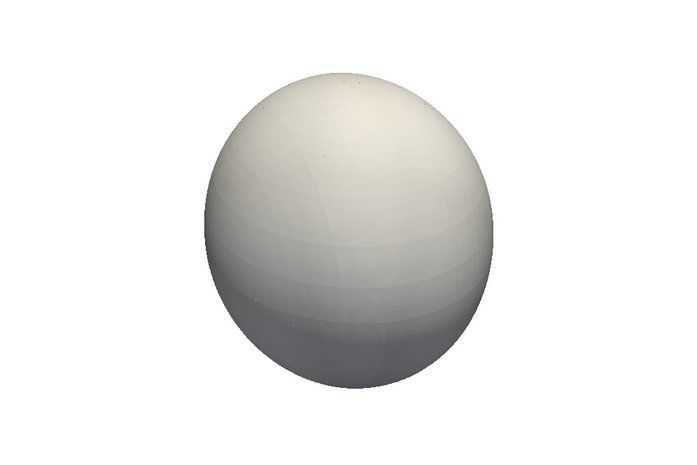
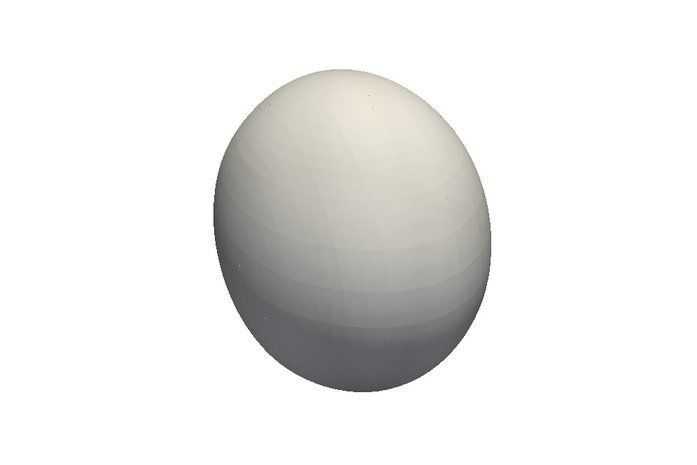
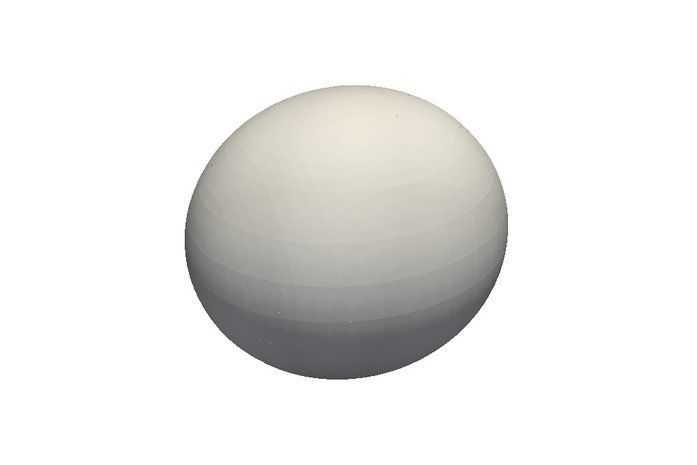
In this validation problem we investigate an initially deformed droplet with the semi-axes and as plotted in Figure 16. The initial radius is chosen as mm and the radius of a corresponding spherical droplet is . Due to surface tension forces acting at the phase interface, the droplet starts a periodic oscillation that diminishes with time due to the influence of viscosity to a sphere. Hence, in this test case, we also account for viscosity and heat conduction using a standard numerical diffusion flux called BR1 [34]. We consider realistic viscosity estimates based on the local flow conditions in the bulk phases. For the initial conditions a viscosity ratio of and a ratio of the heat transfer coefficient is present. The values for viscosity and heat transfer coefficient are estimated based on the correlation of Mulero et al. [35]. In the final stage, a spherical droplet is obtained whose interface pressure jump fulfills the Young-Laplace equation.
In the numerical simulation the droplet is located within a computational domain of mm and at the domain boundary wall boundary conditions are applied such that impinging waves are reflected at the boundaries. A numerical resolution of 96 DOF in each axis direction (about 900.000 DOF in total) is used to ensure the resolution of all effects within the computational domain. The oscillation frequency of the droplet obtained is compared to the analytical investigations of Lamb [36] for droplets without gravitation effects. He found the resonance mode frequency of the oscillation mode the following analytical relation
| (32) |
assuming a droplet with small oscillation amplitudes in vacuum or air neglecting the influence of gravity. For the oscillation of the ellipsoid, the second mode is of importance with the analytical frequency
| (33) |
This analytical model is valid for small oscillations and was derived for an incompressible fluid.
The focus of this test case is on the validation of the surface tension forces. Thus, we apply initial conditions at the thermodynamic equilibrium for K for which evaporation effects should be negligible.
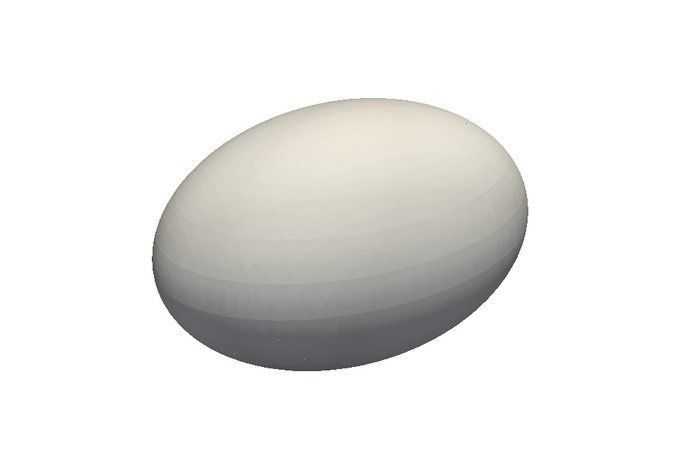
ms
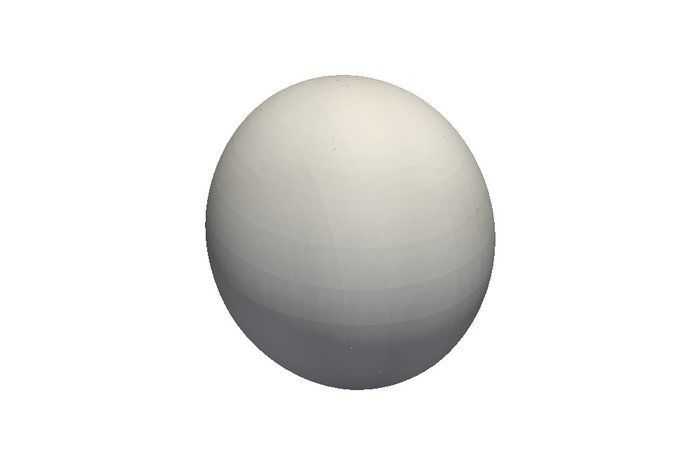
ms
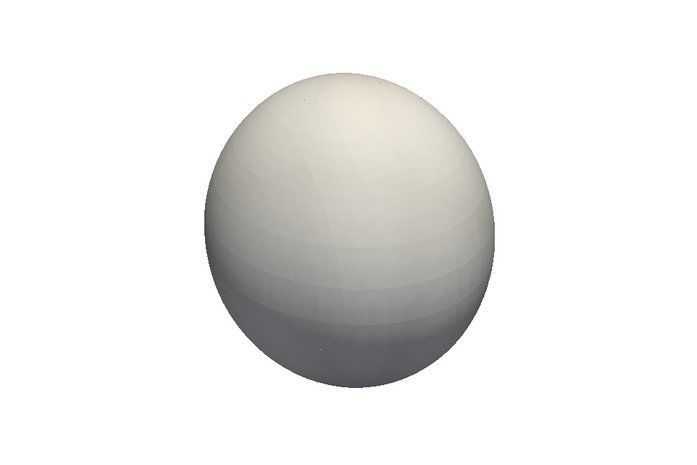
ms
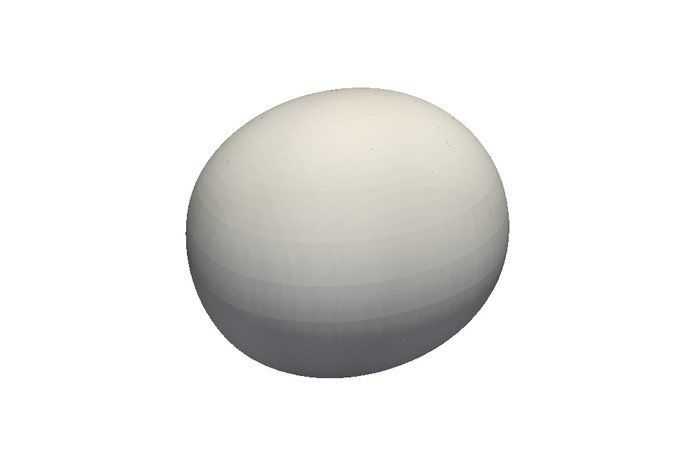
ms
ms
ms
ms
ms
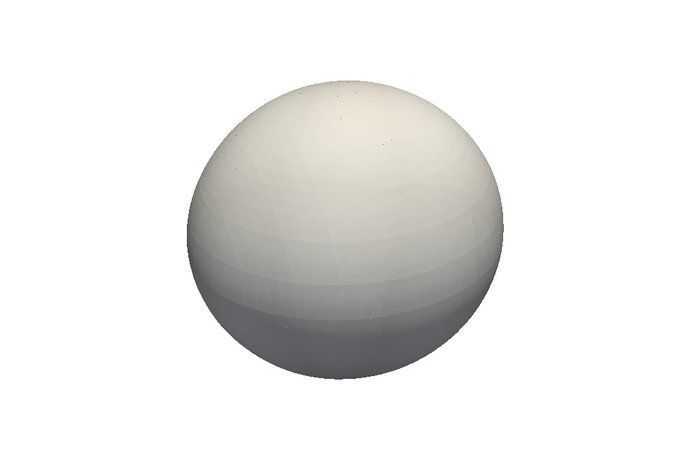
ms
In Figure 17 the surface ratio during two oscillation periods is visualized and the resulting oscillation amplitude is plotted over time in Figure 18. Due to the influence of viscosity and heat transfer in the bulk phases, the oscillation amplitude diminishes with time. In the final state a spherical droplet with the equilibrium radius is reached. Included is the comparison without phase transition that is calculated using the methodology described in [16] and the linear Riemann solver in [32]. The oscillation frequency coincides with the analytical frequency of Lamb in both cases. However, due to evaporation and condensation, the droplet mass is changing and as a result the oscillation frequency changes. This has a small effect on the frequency as seen in Figure 18. Another effect is that due to phase transition effects the oscillation amplitude does not decay to that extend. This might be an effect of the ejected mass at the interface that acts like an additional interface force that increases the oscillation amplitude.
5.7. Shock-Droplet interaction
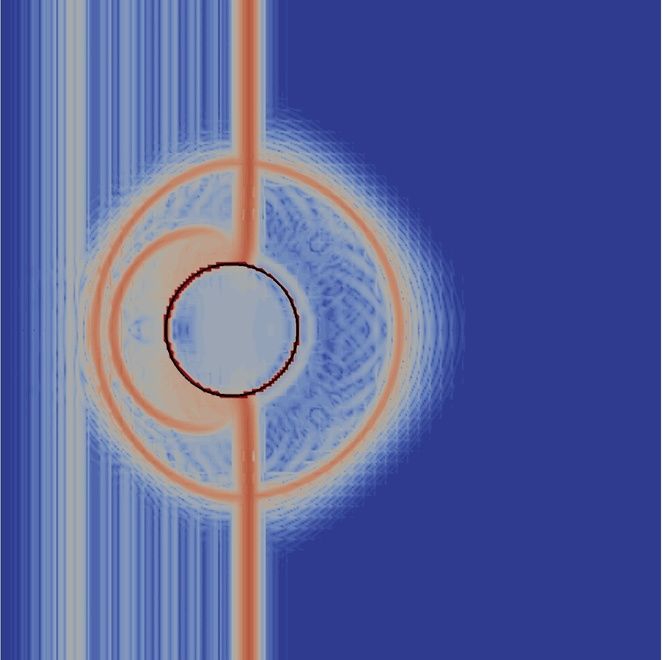
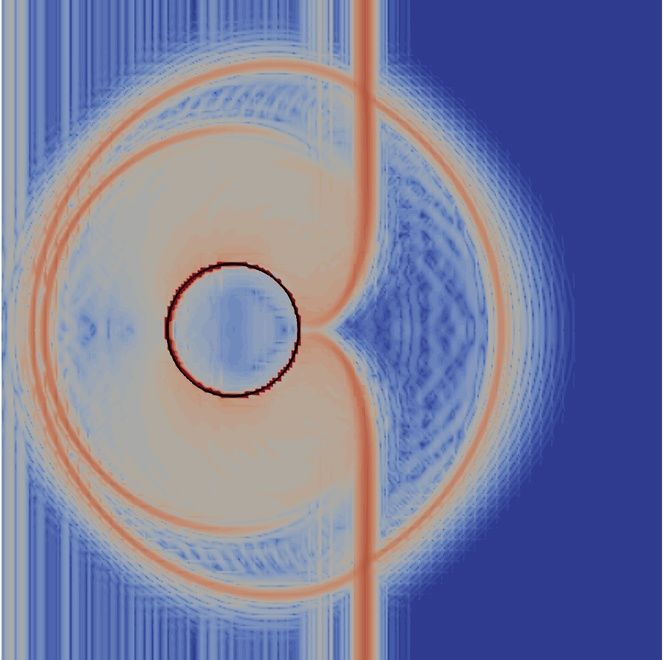
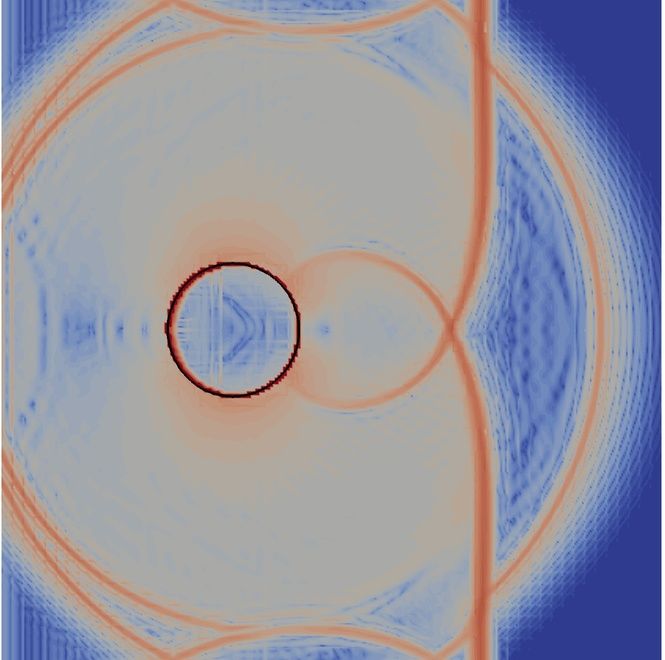
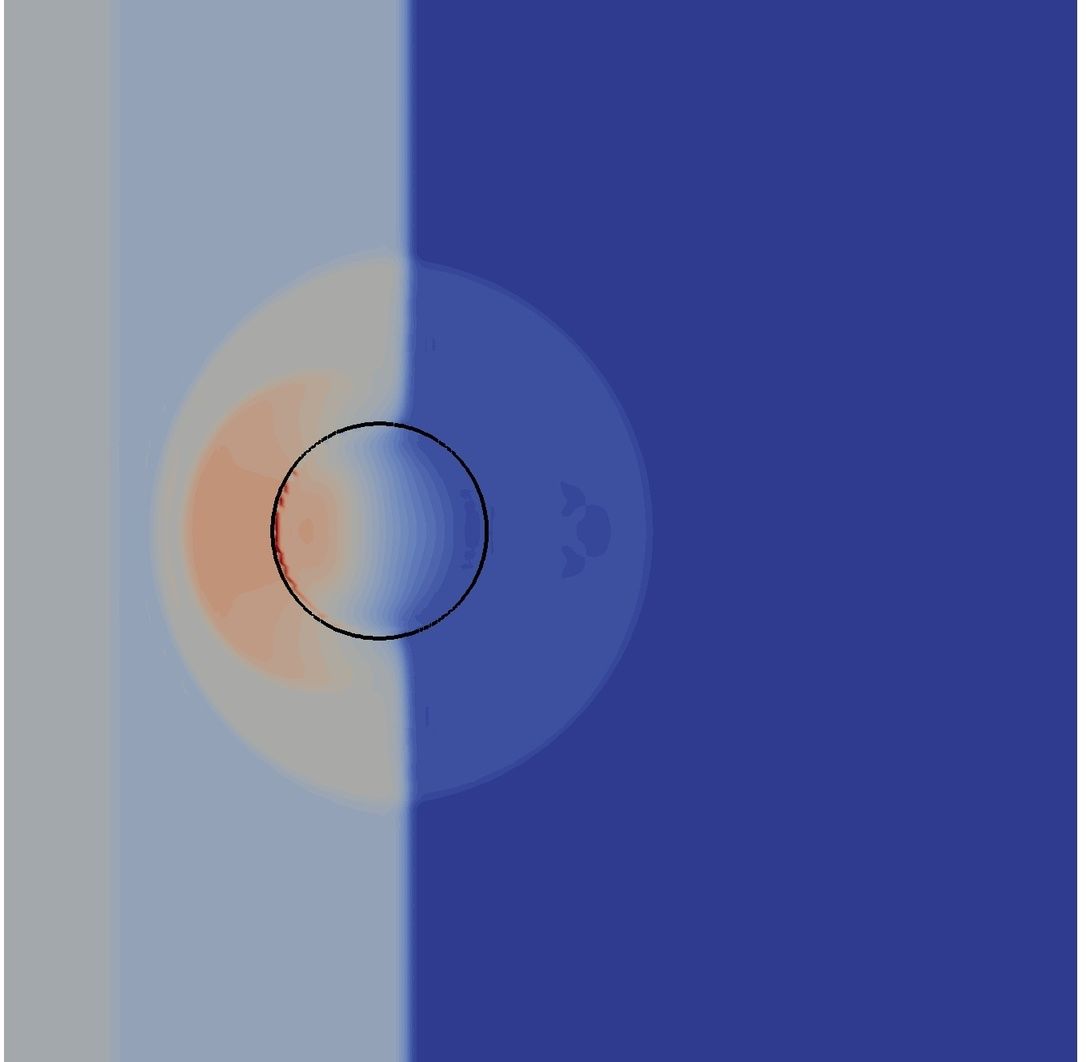
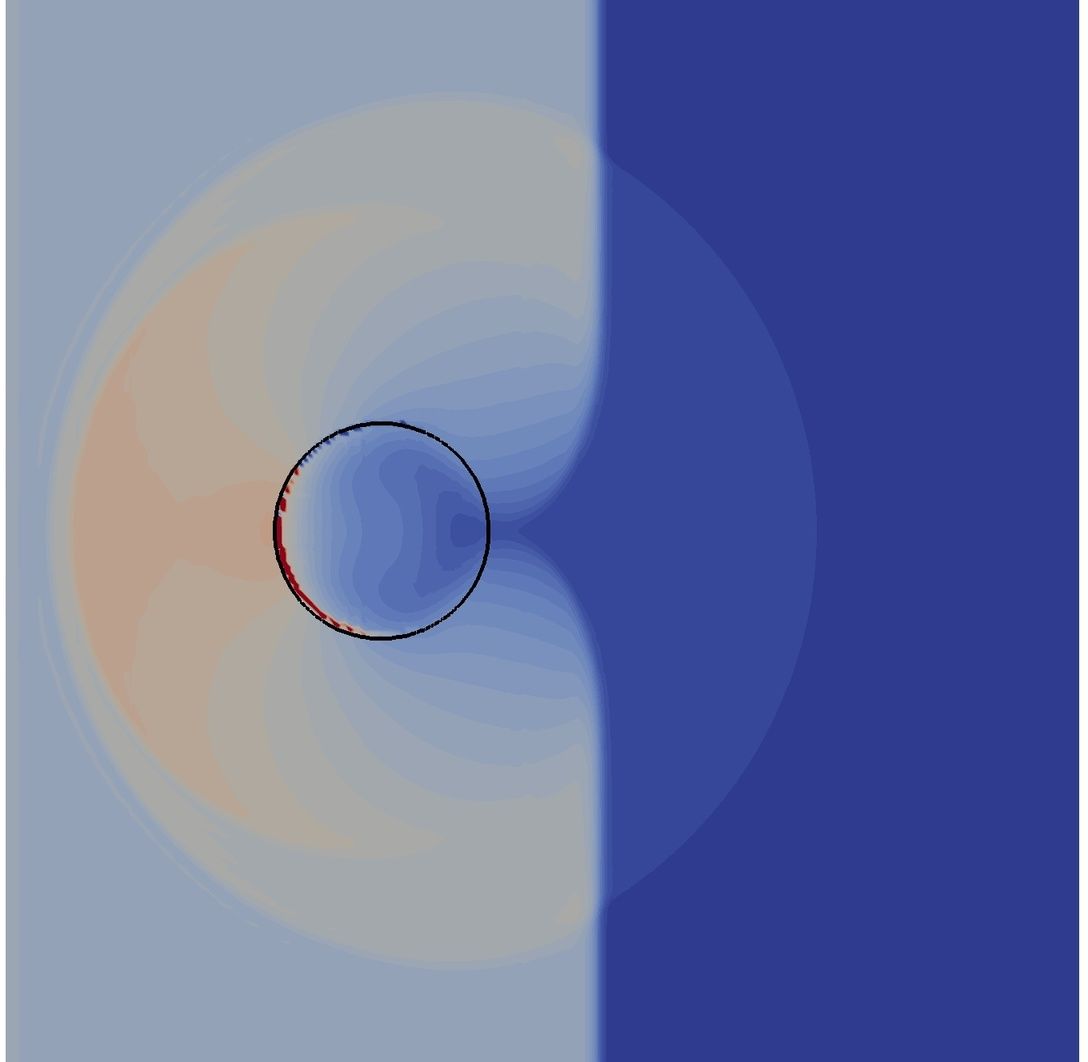
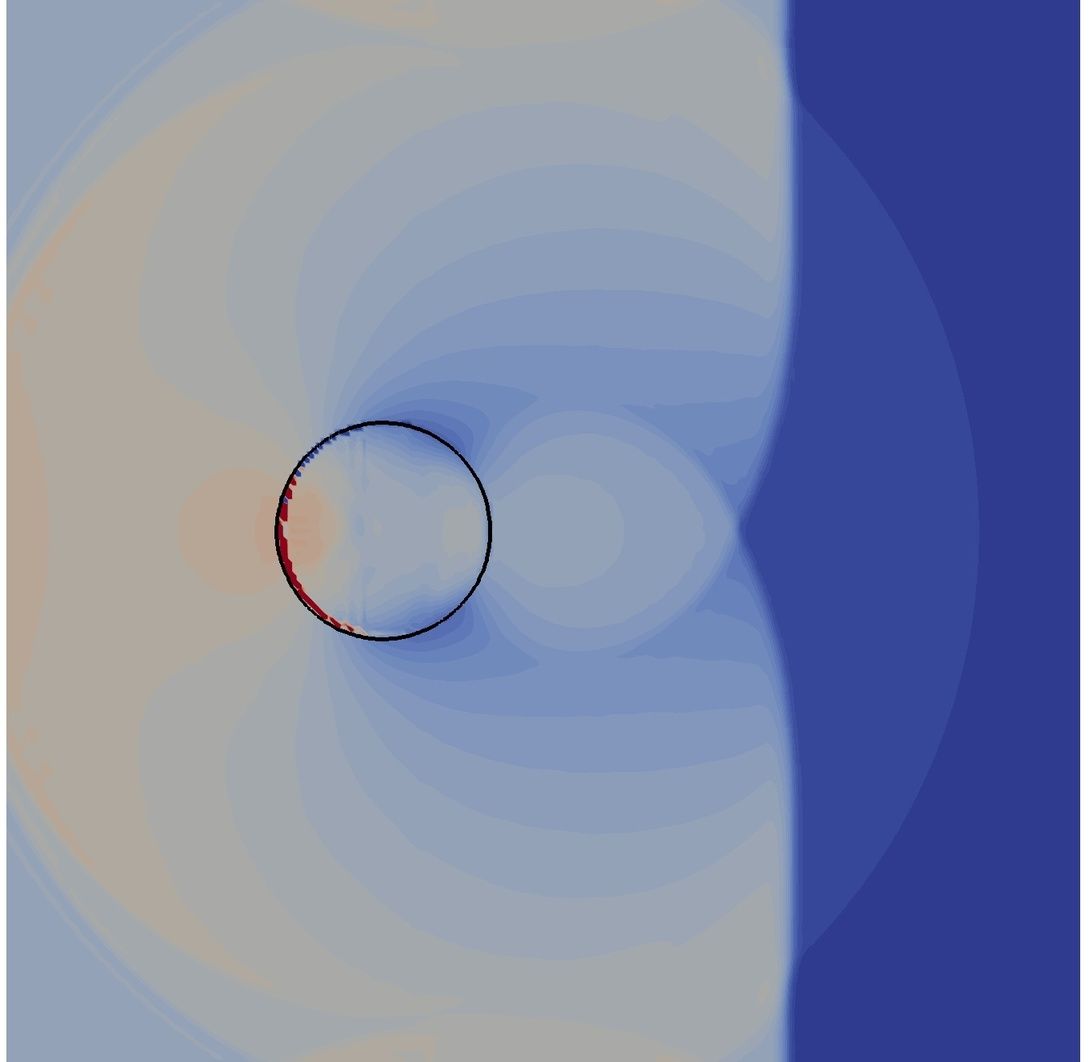
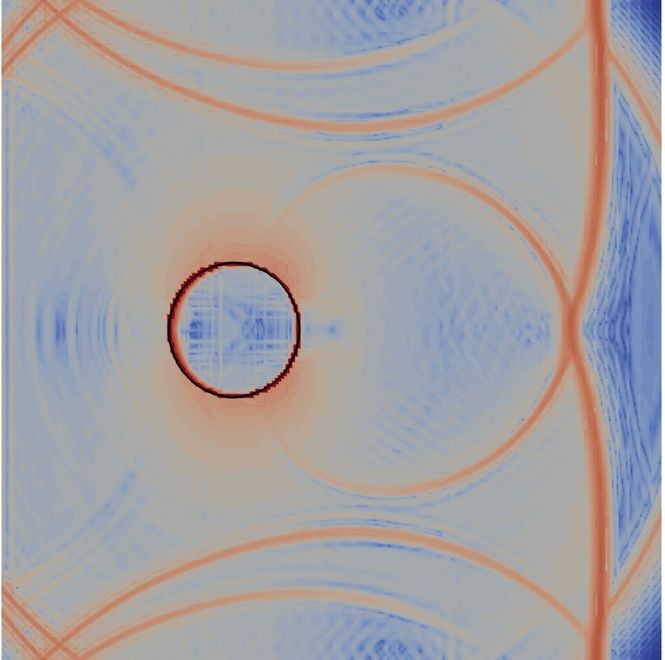
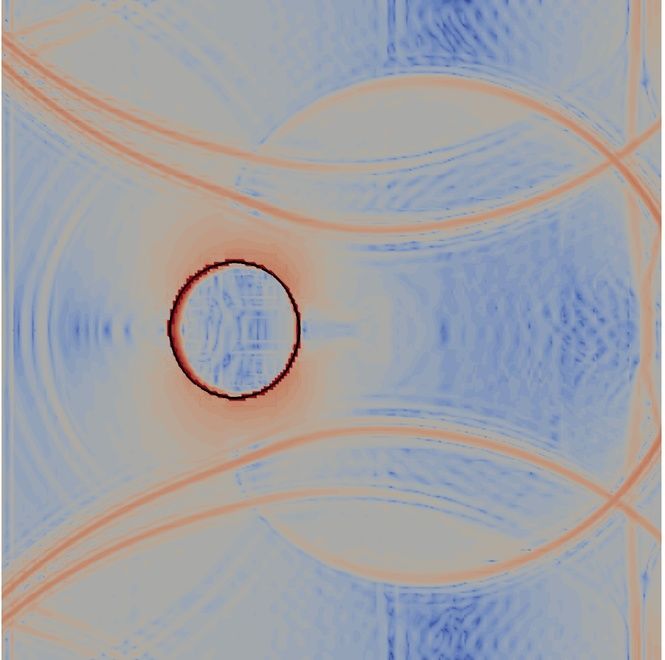
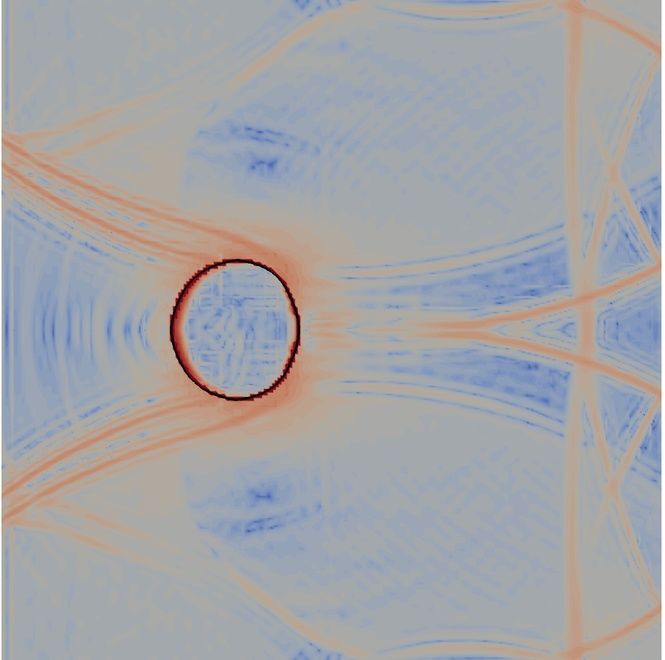
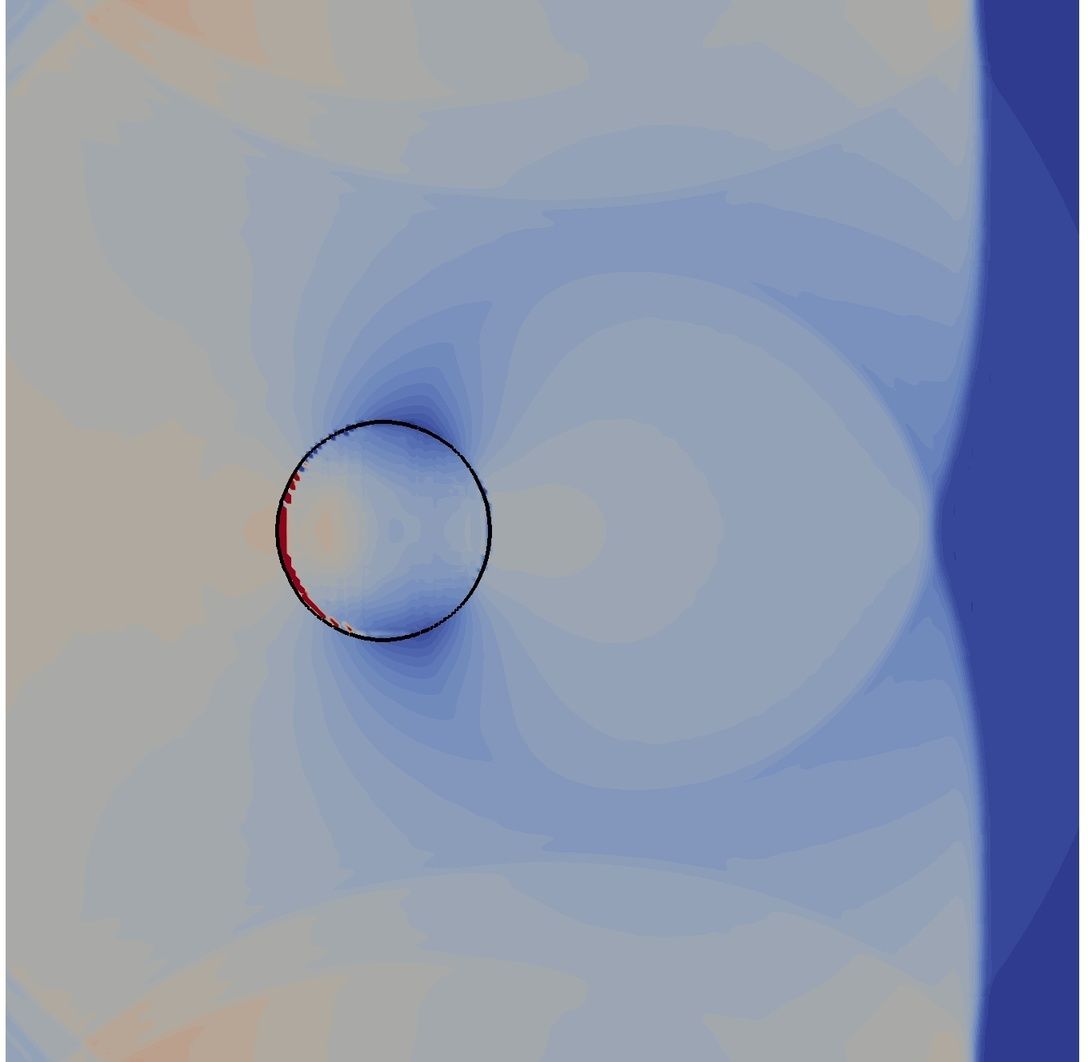
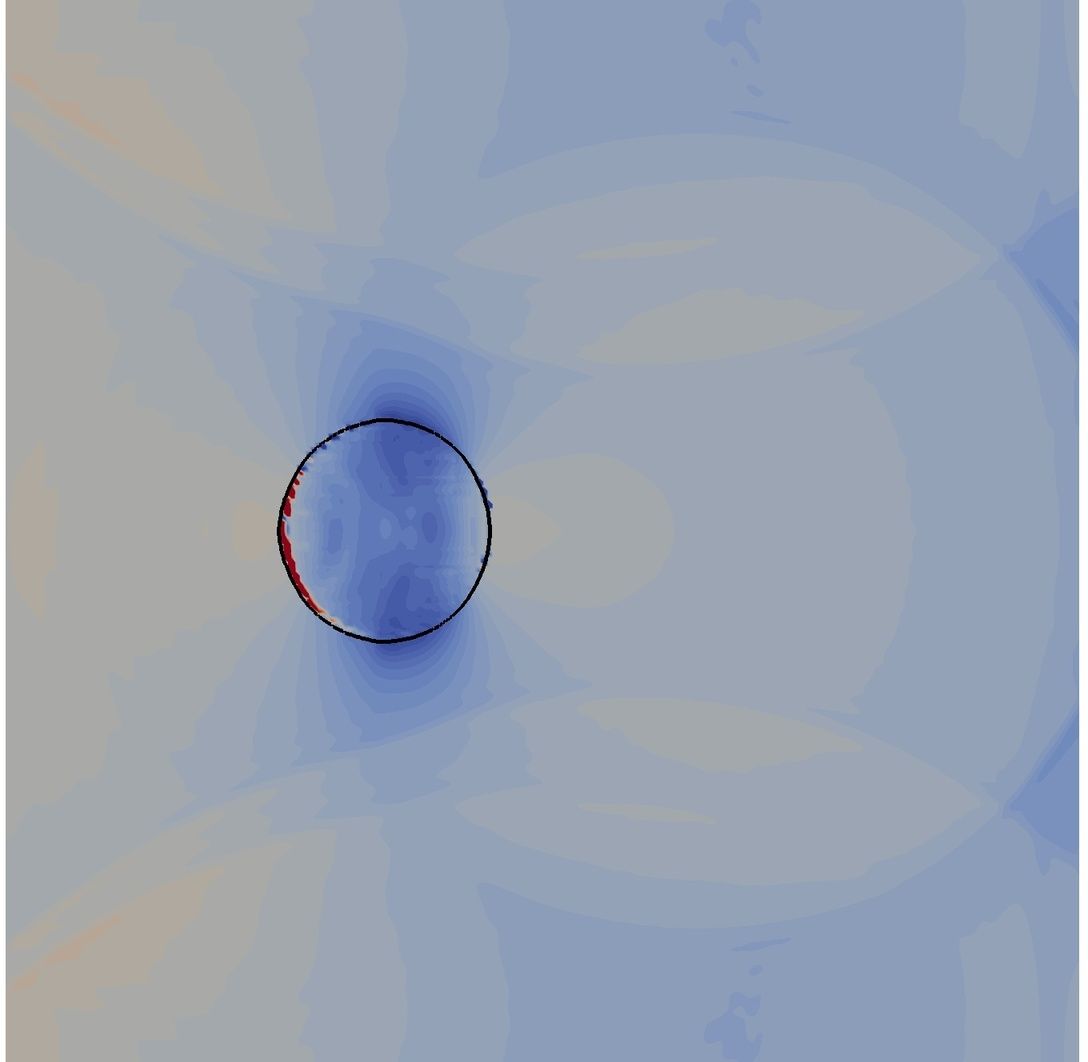
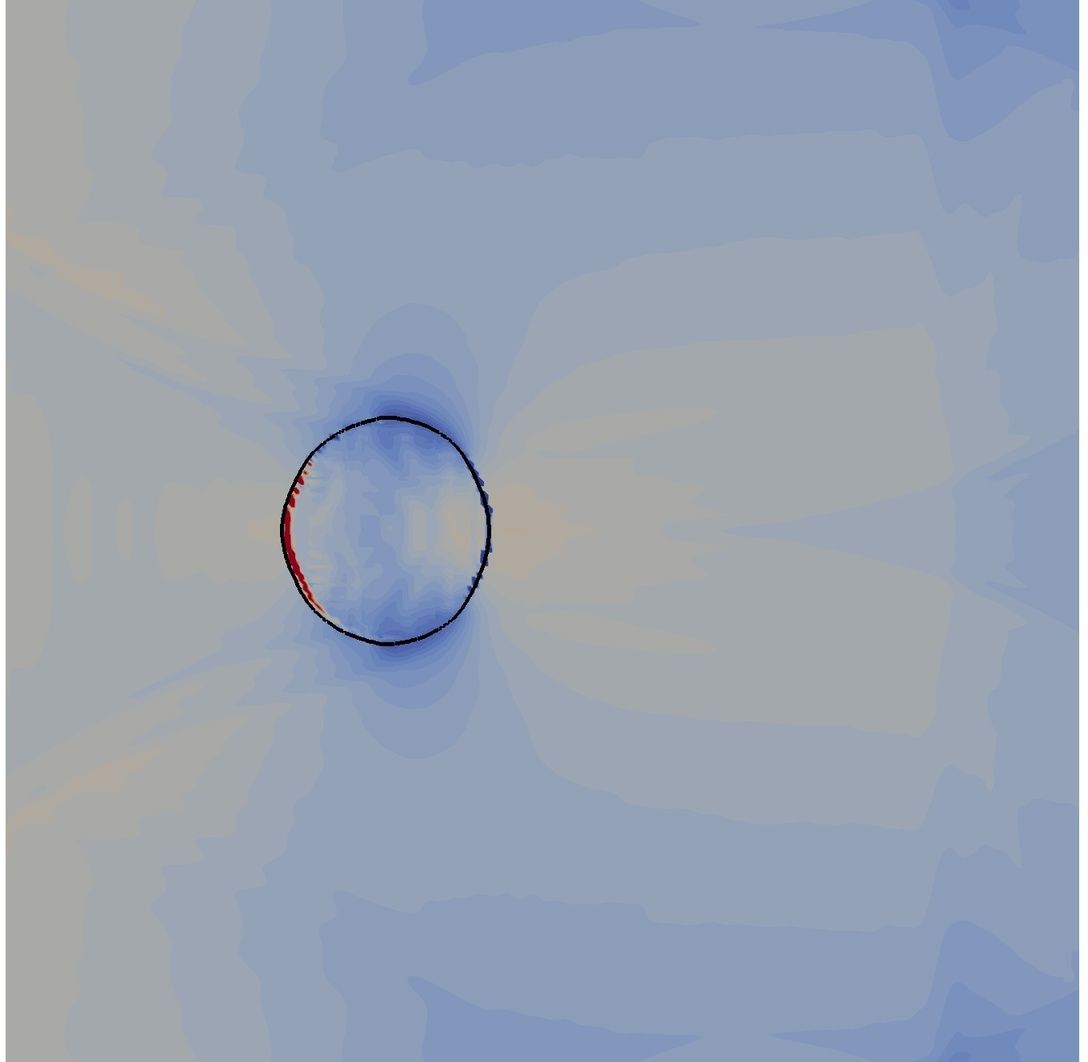
This test case is used to validate of correct wave propagation at the interface in a compressible flow field. A shock wave of Mach number is impinging onto a n-dodecane droplet at rest. The impinging shock wave is partially reflected on the droplet surface and is partially transmitted into the droplet. Inside the droplet the shock wave travels at a higher speed due to the higher sound velocity in the liquid phase. Due to the post-shock momentum of the flow, the droplet gets deformed.
The initial conditions and the computational domain used for the simulation are defined as in Figure 19. Initially the shock is placed at mm within the computational domain of mm. The shock-droplet interaction is calculated as two-dimensional test case with 240 DOF in each direction. The initial conditions are chosen so that the droplet evaporates at the pre-shock conditions.
Figure 20 provides an explanation of the shock structures that are visible in the shock-droplet interaction. The results at different time instances plotted in Figures 21 and 22 reproduce the characteristics of shock-droplet interactions without resolved phase transition effects. Due to the resolved phase transition effects an additional shock wave can be seen in the solution. This wave is due to the initial evaporation of the droplet in the pre-shock state. The numerical approach detects the evaporation and condensation regimes accordingly on the droplet surface. Due to the impinging shock wave, the surrounding gas conditions are changed so that condensation instead of evaporation takes place. Note that evaporation and condensation may occur at the same time at different locations on the droplet surface.
The shock Mach number was chosen to . Stronger shock waves have been investigated without resolved phase transition effects, see e. g. [32, 16, 37]. In this case, locally negative pressures occur that are not permitted by the two-phase Riemann solver. Note that, this is a more advanced test case compared to incompressible investigations of evaporating droplets.
Initial conditions:
Vapor:
Liquid:
s:
s:
s:
s:
s:
s:
s:
s:
s:
s:
s:
s:
6. Conclusion and Outlook
In the paper we described the construction and validation of a numerical method for the sharp-interface tracking of compressible two-phase flows with phase transition and surface tension. The sharp-interface resolution uses a ghost-fluid method in which the coupling of the fluids uses the exact solution of a two-phase Riemann problem that takes into account phase transition and surface tension effects. To obtain a unique solution in the case of a phase transition, this solution satisfies a kinetic relation, which provides information from the micro-scale and controls the entropy change across the phase interface. The proposed method allows a flexible investigation of interface geometries and is not restricted to spherical droplets.
Due to the computational effort, the here considered sharp interface approach can handle a small number of interfaces only, but these with a consistent thermodynamic modeling. The proper physical transition or jump conditions can be imposed within the two-phase Riemann problem. To capture the mass transfer properly, thermodynamic information from the micro-scale in the form of the kinetic relation is needed. Inherently, we assume for all the applications under consideration that the width of the physical interface is smaller than the grid cell size. This motivates the approximation of the interface as a discontinuity. If this is not valid, then a diffuse interface treatment with a proper thermodynamic modelling should be the better approach. Our numerical approach showed good results in the validation against experimental investigations of rapid evaporation processes for alkanes. The multi-dimensional approach has been applied to several examples including a compressible shock-droplet interaction. The numerical approximation showed good results for all these cases.
Future work goes in several directions. Currently, the approach handles one fluid in the gas and liquid case. We will extend this to multiple gas components. In this paper we restricted ourselves mainly to the Euler equations. For the application 5.6 only, diffusion processes have been taken into account by adding a standard numerical diffusion flux. Besides this, the influences of viscosity and heat conduction at the two-phase interface were neglected. It will be considered in the future, because these effects may be very important for the behavior of the interface in other physical situations. A suitable model for the diffusion fluxes in a sharp interface approach may be also based on local Riemann problems as it was done in [38] for single phase fluid flow.
Acknowledgements
The authors gratefully acknowledge the support of Joachim Gross and Christoph Klink concerning the estimation of the entropy production term by means of the DFT. The work was partially supported by the German Research Foundation (DFG) through SFB TRR 75 “Droplet dynamics under extreme ambient conditions” and the grant RO 2222/4-1.
References
- [1] R. Saurel, F. Petitpas, R. Abgrall, Modelling phase transition in metastable liquids: application to cavitating and flashing flows, Journal of Fluid Mechanics 607 (1) (2008) 313–350.
- [2] A. Zein, M. Hantke, G. Warnecke, Modeling phase transition for compressible two-phase flows applied to metastable liquids, Journal of Computational Physics 229 (8) (2010) 2964–2998.
- [3] D. M. Anderson, G. B. McFadden, A. A. Wheeler, Diffuse-interface methods in fluid mechanics, in: Annual review of fluid mechanics, Vol. 30, Vol. 30 of Annu. Rev. Fluid Mech., Annual Reviews, Palo Alto, CA, 1998, pp. 139–165.
- [4] C. Rohde, On local and non-local Navier-Stokes-Korteweg systems for liquid-vapour phase transitions, ZAMM Z. Angew. Math. Mech. 85 (12) (2005) 839–857.
- [5] R. Abeyaratne, J. Knowles, Evolution of Phase Transitions: A Continuum Theory, Cambridge University Press, 2006.
- [6] C. Rohde, C. Zeiler, A relaxation Riemann solver for compressible two-phase flow with phase transition and surface tension, Applied Numerical Mathematics 95 (2015) 267–279.
- [7] R. Menikoff, B. J. Plohr, The Riemann problem for fluid flow of real materials, Reviews of modern physics 61 (1) (1989) 75–130.
- [8] I. Müller, Thermodynamics, Pitman, 1985.
- [9] P. G. LeFloch, Hyperbolic Systems of Conservation Laws, Lectures in Mathematics, ETH Zürich, Birkhäuser Verlag, Basel, 2002.
- [10] H. Hattori, The Riemann problem for thermoelastic materials with phase change, Journal of Differential Equations 205 (1) (2004) 229–252.
- [11] F. Jaegle, C. Rohde, C. Zeiler, A multiscale method for compressible liquid-vapor flow with surface tension, ESAIM: Proc. 38 (2012) 387–408.
- [12] C. Merkle, C. Rohde, The sharp-interface approach for fluids with phase change: Riemann problems and ghost fluid techniques, M2AN Math. Model. Numer. Anal. 41 (6) (2007) 1089–1123.
- [13] W. Dreyer, M. Hantke, G. Warnecke, Exact solutions to the Riemann problem for compressible isothermal Euler equations for two phase flows with and without phase transition, Quart. Appl. Math. 71 (2013) 509–540.
- [14] E. Godlewski, N. Seguin, The Riemann problem for a simple model of phase transition, Commun. Math. Sci. 4 (1) (2006) 227–247.
- [15] S. Müller, A. Voß, The Riemann problem for the Euler equations with nonconvex and nonsmooth equation of state: construction of wave curves, SIAM J. Sci. Comput. 28 (2) (2006) 651–681.
- [16] S. Fechter, C.-D. Munz, A discontinuous Galerkin-based sharp-interface method to simulate three-dimensional compressible two-phase flow, International Journal for Numerical Methods in Fluids 78 (7) (2015) 413–435.
- [17] R. P. Fedkiw, T. Aslam, B. Merriman, S. Osher, A non-oscillatory Eulerian approach to interfaces in multimaterial flows (the ghost fluid method), Journal of Computational Physics 152 (2) (1999) 457–492.
- [18] C. Chalons, F. Coquel, P. Engel, C. Rohde, Fast relaxation solvers for hyperbolic-elliptic phase transition problems, SIAM Journal on Scientific Computing 34 (3) (2012) A1753–A1776.
- [19] A. Dressel, C. Rohde, A finite-volume approach to liquid-vapour fluids with phase transition, in: Finite volumes for complex applications V, ISTE, London, 2008, pp. 53–68.
- [20] J. R. Simoes-Moreira, J. E. Shepherd, Evaporation waves in superheated dodecane, Journal of Fluid Mechanics 382 (1999) 63–86.
- [21] P. Reinke, G. Yadigaroglu, Explosive vaporization of superheated liquids by boiling fronts, International Journal of Multiphase Flow 27 (9) (2001) 1487–1516.
- [22] L. Truskinovsky, Kinks versus shocks, in: Shock induced transitions and phase structures in general media, Springer, New York, 1993, pp. 185–229.
- [23] P. G. LeFloch, M. D. Thanh, Properties of Rankine-Hugoniot curves for van der Waals fluids, Japan Journal of Industrial and Applied Mathematics 20 (2) (2003) 211–238.
- [24] S.-C. Ngan, L. Truskinovsky, Thermal trapping and kinetics of martensitic phase boundaries, Journal of the Mechanics and Physics of Solids 47 (1) (1998) 141–172.
- [25] C. Chen, H. Hattori, Exact Riemann solvers for conservation laws with phase change, Applied Numerical Mathematics 94 (2015) 222–240.
- [26] D. A. Kopriva, G. Gassner, On the Quadrature and Weak Form Choices in Collocation Type Discontinuous Galerkin Spectral Element Methods, J. Sci. Comput. 44 (2010) 136–155.
- [27] F. Hindenlang, G. J. Gassner, C. Altmann, A. Beck, M. Staudenmaier, C.-D. Munz, Explicit discontinuous Galerkin methods for unsteady problems, Computers & Fluids 61 (0) (2012) 86–93.
- [28] E. F. Toro, Riemann solvers and numerical methods for fluid dynamics, 3rd Edition, Springer-Verlag, Berlin, 2009, a practical introduction.
- [29] M. Sussman, P. Smereka, S. Osher, A Level Set Approach for Computing Solutions to Incompressible Two-Phase Flow, Journal of Computational Physics 114 (1) (1994) 146–159.
- [30] E. W. Lemmon, M. L. Huber, Thermodynamic properties of n-dodecane, Energy & Fuels 18 (4) (2004) 960–967.
- [31] C. Waibel, Berechnung von Transportwiderstandskoeffizienten an Phasengrenzflächen mit der klassischen Dichtefunktionaltheorie, Master’s thesis, Universität Stuttgart (2013).
- [32] S. Fechter, F. Jaegle, V. Schleper, Exact and approximate Riemann solvers at phase boundaries, Computers & Fluids 75 (0) (2013) 112–126.
- [33] J. Schlottke, B. Weigand, Direct numerical simulation of evaporating droplets, Journal of Computational Physics 227 (10) (2008) 5215–5237.
- [34] F. Bassi, S. Rebay, A High-Order Accurate Discontinuous Finite Element Method for the Numerical Solution of the Compressible Navier-Stokes Equations, Journal of Computational Physics 131 (1997) 267–279.
- [35] A. Mulero, I. Cachadiña, M. Parra, Recommended correlations for the surface tension of common fluids, Journal of Physical and Chemical Reference Data 41 (4) (2012) 043105.
- [36] H. Lamb, Hydrodynamics, Cambridge University Press, 1932.
- [37] X. Y. Hu, N. A. Adams, G. Iaccarino, On the HLLC Riemann solver for interface interaction in compressible multi-fluid flow, Journal of Computational Physics 228 (17) (2009) 6572–6589.
- [38] G. Gassner, F. Lörcher, C.-D. Munz, A discontinuous Galerkin scheme based on a space-time expansion. II. Viscous flow equations in multi dimensions., J. Sci. Comp. 34 (3) (2008) 260–286.