OmniGraph: Rich Representation and Graph Kernel Learning
Abstract
OmniGraph, a novel representation to support a range of NLP classification tasks, integrates lexical items, syntactic dependencies and frame semantic parses into graphs. Feature engineering is folded into the learning through convolution graph kernel learning to explore different extents of the graph. A high-dimensional space of features includes individual nodes to complex networks. In experiments on a text-forecasting problem that predicts stock price change from news for company mentions, OmniGraph beats several benchmarks based on bag-of-words, syntactic dependencies, and semantic trees. The highly expressive features OmniGraph discovers provide insights into the semantics across distinct market sectors. To demonstrate the method’s generality, we also report its high performance results on a fine-grained sentiment corpus.
1 Introduction
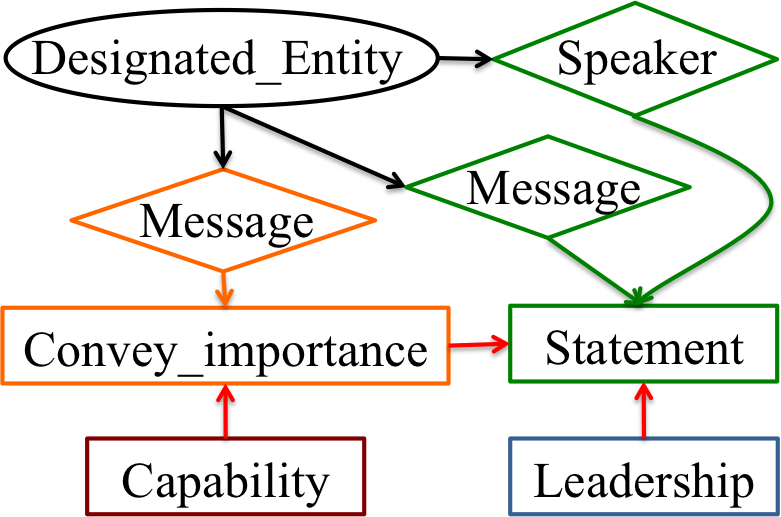
For diverse NLP classification tasks, such as sentiment and opinion mining, or text-forecasting, in which text documents are used to make predictions about measurable phenomena in the real world [Kogan et al. (2009], there is a need to generalize over words while simultaneously capturing relational and structural information. Feature engineering for NLP learning tasks can be labor-intensive. We propose OmniGraph, a novel representation that supports a continuum of features from lexical items, to syntactic dependencies, to frame semantic features. Figure 1 illustrates a sentence, the structure of its graph, and a predictive subgraph feature our method discovers that captures semantic and syntactic dependencies (arrows), semantic role information for syntactic arguments (diamonds), and generalizations over lexical items (semantic frame names, shown as rectangles). For machine learning with OmniGraph, we use graph kernels that allow the user to control how much of the graph is explored for similarity computation. We test this approach on an extremely challenging text-forecasting problem: a polarity classification task to predict the direction of price change for publicly traded companies based on news. We also report results on an entity-driven fine-grained sentiment corpus.
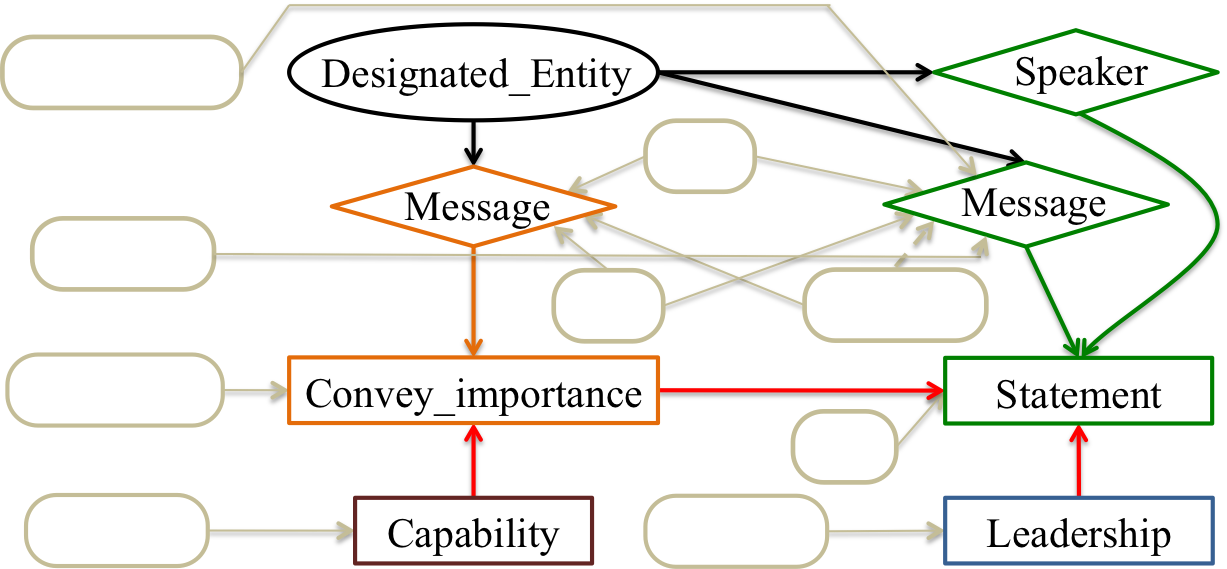
“This milestone highlighted the Boeing KC-767’s ability to perform refueling operations under all lighting conditions,” said George Hildebrand, Boeing Japan program manager.
The ability to exploit deep semantic information in text, e.g. to distinguish the depicted scenarios and semantic roles of the entity mentions, motivates our study. We hypothesize that a general and uniform representation of linguistic information that combines multiple levels, such as semantic frames and roles, syntactic dependency structure and lexical items, can support challenging classification tasks for NLP problems. Consider the following three sentences from financial news articles.
- “The accreditation renewal also underscores the quality of our work with Humana members, customers, clients, payors and health care providers by confirming our compliance with national standards for PBM services,” said William Fleming, vice president of Humana Pharmacy Solutions.
- “The testing program highlighted the abilities of the Navy, Raytheon Missile Systems and NASA to effectively partner on this complicated program and deliver what would have been previously unobtainable data,” said Don Nickison, chief of the NASA Ames Wind Tunnel operations division.
- “The initiation of a dividend and the renewed share repurchase authorization underscore the board and management’s confidence in Symantec’s long-term business outlook and ability to generate significant free cash flow on a consistent basis,” said Symantec’s executive vice president and chief financial officer, James Beer.
The sentences all describe a scenario in which a company executive makes a positive statement about the company’s capabilities. Of note, the stock price of the three companies (in boldface) went up the next day. Four semantic frames from FrameNet [Baker et al. (1998], a linguistic resource that exemplifies Fillmore’s frame semantics [Fillmore (1976], capture the commonality of a statement (green) from an organization leader (blue) that conveys the importance (orange) of capabilities (brown). Further, within each sentence the frames have the same syntactic dependencies in the three sentences. The feature in Figure 1 captures the common meaning of these sentences, and is predictive in three distinct market sectors: industrials, health care and information technology.
2 Related Work
Much recent work on the kinds of NLP classification tasks our experiments address, text-forecasting and fine-grained sentiment, builds on linguistically informed features or knowledge. ?) introduce fine-grained opinion mining, using semantic role labeling to mine triples of the source, target and content of opinions applied to online news. To similarly mine opinion triples, ?) depend more on syntax, using a suffix-tree data structure to represent syntactic relationships. Instead of feature engineering, ?), develop structured regularization for bow based on parse trees, topics and hierarchical word clusters to improve bow for 3 classification tasks: topic, sentiment, and text-driven forecasting. Another approach to forecasting from text [Joshi et al. (2010] combines bow and the names of dependency relations to engineer features for predicting movie revenue from reviews. They devote considerable effort to feature engineering, while our approach folds feature engineering into the learning.
OmniGraph feature engineering is handled automatically by convolution graph kernels. Convolution kernels have been used in NLP to exploit structured information using trees for parsing and tagging [Collins and Duffy (2001], text categorization [Lodhi et al. (2002], and question answering [Zhang and Lee (2003, Suzuki et al. (2003, Moschitti (2006]. To learn social networks, Agarwal et al. [Agarwal et al. (2014] use partial tree kernels on a representation with frame semantic information [Fillmore (1976]. The tree representation in ?) also incorporates frame semantics, and uses subtree and subset tree kernels for the same forecasting task we pursue. In contrast to their task-specific representations, our more general OmniGraph can be used for many tasks. Rather than having to choose among many tree kernels, the graph kernels we use allow users to specify the size of the graph neighborhoods to explore.
Studies of the effect of financial news on the market [Gerber et al. (2009, Gentzkow and Shapiro (2010, Engelberg and Parsons (2011] have been increasingly important since Tetlock [Tetlock (2007] investigated the role of media in the stock market. As mentioned in ?), a better solution to the problem can help gain more insights to the long-lasting question in finance about how financial markets react to news [Fama (1998, Chan (2003]. In general, the work in NLP that uses news to predict price does well if it achieves better than 50% accuracy [Lee et al. (2014, Bar-Haim et al. (2011, Creamer et al. (2013, Xie et al. (2013]. ?) report that even “textbook models” that uses time series data have less than 51.5% prediction accuracy. Unlike many other domains, however, a higher than random accuracy can have great value in a high-volume trading strategy. Work in NLP and related areas [Devitt and Ahmad (2007, Schumaker et al. (2012, Feldman et al. (2011, Zhang and Skiena (2010] often treats stock price prediction from news as a sentiment classification problem. ?) point out that this is consistent with the direction component of the three-part ADS model [Rydberg and Shephard (2003]. Their model was shown better than bow alone on three market sectors, but there was no comparison to the majority baseline. In contrast, our OmniGraph outperforms the baseline in seven out of eight market sectors and beats bow and two other benchmarks.
Sentence: “The accreditation renewal underscores the quality of our work with Humana members,” said Humana’s president.
Frame semantic parse:
[“The accreditation renewal [underscoresConvey_importance] [the [qualityCapability] of our work with Humana membersConvey_importance.Message],”Stmt.Message] [saidStatement] [Humana’s [presidentLeadership] Stmt.Speaker].
Dependency parse:
[column sep=0.001cm] “The & accreditation & renewal & underscores & the & quality & of & our & work & with & Humana & members,” & said & Humana’s & president
[edge unit distance=1.5ex]13root \depedge[edge unit distance=0.6ex, edge style=red!60!black,very thick]134vmod \depedge[edge unit distance=1.8ex]43sub \depedge[edge unit distance=1.8ex, edge style=red!60!black,very thick]46obj \depedge[edge unit distance=1.8ex]31nmod \depedge[edge unit distance=1.8ex]32nmod \depedge[edge unit distance=1.8ex]65nmod \depedge[edge unit distance=1.8ex]67nmod \depedge[edge unit distance=1.8ex]79pmod \depedge[edge unit distance=1.8ex]98nmod \depedge[edge unit distance=1.8ex]910nmod \depedge[edge unit distance=1.8ex]1012pmod \depedge[edge unit distance=1.8ex]1211nmod \depedge[edge unit distance=1.8ex, edge style=red!60!black,very thick]1315sub \depedge[edge unit distance=1.8ex]1514nmod
3 Methods
We first introduce our data representation, then describe our learning methods. The nodes in an OmniGraph encode semantic and lexical content, and the edges encode semantic and syntactic dependency relations. In Section 3.1 we use an example to describe how to construct a one-sentence OmniGraph. Later we introduce the data instances for our learning task: OmniGraph forests that represent all the sentences in the news that mention a given company on a particular day. As in ?), we refer to the company we make predictions about as the designated entity.
3.1 OmniGraph Construction
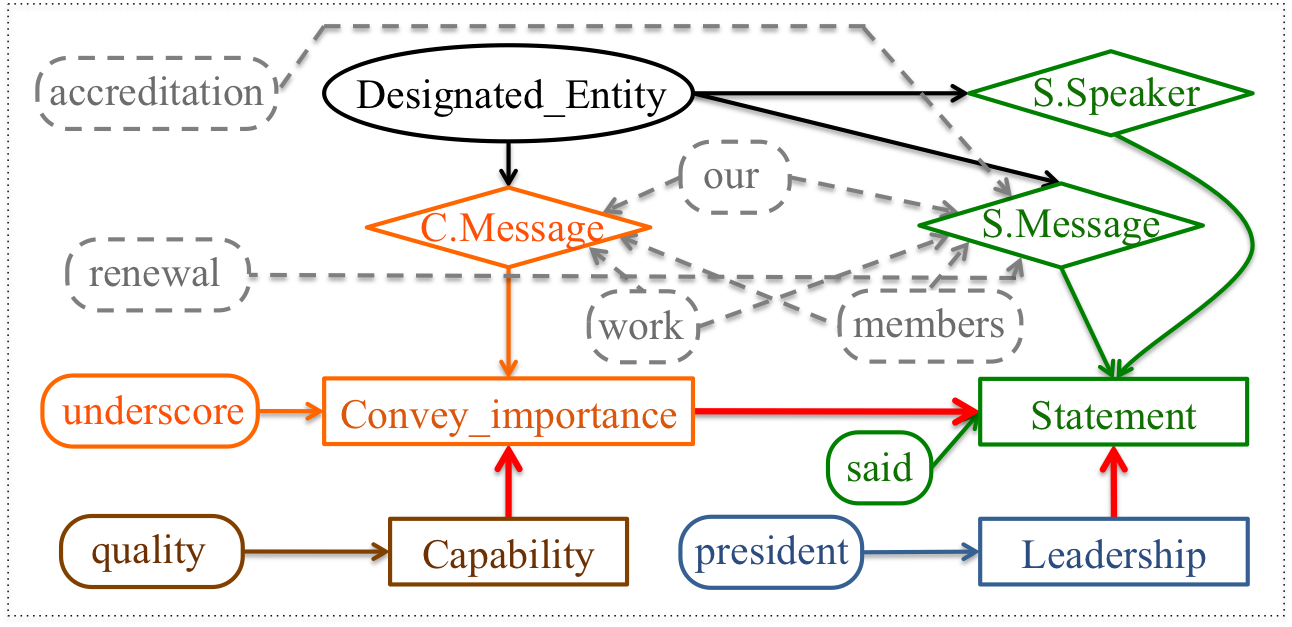
To construct a one-sentence OmniGraph, the sentence must first be assigned a frame semantic parse and a syntactic dependency parse. Section 4 describes the parsers we use and their performance. We use the example sentence in Figure 2 to illustrate how to construct its OmniGraph in Figure 3.
(1) Create building blocks by converting each semantic frame into a subgraph. In frame-based semantic parsing, the scenarios in a sentence are identified as frames, and each frame is triggered by a frame target: the lexical item that evokes the frame. The frame name and frame target become OmniGraph nodes, along with the frame elements (semantic roles) that have been filled by sentential arguments. In Figure 2, nodes with the same color correspond to a frame, its target, and its elements. Four frames have been identified by the parser, and three frame elements: the Message elements of the Statement and Convey_importance frames, the Speaker element of the Statement frame, and the Capability and Leadership frames. An edge connects a frame target and the frame it evokes (e.g. said and Statement), and a frame element and the frame it belongs to (e.g. Message and Statement). Figure 2 shows an actual parse for a sentence in our data; in a correct parse, the phrase accreditation renewal would fill the Medium element of the Convey_importance frame. We achieve good prediction performance despite such inaccuracies.
(2) Add the dependency relations among frames. Frame semantic parsing identifies individual frames, but not the syntactic dependencies among frames. As shown in the dependency parse in Figure 2, we locate the frame targets, i.e. lexical items that evoke frames, and use the dependency relations among the frame targets to link the frames. In OmniGraph, a dependent node points to the node it depends on, as indicated by the red arrows in Figure 3.
(3) Connect the designated entity to its semantic roles. For the learning task we present here, we make predictions about a designated entity, a publicly traded company. Company mentions are identified using pattern matching. All mentions of the designated entity become nodes, which are linked to the frame elements they fill, or partly fill. For example the designated entity Humana fills the Speaker role of the Statement frame, and also occurs in the Message element of the Statement frame and the Message element of the Convey_importance frame. It thus has three out-degree edges.
(4) Connect lexical items to frame elements they help fill. OmniGraph incorporates lexical information with one node for each lexical item in a constituent that fills a frame element. The nodes connect to the frame elements they fill. Some of these edges are shown as grey dashed nodes and edges in Figure 3. Some edges are omitted for readability.
In sum, OmniGraph nodes are: 1) frame names (boxes), 2) frame targets (rounded boxes), 3) frame elements (diamonds), 4) other lexical items (dashed boxes), and 5) designated entities (ellipses). An edge connects: 1) a frame target to its frame; 2) a frame element to the frame it belongs to; 3) a designated entity to the frame element it fills; 4) from one frame to another where the target of the first frame is a dependent node in a dependency parse, and the target of the second frame is the dependent’s head; and 5) a lexical item to the frame element it helps fill. Edge directions are exploited by the graph kernels we use.
3.2 Weisfeiler-Lehman Graph Kernel
We selected the Weisfeiler-Lehman (WL) graph kernel [Shervashidze et al. (2011] for SVM learning because it has a lower computational complexity compared to other graph kernels, and because it can measure similarity between graphs for different neighborhood sizes. At each degree of neighborhood, all nodes are relabeled with their neighborhoods, then graph similarity is measured. For example, to explore its first degree neighbors, the immediate neighborhood of the Designated_Entity node in Figure 3 is used to relabel the node as {Designated_EntityC.Message, S.Message, S.Speaker}. The WL kernel computation is based on the Weisfeiler-Lehman test of isomorphism [Weisfeiler and Lehman (1968], which iteratively augments the node labels by the sorted set of their neighboring node labels, and compresses them into new short labels, called multiset-labels. Through neighbor augmentation, similarity between graphs is iteratively measured using dynamic programming.
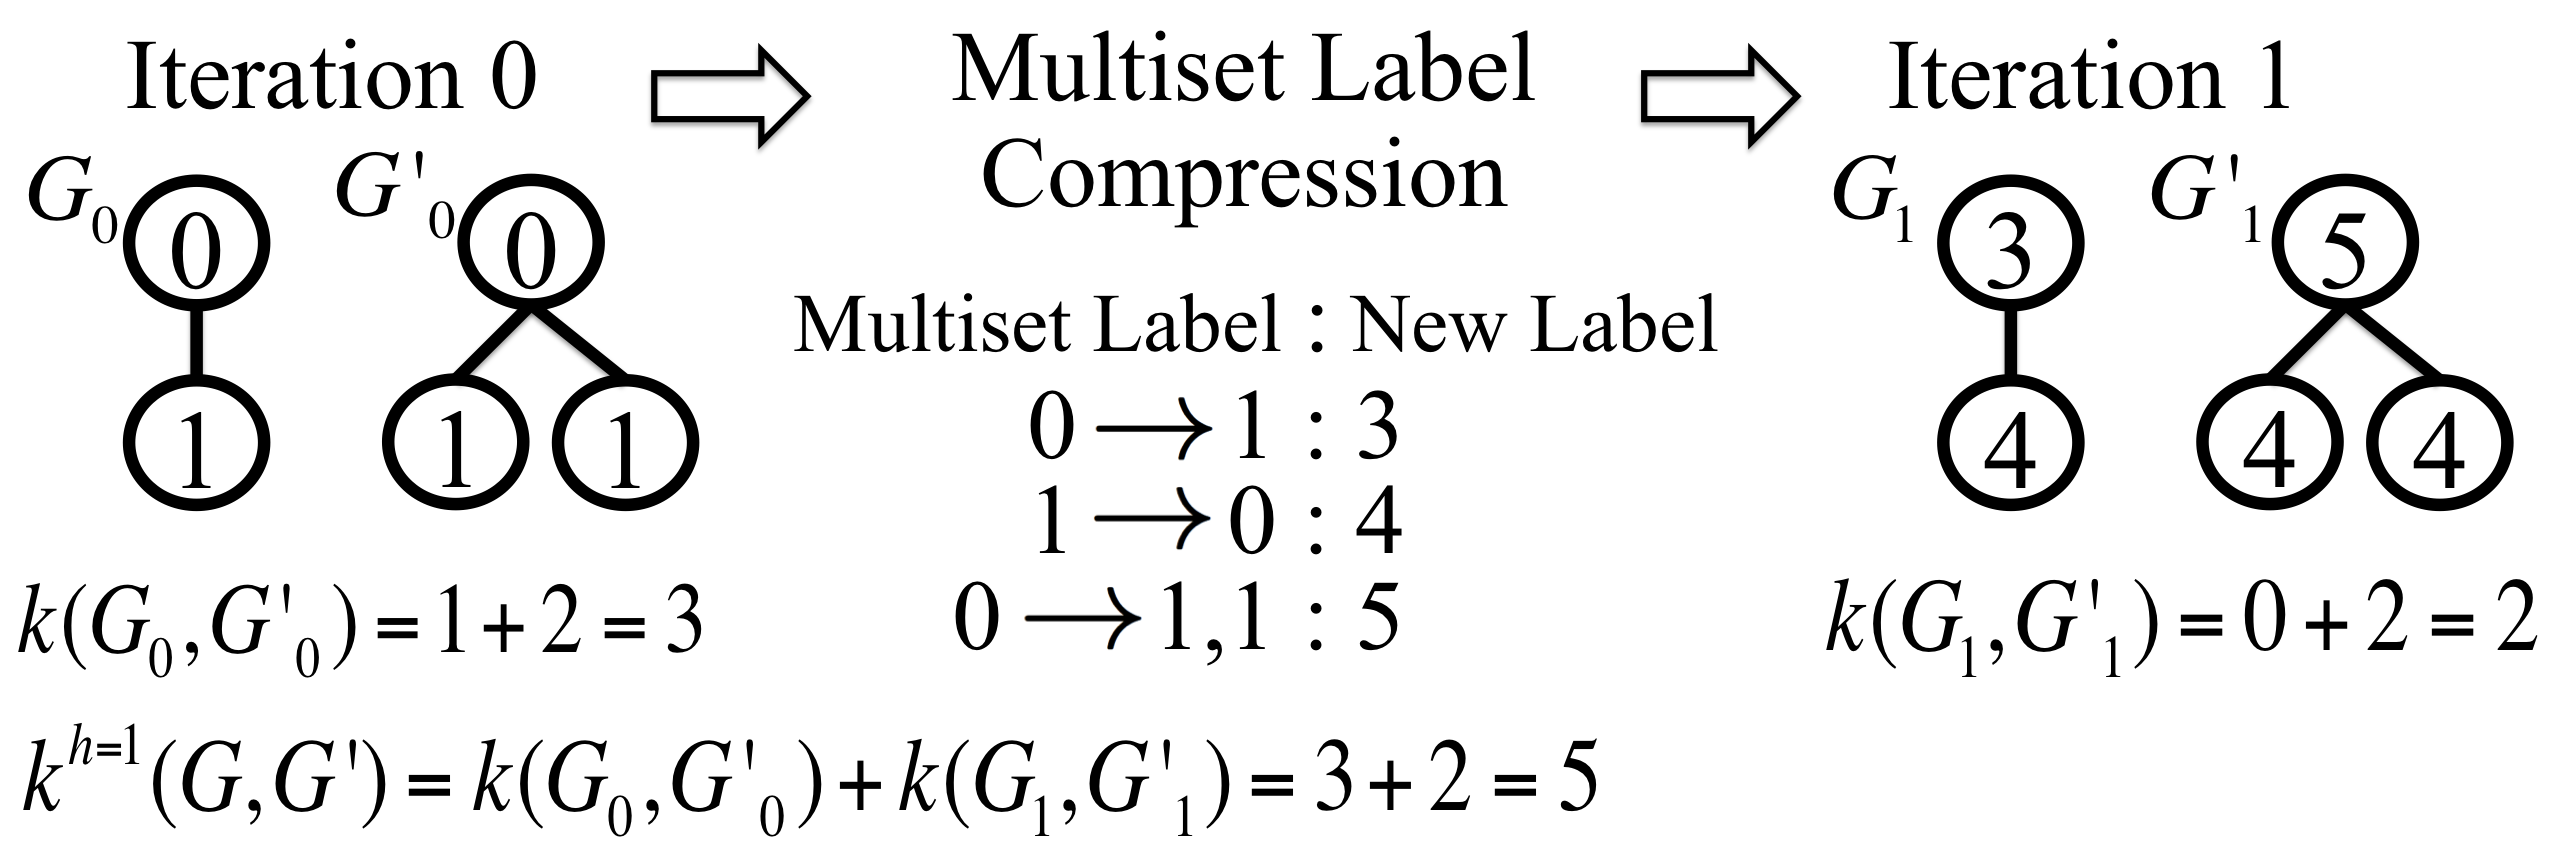
Figure 4 illustrates how to calculate the WL graph kernel between graphs and for degrees of neighbor up to 1 (=1). Iteration =0 for degree of neighbor 0 (stepsize 0) compares only the nodes of the original graphs. Nodes with label 0 have one match; nodes with label 1 have two matches. This gives a total similarity of three. The neighborhoods for each node are then augmented to compute similarity when iteration =1, which compares the nodes and their first degree neighbors. New labels (i.e. 3, 4, and 5) are assigned to represent each node and its first degree neighbors, and similarity of the relabeled graphs is 2. Therefore, .
3.3 Node Edge Weighting Graph Kernel
The WL kernel is efficient at neighborhood augmentation but there is no distinction between different node types, and node augmentation gathers up all nodes for a given degree. The 1-degree WL feature for the Designated Entity (DE) node in Figure 3 is DESpkr,Msg,Msg, i.e. DE fills a Speaker and two Message elements (one for the Statement frame and the other for the Convey_importance frame). No credit for partial matching is given when this graph instance is compared to another instance where DE just fills the Message element of the Convey_importance frame. To allow partial matching, and to take advantage of the type information of nodes and edges, we introduce a novel graph kernel: node edge weighting (NEW) graph kernel.
Like WL, NEW also measures subgraph similarities through neighborhood augmentation. The kernel computation can be broken down into node kernels and edge kernels. Node and edge kernels are weighted Kronecker delta kernels () that return whether the two objects being compared are identical. Define for the weight of node of feaure type , node label , and for the weight of edge with from-node of feature type and to-node of feature type . We have
, and . Define to be the basis kernel for -degree neighborhood; the kernel between graph and is computed by recursion as in Equation 1.
| (1) |
Dynamic programming can be used to improve the efficiency. Each entry in the dynamic programming table is a tuple of , where and are nodes in graph and .
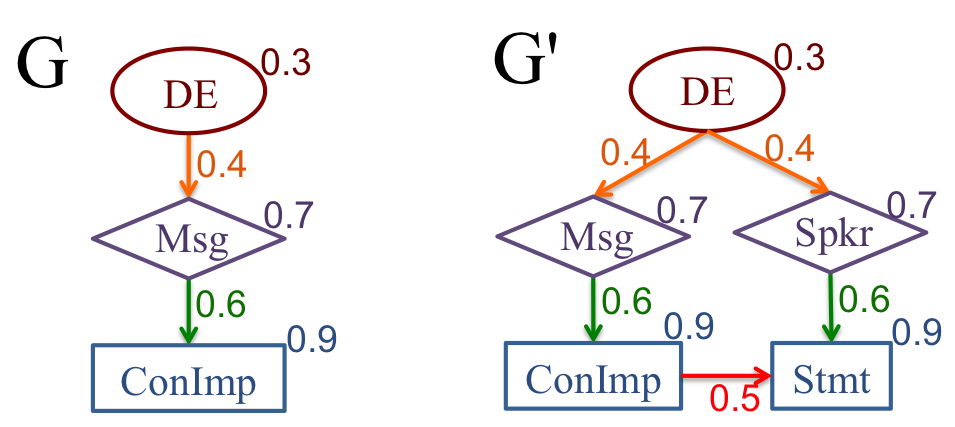
The toy example in Figure 5 illustrates how to calculate the new graph kernel between graphs and . As with the wl kernel, new compares different degrees of node neighborhoods up to degrees of neighbors, and the final kernel is a sum of all basis kernels. For =0, only the nodes of the original graphs are compared. Nodes with labels DE, Msg and ConImp all have one match. With node weights as shown, 0.30.70.91.9. For =1, each node plus its one-degree neighbors are compared, and the relations between the nodes. Path DE Msg has a match. With node and edge weighting, 0.30.40.70.084. For the same reason, 0.30.40.70.60.90.045. There is no match for three degrees of neighbors, 0.
Each basis kernel that corresponds to different neighborhood sizes are then normalized by the maximum of the evaluation between each graph and itself. For each graph kernel we have a normalized :
| (2) |
This normalization ensures that a graph will always match itself with the highest value of 1 and other graphs with values between 0 and 1. The final kernel is an interpolation of basis kernels: , where =. Combining basis kernels is a common problem in machine learning and several multiple kernel learning techniques have been developed to allow benefits from multiple kernels [Smits and Jordaan (2002, Bach et al. (2004].
4 Financial News Analytics
We test the performance of OmniGraph with WL and NEW kernels on a polarity task: to predict the direction of price change for 321 companies from eight market sectors of Standard & Poor’s 500 index. On average, there are from 27 to 67 companies per sector. One of the biggest challenges of the financial domain is the unpredictability of the market. As noted above, use of NLP methods on news to predict price does well if it achieves better than random performance, as described in the Related Work. We rely on Student’s T to test statistical significance of classification accuracy. We use the majority class label as a baseline, which ranges from 54% to 56%, depending on the market sector. Compared with three NLP benchmarks, only OmniGraph beats the baseline, and results are statistically significant.
4.1 Experimental Setup
The experiments use Reuters news data from 2007 to 2013 for eight GICS111Global Industry Classification Standard. sectors. Sentences that mention companies are extracted using high-precision, high-recall pattern matching on company name variants. A data instance for a company consists of an OmniGraph forest representing all the sentences that mention that company on a given day. On average, each data instance encodes from 4.11 to 7.18 sentences, and each company has an average total of from 605 to 858 sentences, depending on the sector. In work reported elsewhere, we found that we could expand the number of sentences per company using coreference by 15-30%, depending on the sector. The additional sentences did not, however, improve performance (Anon). Sentences that mention companies by name tend to occur early in news articles, and are apparently more predictive.
A binary class label {-1, +1} indicates the direction of price change on the next day after the news associated to the data instance. The one-day delay of price response to news is due to [Tetlock et al. (2008]. Only the instances with a price change of 2% are included in our polarity prediction task.
Sentences are parsed using the MST dependency parser [McDonald et al. (2005], which implements the Eisner algorithm [Eisner (1996] for dependency parsing, and provides an efficient and robust performance. For frame semantic parsing, we use SEMAFOR [Das and Smith (2011, Das and Smith (2012], which generates state-of-the-art results on SemEval benchmark datasets.
For the learning, we found that no single stepsize performed best for a given company, much less the entire data set. We select the stepsize and weights of the basis kernels for NEW using grid search on 80% of the data, where we use leave-one-out cross validation. The selected parameters for a given company are then used to test the average prediction performance on the 20% of held-out data.
| GICS | Sector | Baseline | BOW | DepTree | SemTreeFWD | OmniGraphWL | OmniGraphNEW |
|---|---|---|---|---|---|---|---|
| 10 | Energy | 53.953.36 | 52.563.97 | 53.004.31 | 53.534.84 | 56.715.17 | 56.904.20 |
| 15 | Materials | 55.002.88 | 53.185.23 | 54.084.10 | 52.735.60 | 56.423.85 | 56.493.26 |
| 20 | Industrials | 54.253.85 | 52.895.91 | 53.103.49 | 52.905.21 | 55.294.44 | 56.165.56 |
| 25 | Cons. Disc. | 54.324.18 | 53.914.73 | 54.754.62 | 54.095.86 | 56.815.93 | 57.495.63 |
| 30 | Cons. Staples | 54.853.24 | 52.824.07 | 53.213.30 | 53.783.76 | 56.233.40 | 60.6410.7 |
| 35 | Healthcare | 56.444.51 | 52.753.86 | 53.944.49 | 54.316.46 | 57.314.48 | 59.315.28 |
| 45 | IT | 53.954.07 | 52.423.64 | 52.804.07 | 52.796.84 | 55.384.92 | 55.695.61 |
| 55 | Utilities | 53.822.75 | 51.664.24 | 52.564.45 | 51.755.23 | 54.865.70 | 55.305.32 |
4.2 Benchmark Methods
Three benchmark methods are reported for comparison with OmniGraph: (1) BOW-a vector space model that contains unigrams, bigrams, and trigrams. (2) DepTree-a tree space representation based on the dependency parses used to create OmniGraph. The root is the sentence entry, and dependency relation types, such as SUB, OBJ, VMOD, and the lexical items, are represented as tree nodes. (3) SemTreeFWD-a state-of-the-art representation for the price prediction task that is an enriched hybrid of vector and tree space [Xie et al. (2013]. It includes semantic frames, lexical items, and part-of-speech-specific psycholinguistic features. Learning relies on Tree Kernel SVM [Moschitti (2006].222Data provided by the authors.
4.3 Features
OmniGraph with new kernel learning shows a strong impact of stepsize and weighting of nodes and edges. In a detailed analysis of the 26 companies in GICS 30 (Consumer Staples), a sector with average amounts of news, all but three companies have non-zero coefficients on two or more of the basis kernels. Two of the three outliers rely only on stepsize 1 and the third on stepsize 2. Thirteen companies combine two basis kernels and the remaining ten combine three. On average, only 9% of the features are non-relational (p=0). The other sectors have a similar trend.
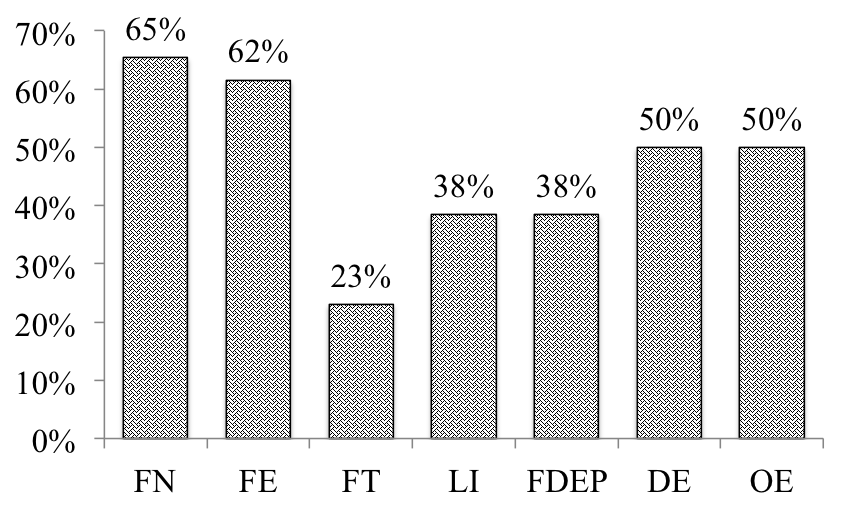
Grid search determines the stepsize, and also determines which node types to include during neighborhood augmentation; nodes are weighted or . Figure 6 shows the proportion of GICS 30 companies that use each of seven node types. The most important node types are frame names (FN) and frame elements (FE): more than 60% of the companies need them to obtain the best performance. The next most frequent node types are designated entities (DE) and other entities (OE), each used by 50% of companies. This result suggests that relations between companies are useful for price polarity. More than one third of the companies need the feature for dependencies between frames (FDEP), often involving complex sentences where multiples frames are evoked. The lexical item features (LI) have a contribution similar to FDEP. Note that depending on the stepsize, LI features from OmniGraph include lexical items (p=0), their dependencies and the frame elements they fill (p=1), and the frames to which the frame elements belong (p=2). Frame target (FT) is the least preferred feature.
4.4 Results
Table 1 summarizes the average accuracy for all eight sectors of the majority class baseline, the three benchmarks, and the two OmniGraph models. Both versions of OmniGraph significantly outperform the three benchmarks. The cells with asterisks represent a difference from the baseline that is statistically significant. OmniGraphWL beats the baseline with statistical significance in six sectors, and OmniGraphNEW in seven. Note that none of the benchmarks outperforms the baseline.
Despite the excellent performance of BOW for topical classification tasks, for this price prediction task it does poorly. Both DepTree and SemTreeFWD outperform BOW, which indicates that features derived from dependency syntax and semantic frame parsing improve performance. DepTree directly represents the dependency parse with both dependencies and words as nodes, without semantic information. The limitation of SemTree comes from its entity-centric representation – the root node is the designated entity. The semantic frames without DE mentions are discarded, and a heterogeneous combination of trees and vectors are used for learning. Between wl and new learning on OmniGraph, new produces the best results. We suspect this is due to the high granularity of the features it generates, and its flexibility in assigning different weights to nodes and edges, depending on the node and edge feature types.
5 GoodFor/BadFor Corpus
To further test OmniGraph performance for entity driven text analytics, we used a recently introduced, publicly available dataset - the GoodFor/BadFor (gfbf) Corpus333http://mpqa.cs.pitt.edu/corpora/gfbf/ [Deng et al. (2013], which is part of MPQA [Wiebe et al. (2005]. gfbf has been annotated for two fine-grained sentiment judgments: 1) benefactive/malefactive event annotation, and 2) writer attitude. The benefactive/malefactive task asked annotators to identify the affected entity (the object) and the entity causing the event (the agent), and to label whether the agent and the event is benefactive or malefactive on the object. We treat the object as the designated entity. The writer attitude task asked annotators to identify the writer’s attitude towards the agent and the object. We treat both the agent and the object as the designated entity in turn.
| Benef/Malef | WriterAttitude | |
| Baseline | 56.65 | 55.61 |
| BOW | 67.132.68 | 66.611.90 |
| DepTree | 72.102.41 | 66.161.76 |
| SemTreeFWD | 72.512.22 | 65.322.05 |
| OmniGraphWL | 83.171.93 | 73.101.64 |
| OmniGraphNEW | 82.422.04 | 74.241.58 |
We use the percentage of the majority class as the baseline, and compare the same five methods as in our previous experiment. Table 2 summarizes the results. On the benefactive/malefactive task, BOW obtains a 10% improvement over the baseline. Structured representations significantly improve over BOW. SemTreeFWD, which incorporates the semantic frame features and a sentiment lexicon, improves the performance by another 5%. The dependency tree performance is similar to SemTreeFWD. OmniGraph with graph kernel learning (WL or NEW kernels) performs much better. The writer attitude task is a more difficult one with a slightly lower baseline, and a much lower inter-annotator agreement [Deng et al. (2013]. Dependency trees and semantic trees do not improve over BOW. Both versions of OmniGraph, however, have superior performance.
| Graph Features | Feature Types | Example Sentences | Label | |
|---|---|---|---|---|
| 1 |
|
Frame names,
Frame elements, Dependencies among frames |
“This milestone highlighted the Boeing KC-767’s ability to perform refueling operations under all lighting conditions,” said George Hildebrand, Boeing KC-767 Japan program manager.
“This benchmark underlines how Intel can collaborate to innovate and drive real performance and total cost of ownership benefits for our clients,” said Nigel Woodward, Global Director, Financial Services for Intel. |
GICS20 GICS35 GICS45 |
| 2 |
|
Frame names,
Frame elements, Frame target, Lexical items |
The former Yahoo executive is a heavyweight in the online search and advertising area, with 20 U.S. patents.
Picateers has hired Dan Levin, a former senior executive with Intuit Inc, to serve as interim CEO until a permanent leader is hired. |
GICS45 |
| 3 |
|
Frame names,
Dependencies among frames |
Wyndham have seen profits soar in recent years as robust demand has allowed them to steadily raise rates.
Family Dollar and Walmart are also expected to see same store sales growth over the next 60 days. |
GICS25 GICS30 |
| 4 |
|
Entities,
Frame name, Frame elements |
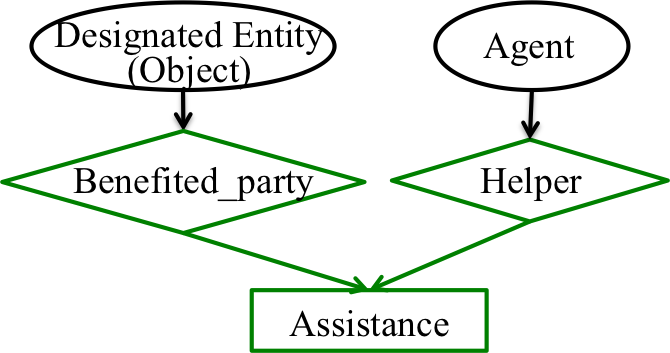
Looking ahead to the benefits health care reform will bring in future years, the law also established [a pregnancy assistance fundAgent] that will provide $250 million over the next decade to help [pregnant and parenting women and teens with services for those victimized by domestic or sexual violenceObject]. |
|
| 5&6 |
|
Entities,
Frame name, Frame elements |
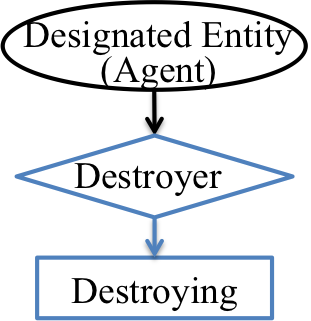
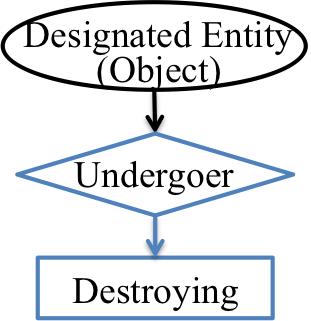
By utilizing peer review practices which would not stand muster under standard constitutional law, [hospital and health systemsAgent] can label anyone a disruptive, unruly or uncooperative physician and destroy [their ability to workObject]. |
|
6 Discussion
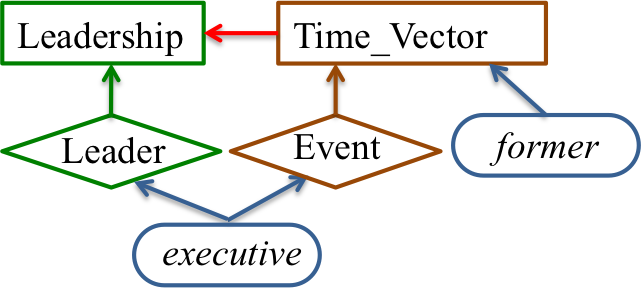
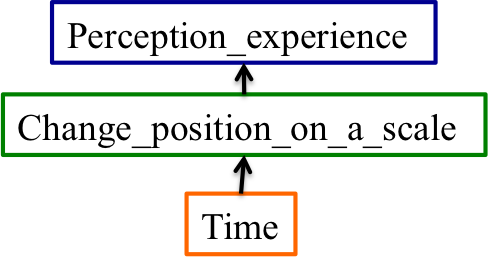
OmniGraph with graph kernel learning exhibits superior performance over vector and tree space models in both experiments. To understand what contributes to the predictive power of OmniGraph models, we use mutual information to rank features discovered by OmniGraph. Compared to the vector and tree representations, the graph-structured features are more expressive, and can be interpreted. Figure 7 presents six highly ranked features from our experiments. Features 1-3 are from the financial news analytics task. Feature 1 is a complex feature with frame names, frame elements, and the dependencies among frames. It generalizes over multiple sectors and predicts a positive change in price. It is the feature that corresponds to the example sentences in the Introduction. Feature 2 combines frame names, frame elements, a frame target, and two lexical items to capture an interesting pattern: referring to the former leader of a company predicts a negative price change. Feature 3 is a 2-degree neighbor subgraph that consists of three frames and their inter-dependencies. This feature represents that the designated entity experiences a change over a time period. The feature generalizes across many different wordings, and although the feature does not directly encode direction of change, it happens that this feature rarely occurs in a negative description. It is therefore an example of a positive sentiment feature that is detected without reliance on a sentiment lexicon or on explicit polarity information.
Features 4-6 are from the gfbf experiment. Feature 4 is a top ranked predictor for the benefective/malefactive task, and it predicts a positive affect toward the object. It captures the relation between the Agent and the Object in an Assistance scenario where the Agent fills the Helper role and the affected Object fills the Benefited_party role. Row 5 contains two features that are predictive in the writer attitude task. Recall that a writer can have different attitudes towards the Agent and the Object. Our approach is able to distinguish different roles of different entities of interest for the same sentence, and make separate predictions.
As seen above, OmniGraph is very good at modeling complex intra-sentence semantic relations. Inspired by the work of ?), who constructed dependency parse forests for paragraphs of text, one of our future directions is to extend OmniGraph to incorporate discourse information. An obvious choice would be to encode inter-sentential discourse relations as one or more new edge types to connect the OmniGraphs that correspond to distinct sentences.
7 Conclusion
In this study, we have presented a novel graph-based representation – OmniGraph – with Weisfeiler-Lehman and node edge weighting graph kernel learning, for entity-driven semantic analysis of documents. This method exhibits superior performance in a text-forecasting task that uses financial news to predict the stock market performance of company mentions, and a fine-grained sentiment task. OmniGraph’s advantages stem from the use of semantic frames to generalize word meanings in a flexible and extensible graph structure, where rich relational linguistic information, such as dependencies among frames and lexical items, can be modeled and learned with graph kernels that make feature engineering part of the learning. The resulting graph features are able to reflect deeper semantic patterns beyond words, and to help provide insights into the problem domain. Here, we applied OmniGraph to two rather distinct problems to illustrate that it could potentially support a wide range of NLP classification problems. On top of OmniGraph’s capability of modeling complex intra-sentence semantic relations, a future direction is to model inter-sentence relations through discourse structure to form a more linguistically informed document-level representation.
References
- [Agarwal et al. (2014] Apoorv Agarwal, Sriramkumar Balabsubramanian, Anup Kotalwar, Jiehan Zheng, and Owen Rambow. 2014. Frame semantic tree kernels for social network extraction from text. In Proceedings of the 14th Conference of the European Chapter of the Association for Computational Linguistics, pages 211–219.
- [Bach et al. (2004] Francis R. Bach, Gert R. G. Lanckriet, and Michael I. Jordan. 2004. Multiple kernel learning, conic duality, and the smo algorithm. In Proceedings of the Twenty-first International Conference on Machine Learning, ICML ’04, pages 6–, New York, NY, USA. ACM.
- [Baker et al. (1998] Collin F. Baker, Charles J. Fillmore, and John B. Lowe. 1998. The Berkeley Framenet project. In Proceedings of the 36th Annual Meeting of the ACL and 17th International Conference on Computational Linguistics - Volume 1, ACL ’98, pages 86–90, Stroudsburg, PA, USA. ACL.
- [Bar-Haim et al. (2011] Roy Bar-Haim, Elad Dinur, Ronen Feldman, Moshe Fresko, and Guy Goldstein. 2011. Identifying and following expert investors in stock microblogs. In Proceedings of the 2011 Conference on Empirical Methods in Natural Language Processing, pages 1310–1319, Edinburgh, Scotland, UK., July. Association for Computational Linguistics.
- [Chan (2003] Wesley S. Chan. 2003. Stock price reaction to news and no-news: Drift and reversal after headlines. Journal of Financial Economics, 70:223–260.
- [Collins and Duffy (2001] Michael Collins and Nigel Duffy. 2001. Convolution kernels for natural language. In Proceedings of the 14th Conference on Neural Information Processing Systems.
- [Creamer et al. (2013] Germán G. Creamer, Yong Ren, Yasuaki Sacamoto, and Jeffrey V. Nickerson. 2013. News and sentiment analysis of the european market with a hybrid expert weighting algorithm. In SocialCom’13, pages 391–396. IEEE.
- [Das and Smith (2011] Dipanjan Das and Noah A. Smith. 2011. Semi-supervised frame-semantic parsing for unknown predicates. In Proceedings of the 49th Annual Meeting of the Association for Computational Linguistics: Human Language Technologies - Volume 1, HLT ’11, pages 1435–1444, Stroudsburg, PA, USA. Association for Computational Linguistics.
- [Das and Smith (2012] Dipanjan Das and Noah A. Smith. 2012. Graph-based lexicon expansion with sparsity-inducing penalties. In HLT-NAACL, pages 677–687. The Association for Computational Linguistics.
- [Deng et al. (2013] Lingjia Deng, Yoonjung Choi, and Janyce Wiebe. 2013. Benefactive/malefactive event and writer attitude annotation. In Proceedings of the 51st Annual Meeting of the Association for Computational Linguistics (Volume 2: Short Papers), pages 120–125, Sofia, Bulgaria, August. Association for Computational Linguistics.
- [Devitt and Ahmad (2007] Ann Devitt and Khurshid Ahmad. 2007. Sentiment polarity identification in financial news: A cohesion-based approach. In Proceedings of the 45th Annual Meeting of the Association of Computational Linguistics, pages 984–991, Prague, Czech Republic, June. Association for Computational Linguistics.
- [Eisner (1996] Jason M. Eisner. 1996. Three new probabilistic models for dependency parsing: An exploration. In Proceedings of the 16th Conference on Computational Linguistics - Volume 1, COLING ’96, pages 340–345, Stroudsburg, PA, USA. Association for Computational Linguistics.
- [Engelberg and Parsons (2011] Joseph Engelberg and Christopher A. Parsons. 2011. The causal impact of media in financial markets. Journal of Finance, 66(1):67–97.
- [Fama (1998] Eugene F. Fama. 1998. Market efficiency, long-term returns, and behavioral finance. Journal of Financial Economics, 49:238–306.
- [Feldman et al. (2011] Ronen Feldman, Benjamin Rosenfeld, Roy Bar-Haim, and Moshe Fresko. 2011. The stock sonar - sentiment analysis of stocks based on a hybrid approach. In Proceedings of the Twenty-Third Conference on Innovative Applications of Artificial Intelligence, August 9-11, 2011, San Francisco, California, USA.
- [Fillmore (1976] Charles J. Fillmore. 1976. Frame semantics and the nature of language. Annals of the New York Academy of Sciences, 280(1):20–32.
- [Galitsky (2014] Boris Galitsky. 2014. Learning parse structure of paragraphs and its applications in search. Engineering Applications of Artificial Intelligence, 32(0):160 – 184.
- [Gentzkow and Shapiro (2010] M. Gentzkow and J. M. Shapiro. 2010. What drives media slant? evidence from u.s. daily newspapers. Econometrica, 78(1):35â71.
- [Gerber et al. (2009] A. S. Gerber, D. Karlan, and D. Bergan. 2009. Does the media matter? a field experiment measuring the effect of newspapers on voting behavior and political opinions. American Economic Journal: Applied Economics, 1(2):35â52.
- [Joshi et al. (2010] Mahesh Joshi, Dipanjan Das, Kevin Gimpel, and Noah A. Smith. 2010. Movie reviews and revenues: An experiment in text regression. In Human Language Technologies: The 2010 Annual Conference of the North American Chapter of the Association for Computational Linguistics, pages 293–296, Los Angeles, California, June. Association for Computational Linguistics.
- [Kim and Hovy (2006] Soo-Min Kim and Eduard Hovy. 2006. Extracting opinions, opinion holders, and topics expressed in online news media text. In Proceedings of the Workshop on Sentiment and Subjectivity in Text, SST ’06, pages 1–8, Stroudsburg, PA, USA. Association for Computational Linguistics.
- [Kogan et al. (2009] Shimon Kogan, Dimitry Levin, Bryan R. Routledge, Jacob S. Sagi, and Noah A. Smith. 2009. Predicting risk from financial reports with regression. In Proceedings of Human Language Technologies: The 2009 Annual Conference of the North American Chapter of the Association for Computational Linguistics, NAACL ’09, pages 272–280. Association for Computational Linguistics.
- [Lee et al. (2014] Heeyoung Lee, Mihai Surdeanu, Bill Maccartney, and Dan Jurafsky. 2014. On the importance of text analysis for stock price prediction. In LREC’14, Reykjavik, Iceland, may.
- [Lodhi et al. (2002] Huma Lodhi, Craig Saunders, John Shawe-Taylor, Nello Cristianini, and Chris Watkins. 2002. Text classification using string kernels. Journal of Machine Learning Research, 2:419–444, March.
- [McDonald et al. (2005] Ryan McDonald, Fernando Pereira, Kiril Ribarov, and Jan Hajič. 2005. Non-projective dependency parsing using spanning tree algorithms. In Proceedings of the Conference on Human Language Technology and Empirical Methods in Natural Language Processing, HLT ’05, pages 523–530, Stroudsburg, PA, USA. Association for Computational Linguistics.
- [Moschitti (2006] Alessandro Moschitti. 2006. Making tree kernels practical for natural language learning. In In Proceedings of the 11th Conference of the European Chapter of the Association for Computational Linguistics.
- [Rydberg and Shephard (2003] Tina H. Rydberg and Neil Shephard. 2003. Dynamics of Trade-by-Trade Price Movements: Decomposition and Models. Journal of Financial Econometrics, 1(1):2–25.
- [Sayeed et al. (2012] Asad B. Sayeed, Jordan Boyd-Graber, Bryan Rusk, and Amy Weinberg. 2012. Grammatical structures for word-level sentiment detection. In Proceedings of the 2012 Conference of the North American Chapter of the Association for Computational Linguistics: Human Language Technologies, NAACL HLT ’12, pages 667–676. Association for Computational Linguistics.
- [Schumaker et al. (2012] Robert P. Schumaker, Yulei Zhang, Chun-Neng Huang, and Hsinchun Chen. 2012. Evaluating sentiment in financial news articles. Decision Support Systems, 53(3):458 – 464.
- [Shervashidze et al. (2011] Nino Shervashidze, Pascal Schweitzer, Erik Jan van Leeuwen, Kurt Mehlhorn, and Karsten M. Borgwardt. 2011. Weisfeiler-lehman graph kernels. Journal of Machine Learning Research, 12:2539–2561, November.
- [Smits and Jordaan (2002] G.F. Smits and E.M. Jordaan. 2002. Improved svm regression using mixtures of kernels. In Proceedings of 2002 International Joint Conference on Neural Networks, IJCNN’02, pages 2785–2790. IEEE.
- [Suzuki et al. (2003] Jun Suzuki, Tsutomu Hirao, Yutaka Sasaki, and Eisaku Maeda. 2003. Hierarchical directed acyclic graph kernel: Methods for structured natural language data. In Proceedings of the 41st Annual Meeting on Association for Computational Linguistics - Volume 1, ACL ’03, pages 32–39, Stroudsburg, PA, USA. Association for Computational Linguistics.
- [Tetlock et al. (2008] Paul C. Tetlock, Maytal Saar-Tsechansky, and Sofus Macskassy. 2008. More than Words: Quantifying Language to Measure Firms’ Fundamentals. The Journal of Finance.
- [Tetlock (2007] Paul C. Tetlock. 2007. Giving Content to Investor Sentiment: The Role of Media in the Stock Market. The Journal of Finance.
- [Weisfeiler and Lehman (1968] B. Weisfeiler and A. A. Lehman. 1968. A reduction of graph to a canonical form and an algebra arising during this reduction. Nauchno-Technicheskaya Informatsiya, Ser. 2, no. 9.
- [Wiebe et al. (2005] Janyce Wiebe, Theresa Wilson, and Claire Cardie. 2005. Annotating expressions of opinions and emotions in language. Language Resources and Evaluation, 39(2-3):165–210.
- [Wong et al. (2014] Felix Ming Fai Wong, Zhenming Liu, and Mung Chiang. 2014. Stock market prediction from WSJ: text mining via sparse matrix factorization. In 2014 IEEE International Conference on Data Mining, ICDM 2014, Shenzhen, China, December 14-17, 2014, pages 430–439.
- [Xie et al. (2013] Boyi Xie, Rebecca J. Passonneau, Leon Wu, and Germán Creamer. 2013. Semantic frames to predict stock price movement. In Proceedings of the 51st Annual Meeting of the Association for Computational Linguistics (Volume 1), pages 873–883, Sofia, Bulgaria, August. Association for Computational Linguistics.
- [Yogatama and Smith (2014] Dani Yogatama and Noah A. Smith. 2014. Linguistic structured sparsity in text categorization. In Proceedings of the 52nd Annual Meeting of the Association for Computational Linguistics (Volume 1: Long Papers), pages 786–796, Baltimore, Maryland, June. Association for Computational Linguistics.
- [Zhang and Lee (2003] Dell Zhang and Wee Sun Lee. 2003. Question classification using support vector machines. In Proceedings of the 26th Annual International ACM SIGIR Conference on Research and Development in Informaion Retrieval, SIGIR ’03, pages 26–32, New York, NY, USA. ACM.
- [Zhang and Skiena (2010] Wenbin Zhang and Steven Skiena. 2010. Trading strategies to exploit blog and news sentiment. In William W. Cohen and Samuel Gosling, editors, ICWSM. The AAAI Press.