Modeling Equal and Unequal Mass Binary Neutron Star Mergers Using Public Codes
Abstract
We present three-dimensional simulations of the dynamics of binary neutron star (BNS) mergers from the late stage of the inspiral process up to ms after the system has merged, either to form a hyper-massive neutron star (NS) or a rotating black hole (BH). We investigate five equal-mass models of total gravitational mass , , , and , respectively; and four unequal mass models with and , , , and (where is the mass ratio). We use a semi-realistic equation of state (EOS), namely the seven-segment piece-wise polytropic SLyPP with a thermal component given by . We have also compared the resulting dynamics (for one model) using both, the BSSN-NOK and CCZ4 methods for the evolution of the gravitational sector, and also different reconstruction methods for the matter sector, namely PPM, WENO and MP5. Our results show agreement and high resolution, but superiority of BSSN-NOK supplemented by WENO reconstruction at lower resolutions.
One of the important characteristics of the present investigation is that for the first time, it has been done using only publicly available open source software: the Einstein Toolkit code, deployed for the dynamical evolution; and the LORENE code, for the generation of the initial models. All of the source code and parameters used for the simulations have been made publicly available. This not only makes it possible to re-run and re-analyze our data, but also enables others to directly build upon this work for future research.
pacs:
04.25.D-, 04.40.Dg, 95.30.Lz, 97.60.JdI Introduction
The new generation of ground-based laser interferometer gravitational wave observatory Advanced LIGO Aasi et al. (2015) and Advanced Virgo Acernese et al. (2015) have just now opened a new window in the Universe with the first detection Abbott et al. (2016) of Gravitational Waves (GW) emitted by the merger of two black holes. Among other likely sources of GW signals in the sensitive frequency band of () Hz are signals from binary neutron star (BNS) mergers, with expected event rates reaching per year between LIGO Scientific Collaboration et al. (2013); Abadie et al. (2010). Signals from these events are expected to contain the signature of the equation of state (EOS) governing matter at nuclear density.
In the description of the BNS mergers are involved essentially three stages, the inspiral, the merger and the final evolution to its final state (post-merger stage) that would quite likely be a final black hole (BH) surrounded by an accretion disk. The inspiral phase can be modeled with good accuracy by post-Newtonian calculations and, in particular, using the Effective One Body (EOB) approach Buonanno and Damour (1999). They are capable of producing accurate waveforms up to a time very close to the merger. More recently, the EOB approach started to be used to model tidal corrections Damour and Nagar (2010); Bini et al. (2012). These analytic techniques are useful for quickly computing waveform templates to matched filtering searches in GW detector data analysis. The role of Numerical Relativity (NR) in this regime is mainly to test and help improve the properties of these analytic techniques. However, one has to keep in mind that such comparison and improvement would need the use of NR data extrapolated at infinite resolutions or at a resolution where discretization errors are negligible. To do this analysis, the convergence properties of the used code during the inspiral phase needs to be known. For the post-merger stage, NR is the only available investigation tool to confront the experimental result that would be obtained by a successful LIGO/VIRGO detection with the underlying physics of neutron stars (NS). As pointed out in Takami et al. (2015a, b) and in references therein, an accurate description of the GW emission of different model sources (models inferred by different choice of the underlying NS physics through different choices of EOS) are useful for developing empirical relations to be able to infer NS parameters from future GW detections as well as to get information on the correct EOS that describe matter at these extreme conditions.
In this work, we concentrate on the information that can be extracted from BNS simulations using the SLy EOS Douchin and Haensel (2001), where a semi-realistic seven-segment piece-wise (isentropic)-polytropic approximant Read et al. (2009), namely the SLyPP EOS, is used and whose different parameters are reported in Table 1. Such an approximant covers the whole range of density simulated, starting from the NR atmosphere of up to the density in the interior of the NS supplemented by an artificial thermal component to ensure that the hydro-dynamical evolution is consistent with the Energy-Momentum tensor conservation. To such extent, we simulated five equal mass BNS systems and four unequal mass systems, and for each of these systems we simulated the late-inspiral phase (last three to five orbits, depending on the model) and post-merger using at least three different resolutions and the state-of-the-art WENO fifth-order reconstruction method Harten et al. (1987); Shu (1999). We evolved the gravitational part of the system using the well-tested BSSN-NOK evolution scheme Nakamura et al. (1987); Shibata and Nakamura (1995); Baumgarte and Shapiro (1999); Alcubierre et al. (2000, 2003). For one BNS system, we also compared the evolution using different reconstruction methods (PPM and MP5, in addition to WENO) and a different spacetime evolution scheme: CCZ4 Alic et al. (2012). We checked the influence of the EOS by simulating BNS models that have the same total baryonic mass but different EOS, in our case two simple one-piece (isentropic)-polytropic EOSs with different stiffness ( and ). We did a complete convergence analysis of the computed merger times of the BNS as a function of the resolution in the case of WENO and PPM reconstruction (using BSSN-NOK evolution for the gravitational sector).
The organization of the paper is as follows. In Sec. II we describe the properties of the BNS systems investigated in the present work, and we review the numerical setup used. In Sec. III we present and discuss our results. Conclusions that can be drawn from the present investigation are given in Sec. IV and, finally, the computational cost of the simulations is discussed in the appendix.
Throughout this paper we use a space-like signature , with Greek indices running from 0 to 3, Latin indices from 1 to 3, and the standard convention for summation over repeated indices. The computations are performed using the standard split into (usually) space-like coordinates and a time-like coordinate . Our coordinate system (far from the origin) has, as it can be checked, almost isotropic coordinates and far from the origin they would have the usual measure unit of “time” and “space”. In particular, is time when measured from an observer at infinity.
All computations have been done in normalized computational units (hereafter denoted as CU) in which . We report all results in cgs units except for values of the polytropic constant , whose unit of measurement depends on the value of the dimensionless polytropic exponent , so we report in the above defined normalized unit CU). CU are also used to denote resolutions, e.g., CU, and there they mean the resolution on the finest grid at initial time (which for most cases is the same for the entire evolution). We also report masses in terms of the solar mass . The reader should note that, as is usual in most of the work on this subject, we describe matter using the variable (baryon mass density), (specific internal energy) and , instead of the typical notation used in astrophysics, (energy density), (baryon number density) and . Their relation is the following: and ( is the baryon mass).
II Initial Models and Numerical Methods

| i | |||
|---|---|---|---|
| (CU) | () | ||
| 0 | 1.58425 | ||
| 1 | 1.28733 | ||
| 2 | 0.62223 | ||
| 3 | 1.35692 | ||
| 4 | 3.005 | ||
| 5 | 2.988 | ||
| 6 | 2.851 |
In the present work we have analyzed the dynamics of the merger of two NSs from the late stage of the inspiral process to around 20 ms after the system has merged to form a hyper-massive NS or a rotating BH. To be properly described, such a system needs the use of the Einstein’s GR equations to describe the metric () of the dynamical spacetime and a proper treatment for the description of matter (see Löffler et al. (2012) for more details on the employed equations). For describing the matter present in the system we use its perfect-fluid approximation, and close the system of evolution equations using an EOS of the form , where is the pressure, is the rest mass density, and is the specific internal energy of the matter. In the present work we used a seven-segment isentropic polytropic approximant (what we refer to here as SLyPP) of the widely used SLy EOS prescription Douchin and Haensel (2001) supplemented by a thermal component described by (see and Figure 1).
More precisely, , and in each density region :
| (1) | |||||
| (2) | |||||
| (3) |
where and are chosen to ensure the pressure and specific energy density continuity. Fig. 1 shows a plot of the pressure () and of the adiabatic index () as a function of the energy density for the SLy EOS (gray line) Douchin and Haensel (2001) and its piece-wise polytropic approximation, used in the present work (dashed red line, SLyPP) Read et al. (2009) supplemented by a thermal component . Also shown are two often-used isentropic EOS with . These can be seen as a single-piece approximant of the same SLy EOS (see De Pietri et al. (2014); Löffler et al. (2015)), and have been used for test cases here. The exact parameters of the seven-segment isentropic polytropic approximant are shown in Table 1 and, as can be seen in the panels of Fig. 1 where the vertical dots lines shown the transition of the approximant between the various region, they represent various physically distinct parts of the star.
Following the discussion of Bauswein et al. (2010) we have chosen to use the arbitrary choice of . This choice has a few drawbacks, the main one being that in the low-density region it should approach , since there the pressure is provided primarily by an ideal gas of ultra-relativistic electrons and photons, so we overestimate the pressure support. On the other hand (see Bauswein et al. (2010)), a value of seems to be too high, while a value of might yield a too low pressure support in the core.
All equations are solved as evolution equations with respect to a coordinate time , using the common 3+1 decomposition of space-time (see Löffler et al. (2012) and references therein for details and notation).
The initial data of our simulations is calculated using the LORENE code Gourgoulhon et al. (2001); LORENE that provides the possibility to generate arbitrary initial data for irrotational BNS.
| name | |||||||
|---|---|---|---|---|---|---|---|
| SLy12vs12 | 1.20 | 1.20 | 1.11 | 1.11 | 1.932 | 2.207 | 5.076 |
| SLy13vs13 | 1.30 | 1.30 | 1.20 | 1.20 | 1.989 | 2.373 | 5.730 |
| SLy14vs14 | 1.40 | 1.40 | 1.28 | 1.28 | 2.040 | 2.536 | 6.405 |
| SLy15vs15 | 1.50 | 1.50 | 1.36 | 1.36 | 2.089 | 2.697 | 7.108 |
| SLy16vs16 | 1.60 | 1.60 | 1.44 | 1.44 | 2.134 | 2.854 | 7.832 |
| SLy135vs145 | 1.35 | 1.45 | 1.24 | 1.32 | 2.040 | 2.536 | 6.397 |
| SLy13vs15 | 1.30 | 1.50 | 1.20 | 1.36 | 2.040 | 2.535 | 6.376 |
| SLy125vs15 | 1.25 | 1.55 | 1.16 | 1.40 | 2.040 | 2.533 | 6.337 |
| SLy12vs16 | 1.20 | 1.60 | 1.11 | 1.44 | 2.039 | 2.531 | 6.281 |
| G275th14vs14 | 1.40 | 1.40 | 1.29 | 1.29 | 2.053 | 2.554 | 6.513 |
| G300th14vs14 | 1.40 | 1.40 | 1.26 | 1.26 | 2.028 | 2.498 | 6.243 |
The properties of the initial data we simulated are summarized in Table 2 where are reported, for each model, the baryonic masses of the two stars (, ), their gravitational masses (, ) at infinite separation, the initial rotational angular velocity (), and the total mass () and angular momentum (J). All these models were generated to be at a relative physical distance of km. We generated five equal-mass models of total gravitational mass , , , and , respectively, and four unequal mass models with and , , , and (where ).
One of the main characteristics of the present investigation is that it can be reproduced using only freely available open source software. The GNU licensed LORENE code LORENE has been used for generating the initial condition, and the Einstein Toolkit Löffler et al. (2012); EinsteinToolkit was deployed for the dynamical evolution. The Einstein Toolkit is a free, publicly available, community-driven general relativistic (GR) code. In particular we have chosen the eleventh release (code name “Hilbert”, ET_2015_05). Some local modification and additions were necessary, all of which are open-source and freely available from the gravity SVN server of Parma University, and all of which are planned to be proposed to be in the next release of the Einstein Toolkit (see appendix).
The Einstein Toolkit is based on the Cactus Computational Toolkit Cactus developers ; Goodale et al. (2003); Allen et al. (2011), a software framework for high-performance computing (HPC). Its main tools used in the present study are:
- •
- •
-
•
The evolution of the spacetime metric handled by the McLachlan package McLachlan . This code is auto-generated by Mathematica using Kranc Husa et al. (2006); Lechner et al. (2004); Kranc , implementing the Einstein equations via a dimensional split using the BSSN-NOK formalism Nakamura et al. (1987); Shibata and Nakamura (1995); Baumgarte and Shapiro (1999); Alcubierre et al. (2000, 2003) and CCZ4 Alic et al. (2012)
All the main properties used in the deployed code are described in much more detail in Löffler et al. (2015) for the Einstein Toolkit in general, in Mösta et al. (2014) for especially some details about the hydrodynamics, and in De Pietri et al. (2014); Löffler et al. (2015) for similar usage in previous work. In particular:
- •
-
•
We use fourth-order finite difference stencils for the curvature evolution, Alcubierre et al. (2003) slicing, and a -driver shift condition Alcubierre et al. (2003). During evolution, a Sommerfeld-type radiative boundary condition is applied to all components of the evolved BSSN-NOK variables as described in Alcubierre et al. (2000).
- •
-
•
An artificial low-density atmosphere with CU is used, with a threshold of CU below which regions are set to be atmosphere. Hydrodynamical quantities are also set to be atmosphere at the outer boundary.
-
•
All evolutions presented here use a mirror symmetry across the plane, consistent with the symmetry of the problem, which reduces the computational cost by a factor of .
-
•
We use mesh refinement, with a fixed box-in-box topology for all simulations except otherwise noted. The boundaries of the six levels (seven for simulations involving a final black hole) are indicated in Tab. 5.
-
•
Different reconstruction methods have been used, and their effects on the results are shown in Sec. III. The reconstruction method used for most of the simulations is the essentially non-oscillatory method WENO (5th order weighted-ENO) Harten et al. (1987); Shu (1999), while the other reconstruction methods employed are PPM (the piece-wise parabolic reconstruction method) Colella and Woodward (1984), and MP5 (5th order monotonicity preserving) Radice and Rezzolla (1997).
- •
The computational cost of the simulation is described in the appendix A and shown in Table 6, and it is almost the same in the case of using different reconstruction methods (WENO, PPM, MP5) or in the case of the CCZ4 method for the evolution of the gravitational sector. From the data shown in Table6 one may note that simulations with resolution , CU can be performed on a workstation while a whole simulation of a model at resolution CU will need current computational resources comparable to 256 cores for 6 days.
As will be shown in the next section, the fact that our code gives a reasonable numerical result at very coarse resolution such as , CU has been very valuable in setting the details of the simulations and on the specific choice of the initial model to be studied.
III Results
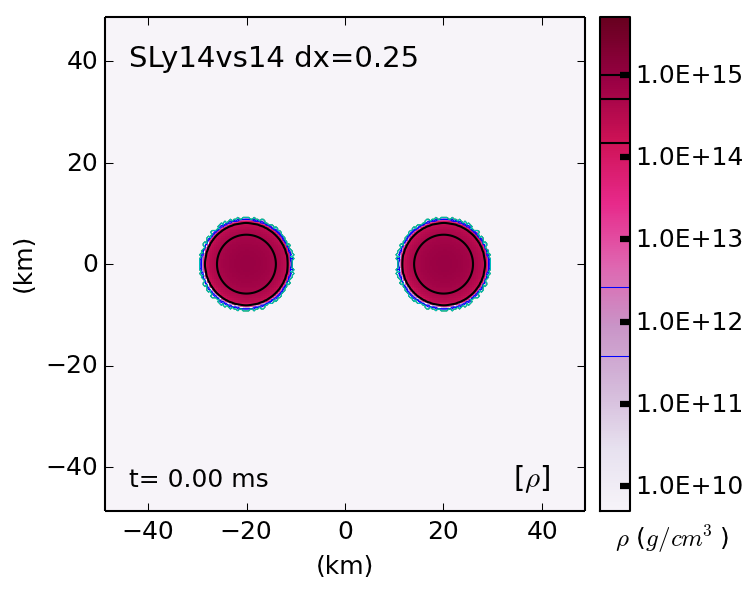
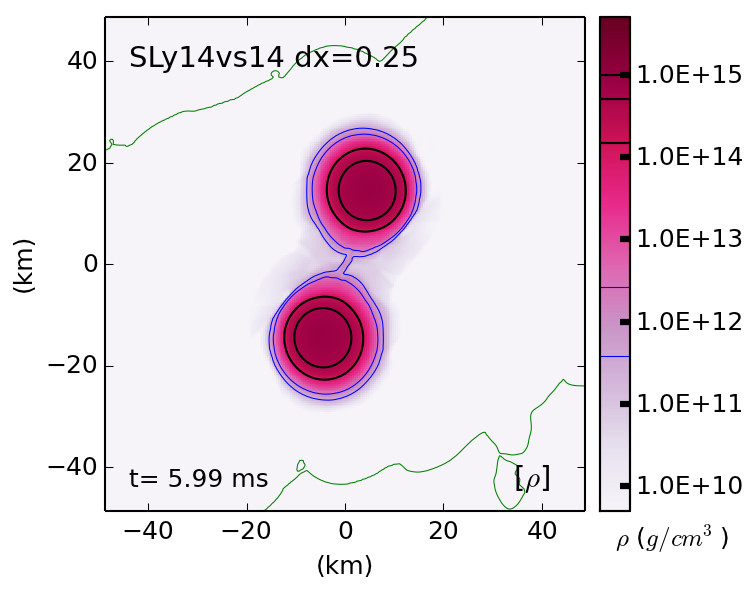
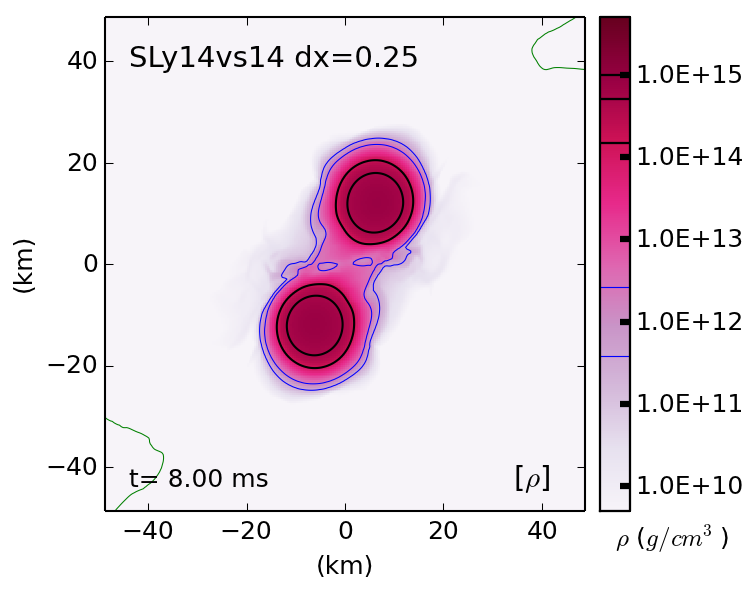
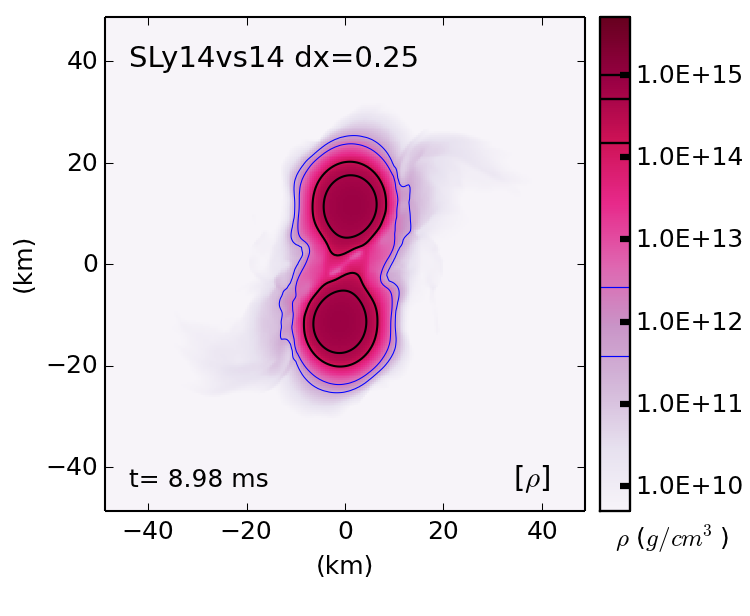
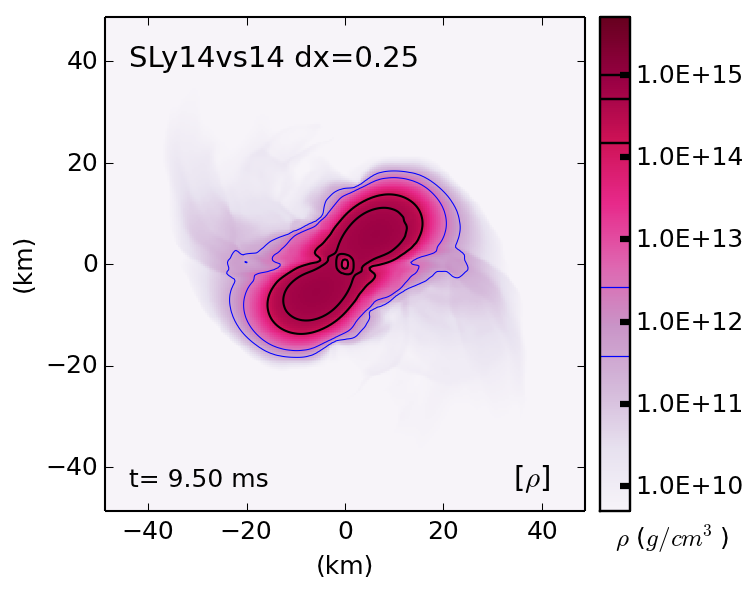
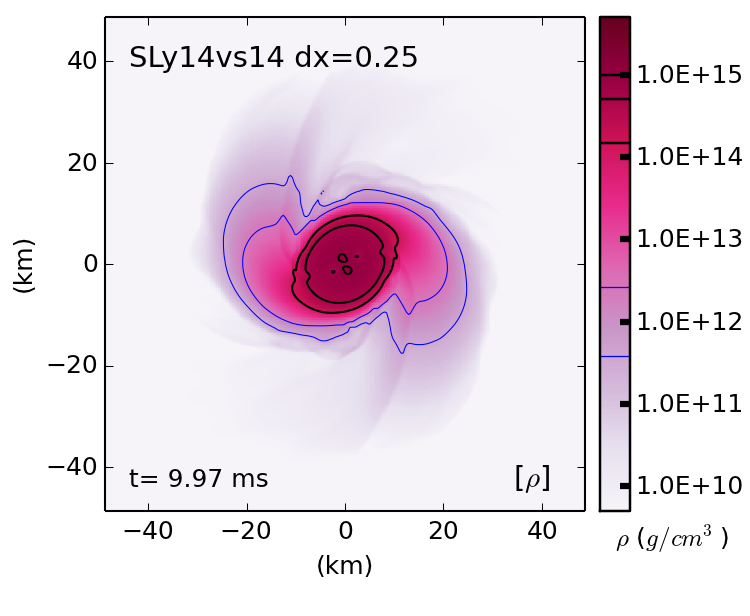
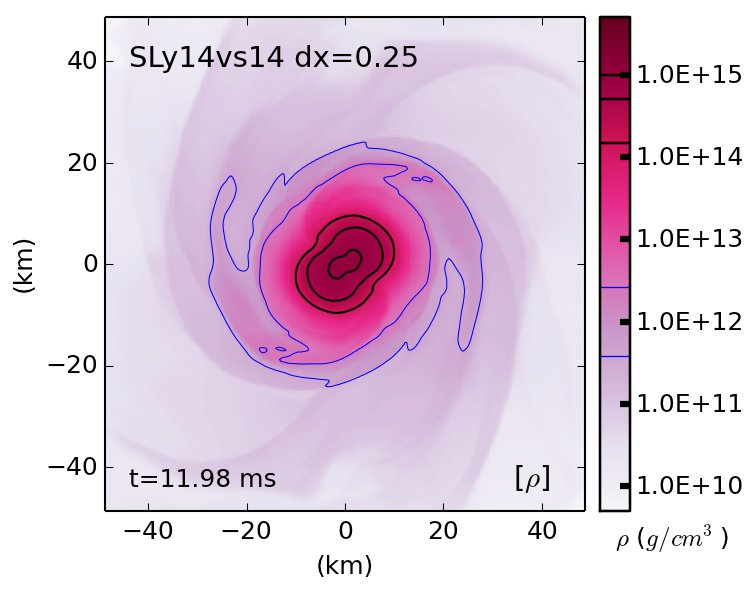
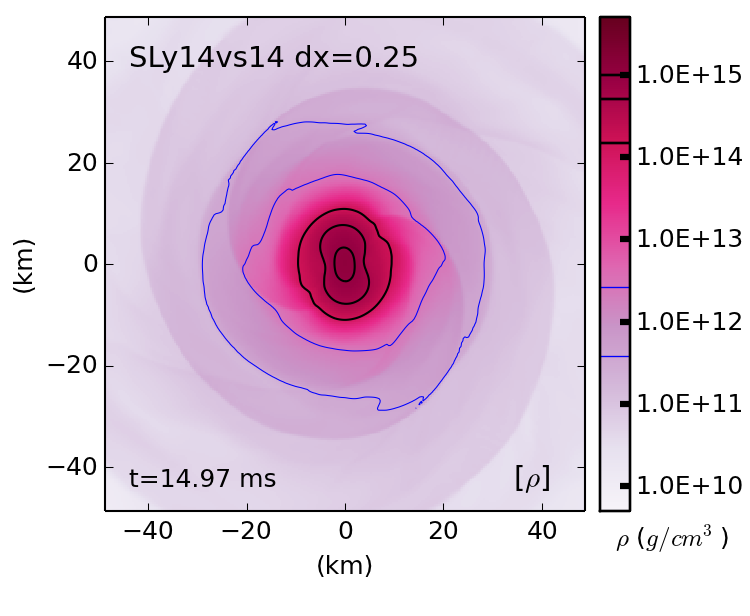
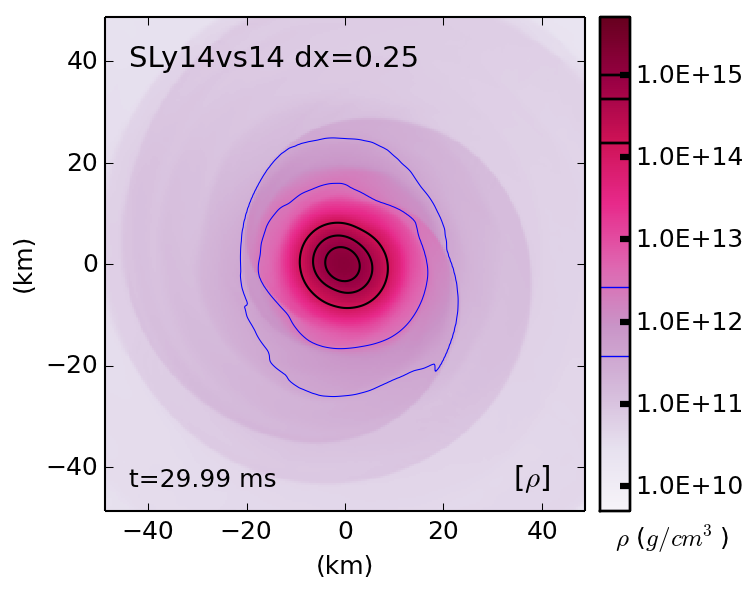
The general characteristics of the evolution of the systems is shown (for model SLy14vs14, where 14vs14 stands for baryon masses ) in Figure 2, where we plotted the density in the plane during various stages of the evolution. In the top panel the initial configuration is shown, alongside a snap-shot depicting a sensible tidal-deformation and the start of the actual merger phase, which then proceeds on the middle panel. The after-merger relaxation phase can be seen at the bottom panel, until the end of the simulation.

The overall process is associated with emission of gravitational radiation and a consequent loss of energy and angular momentum associated to such emission. The procedure we follow to extract this information is described in detail in the following (subsection III.1). In the case of model SLy14vs14 we have found that the maximum signal we obtain is in the component of the GW signal, with the total amount of energy extracted from the GW emission being of the order of . The loss of angular momentum (in the component) is of the order of (see Figure 3). Note especially that there is a clear peak on the amplitude of the GW signal (), which will later be used as an indication of the merger time.
III.1 Gravitational Wave Signal Extraction
From each simulation, we extracted the GW signal using both the curvature-perturbation theory based on the Newman-Penrose scalar Newman and Penrose (1962) and the Regge-Wheeler Regge and Wheeler (1957) and Zerilli Zerilli (1970) theory of metric-perturbations of the Schwarzschild spacetime, in the gauge-invariant formulation by Moncrief Moncrief (1974).
The Newman-Penrose scalar is calculated by the Einstein Toolkit module WeylScal4, following the prescription of Baker et al. (2002), and is decomposed in spin-weighted spherical harmonics of spin by the module Multipole:
| (4) |
We extracted components up to . is linked to the GW strain by the following relation, formally valid only at spatial infinity:
| (5) |
We therefore need to integrate each component of twice in time to get . We performed those integrations numerically in the time domain using a simple trapezoidal rule.
| (6) |
Please note that here we defined the quantities in the coordinate time of the detector and not with respect to the retarded time (see below for the definition of the retarded time) at the location of the detector. Following the discussion of Damour et al. (2008), we integrated the signal twice from coordinate time and not from the zero of the retarded time () at the detector. We then perfom a linear fit of the strain and subtracted its result to the integrated signal to obtain
| (7) |
where the fit parameters have a clear physical interpretation as and .
However, we found that the free choice of integration constants is not very effective in eliminating the initial spurious radiation. The choice of starting the integral from in coordinate time may be useful if complex fitting procedures are used, or if the simulation time of the data is short; but this is not the case for the present simulations. Starting the integral from also has the advantage of much smaller values of and to recover with the fitting procedure, thus reducing the fit errors.
On the other hand, integrating from zero retarded time instead leads to unphysical amplitude oscillations in the first of the inspiral. These are not present with our final integration procedure and also not in the signal from the Regge-Wheeler-Zerilli variables, which do not require integrations. The resulting waveforms obtained with the procedure described above show a left-over non-linear drift in , that was attributed in Reisswig and Pollney (2011) to unresolved high-frequency noise aliased in the low-frequency signal that does not result in a zero average in the double integration. Instead of adopting the fixed-frequency integration method recommended in Reisswig and Pollney (2011) (which we found to be too sensible to the low-frequency cutoff choice) we performed a fit to a second order polynomial as already done in Baiotti et al. (2009), obtaining:
| (8) |
We found that this is sufficient to eliminate most of the non-physical drift in the signal, at least for the dominant modes responsible for almost all of the radiated energy and angular momentum. For higher multipoles, even higher-order fitting polynomials may be used to reduce the drift, as already observed in Berti et al. (2007). However, we did find that the use of such a higher-order fitting polynomial is not sufficient to eliminate the residual drift still present, and we find no advantage in applying such procedure. We instead stick to use only second-order polynomials where the additional constant may be interpreted as an offset constant value due to the fact that the is extracted at a finite radius and not at or close to infinity.
For our simulations, we also used the GW extraction from the Regge-Wheeler (odd, ) and Zerilli (even, ) functions that are computed by the code WaveExtract and are related to the GW strain (in our normalization) by:
| (9) |
where is the Schwarzschild coordinate, while our standard NR coordinates are asymptotically similar to isotropic coordinates Nakano et al. (2015) and we have the following expression for
| (10) | |||||
| (11) |
where is the coordinate radius, is the coordinate time and is the initial ADM mass of the system (see table 2). We also checked that the resulting agrees with the areal radius , where is the surface of the sphere of constant coordinate radius () that is derived using such extraction. We found the relative difference between the measured values of and from the simulation and the values used in Eqs. at coordinate time , to be a few parts over , for a detector at coordinate radius CU.
We extracted the GW signal at 13 different coordinate radii from CU to CU to check its convergence and whether the extraction at the outermost radius is a sufficient approximation of the theoretically necessary extraction at spatial infinity. In the following, we do not develop a full discussion of the convergence properties of the extraction at different radii or the comparison of different extraction methods; we limit our work here to the representative model SLy14vs14. Here, the signals , computed at coordinate radii CU and CU agree with an error of the order of 1% during the entire simulation. We also found that the amplitude and the phase of the signal extracted at different radii were scaling better with than with the Regge-Wheeler and Zerilli (RWZ) extraction. The RWZ waveforms showed also unphysical amplitude oscillations in the final part of the signal. For these reasons, all the amplitudes and signals discussed in the present work will refer to extraction based on , performed at coordinate radius CU, and we use
| (12) |
where and are the radius and retarded time at which the GW signal is extracted, computed using Eqs. (10,11). This corresponds to the GW signal as measured at unit distance and as if the signal would have been emitted at the coordinate origin.
From the GW signal we were able to compute the radiated energy, angular momentum and linear momentum fluxes, following the procedure described in Brügmann et al. (2008). We arrive at the final expression for the complex GW signal on a spherical surface at radius :
| (13) |
In the results presented here, this quantity refers to the extraction radius CU, and the sum over is limited to , as that it is the maximum for which we extract components. The above expression for the gravitational signal allows to obtain the final equations:
| (14) | |||||
| (15) |
where is the derivative with respect to of and is the physical radius of the extraction sphere.
The above procedure allows us to define the merger time () as the time for which we have the maximum of the -component of the GW signal (). Clearly, values defined in this way depend on the resolutions used to perform the simulation and on the accuracy of the employed simulation method. A detailed study of the convergence of the simulation methods used is of paramount importance.


III.2 Accuracy in the Determination of Merger Time
The code we use (GRHydro), as discussed previously, allows the use of different reconstruction methods for the hydrodynamics sector (among others: WENO, PPM and MP5). We also have the potential to use an alternative scheme for the integration of the gravitational sector, namely CCZ4. Different choices in numerical methods may lead not only to different orders of convergence, but also to different ranges of convergence even for methods with the same convergence order. To investigate the effect of different numerical methods on the errors (especially in the determination of merger time) and gain confidence in the obtained results, we simulated the same model (SLy14vs14) using different combinations of numerical methods, but keeping all other parameters the same. The different combinations were:
The first result we report here is that, as shown in Fig. 4, all four combinations describe the same dynamics, for a resolution CU. However, from a single resolution alone a possibly different degree of accuracy cannot be deducted. Therefore, we have examined the four different aforementioned combinations of numerical methods at various resolutions in the range CU and focused the analysis on the pre-merger stage. For each resolution, we performed a full simulation and computed the merger time (). Clearly all the values we obtained are an approximation of the “true” merger time of the system, but differences between numerical methods and trends for different resolutions can be observed. For example, in the case of the standard setup used in this work (WENO and BSSN-NOK), ranges from ms at a very coarse CU resolution to ms at the highest resolution used ( CU, about three times more expensive to perform than the reference resolution ).
We also found that simulations of model SLy14vs14 do not merge (within a simulation time of ms), contrary to what we found using WENO and BSSN-NOK, at all the other three combinations of evolution methods, when using resolution coarser than or equal to CU. A full table of the computed merger times is shown in Figure 5 where we also plot the merger time vs. resolution for all four choices of numerical methods. The figure clearly shows that the combination WENO and BSSN-NOK performs much better at lower resolutions, at least for systems like the one we investigate here. In practice, using our standard setup, we obtained reasonable merger properties even at a very low resolution of CU and, in some cases, at least qualitative agreement using a resolution as low as CU. This simulation can be performed on a laptop.
The fact that a WENO-CCZ4 evolution needs a higher resolution than the WENO-BSSN-NOK may be due to the fact that the Hamiltonian constraint (even if damped) enters in the evolution equations of the CCZ4 system, while this is not the case for the BSSN-NOK scheme Alic et al. (2012). It was also pointed out in Alic et al. (2013) that CCZ4 may show instability depending on the value of the damping parameter (we used , for ). Our result indicates that a deeper study of the properties of the CCZ4 formulation (and the very similar Z4c formulation Ruiz et al. (2011)) is needed for its use at very low resolution. At the same time, the result that the PPM scheme is less accurate does not come as a surprise, since it is formally a third-order method instead of a fifth-order one (like WENO). The fact that the results for the MP5 reconstruction are worse than the ones for WENO (at the resolutions used here) needs further investigation too, and is left for future work.
Despite all observed differences it is important to make sure that all tested methods lead to the same determination of the “true” merger time, denoted as as it is the merger time computed using an unlimited resolution, i.e., . The results for the determination of the merger using an extrapolation from its values as a function of the resolution are shown in Figure 5. We have found that all data (except when using CU) show a convergence order of almost exactly two for WENO-BSSN-NOK, which seems to indicate that the main error (for the merger phase) is dominated by a second-order method. If we fit the merger time as a function of the used resolution () and assume the following dependence: , we obtain ms and , which is consistent with the assumption of a second-order convergence for the simulation of the merger phase. A similar analysis for WENO-BSSN-NOK results in a similar convergence rate and merger time. However, more simulations of higher resolution would be necessary for the other two possibilities, MP5-BSSN-NOK and WENO-CCZ4. Since we find agreement between the extrapolated time using the combination WENO-BSSN-NOK and PPM-BSSN-NOK already for moderate resolution, we decided not to push this analysis forward for the other two methods due to the low impact of the result on this work compared to the high computational cost.
We cannot currently explain with certainty why the merger-time increases with resolution for WENO+BSSN, while this is different for other combinations of numerical methods. A similar trend has also been reported in Hotokezaka et al. (2015a), where an adapted version of Z4c method and a Kurganov-Tadmor scheme Kurganov and Tadmor (2000) with PPM interpolation for matter evolution have been used. In Palenzuela et al. (2015) it is asserted that sign differences in the merger time trend for different resolutions between different codes may be due to a different sign of the numerical errors introduced by the various methods, leading to a different effect (in sign) on the dependence of the merger time with respect to resolution.
Of the numerical methods employed in the present paper, the only second-order method is the computation of the flux-vector-splitting, which seems to dominate (in case of WENO reconstruction) the convergence order over all other numerical methods. Higher-order flux-vector-splitting methods exist and have been used in simulations of BNS mergers in recent work Radice et al. (2015, 2015). Our study suggests that the combined use of high-order flux-vector-splitting with WENO reconstruction seems to be the most effective numerical method to be used in simulating BNS mergers.
III.3 General Results for the Properties of the Evolution.
As explained in Section II we evolved eleven different models of BNS systems whose properties are summarized in Table 2. The evolution of all models shows the same overall dynamics as that of model SL14vs14 (see Figures 2 and 3) with two notable exceptions: the evolution of model SLy16vs16 which promptly forms a BH after the two stars merge, and the evolution of model SLy15vs15 which shows a delayed BH formation: ms after the merger, at resolution CU. A more detailed discussion of the BH formation properties of these models can be found in subsection III.4).
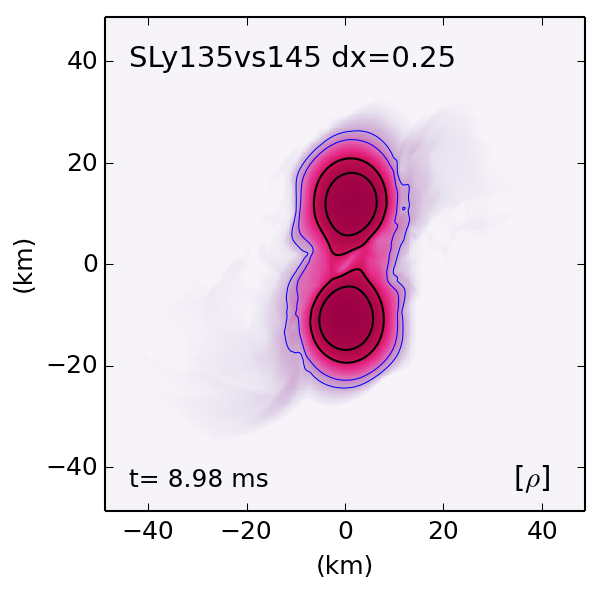
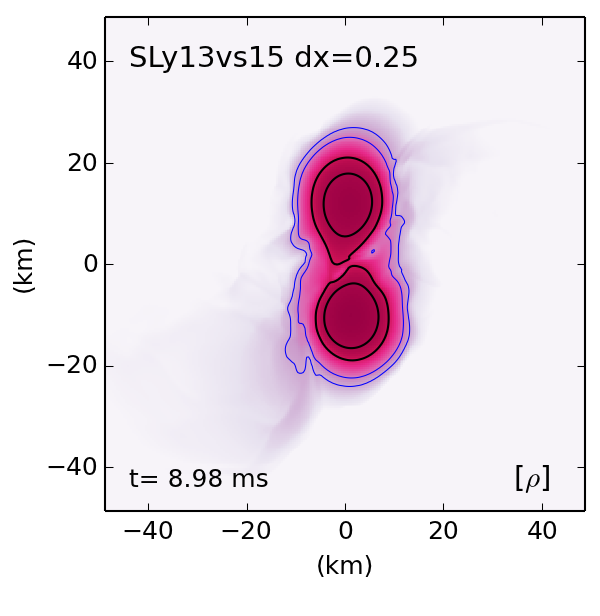
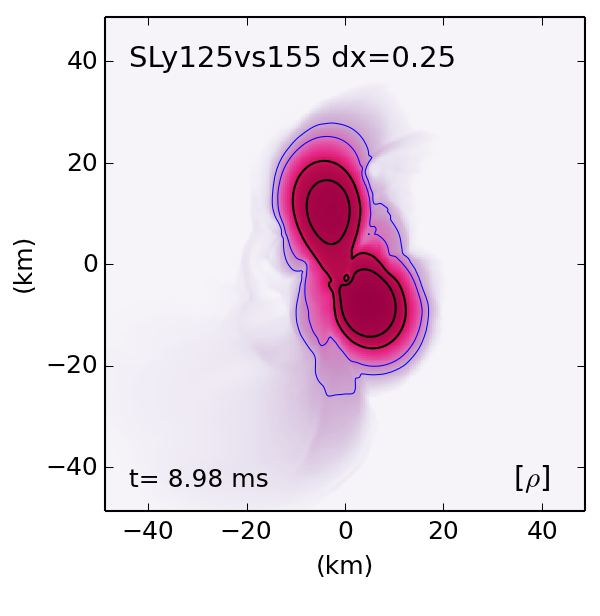
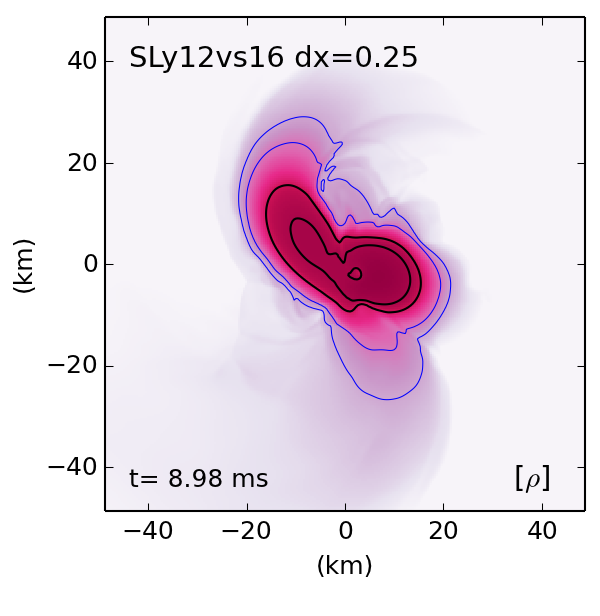
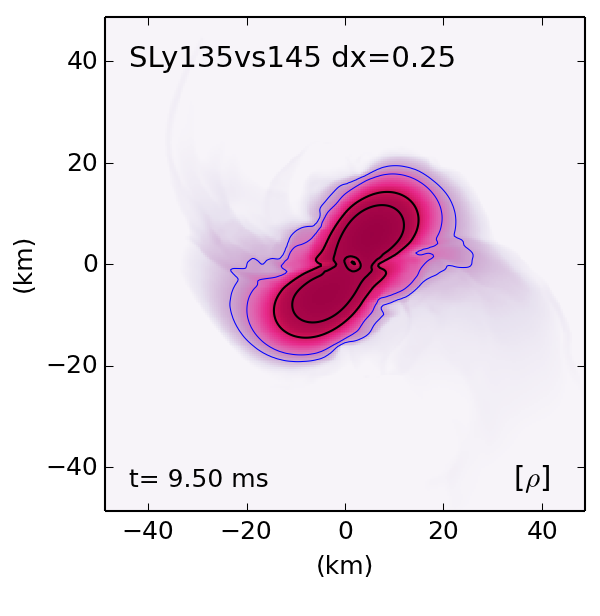
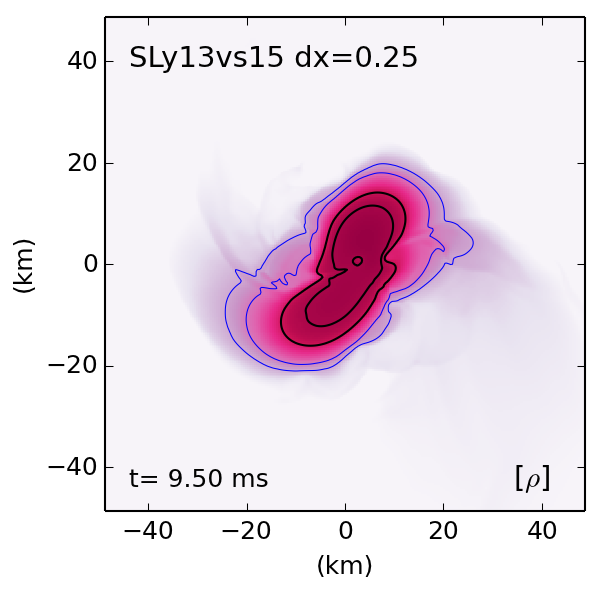
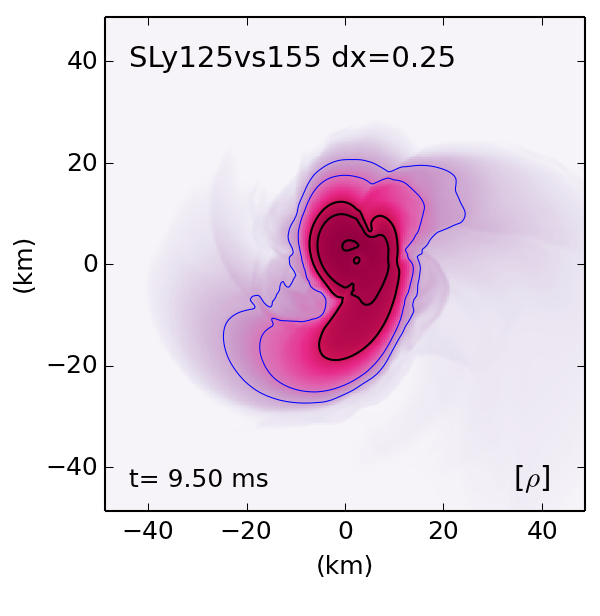
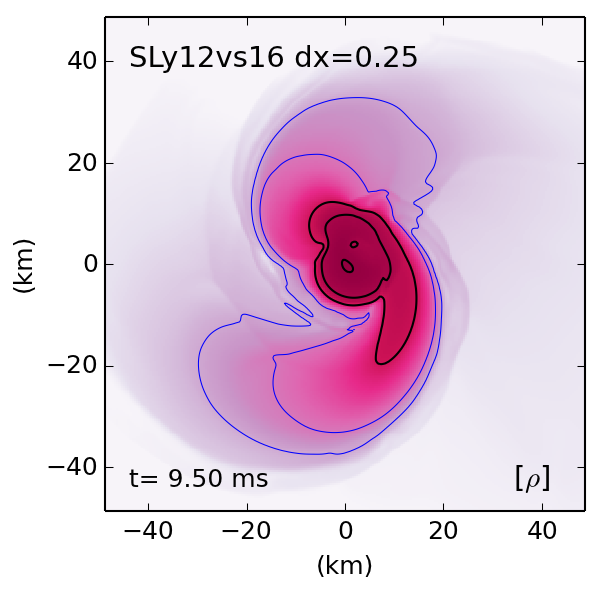
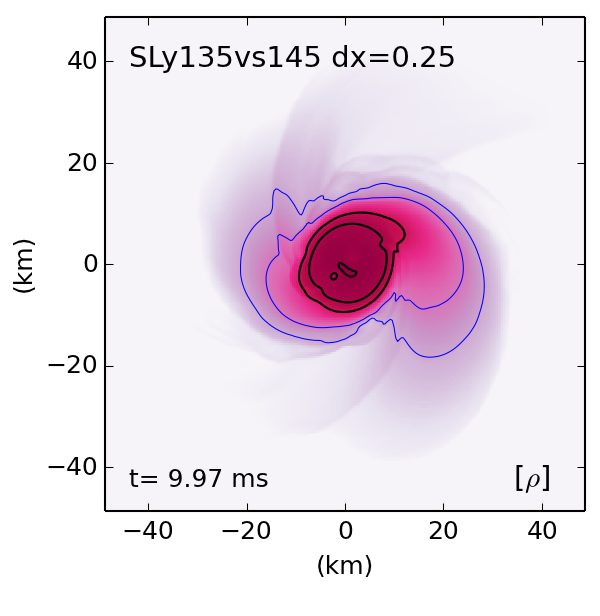
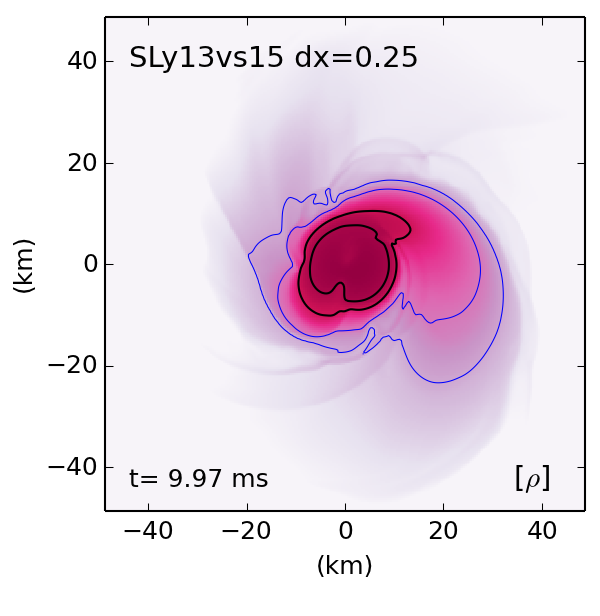
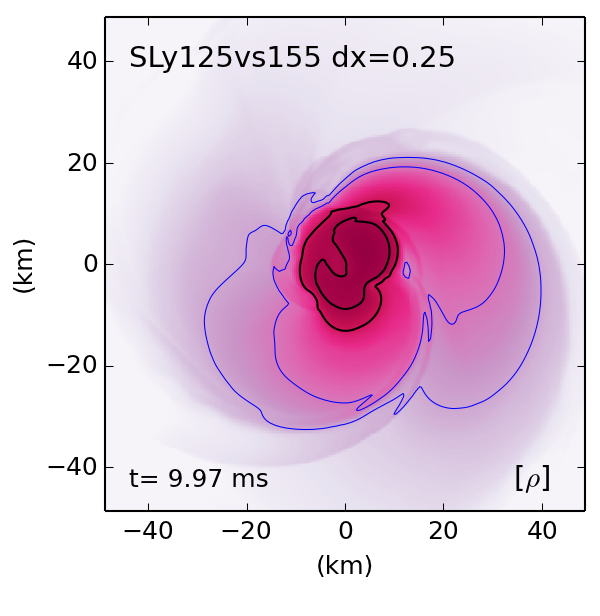
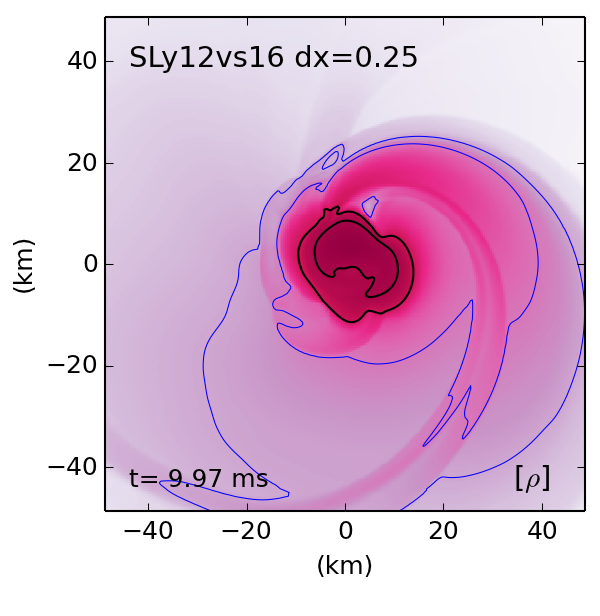
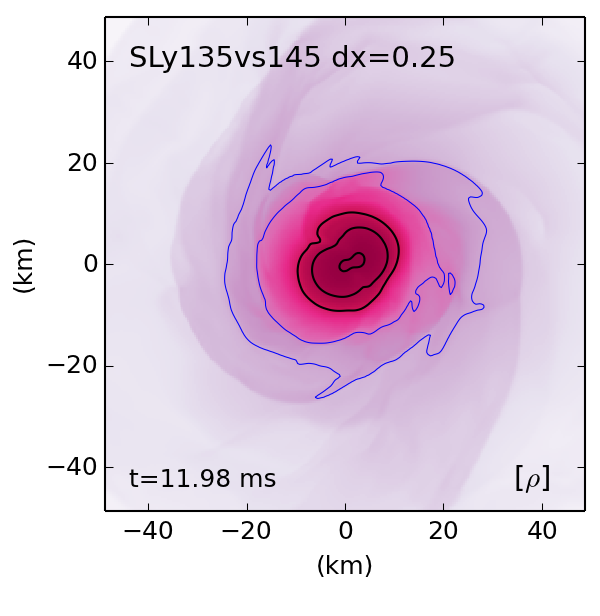
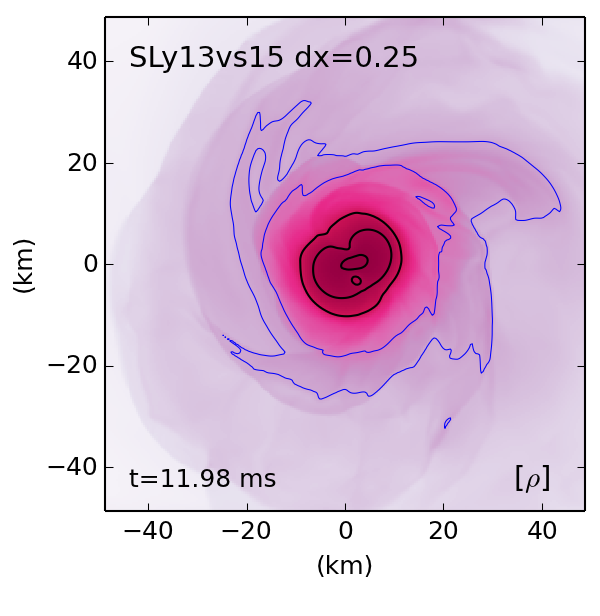
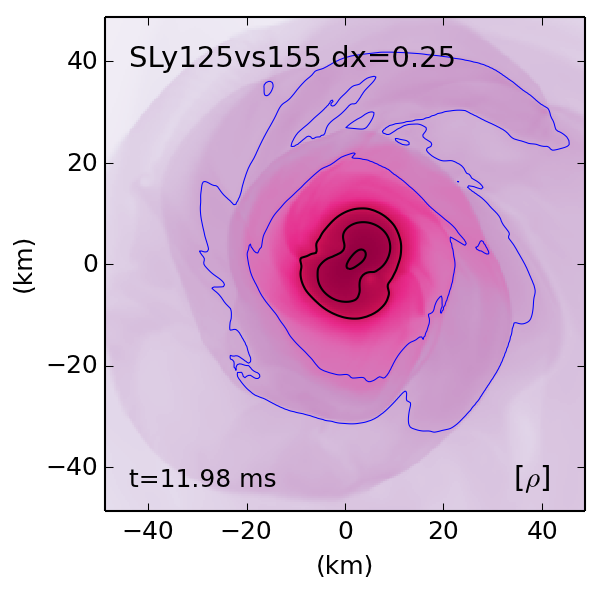
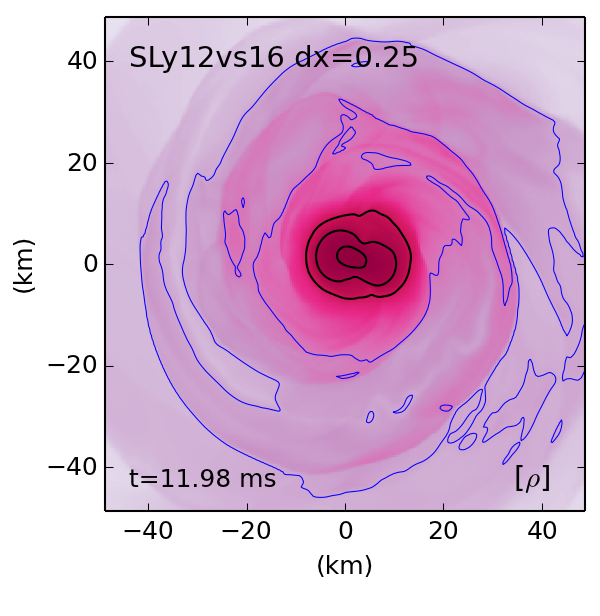
In all other cases, the relatively uneventful inspiral stage is followed by a very dynamical merger phase that can last up to ms and, finally, a relaxation stage where the remaining star shows a single bar-deformed excited state of what will be the final configuration of the system within the simulation time. There is clear evidence that in the merger phase the two-arms structure present in the case of equal mass systems is transformed into a single-arm structure as the mass ratio increases (see Figure 6).
All of the following results have been obtained using WENO reconstruction and the BSSN-NOK scheme for the gravitational sector. We evolved all of the eleven models using at least the three resolutions , , and CU to be sure of convergence (at least during the inspiral). The results from different resolutions were also used to determine the merger time as an extrapolation at , as detailed in section III.2, using the guess and performing a fit. The results obtained in this way are shown in Table 3, where only data at , and CU are used for the fit. This includes the computed merger time, the extrapolated merger time, and the statistical estimate of the error, as well as the merger time obtained from an effective one-body (EOB) 111The EOB waveform has been obtained through the publicly available LALSUIT LIGO/Virgo software (“git://versions.ligo.org/lalsuite.git”) using the utility: “./lalsim-inspiral -a EOBNRv2 [options]”. waveform, corresponding to a BBH system of the same gravitational mass that is, at , rotating with the frequency of the corresponding BNS system. One can observe that the extrapolated merger time is always consistently lower than the approximation from an EOB for all models, with greater difference for the case of the only simulated model using the much softer G275th14v14 EOS (isentropic EOS EOS).
This difference could be seen as an indication for the importance of tidal effects on the late stage of the merger, but it could also stem from possible differences in the initial data. We did not evolve a high enough number of orbits before the merger to draw any firm conclusion of which one is the case. In fact, the number of orbits we used (three to four) is quite low, and any contamination of the initial data would not have time to settle down completely, nor would a tidal effect be stabilized. We do plan to investigate this in future work using higher numbers of orbits.
| name | |||||
|---|---|---|---|---|---|
| [ms] | [ms] | [ms] | [ms] | [ms] | |
| SLy12vs12 | 9.22 | 11.76 | 13.61 | 15.070.03 | 21.55 |
| SLy13vs13 | 8.21 | 10.02 | 11.25 | 12.280.04 | 17.25 |
| SLy14vs14 | 6.72 | 8.27 | 9.50 | 10.390.08 | 14.08 |
| SLy15vs15 | 5.93 | 6.99 | 7.71 | 8.310.02 | 11.64 |
| SLy16vs16 | 5.00 | 6.13 | 6.81 | 7.440.08 | 9.78 |
| SLy135vs145 | 6.66 | 8.19 | 9.45 | 10.340.10 | 14.09 |
| SLy13vs15 | 6.52 | 7.91 | 9.31 | 10.140.25 | 14.12 |
| SLy125vs155 | 6.19 | 7.60 | 9.09 | 9.930.29 | 14.21 |
| SLy12vs16 | 5.52 | 7.26 | 8.73 | 9.750.13 | 14.33 |
| G275th14vs14 | 4.22 | 4.81 | 5.52 | 5.880.17 | 13.63 |
| G300th14vs14 | 7.63 | 9.69 | 10.55 | 11.670.37 | 14.78 |


Another interesting aspect besides the merger time is the emission of GW by the different models. In Figure 7 we show the overall waveform dynamics of all models at resolution CU. In particular, the bottom panels show the GW signal, while the energy flux radiated in GW, calculated according to Eq. (14), are shown in the middle. In the top panel we show the GW spectrum evaluated performing a Fourier transform of the data spanning the interval between ms before and ms after the merger time, after having multiplied the time domain signal with a Blackman window function. Our signal sampling has a Nyquist frequency of kHz, and over the specified ms interval, our spectrum has a resolution of Hz.
The first noticeable result is that the general picture of a non-collapsing simulation with a polytropic EOS and the one using the SLyPP EOS (with the same thermal part) are very similar. From the right panel can be seen that both the GW energy emission and the spectrum nicely agree. This means that only the high-density section of the EOS is relevant for the global behavior of the system (this is not true for models collapsing to a BH, as explained in section III.4).
The GW spectrum shows the presence of a dominating peak for every model except for the promptly collapsing SLy16vs16. This peak is well-known in the literature and corresponds to the frequency (also called or ) of the fundamental quadrupolar oscillation mode of the bar-deformed massive NS formed after the merger Stergioulas et al. (2011). The frequency of this mode is related to the compactness of the star Hotokezaka et al. (2015b); Bauswein et al. (2014); Bauswein and Janka (2012); Bauswein et al. (2015); Hotokezaka et al. (2013). It increases for the more compact systems, as shown in panel 2 for different total mass models, and in panel 3 for different EOSs, where the polytropic EOS is softer than the other two. It also has recently been correlated with the star’s tidal deformability Read et al. (2013) and the tidal coupling constant Bernuzzi et al. (2015). For the unequal mass case, we can only see a small dependence on the mass ratio, with a higher frequency for the equal and the closest-to-equal mass models.
Secondary post-merger peaks at frequencies and (also named as and in the literature) are also present and recognizable in the spectrum, which could be useful in extracting the NSs parameters (mass, radius) from future GW detections Takami et al. (2015a, b). The physical origin of these secondary frequencies is still debated. The first hypothesis formulated was to consider them as nonlinear combinations of the and oscillation modes of the hyper-massive NSs with the frequency, since and the difference is close to the quasi-radial oscillation frequency Stergioulas et al. (2011). More recently, in Takami et al. (2015a, b)Kastaun and Galeazzi (2015) they were attributed to the modulation of the main frequency by the nonlinear radial oscillations of the two rotating stellar cores in the first few milliseconds after the merger. Finally, in Bauswein and Stergioulas (2015), two different concurrent mechanisms were proposed for the origin of the low frequency peak: the nonlinear combination of and modes at (dominant in the more compact models), and the GW emission at from the spiral arms created by a strong deformation during the merger. These rotate in the inertial frame slower than the central cores, at a frequency , and this effect would be dominant for less compact models. Our present data, however, are not sufficient to clarify which hypothesis is correct.
| Model | ||||||
|---|---|---|---|---|---|---|
| (kHz) | (kHz) | (kHz) | (kHz) | (kHz) | (kHz) | |
| SLy12vs12 | 1.30 | 2.80 | 2.85 | - | - | - |
| SLy13vs13 | 1.30 | 2.91 | 3.00 | - | 1.88 | 4.13 |
| SLy14vs14 | 1.18 | 3.17 | 3.15 | - | 2.14 | 4.29 |
| G300th14v14 | 1.24 | 3.05 | 3.09 | - | 1.99 | 4.24 |
| G275th14v14 | 1.01 | 2.10 | 2.11 | 1.56 | - | - |
| SLy135vs145 | 1.17 | 3.16 | 3.14 | 2.84 | 2.05 | 4.24 |
| SLy13vs15 | 1.23 | 3.04 | 3.05 | 2.82 | 1.95 | 4.16 |
| SLy125vs155 | 1.25 | 3.01 | 2.98 | 2.72 | 1.79 | 4.07 |
| SLy12vs16 | 1.27 | 3.02 | 3.00 | 2.71 | - | - |
| SLy15vs15 | 0.81 | 3.50 | 3.49 | - | 2.59 | 4.30 |
In Table 4 we report the frequencies of all clearly recognizable spectral peaks for models shown in Figure 7. We also report the frequency of the quasi-radial mode, calculated using a fit starting at the time of the minimum value of the lapse , and using a quadratic trial function with a superimposed damped oscillation:
| (16) |
The frequency of the dominant mode of the star after the merger is obtained by fitting the GW signal with a single oscillation mode with exponentially decaying amplitude
| (17) |
starting ms after the merger, and waiting for the damping of sub-dominant modes, which happens on a timescale ms (except for model SLy15vs15, for which we started the fit at ms after the merger to have a large enough time window before the collapse).
The reported frequencies for the dominant and sub-dominant modes are obtained by interpolating the Fourier transform of the signal with a cubic spline, in order to obtain a frequency resolution of less than Hz (i.e., of the resolution of the Fourier transform on a ms interval), and then taking its maximum in an interval close to each visible peak.
Most models show the sub-dominant peaks at frequencies and , close to the central , with a maximum difference of the order of kHz. At the same time, those frequency differences are of the same order of , with an error around Hz.
We can see that in the unequal mass models the secondary peaks have a lower frequency and contain less power with increasing mass difference, as was previously already reported with only one model in Dietrich et al. (2015). We do not find a symmetric double-core structure with spiral arms right after the merger, but instead a tidal tail, generated from the capture of the less massive star outside and the heavier star’s core rotating around the center of symmetry, as can be seen in Figure 6. Additionally, in those unequal mass models another low frequency peak (indicated with in Table 4) is present, closer to the dominant frequency . This could be related to the peak of Bauswein and Stergioulas (2015), but further analysis is necessary to clarify its physical origin. For the equal mass case, increasing power in the secondary frequencies can be seen for the more massive systems (in accordance with Takami et al. (2015a)), while for the less compact models (SLy12vs12) the post-merger GW emission is characterized only by the single frequency. Finally, the softer EOS model G275th14vs14 shows an important secondary peak at kHz, while no corresponding peak at is present, and the difference is not close to . This is again consistent with the picture predicted in Bauswein and Stergioulas (2015) for less compact stars.
III.4 Models Resulting in Collapse to a Black Hole
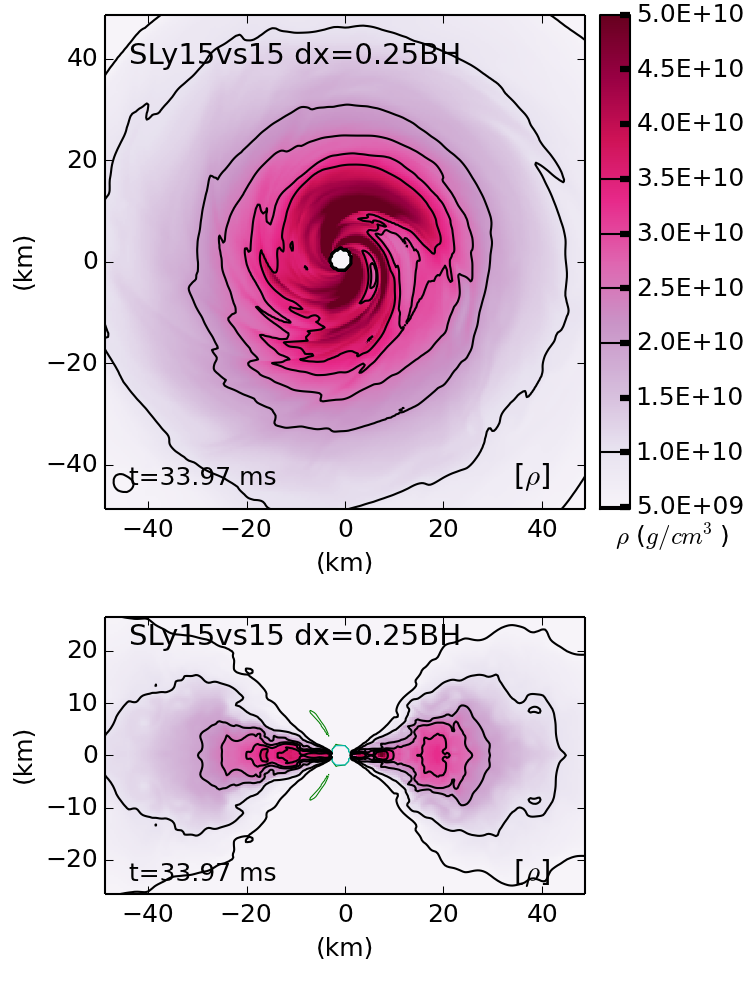
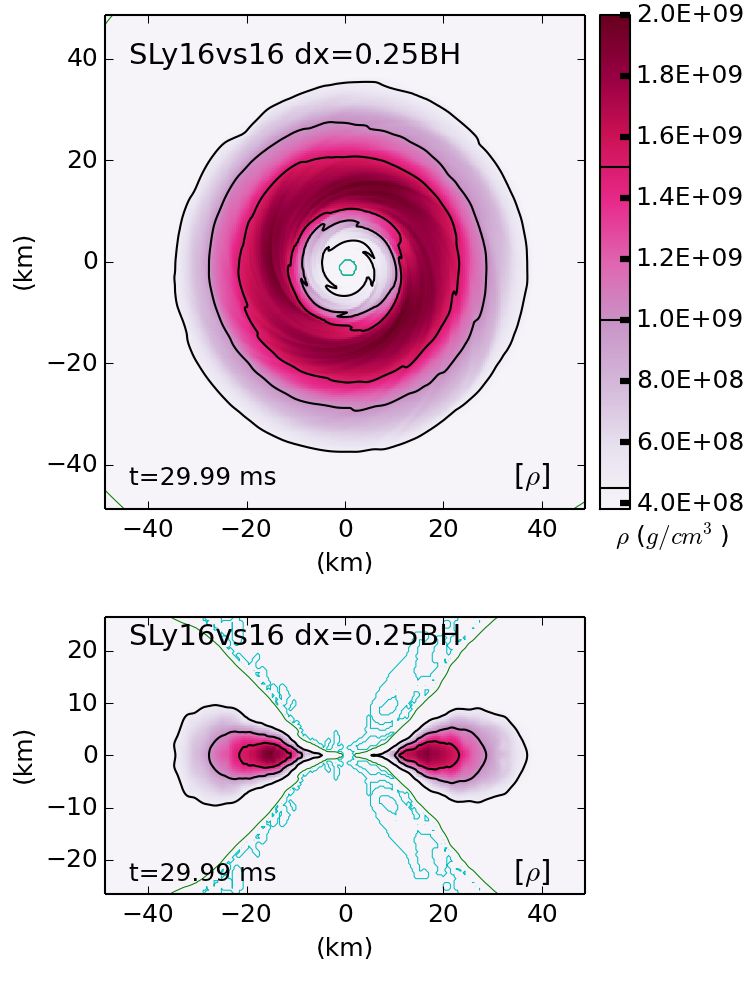
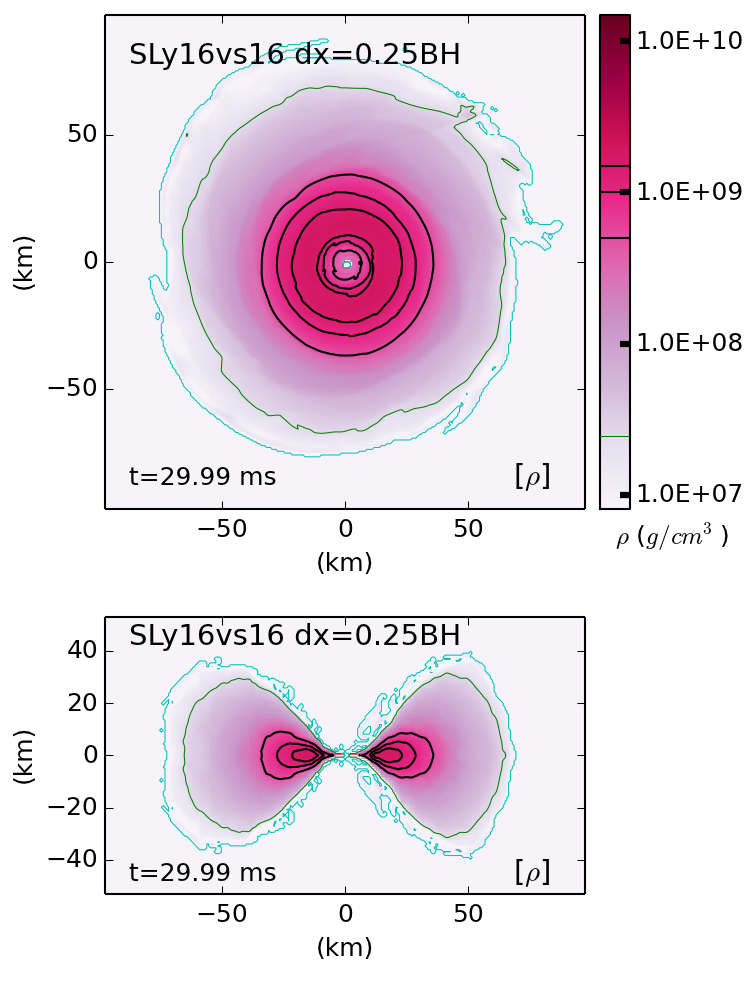
As previously noted, the evolution of model SLy16vs16 results in a direct collapse and the formation of a BH just after the merger. Model SLy15vs15, instead, is characterized by a delayed collapse to a BH a few milliseconds after merger, as shown in Figures 8 and 9. One of the main characteristics of our results for these two models is that after the merger and subsequent collapse to a BH, the remaining matter density drops quickly below neutron drip. Our simulations do not include a proper neutron-proton treatment and not even Neutrino emission. Nevertheless, the fact that the remnant matter is below the neutron drip threshold is an indication that a noticeable emission of neutrinos should occur within the ms that follows the merger (see Figure 10) and of the importance of the study of the r-process that may occour in neutron star mergers and on the necessity to use real Nuclear Physics EOS in the study of the post-merger phase.
In more detail, we observe prompt BH formation for model SLy16vs16 with the appearance of an apparent horizon at ms and ms for resolutions and CU, respectively, less than ms after merger. For model SLy15vs15, the BH formation is delayed, at simulation times of ms and ms for resolutions and CU, respectively, resulting in a delay of ms and ms after the merger. This model (with a total baryonic mass of and an initial ADM mass of , as reported in Table 2) is close to one often analyzed in the published literature (with total baryonic mass and initial ADM mass ) Dietrich et al. (2015); Takami et al. (2015a); Hotokezaka et al. (2013), so a direct comparison of the collapse times is possible. In Takami et al. (2015a, b), also using a BSSN-NOK spacetime evolution scheme, but employing PPM reconstruction, using only the four highest density polytropic pieces of the SLyPP EOS (see Table 1) used in the present work, and setting , no collapse to BH was found in the first ms after the merger. Using the same setup, with the only difference of , in Hotokezaka et al. (2013) a collapse to a BH was found about ms after the merger. In the same paper, the authors also note that for a different model an increase of significantly delays the collapse. In Dietrich et al. (2015), using the Z4c formulation of Einstein’s equations and WENO reconstruction, with the same EOS of Hotokezaka et al. (2013), a quite long NS lifetime of ms after the merger is reported. These differences indicate the need for a careful study of the influence of the numerical evolution schemes, but more so the dependency of the collapse on the EOS details, especially the adiabatic index at low densities and the choice of . Even small differences in these choices could potentially lead to different predictions for the estimated total energy emission in gravitational waves, and with that, their detectability.
Unlike for the inspiral phase (see Section III.2), we are not able to do a complete study of the convergence properties during the post-merger and collapse phase, e.g. for the neutron star life time, without using a higher resolution (incurring a higher computational cost). Model SLy16vs16 is promptly collapsing after the merger at all resolutions, even as low as CU. Model SLy15vs15, instead, shows no collapse for CU even ms after the merger, while the neutron star collapses at ms, ms, and ms after merger at resolutions , , and CU, respectively. Further analysis would be necessary to fully establish robust convergence for the collapse time in similar models. We will leave a detailed study of this point to future work.

In order to characterize the dynamics of these configurations we found it useful to analyze two quantities that can be easily extracted from simulation data: the mass and/or energy, and the angular momentum along the -axis, assuming an axial and temporal symmetry. The latter condition is indeed approximately reached at the end of the presented simulations. These quantities are defined in terms of the two vectors and (see 8), and are the same that were also used in De Pietri et al. (2014); Löffler et al. (2015) to characterize the properties of isolated rotating stars. Namely:
| (18) | |||||
| (19) |
where are the 3-dimensional slices of fixed coordinate time (). To obtain the energy and angular momentum budgets of the collapsed models we used the energy () and angular momentum () carried away by gravitational radiation (see Eqs. (14) and (15)), and the mass and angular momentum of the BH , computed using the isolated horizon formalism Ashtekar et al. (2000, 2002); Ashtekar and Krishnan (2004) (provided by the module QuasiLocalMeasures Dreyer et al. (2003)) on the the apparent horizon (located by the module AHFinderDirect Thornburg (2004)). The results are shown in Fig. 11.

For the quickly collapsing model SLy16vs16 we found, ms after the collapse, a mass of and an angular momentum of , while the total (gravitational) mass still present in the disk is only around . In contrast, we found for model SLy15vs15, also ms after the collapse, a BH mass of and an angular momentum of , while the remaining matter is either escaping the grid (very low density), or is still forming and driving an accretion disk. The total remaining mass on the grid amounts to about , and its density is below the neutron drip threshold.
IV Conclusions
We have presented a study of BNS mergers for equal and unequal mass systems with the semi-realistic seven-segment piece-wise polytropic SLyPP EOS with a thermal component of . All our results have been produced using open source and freely available software, the Einstein Toolkit for the dynamical evolution and the LORENE library for generating the initial models. Namely, we studied five equal-mass and four unequal-mass models with total ADM mass in the range between and , and a mass ratio as low as . The dynamics of all simulated models started with the stars at a separation of km. We followed this late-inspiral phase and the after-merger phase for more than ms after merger.
We analyzed the merger and post-merger phase of BNS evolution in detail, studying their gravitational wave emission, the radiated energy and angular momentum and the gravitational waves spectrum. We investigated the differences between equal-mass models and unequal mass ones. In the first case a bar-deformed hyper-massive NS is produced after the merger (for all models except SLy16vs16 which promptly collapses to a BH) with symmetrical spiral arms and a rotating double-core structure. After a relaxation period of some milliseconds the star reaches its final state where only the fundamental mode is excited. Unequal mass models, instead, show after the merger a single arm structure created by the tidal deformation of the less massive star. This qualitative difference leads also to differences in the GW spectrum, with the suppression of modes linked to the quasi-radial oscillations and the presence of a new sub-dominant mode, closer in frequency to the dominant excitation.
Of all simulated models two collapse to a BH, one right after the merger (SLy16vs16), and one after a short hyper-massive NS phase (SLy15vs15). For both models a leftover accretion disk is present, with matter density under the neutron drip limit. This means that a correct form of the low density-section of the EOS should be important for the description of the disk and matter surrounding the remnant BH.
We studied the convergence properties of the numerical evolution in the inspiral phase, focusing on the value of the merger time computed for simulations with different resolutions and different numerical methods. We tried three different methods for the reconstruction of hydrodynamical variables (WENO, PPM and MP5) and two different evolution schemes for the gravitational sector (BSSN-NOK and CCZ4). The merger time showed second order convergence, and our results for the different methods, for resolution CU and better, do agree. We have explicitly shown that we achieve second-order convergence in the inspiral phase when PPM or WENO reconstruction is combined with the BSSN-NOK methods. In the other two cases we find that a much higher resolution is needed to explicitly show that a similar order-two convergence is present. Our result seems to indicate that to achieve reliable results at lower resolutions the combined use of BSSN-NOK and WENO seems the best setup, out of the ones we tested. This analysis allowed us to extrapolate the merger time for all simulated models for infinite resolution .
In addition, we compared to two BNS models of the same total baryonic mass ( ) as model SLy14vs14 but with only one piece-wise component, and the same thermal part but different stiffness. The first model, G300th14vs14, has the same average stiffness () as the SLyPP EOS, while the other model, G275th14vs14, shows a softer average stiffness (), which is similar to Shen EOS (see Löffler et al. (2015)). Using these, we find that the merger time increased only by a fraction (from ms to ms) in the case of G300th14vs14, while it is significantly decreased (from ms to ms) in the case of the softer G275th14vs14 model, which we attribute to the expectation that tidal effects are greater when the deformability of the star is increased (like in the case of softer stiffness). In the after-merger stage we observed only a small variation in the position of the peak for the gravitational wave emission in the first case, while the later model shows substantial differences to the SLy14vs14 comparison model.
Acknowledgements.
This project greatly benefited from the availability of public software that enabled us to conduct all simulations, namely “LORENE” and the “Einstein Toolkit”. We express our gratitude the many people that contributed to their realization. This work would have not been possible without the support of the SUMA INFN project that provided the financial support of the work of AF and the computer resources of the CINECA “GALILEO” HPC Machine, where most of the simulations were performed. Other computational resources were provided by the Louisiana Optical Network Initiative (QB2, allocations loni_hyrel, loni_numrel and loni_cactus), and by the LSU HPC facilities (SuperMike II, allocations hpc_hyrel and hpc_numrel). FL is directly supported by, and this project heavily used infrastructure developed using support from the National Science Foundation in the USA (Grants No. 1212401, No. 1212426, No. 1212433, No. 1212460). Partial support from INFN “Iniziativa Specifica TEONGRAV” and by the “NewCompStar”, COST Action MP1304, are kindly acknowledged. We also graciously thank Dennis Castleberry for proofreading the manuscript.Appendix A Computational Cost
| Level | min(/) | max(/) | min() | max() | |
|---|---|---|---|---|---|
| (CU) | (CU) | (CU) | (CU) | ||
| (185,185,96) | |||||
| (205,205,106) | |||||
| (205,205,106) | |||||
| (205,205,106) | |||||
| (265,265,76) | |||||
| (265,265,76) | |||||
| ( | ) | (265,265,76) |
| (CU) | ||||||
|---|---|---|---|---|---|---|
| # threads | 16 | 64 | 128 | 256 | 512 | 2048 |
| # MPI | 2 | 8 | 16 | 32 | 64 | 256 |
| Memory (GBytes) | 3.8 | 19 | 40 | 108 | 237 | 768 |
| speed (CU/h) | 252 | 160 | 124 | 53 | 36 | 16 |
| speed (ms/h) | 1.24 | 0.78 | 0.61 | 0.26 | 0.18 | 0.08 |
| cost (SU/ms) | 13 | 81 | 209 | 974 | 2915 | 26053 |
| total cost (kSU, ms) | 0.65 | 4 | 10.5 | 49 | 146 | 1300 |
The implementation of any computational intensive research program like the one developed in the present work needs a careful analysis of the computational cost of the simulations (the number of CPU core hours needed to perform each simulation) and a careful management of resources. In that, speed, and with that total runtime, however, are not the only variables to consider. Required memory puts a lower bound on the size of the employed resources, while an upper bound is present at the breakdown of strong scaling.
To quantify these needs, the resolution and the size of the computational grid are most important. Table 5 shows the characteristics of the grid we used for the present work. In particular we use a fixed structure of mesh-refined, centered grids, with the exception of an additional refinement level for simulations resulting in an apparent horizon, and then only starting shortly before the merger (when the minimum of the lapse on the grid dropped below ). In the last column of Table 5 we show the actual grid-size in computation-points of each level, for resolution CU. Clearly the actual grid size (including ghost-zones and buffer-zones) changes varying with resolution, and is not explicitly shown here for that reason.
With the computational domain completely specified, the next step of an analysis of the computational cost is to asses the cost for a full simulation of a particular model at the desired resolution. Table 6 shows the actual simulation cost as function of resolution, for a particular High-Performance-Computer (HPC) system used in the present research program, namely the “GALILEO” system installed at the Italian CINECA supercomputer center. As it was discussed in the conclusion, our result show that the combined use of BSSN-NOK and WENO allows the possibility to find qualitatively accurate results in agreement with high-resolutions simulations. This is a very desirable feature since it allows researchers to quickly scan numerous different models in order to select the most interesting for further study using higher resolution.
All of our results have been produced using open source and freely available software, the Einstein Toolkit for the dynamical evolution and the LORENE library for generating the initial models. That means that the whole set of our result can be reproduced and re-analyzed by re-running the simulation from a common code-base. Some modifications of the above mentioned software were necessary, but these changes are also open source, and are available for download from the University of Parma WEB web server of the gravitational group 222 See the University of Parma Gravity group WEB page: www.fis.unipr.it/gravity/Research/BNS2015.html. . We kindly ask to cite this work if you find any of the material there useful for your own research.
References
- Aasi et al. (2015) J. Aasi et al. (LIGO Scientific), Class. Quant. Grav. 32, 074001 (2015), arXiv:1411.4547 [gr-qc] .
- Acernese et al. (2015) F. Acernese et al. (VIRGO), Class. Quant. Grav. 32, 024001 (2015), arXiv:1408.3978 [gr-qc] .
- Abbott et al. (2016) B. P. Abbott et al. (Virgo, LIGO Scientific), Phys. Rev. Lett. 116, 061102 (2016), arXiv:1602.03837 [gr-qc] .
- LIGO Scientific Collaboration et al. (2013) LIGO Scientific Collaboration, Virgo Collaboration, J. Aasi, J. Abadie, B. P. Abbott, R. Abbott, T. D. Abbott, M. Abernathy, T. Accadia, F. Acernese, and et al., ArXiv e-prints (2013), arXiv:1304.0670 [gr-qc] .
- Abadie et al. (2010) J. Abadie et al. (VIRGO, LIGO Scientific), Class. Quant. Grav. 27, 173001 (2010), arXiv:1003.2480 [astro-ph.HE] .
- Buonanno and Damour (1999) A. Buonanno and T. Damour, Phys. Rev. D59, 084006 (1999), arXiv:gr-qc/9811091 [gr-qc] .
- Damour and Nagar (2010) T. Damour and A. Nagar, Physical Review D 81, 084016 (2010).
- Bini et al. (2012) D. Bini, T. Damour, and G. Faye, Physical Review D 85, 124034 (2012).
- Takami et al. (2015a) K. Takami, L. Rezzolla, and L. Baiotti, Phys. Rev. D91, 064001 (2015a), arXiv:1412.3240 [gr-qc] .
- Takami et al. (2015b) K. Takami, L. Rezzolla, and L. Baiotti, Proceedings, Spanish Relativity Meeting: Almost 100 years after Einstein Revolution (ERE 2014), J. Phys. Conf. Ser. 600, 012056 (2015b).
- Douchin and Haensel (2001) F. Douchin and P. Haensel, Astron. Astrophys. 380, 151 (2001), arXiv:astro-ph/0111092 .
- Read et al. (2009) J. S. Read, B. D. Lackey, B. J. Owen, and J. L. Friedman, Physical Review D 79, 124032 (2009).
- Harten et al. (1987) A. Harten, B. Engquist, S. Osher, and S. R. Chakravarthy, J. Comp. Phys. 71, 231 (1987).
- Shu (1999) C. W. Shu, in High order methods for computational physics, edited by T. J. Barth and H. A. Deconinck (Springer, New York, 1999) pp. 439–582.
- Nakamura et al. (1987) T. Nakamura, K. Oohara, and Y. Kojima, Prog. Theor. Phys. Suppl. 90, 1 (1987).
- Shibata and Nakamura (1995) M. Shibata and T. Nakamura, Phys. Rev. D 52, 5428 (1995).
- Baumgarte and Shapiro (1999) T. W. Baumgarte and S. L. Shapiro, Phys. Rev. D 59, 024007 (1999), arXiv:gr-qc/9810065 .
- Alcubierre et al. (2000) M. Alcubierre, B. Brügmann, T. Dramlitsch, J. A. Font, P. Papadopoulos, E. Seidel, N. Stergioulas, and R. Takahashi, Phys. Rev. D 62, 044034 (2000), arXiv:gr-qc/0003071 .
- Alcubierre et al. (2003) M. Alcubierre, B. Brügmann, P. Diener, M. Koppitz, D. Pollney, E. Seidel, and R. Takahashi, Phys. Rev. D 67, 084023 (2003), arXiv:gr-qc/0206072 .
- Alic et al. (2012) D. Alic, C. Bona-Casas, C. Bona, L. Rezzolla, and C. Palenzuela, Phys. Rev. D85, 064040 (2012), arXiv:1106.2254 [gr-qc] .
- Löffler et al. (2012) F. Löffler, J. Faber, E. Bentivegna, T. Bode, P. Diener, R. Haas, I. Hinder, B. C. Mundim, C. D. Ott, E. Schnetter, G. Allen, M. Campanelli, and P. Laguna, Class. Quantum Grav. 29, 115001 (2012), arXiv:1111.3344 [gr-qc] .
- De Pietri et al. (2014) R. De Pietri, A. Feo, L. Franci, and F. Löffler, Phys. Rev. D90, 024034 (2014), arXiv:1403.8066 [gr-qc] .
- Löffler et al. (2015) F. Löffler, R. De Pietri, A. Feo, F. Maione, and L. Franci, Phys. Rev. D91, 064057 (2015), arXiv:1411.1963 [gr-qc] .
- Bauswein et al. (2010) A. Bauswein, H.-T. Janka, and R. Oechslin, Physical Review D 82, 084043 (2010).
- Gourgoulhon et al. (2001) E. Gourgoulhon, P. Grandclement, K. Taniguchi, J.-A. Marck, and S. Bonazzola, Phys. Rev. D 63, 064029 (2001), arXiv:gr-qc/0007028 .
- (26) LORENE, “LORENE: Langage Objet pour la RElativité NumériquE,” %****␣arxiv_paper.tex␣Line␣1825␣****http://www.lorene.obspm.fr/.
- (27) EinsteinToolkit, “Einstein Toolkit: Open software for relativistic astrophysics,” http://einsteintoolkit.org/.
- (28) Cactus developers, “Cactus Computational Toolkit,” http://www.cactuscode.org/.
- Goodale et al. (2003) T. Goodale, G. Allen, G. Lanfermann, J. Massó, T. Radke, E. Seidel, and J. Shalf, in Vector and Parallel Processing – VECPAR’2002, 5th International Conference, Lecture Notes in Computer Science (Springer, Berlin, 2003).
- Allen et al. (2011) G. Allen, T. Goodale, G. Lanfermann, T. Radke, D. Rideout, and J. Thornburg, Cactus Users’ Guide (2011).
- Schnetter et al. (2004) E. Schnetter, S. H. Hawley, and I. Hawke, Class. Quantum Grav. 21, 1465 (2004), arXiv:gr-qc/0310042 .
- Schnetter et al. (2006) E. Schnetter, P. Diener, E. N. Dorband, and M. Tiglio, Class. Quantum Grav. 23, S553 (2006), arXiv:gr-qc/0602104 .
- (33) Carpet, Carpet: Adaptive Mesh Refinement for the Cactus Framework, http://www.carpetcode.org/.
- Baiotti et al. (2005) L. Baiotti, I. Hawke, P. J. Montero, F. Löffler, L. Rezzolla, N. Stergioulas, J. A. Font, and E. Seidel, Phys. Rev. D 71, 024035 (2005), arXiv:gr-qc/0403029 .
- Hawke et al. (2005) I. Hawke, F. Löffler, and A. Nerozzi, Phys. Rev. D 71, 104006 (2005), arXiv:gr-qc/0501054 .
- Mösta et al. (2014) P. Mösta, B. C. Mundim, J. A. Faber, R. Haas, S. C. Noble, T. Bode, F. Löffler, C. D. Ott, C. Reisswig, and E. Schnetter, Classical and Quantum Gravity 31, 015005 (2014), arXiv:1304.5544 [gr-qc] .
- (37) McLachlan, “McLachlan, a public BSSN code,” http://www.cct.lsu.edu/~eschnett/McLachlan/.
- Husa et al. (2006) S. Husa, I. Hinder, and C. Lechner, Comput. Phys. Commun. 174, 983 (2006), arXiv:gr-qc/0404023 .
- Lechner et al. (2004) C. Lechner, D. Alic, and S. Husa, Analele Universitatii de Vest din Timisoara, Seria Matematica-Informatica 42 (2004), arXiv:cs/0411063 .
- (40) Kranc, “Kranc: Kranc assembles numerical code,” http://kranccode.org/.
- Runge (1895) C. Runge, Mathematische Annalen 46, 167 (1895).
- Kutta (1901) W. Kutta, Z. Math. Phys. 46, 435 (1901).
- Harten et al. (1983) A. Harten, P. D. Lax, and B. van Leer, SIAM review 25, 35 (1983).
- Einfeldt (1988) B. Einfeldt, SIAM J. Numer. Anal. 25, 294 (1988).
- Colella and Woodward (1984) P. Colella and P. R. Woodward, J. Comp. Phys. 54, 174 (1984).
- Radice and Rezzolla (1997) D. Radice and L. Rezzolla, Journal of Computational Physics 136, 83–99 (1997).
- Newman and Penrose (1962) E. Newman and R. Penrose, Journal of Mathematical Physics 3, 566 (1962).
- Regge and Wheeler (1957) T. Regge and J. A. Wheeler, Phys. Rev. 108, 1063 (1957).
- Zerilli (1970) F. J. Zerilli, Phys. Rev. Lett. 24, 737 (1970).
- Moncrief (1974) V. Moncrief, Annals Phys. 88, 323 (1974).
- Baker et al. (2002) J. G. Baker, M. Campanelli, and C. O. Lousto, Phys. Rev. D 65, 044001 (2002), arXiv:gr-qc/0104063 .
- Damour et al. (2008) T. Damour, A. Nagar, M. Hannam, S. Husa, and B. Brügmann, Physical Review D 78, 044039 (2008).
- Reisswig and Pollney (2011) C. Reisswig and D. Pollney, Classical and Quantum Gravity 28, 195015 (2011).
- Baiotti et al. (2009) L. Baiotti, S. Bernuzzi, G. Corvino, R. De Pietri, and A. Nagar, Physical Review D 79, 024002 (2009).
- Berti et al. (2007) E. Berti, V. Cardoso, J. A. Gonzalez, U. Sperhake, M. Hannam, S. Husa, and B. Brügmann, Physical Review D 76, 064034 (2007).
- Nakano et al. (2015) H. Nakano, J. Healy, C. O. Lousto, and Y. Zlochower, Physical Review D 91, 104022 (2015).
- Brügmann et al. (2008) B. Brügmann, J. A. González, M. Hannam, S. Husa, U. Sperhake, and W. Tichy, Physical Review D 77, 024027 (2008).
- Alic et al. (2013) D. Alic, W. Kastaun, and L. Rezzolla, Phys. Rev. D88, 064049 (2013), arXiv:1307.7391 [gr-qc] .
- Ruiz et al. (2011) M. Ruiz, D. Hilditch, and S. Bernuzzi, Phys. Rev. D83, 024025 (2011), arXiv:1010.0523 [gr-qc] .
- Hotokezaka et al. (2015a) K. Hotokezaka, K. Kyutoku, H. Okawa, and M. Shibata, Physical Review D 91, 064060 (2015a).
- Kurganov and Tadmor (2000) A. Kurganov and E. Tadmor, Journal of Computational Physics 160, 241 (2000).
- Palenzuela et al. (2015) C. Palenzuela, S. L. Liebling, D. Neilsen, L. Lehner, O. Caballero, E. O’Connor, and M. Anderson, Physical Review D 92, 044045 (2015).
- Radice et al. (2015) D. Radice, L. Rezzolla, and F. Galeazzi, (2015), arXiv:1502.00551 [gr-qc] .
- Note (1) The EOB waveform has been obtained through the publicly available LALSUIT LIGO/Virgo software (“git://versions.ligo.org/lalsuite.git”) using the utility: “./lalsim-inspiral -a EOBNRv2 [options]”.
- Stergioulas et al. (2011) N. Stergioulas, A. Bauswein, K. Zagkouris, and H.-T. Janka, Monthly Notices of the Royal Astronomical Society 418, 427 (2011).
- Hotokezaka et al. (2015b) K. Hotokezaka, K. Kyutoku, H. Okawa, and M. Shibata, Phys. Rev. D91, 064060 (2015b), arXiv:1502.03457 [gr-qc] .
- Bauswein et al. (2014) A. Bauswein, N. Stergioulas, and H.-T. Janka, Physical Review D 90, 023002 (2014).
- Bauswein and Janka (2012) A. Bauswein and H.-T. Janka, Physical review letters 108, 011101 (2012).
- Bauswein et al. (2015) A. Bauswein, N. Stergioulas, and H.-T. Janka, (2015), arXiv:1508.05493 .
- Hotokezaka et al. (2013) K. Hotokezaka, K. Kiuchi, K. Kyutoku, T. Muranushi, Y.-i. Sekiguchi, M. Shibata, and K. Taniguchi, Physical Review D 88, 044026 (2013).
- Read et al. (2013) J. S. Read, L. Baiotti, J. D. Creighton, J. L. Friedman, B. Giacomazzo, K. Kyutoku, C. Markakis, L. Rezzolla, M. Shibata, and K. Taniguchi, Physical Review D 88, 044042 (2013).
- Bernuzzi et al. (2015) S. Bernuzzi, T. Dietrich, and A. Nagar, Phys. Rev. Lett. 115, 091101 (2015), arXiv:1504.01764 [gr-qc] .
- Kastaun and Galeazzi (2015) W. Kastaun and F. Galeazzi, Physical Review D 91, 064027 (2015).
- Bauswein and Stergioulas (2015) A. Bauswein and N. Stergioulas, Phys. Rev. D91, 124056 (2015), arXiv:1502.03176 [astro-ph.SR] .
- Dietrich et al. (2015) T. Dietrich, S. Bernuzzi, M. Ujevic, and B. Brügmann, Phys. Rev. D91, 124041 (2015), arXiv:1504.01266 [gr-qc] .
- Ashtekar et al. (2000) A. Ashtekar, C. Beetle, O. Dreyer, S. Fairhurst, B. Krishnan, J. Lewandowski, and J. Wisniewski, Phys. Rev. Lett. 85, 3564 (2000), arXiv:gr-qc/0006006 [gr-qc] .
- Ashtekar et al. (2002) A. Ashtekar, C. Beetle, and J. Lewandowski, Class. Quant. Grav. 19, 1195 (2002), arXiv:gr-qc/0111067 [gr-qc] .
- Ashtekar and Krishnan (2004) A. Ashtekar and B. Krishnan, Living Rev. Rel. 7, 10 (2004), arXiv:gr-qc/0407042 [gr-qc] .
- Dreyer et al. (2003) O. Dreyer, B. Krishnan, D. Shoemaker, and E. Schnetter, Phys. Rev. D 67, 024018 (2003), arXiv:gr-qc/0206008 .
- Thornburg (2004) J. Thornburg, Class. Quantum Grav. 21, 743 (2004), arXiv:gr-qc/0306056 .
- Note (2) See the University of Parma Gravity group WEB page: www.fis.unipr.it/gravity/Research/BNS2015.html.