Multi-Wave Coherent Control of a Solid State Single Emitter
Coherent control of individual two-level systems (TLSs) is at the basis of any implementation of quantum information. An impressive level of control is now achieved using nuclear PlaNature13 ; MuhonenNatNano14 , vacancies WidmannNatMat15 ; YalePNAS13 and charge spins CarterNatPhoton13 ; HansomNatPhys14 . Manipulation of bright exciton transitions in semiconductor quantum dots (QDs) is less advanced, principally due to the sub-nanosecond dephasing BorriPRL01 . Conversely, owing to their robust coupling to light, one can apply tools of nonlinear spectroscopy LangbeinOL06 to achieve all-optical command. Here, we report on the coherent manipulation of an exciton via multi-wave mixing. Specifically, we employ three resonant pulses driving a single InAs QD. The first two induce a four-wave mixing (FWM) transient, which is projected onto a six-wave mixing (SWM) depending on the delay and area of the third pulse, in agreement with analytical predictions. Such a switch enables to demonstrate the generation of SWM on a single emitter and to engineer the spectro-temporal shape of the coherent response originating from a TLS. These results pave the way toward multi-pulse manipulations of solid state qubits via implementing the NMR-like control schemes VandersypenRMP05 in the optical domain.
An appealing strategy to realize optically controlled quantum networks in solid state, is to coherently couple distant TLSs - like bright exciton transitions in QDs - via photons confined in microcavities ReithmaierN04 ; AlbertNatComm13 or propagating in waveguides LuxmoorePRL13 ; ColesOptEx14 ; ReichertPhysRevB14 ; ArcariPRL14 . The efficient retrieval and manipulation of coherent responses from single excitons is mandatory for assessing the properties of such solid state qubits and demonstrating the coherence transfer between them. In this context, substantial progress has been made by the introduction of the heterodyne spectral interferometry technique LangbeinOL06 to measure four-wave mixing (FWM) from individual excitons in various nanostructures PattonPRL05 ; KasprzakNMa10 ; KasprzakNPho11 ; AlbertNatComm13 ; KasprzakNJP13 . Yet, measuring on single strongly-confined excitons in InAs QDs remains challenging and has not been previously achieved. This is due to their small dipole moment and the resulting required high resonant amplitudes of the three fields; , employed to drive the measured FWM polarization, being proportional to and higher order terms with the same phase dependence on the fields.
Here, the retrieval and manipulation of wave-mixing signals from single InAs QDs is accomplished by embedding them in a low-Q planar semiconductor microcavity MeierOptEx14 , as detailed in Supplementary Fig. S2. Such a semiconductor hetero-structure provides an intra-cavity field enhancement of at the QDs position, whilst offering spectral matching of the photonic mode with femto-second laser pulses. This cavity-enhanced driving allows reducing the resonant excitation intensity, required to induce the FWM, by a factor around . In consequence, the retrieval efficiency of wave-mixing signals from single excitons is improved by two orders of magnitude with respect to previous experiments on bare QDs LangbeinOL06 ; KasprzakNJP13 . In this work, we employ such wave-mixing responses to realize a novel scheme for ultrafast coherent control of optically active TLSs. We demonstrate gating of their coherent emission, by converting the FWM polarization into the SWM one. We show engineering of the FWM spectral response, also acting on the global spectral lineshape of a TLS. Details regarding the current experimental configuration are given in Supplementary Fig. S1.
For the purpose of the experiment described in this Letter, we require an optically active TLS in a solid. In InAs QDs, this is the case of negatively charged excitons (trions) BennyPRB12 , where the level structure can be trimmed down to two levels (disregarding spin degeneracy): the ground and excited states corresponding to the presence of an electron and a trion in the QD, respectively, as depicted in Fig. 1 a. We have therefore used a sample which is intentionally n-doped MeierOptEx14 with a Silicon -layer located in the cavity spacer. To illustrate the coherent response of trions, we present in Fig. 1 a the spectral interferogram detected at the FWM frequency , as detailed in the Supplementary Material. Based on series of interferograms, we construct the FWM hyperspectral imaging KasprzakNPho11 , as exemplified in Fig. 1 b. Therein, the brightest, localized peaks correspond primarily to the FWM generated by trions. Such imaging is employed to determine spatial and spectral position of QDs. Also it enables a detailed statistical analysis on excitonic complexes, as exemplified for biexcitons in Supplementary Fig. S3.

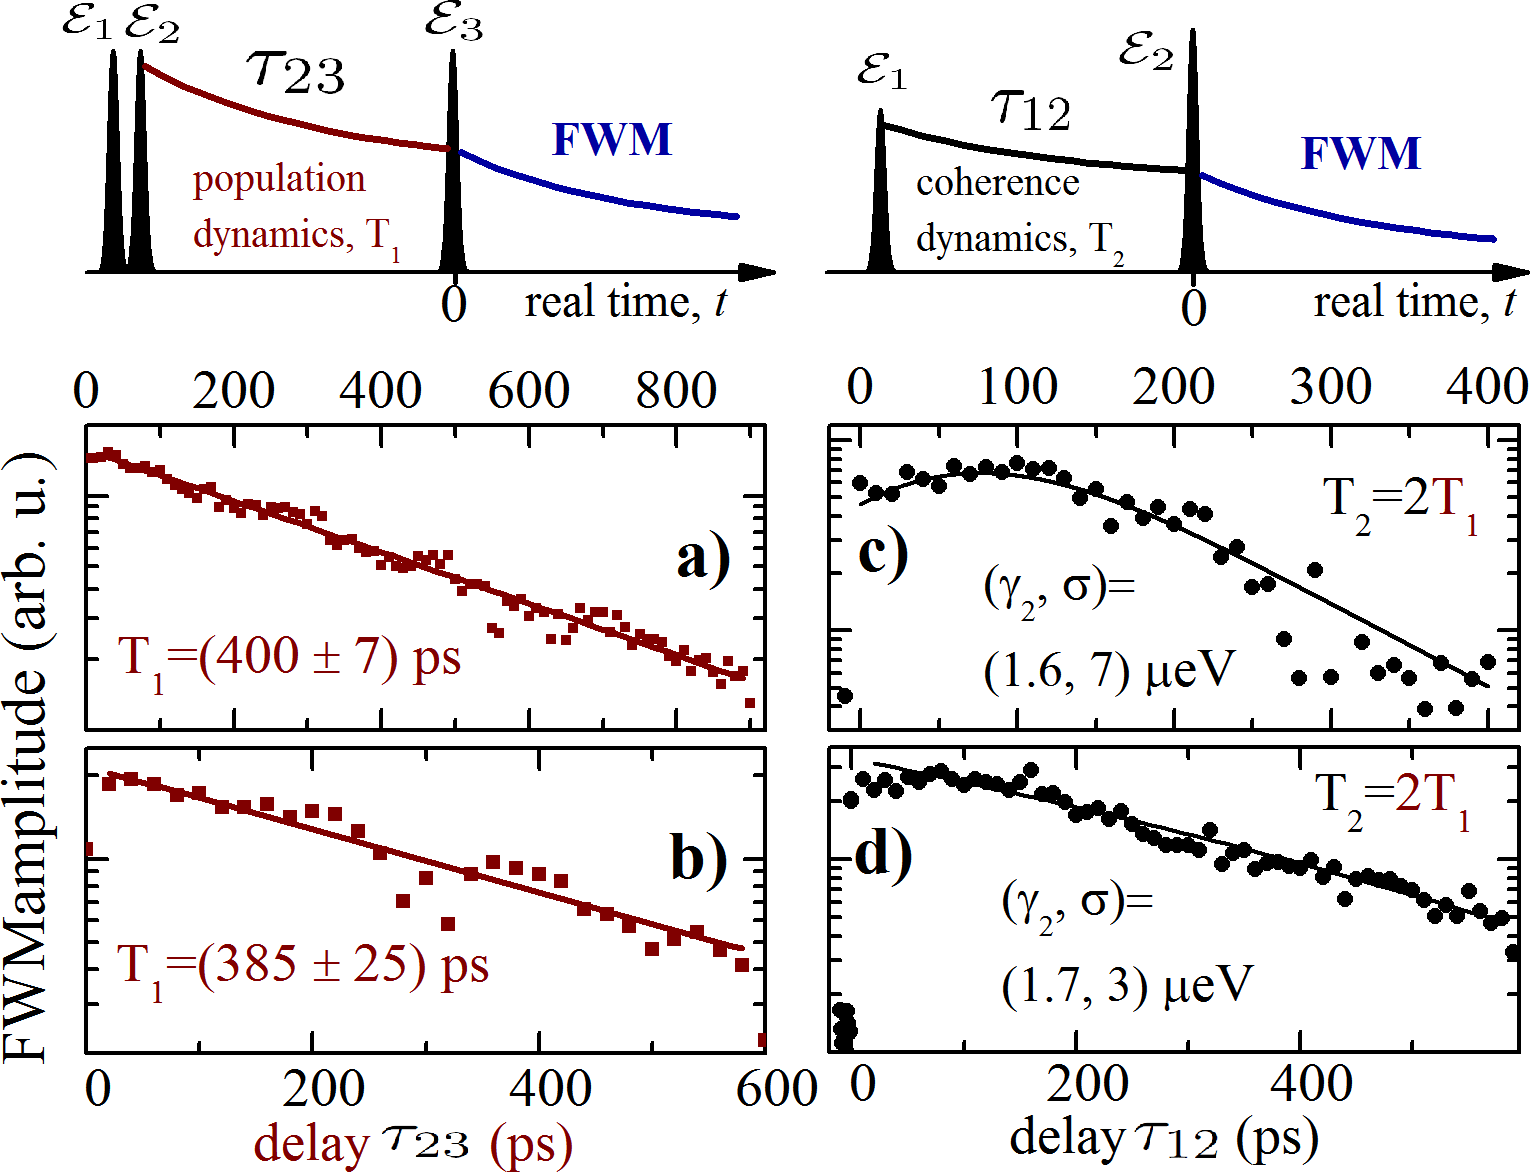
We first retrieve the required parameters to infer and model the optical response of single emitters in a solid. The three-beam FWM spectroscopy offers direct access to coherence and population dynamics in the TLS. To probe the population dynamics, we detect the time-integrated FWM at the frequency, while varying the delay between and and fixing ps. The resulting evolution of the FWM amplitude is shown in Fig. 1 c and fitted by an exponential decay, yielding LangbeinPRB04a ; ProuxPRL15 the lifetime of Tps. Conversely, detecting the FWM at the frequency , reflects the coherence in the TLS. Its evolution is governed by the delay between and , as displayed in Fig. 1 c. The lack of FWM at negative delays and the absence of fine-structure beating KasprzakNJP13 confirm the trionic nature of the investigated transition. Our data are well described by the product of an exponential and a Gaussian decay KasprzakNJP13 . From the former, we infer the dephasing time T2 and the related homogenous broadening (FWHM). The latter yields the inhomogeneous broadening due to the residual spectral wandering, occurring during the integration time. Note that even on the single transition level such wandering creates a photon echo, manifested here by a Gaussian decay of the coherence PattonPRB06 ; KasprzakNJP13 . The coherence dynamics can be fitted using T2=2T1=780 ps and eV. We thus find that the coherence of trions in these QDs approaches the radiative limit. This is supported by observation of their first order reflectance, as shown in Supplementary Fig. S5. More examples of such transitions close to the radiative limit are given in Supplementary Fig. S4.

The coherent control experiment described below requires a calibration of the pulse areas , which are proportional to the square root of the pulse intensities . To illustrate this calibration, we present in Fig. 1 d the FWM power as a function of and . As expected BonadeoScience98 ; StievaterPRL01 ; PattonPRL05 , the FWM undergoes Rabi oscillations with increasing . In addition, we observe a -dependent damping, which is attributed to dissipative coupling with acoustic phonons RamseyPRL10 . In the three-beam heterodyne spectral interferometry technique, the additional degree of freedom provided by the time delay allows to transform the FWM into SWM at the defined time after creating the FWM. Such SWM signals and their interferences with coexisting FWM have been studied in atomic physics ZhangOL07 ; ZhangPRL09 . Higher order wave-mixing has been also investigated in the condensed matter physics to explore many particle correlations in quantum wells TurnerN10 ; AxtPRB01 ; VossPRB02 and QD ensembles MoodyPRB13 , recently inferring their non-Markovian dynamics TaharaPRL14 . In the present study, we demonstrate for the first time generation of SWM on single emitters. Here, SWM detection serves as a tool to implement coherent control upon the FWM transient of a TLS. We use pulse to project the FWM into the SWM signal oscillating at the frequency. The spectral interferogram measured at this frequency is shown in Fig. 1 a, for the applied pulse sequence given in Fig. 2 a. The FWM/SWM swapping is controlled by adjusting the pulse area and , as derived in the analytical model presented in the Supplementary Material: FWM field and SWM field read:
| (1) | ||||
| (2) |
where is the Heaviside function, and is defined by the arrival of .
Conversion of FWM into SWM and their coexistence is experimentally demonstrated in Fig. 2. Therein, we present the FWM and SWM field amplitude transients for increasing at . In such maps, the arrival of at , generating the conversion, defines the diagonal. From Eqs. (Multi-Wave Coherent Control of a Solid State Single Emitter) and (2), we expect that the FWM is present in the upper-side of the diagonal , and has been converted to SWM in the lower-side , as indeed measured. This temporal gating of both signals is the key to manipulate the spectral distribution of the FWM from a TLS.

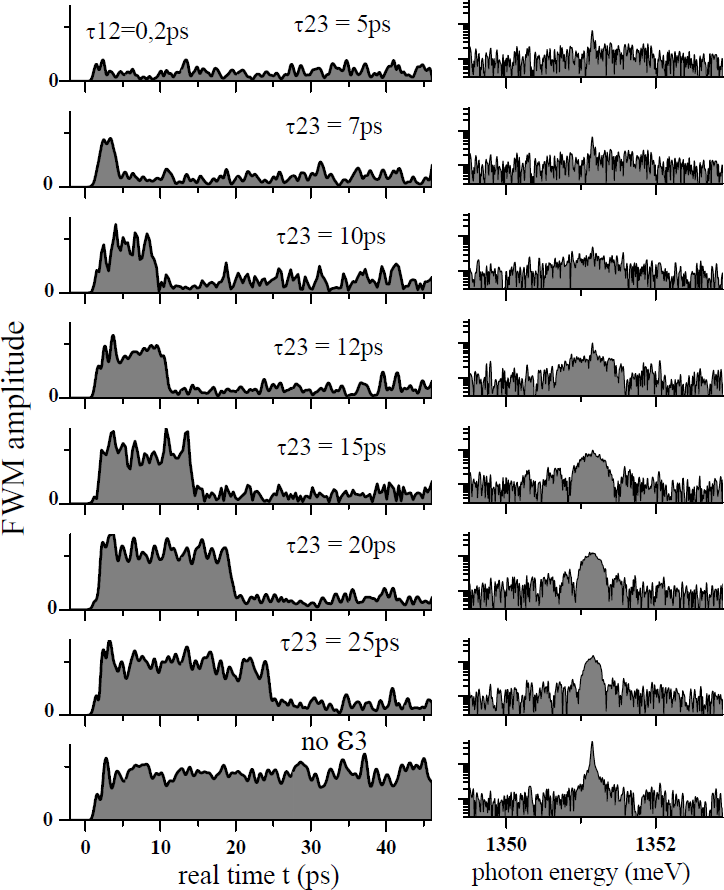
We note that the conversion efficiency reaches unity for the yielding, at the arrival of , a complete suppression of the FWM. In Fig. 3, we employ specific pulse areas in order to drive, between and , the maximum polarization to the FWM, consistent with Eq. (Multi-Wave Coherent Control of a Solid State Single Emitter). In Fig. 3 a we present FWM transients measured at for various . Their spectral amplitudes (also see Supplementary Fig. S6) are given in Fig. 3 b. The spectra show a substantial broadening and ringing due to the step-like suppression in time, leading to a sine cardinal like shape. FWM at (topmost) is given for comparison. The effect, also clearly visible in Fig. 3 c, is observable from ps to ps where the FWHM of the main peak increases from 38 eV (given by the spectral resolution) up to 700eV. This represents an imposed broadening by two orders of magnitude with respect to . With further decrease of such spectral broadening can reach 10 meV range, as is only bounded by the duration of . Due to the limited amount of the emitted FWM for , its observation requires a large signal-to-noise ratio. Fourier transforming Eq. (Multi-Wave Coherent Control of a Solid State Single Emitter) with respect to the real time t, yields the spectrally resolved FWM amplitude:
| (3) |
where With the particular pulse areas , the spectrum takes the simple form , which reproduces the observed features quantitatively, as shown by red traces in Fig. 3 b. The spectral broadening of the central peak scales as , characteristic of the sine cardinal lineshape.

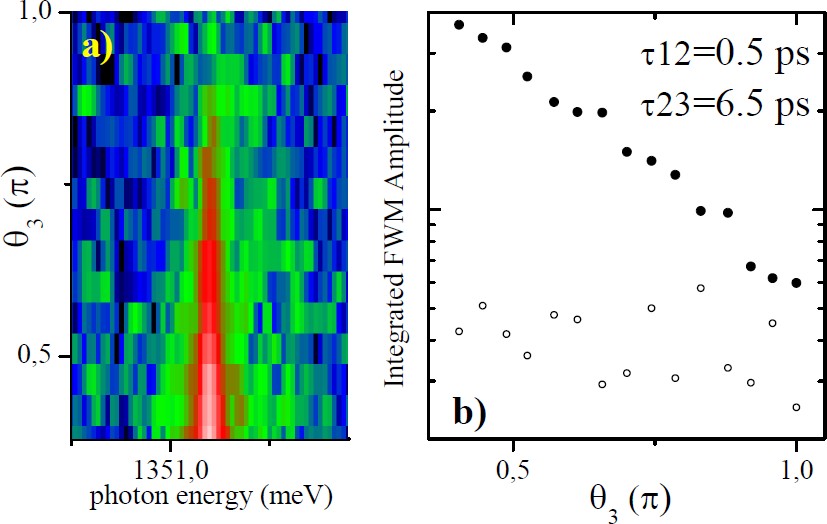
For intermediate values of , the FWM is only partially converted to SWM. Therefore both non-linearities coexist, as can be noted in Fig. 2 d. This is investigated in Fig. 4, where the FWM transients (a) and spectra (b) for increasing and fixed ps are presented. Owing to the increasing FWM suppression for ps, the amplitude of the spectrally narrow component is reduced (see Supplementary Fig. S7). In parallel, the broad pedestal develops. Hence, non-natural lineshapes can be designed by tuning and . Eq. (14), derived in the Supplementary Material, reproduces the experimental data shown in Fig. 4 b and c, without any free parameters, apart from the absolute common scaling.
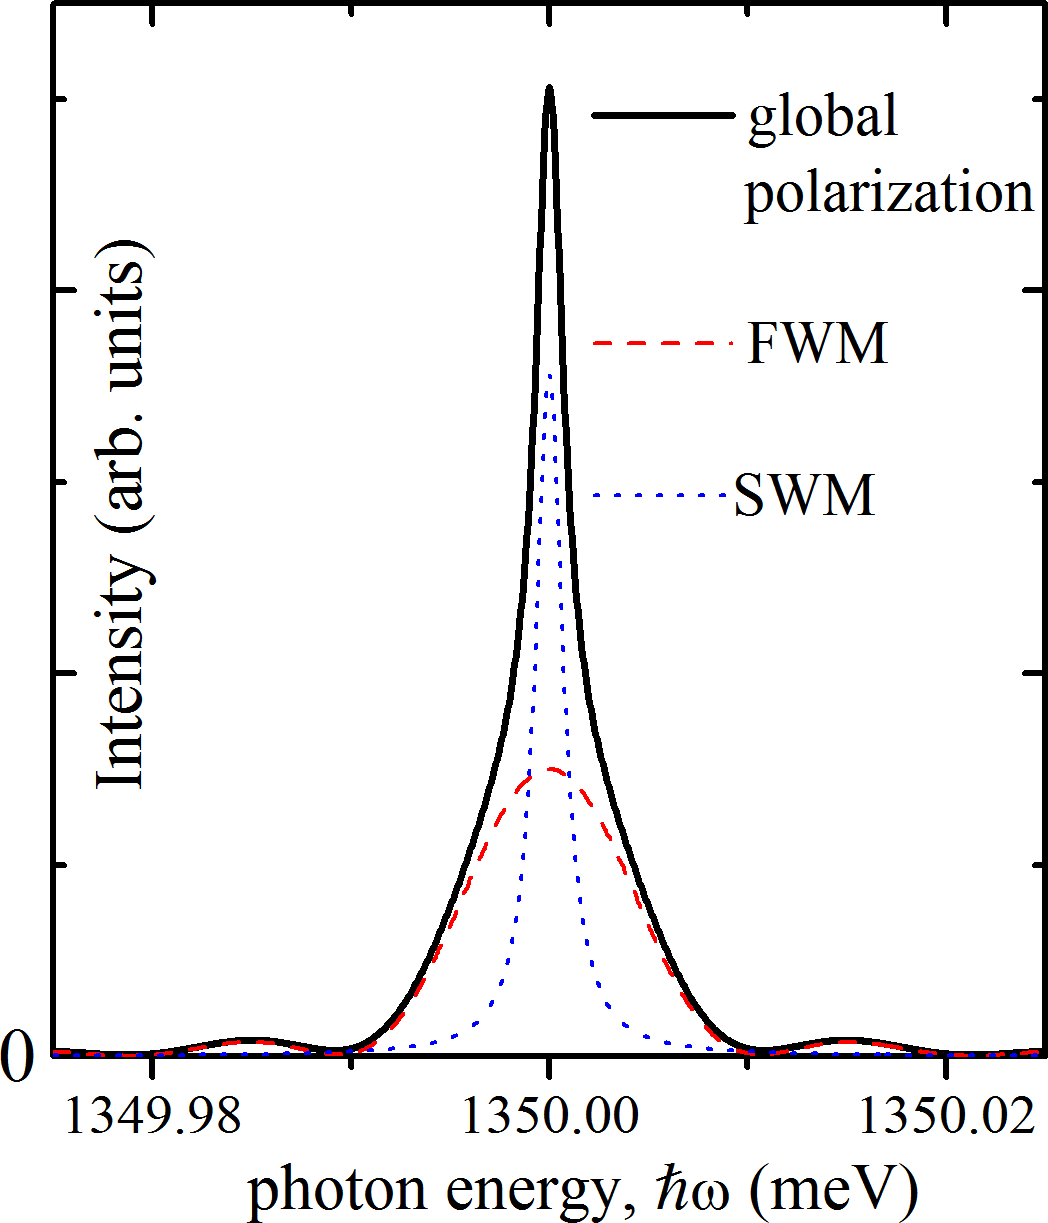
The ability to manipulate the spectral width of a coherent response from the TLS provides a novel degree of freedom in solid state quantum optics. We emphasize that the phase shift induced by the FWM/SWM conversion modifies the coherent oscillation of the dipole: the global lineshape of the TLS polarization is altered, as highlighted in Supplementary Fig. S8. The latter is strikingly manifested when the is heterodyned at , leading to a stationary phase shift between the two non-linearities generated by and , respectively. Therefore by adjusting this phase shift with (see Eqs. (11) and (12) in the Supplementary Material), we can perform controlled phase rotations of the TLS dipole. After arrival of , the phase of the TLS emission could be inverted or entirely frozen. Such on-demand blockade of emission represents a fundamental step in optical control of single TLS systems. As an example of application, let us note that tuning the spectral shape of a TLS could be employed to optimize injection and storing of single photons in optical resonators. Furthermore, maximizing the spectral overlap within a pair of distant TLSs promotes their coherent coupling via propagating photons MinkovPRB13 , which is a prerequisite to realize optically controlled quantum networks in a solid. Multi-wave mixing could be also used to selectively address the coherence dynamics and transitions in higher manifolds of the Jaynes-Cummings ladder of nanophotonic devices operating in a strong-coupling regime KasprzakNMa10 ; AlbertNatComm13 .
By employing a low-Q semiconductor microcavity, we improved the retrieval sensitivity of coherent responses from individual emitters, enabling wave mixing spectroscopy of individual excitons in strongly-confined InAs QDs. Using three beam configuration, we inferred a new scheme for controlling coherent evolution of a TLS via converting FWM to SWM. We have demonstrated that, via temporal gating of the FWM, we can control its lineshape by varying the amplitude and the arrival time of the gate pulse. The demonstration of SWM on individual emitters paves the way towards investigations of their non-Markovian dynamics TaharaPRL14 and to study higher order correlations TurnerN10 involving more than two excitons within a QD. Extending our proof-of-principle protocol toward control via multi-wave mixing is conceptually straightforward: conversion between wave mixing processes is determined by areas and respective delays of driving pulses. It is also technically feasible via multiplexed digital heterodyning. An alluring perspective is to perform multi-wave mixing on radiatively coupled pairs of distant excitons MinkovPRB13 , achieving non-local quantum control in a solid.
We acknowledge support by the European Research Council Starting Grant “PICSEN” contract no. 306387.
References
- (1) Pla, J. J. et al. High-fidelity readout and control of a nuclear spin qubit in silicon. Nature 496, 334–338 (2013).
- (2) Muhonen, J. T. et al. Storing quantum information for 30 seconds in a nanoelectronic device. Nat. Nanotechnol. 9, 986–991 (2014).
- (3) Widmann, M. et al. Coherent control of single spins in silicon carbide at room temperature. Nature Mater. 14, 164–168 (2015).
- (4) Yale, C. G. et al. All-optical control of a solid-state spin using coherent dark states. Proc. Natl. Acad. Sci. U.S.A 110, 7595–7600 (2013).
- (5) Carter, S. G. et al. Quantum control of a spin qubit coupled to a photonic crystal cavity. Nature Photon. 7, 329–334 (2013).
- (6) Hansom, J. et al. Environment-assisted quantum control of a solid-state spin via coherent dark states. Nature Phys. 10, 725–730 (2014).
- (7) Borri, P. et al. Ultralong dephasing time in InGaAs quantum dots. Phys. Rev. Lett. 87, 157401 (2001).
- (8) Langbein, W. & Patton, B. Heterodyne spectral interferometry for multidimensional nonlinear spectroscopy of individual quantum systems. Opt. Lett. 31, 1151 (2006).
- (9) Vandersypen, L. M. K. & Chuang, I. L. NMR techniques for quantum control and computation. Rev. Mod. Phys. 76, 1037 (2005).
- (10) Reithmaier, J. P. et al. Strong coupling in a single quantum dot-semiconductor microcavity system. Nature 432, 197–200 (2004).
- (11) Albert, F. et al. Microcavity controlled coupling of excitonic qubits. Nature Comm. 4, 1747 (2013).
- (12) Luxmoore, I. J. et al. Interfacing spins in an InGaAs quantum dot to a semiconductor waveguide circuit using emitted photons. Phys. Rev. Lett. 110, 037402 (2013).
- (13) Coles, R. J. et al. Waveguide-coupled photonic crystal cavity for quantum dot spin readout. Opt. Express 22, 2376–2385 (2014).
- (14) Reichert, T. et al. Highly directed emission from self-assembled quantum dots into guided modes in disordered photonic-crystal waveguides. Phys. Rev. B 90, 115310 (2014).
- (15) Arcari, M. et al. Near-unity coupling efficiency of a quantum emitter to a photonic crystal waveguide. Phys. Rev. Lett. 113, 093603 (2014).
- (16) Patton, B., Woggon, U. & Langbein, W. Coherent control and polarization readout of individual excitonic states. Phys. Rev. Lett. 95, 266401 (2005).
- (17) Kasprzak, J. et al. Up on the Jaynes-Cummings ladder of a quantum-dot/microcavity system. Nat. Mater. 9, 304–308 (2010).
- (18) Kasprzak, J., Patton, B., Savona, V. & Langbein, W. Coherent coupling between distant excitons revealed by two-dimensional nonlinear hyperspectral imaging. Nat. Phot. 5, 123 (2011).
- (19) Kasprzak, J. et al. Vectorial nonlinear coherent response of a strongly confined exciton-biexciton system. New J. Phys. 15, 055006 (2013).
- (20) Maier, S. et al. Bright single photon source based on self-aligned quantum dot-cavity systems. Optics Ex. 22, 8136 (2014).
- (21) Benny, Y. et al. Excitation spectroscopy of single quantum dots at tunable positive, neutral, and negative charge states. Phys. Rev. B 86, 085306 (2012).
- (22) Langbein, W. et al. Radiatively limited dephasing in InAs quantum dots. Phys. Rev. B 70, 033301 (2004).
- (23) Proux, R. et al. Measuring the photon coalescence time window in the continuous-wave regime for resonantly driven semiconductor quantum dots. Phys. Rev. Lett. 114, 067401 (2015).
- (24) Patton, B., Langbein, W., Woggon, U., Maingault, L. & Mariette, H. Time- and spectrally-resolved four-wave mixing in single CdTe/ZnTe quantum dots. Phys. Rev. B 73, 235354 (2006).
- (25) Bonadeo, N. H. et al. Coherent optical control of the quantum state of a single quantum dot. Science 282, 1473 (1998).
- (26) Stievater, T. H. et al. Rabi oscillations of excitons in single quantum dots. Phys. Rev. Lett. 87, 133603 (2001).
- (27) Ramsay, A. et al. Phonon-induced Rabi-frequency renormalization of optically driven single InGaAs/GaAs quantum dots. Phys. Rev. Lett. 105, 177402 (2010).
- (28) Zhang, Y., Brown, A. W. & Xiao, M. Observation of interference between four-wave mixing and six-wave mixing. Optics Lett. 32, 1120 (2007).
- (29) Zhang, Y., Khadka, U., Anderson, B. & Xiao, M. Temporal and spatial interference between four-wave mixing and six-wave mixing channels. Phys. Rev. Lett. 102, 013601 (2009).
- (30) Turner, D. & Nelson, K. Coherent measurements of high-order electronic correlations in quantum wells. Nature 466, 1089–1092 (2010).
- (31) Axt, V. M., Bolton, S. R., Neukirch, U., Sham, L. J. & Chemla, D. S. Evidence of six-particle coulomb correlations in six-wave-mixing signals from a semiconductor quantum well. Phys. Rev. B 63, 115303 (2001).
- (32) Voss, T. et al. Biexcitonic effects in the coherent control of the excitonic polarization detected in six-wave-mixing signals. Phys. Rev. B 66, 155301 (2002).
- (33) Moody, G. et al. Fifth-order nonlinear optical response of excitonic states in an InAs quantum dot ensemble measured with two-dimensional spectroscopy. Phys. Rev. B 87, 045313 (2013).
- (34) Tahara, H., Ogawa, Y., Minami, F., Akahane, K. & Sasaki, M. Long-time correlation in non-markovian dephasing of an exciton-phonon system in InAs quantum dots. Phys. Rev. Lett. 112, 147404 (2014).
- (35) Minkov, M. & Savona, V. Radiative coupling of quantum dots in photonic crystal structures. Phys. Rev. B 87, 125306 (2013).
SUPPLEMENTARY MATERIAL
Multi-Wave Coherent Control of
a Solid State Single Emitter
F. Fras, Q. Mermillod, G. Nogues, C.
Hoarau, C. Schneider,
M. Kamp, S. Höfling, W. Langbein, and J. Kasprzak
I Theory: Derivation of the FWM and SWM responses
In this part we derive the four-wave mixing (FWM) and six-wave mixing (SWM) responses, as experimentally studied in the main part of the manuscript. We consider a two level system (TLS) formed by an electron in the ground state and a trion in the excited state . In the model developed below the coupling between the optical fields and the TLS is treated exactly. The optical response of the TLS is expressed at all orders of the exciting field amplitudes (not limited to the third and five orders, which are usually considered in the low field intensity regime). The relevant semiclassical Hamiltonian of the considered system in interaction with the three exciting fields is given by
| (4) |
where refers to the electron-trion optical transition frequency, is the electric dipole of the QD, determines the effective electric field amplitude of the pulse at the QD position, represents the arrival time of the pulse at the QD position and refers to the additional phase shift induced by optical heterodyning. The excitation pulses are assumed to be delta-function pulses, i. e., . In addition to the evolution governed by the Hamiltonian , the system undergoes dissipative dynamics due to the coupling with its environment. Therefore the state of the system is described in the density matrix formalism in the basis .
In order to relate the different multi-wave responses we derive the state of the system . We assume that the pulse duration is much shorter than the relevant time scales of the system dynamics. Therefore the interaction between the system and its dissipative environment is neglected during the coupling with the optical excitation fields. Under this assumption, the modification of the state induced by the pulses is obtained analytically 36, 37 according to the unitary transformation :
| (5) | |||
| (6) |
where denotes the time instant just before (after) the pulse , and is the area of the pulse . During the delay time between the pulses the open two-level system relaxes its density and polarization.
In the following the dissipation is described in the Markov limit, the subsequent dynamics can be then given by a master equation in the Lindblad form
| (7) |
where is the superoperator of dissipation. It takes into account the dissipation of energy (mainly induced by spontaneous emission in our experimental case) and pure dephasing processes, which are characterized respectively by the rates and . Given the minute values of fluctuations induced by the spectral wandering (as measured in Fig. 1. c), the inhomogeneous dephasing is disregarded here. Therefore reads as :
| (8) |
with .
By solving this equation we derive the complete optical polarization dynamics, which is proportional to the off-diagonal terms of the density matrix. We deduce therefore the field radiated by the quantum dot structure :
| (9) |
where represents a coefficient of proportionality including phase shift and absorption due to the propagation inside the structure.
The coherent optical response of the QD can be developed in a sum of contributions , referring to particular nonlinear processes. The emitted fields are identified by their phase factors , where the phase results from a linear combination of the exciting pulse phases : and .
The principle of the heterodyne spectral interferometry experiment is based on the capacity to select a specific via corresponding phase . To do so, the phase relation between the exciting pulses is tailored by acousto-optics modulators operating at radio-frequencies . Therefore successive exciting pulses belonging to optical train , characterized by a repetition rate , are phase shifted by a factor . By repeating the experiment in time and combining optical heterodyning with the spectral interferometry we retrieve the amplitude and phase of the desired non-linear component out from the total electric field radiated by the QD dipole 8. In the present study, the nonlinear signals of interest are the following :
-
•
the non-degenerate FWM beating at the heterodyne frequency
-
•
the degenerate FWM beating at the heterodyne frequency
-
•
the degenerate SWM beating at the heterodyne frequency
Considering the TLS in the ground state at the time , the dynamics of the optical fields are given by :
| (10) | ||||
| (11) | ||||
| (12) |
where is the Heaviside function, and with and and . Once Fourier transformed with respect to the time t, the spectrally resolved wave mixing field amplitudes read as :
| (13) | ||||
| (14) | ||||
| (15) |
where and the phases are omitted. In the equations (10) and (13), one can note that the amplitude of the non degenerate FWM signal is sensitive to both the relaxation of the polarization and density of the TLS. In particular, the expression (13) in the spectral domain highlights that probing the signal as a function of the delay times and allows to experimentally determine the characteristic rates and , respectively (see Fig. 1 in the main manuscript and Supplementary Fig. S4).
The relations (11) and (12) are describing the core of the experiments presented in the main article. They explicitly illustrate the dynamics of the TLS coherences induced by the third pulse, where the FWM response is projected to the SWM response. This interplay between the two nonlinear processes is controlled by the area of the third pulse and the time delay between the last two pulses. Conversely, such degree of freedom permits designing the spectro-temporal shape of the FWM component, as shown in the equations (11, 14).
We point out that the switching between FWM and SWM triggered by , physically modifies the coherent oscillation of the dipole and directly acts on the total lineshape of its emission. This is exemplified in Supplementary Figure Fig. S8 (see page 9). Therein, we present simulated spectral lineshape of the complete QD optical polarization after the arrival of the second pulse for . We observe that the spectral lineshape of the dipole is significantly altered (for example for ps) compared to the unperturbed case (). The spectral broadening is generated by the spectral interferences between the FWM (for ) and SWM (for ) components, which averaged over many repetitions of the heterodyne experiment produce such spectrum.
II Experimental details
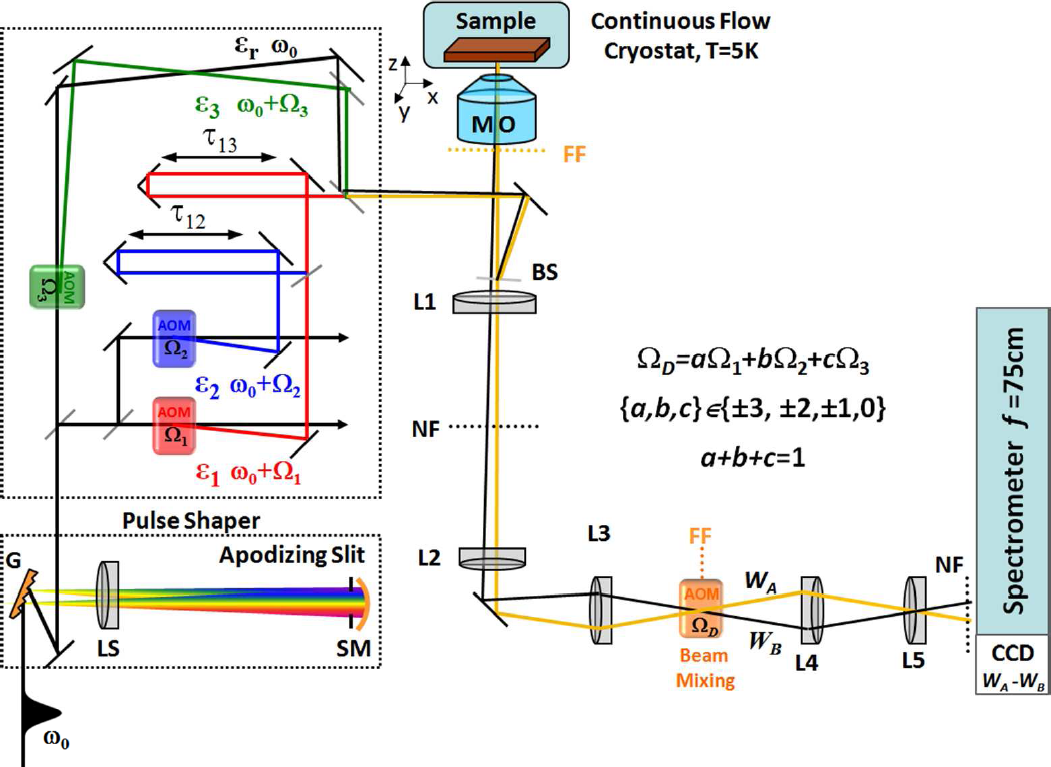
Our experiments are based on an extended version of the heterodyne spectral interferometry technique 8. We use a pulse train spectrally centered at , generated by a Ti:Saphire laser (Spectra-Physics, Tsunami Femto). The pulses are spectrally shaped and chirp-corrected by a passive pulse-shaper (G - grating, LS - lens, SM - spherical mirror). They are then spectrally up-shifted by three acousto-optic modulators (AOMs) operating at MHz. Thus created three driving fields - marked as red, blue and green, respectively - acquire relative time delay (positive for leading) and (positive for leading) by passing through two mechanical delay lines. Their polarization can be controlled by a set of half- and quarter-plates, but in this work we employ co-linear, horizontal (in the lab-frame) polarization for all beams. The driving fields are recombined into the same spatial mode (yellow) and focussed on the sample surface via the microscope objective (MO - Olympus, LCPLN50XIR/0.65, BS beam sampler, FF far field) installed on a X-Y-Z close-loop piezo-stage, (XY-range of 250 m, Z- range of 450 m). The excitation pulses have duration of fs. The pulse chirp, mainly induced by a slab of TeO2 crystal in the AOMs and in the MO, is compensated by measuring the non-resonant four-wave mixing produced at pulse overlap in an auxiliary GaAs sample and minimizing its duration with respect to . The microcavity sample is installed inside a custom, continuous flow helium cryostat, containing motorized, closed-loop XY translation stages (range of 10 mm, accuracy of 50 nm). Experiments reported here were performed at K. The far field is imaged into the AOM, where - using a Bragg condition - the reflected signal is mixed with the reference field . The mixing AOM is driven at the frequency , where and a+b+c=1. These heterodyne frequencies are produced by the home-made three-channel, analogue mixer, with a spectral purity of 40 dB. They are subsequently regenerated by a lock-in amplifier attaining spectral purity of 100 dB. Mixed beams and are imaged into the entrance slit of the imaging spectrometer of 750 mm focal length. Spectral interferograms are retrieved by subtracting and -phase flipping and , as described in Ref. [8]. We use a CCD camera from Princeton Instruments (PIXIS:400BR eXcelon), offering enhanced full well capacity, readout rate and quantum efficiency of 83% at 915nm. The wave mixing signal is retrieved in amplitude and phase by performing spectral interferometry and by adjusting to arrive prior to the signal. We note that we have also tested optical heterodyning by performing digital mixing with an arbitrary wave-form generator (Tektronix, sampling rate 1.2G/s) and retrieved the FWM from single quantum dots with the same signal-to-noise ratio, as with the analogue mixing. This paves the way towards heterodyne n-wave mixing experiments, enabling quantum control of high order nonlinear processes of individual optical transitions in solids.
III Auxiliary results
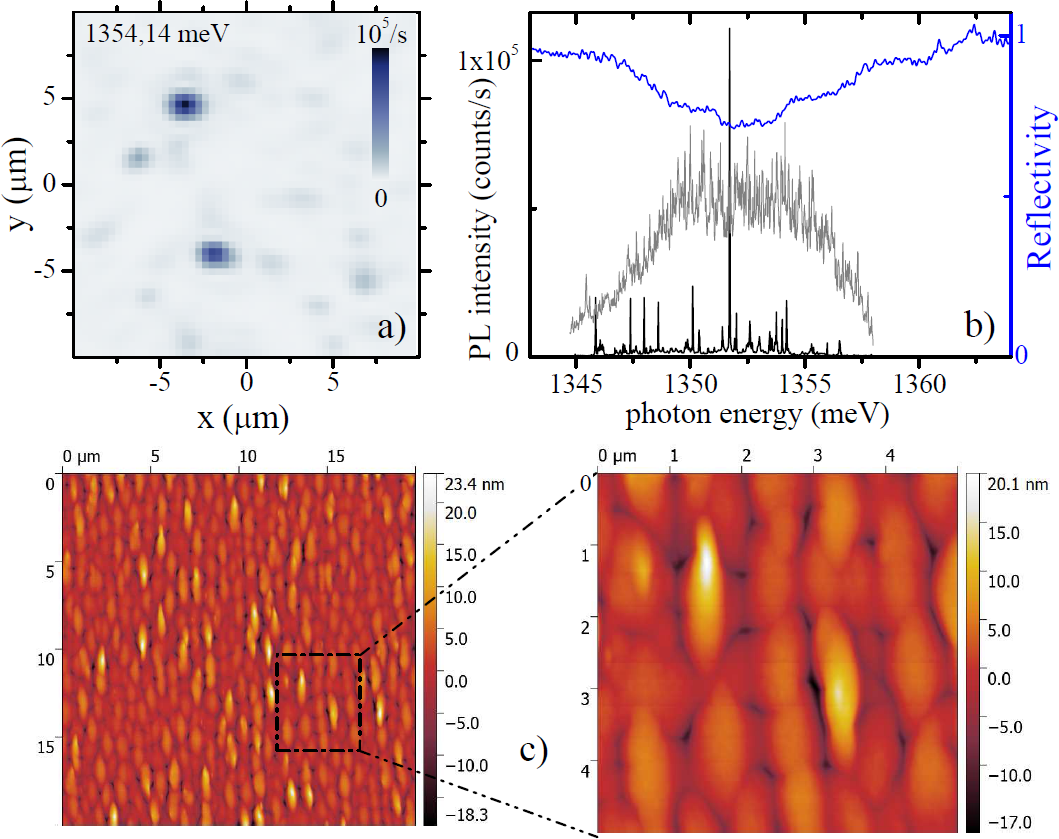
The sample has been grown by the molecular beam epitaxy. A layer of annealed and capped InAs QDs (density cm-2) is placed in a center of a GaAs spacer. A -doping layer with Si (density cm-2) is present 10 nm below the QD layer, inducing intentional negative doping of QDs. The spacer is sandwiched between two Bragg mirrors. The bottom (top) mirror contains 24 (5) pairs of Al0.9GaAs/GaAs stacks, forming an asymmetric -cavity with a quality factor of . An example of the micro-photoluminescence hyperspectral imaging frame performed on the studied microcavity is shown in Fig. S2 a. The sample is excited in continuous wave at 1.734 eV with W at the sample surface. Blue peaks correspond to the emission of individual InAs quantum dots. Count rates at the peak as high as per seconds are routinely detected using a grating of 1800 grooves/mm with Low Noise and gain 2 settings of the Pixis camera. Linear color scale from 0 to counts per seconds. In Fig. S2 b we present a typical micro-photoluminescence spectrum (black) and photoluminescence spectrum averaged over (gray). The reflectivity spectrum measured with the white light (blue) shows the cavity mode. The mode is broadened at the high energy side due to high NA of the microscope objective and the in-plane dispersion of the cavity. In Fig. S2 c we present topography of the sample surface, revealed with the atomic force microscopy. Typical topography images over the sample area of (left) and of are shown, revealing mosaic-like morphology with characteristic oval photonic defects of typically in-plane size and of 20 nm hight occurring with a spatial density 0.1. Such defects offer an enhanced in- and out-coupling efficiency of around 40 %, as recently shown in Ref. [20]. This, combined with an intra-cavity amplification, results in an enhanced excitation and detection of the coherent nonlinear responses of QDs situated close to the maximum of the localized optical mode induced by a defect. We systematically measure shorter T1 times (150-350 ps), weaker driving powers and stronger FWM from QDs residing in the defects, with respect to the dots placed outside of defects. We speculate that these observations are due to the change of the photon density of states by the surface modulation defects, creating a varying coupling efficiency and Purcell effect. Further research is required to make a clear assignment and to elucidate the influence of these photonics defects on the coherent response of QDs.
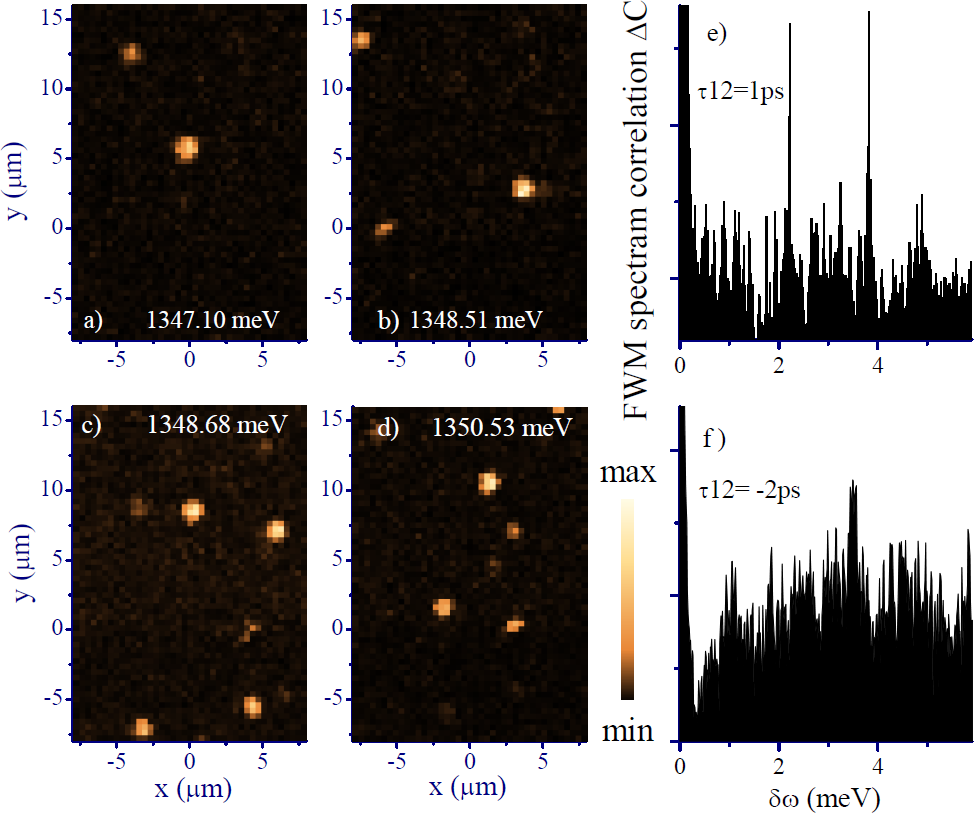
Typical frames of the FWM hyperspectral imaging at and as labeled are shown in Fig. S3 a-d. Linear colour scale from black to white, as shown by the vertical bar. Strongest peaks primarily correspond the FWM of negative trions. In order to obtain spectrally-resolved FWM image, as exemplified in Fig. 1 b, the following procedure is applied. For each spatial position, the spectrally-resolved FWM amplitudes are fitted with a Lorentzian function within a chosen energy region (specifically, from 1349.7 meV to 1350.3 meV in Fig. 1 b). The fitted center position yields the energy, while the fitted Lorentzian amplitude is proportional to the FWM amplitude. The retrieved parameters are rearranged into a pair of two-dimensional spatial maps; encoding spectral position and amplitude, respectively. They are finally merged into a single, spatial map, where the amplitude is represented as brightness and the energy as a hue level.
In Fig. S3 e and f we provide the result of the FWM spectral correlation analysis performed on the hyperspectral imaging FWM data, as defined in Ref. [38]. For ps, reveals two peaks at of 2.2 meV and 3.8 meV attributed to neutral exciton and biexciton transitions, present in around 10% of quantum dots. Due to the weak strength of two particle states, specifically negatively charged biexcitons, the FWM of trions is vanishing at negative delays . Therefore for ps, shows only one peak at meV, attributed to biexciton transitions of neutral excitons. Lower signal to noise ratio is due to smaller statistics available. Wave mixing spectroscopy on such exciton-biexciton-trion systems will be presented in a forthcoming publication.
In Fig. S4 we provide two supplementary FWM measurements performed on two different negative trions, demonstrating their raditively limited dephasing (T2=2T1). The population dynamics measured with FWM is shown by brown squares. Fitted mono-exponential decay (brown line) yields population lifetime of T1=ps (a) and T1=ps (b). The coherence dynamics measured by FWM is depicted with black circles in (c) and (d), respectively. The data are fitted by the model presented in Ref. [19] (namely Eq. (2)), using radiatively limited dephasing and inhomogeneous broadening due to residual spectral wandering eV (c) and eV (d). Note the initial rise in the coherence dynamics observed in (c), due to the resolved photon echo formation. This figure is supplementary to Fig. 1. Pulse sequences employed to measure coherence (right) and population (left) dynamics are also depicted. The reference pulse arrives a few ps prior to .
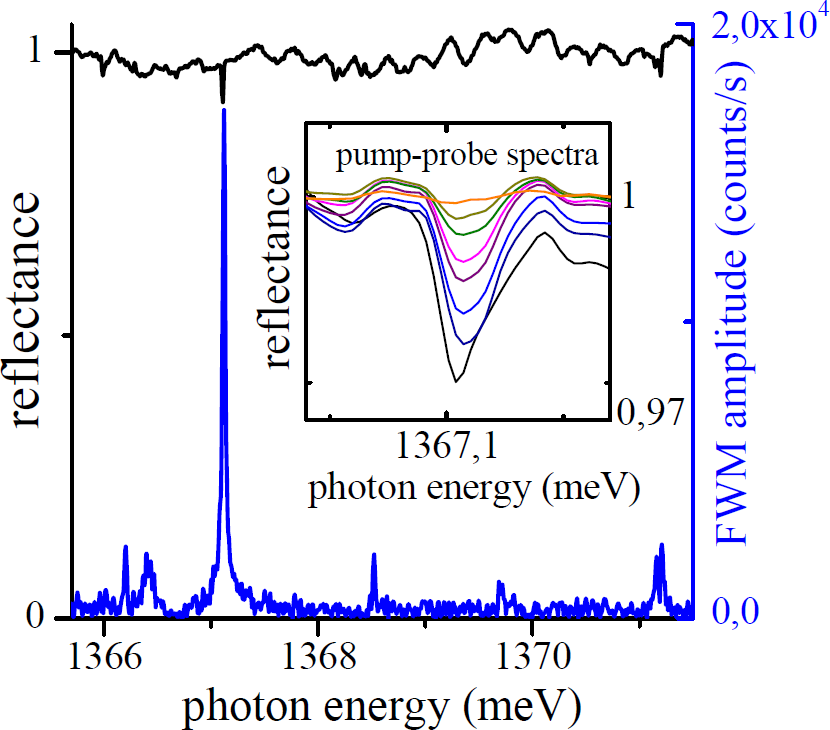
Being radiatively limited, such trions are expected to be observable in the first-order absorption experiment. In Fig. S5 we compare the FWM spectrum (blue line) with a direct reflectance spectrum of the beam (black line) measured at the same spot. The FWM reveals dominating transition at 1367.1 meV. The reflectance displays a dip at the same spectral position. It corresponds to the first-order absorption of the QD, with a contrast of a few per-cent resulting from the convolution of the homogenous linewidth with the spectral resolution. To further confirm that the reflectance dip indeed corresponds to the linear absorption of a trion in a single QD, we have performed the pump-probe experiment. The result is given in the inset, where the reflectance is shown while increasing the pulse area of the beam from (black trace) to (orange trace) for ps ( arriving first). As expected, the absorption is gradually decreased with increasing and is entirely saturated for the .
In Fig. S6 we present the amplitude of the FWM transient for , demonstrating a complete suppression of the FWM at the arrival of the , which converts the FWM polarization into the SWM one. The pulse area of is set to . Right: Measured FWM spectrum, showing the corresponding change of the FWM spectral lineshape depending on . The data are supplementary to Fig. 3. In Fig. S7, the FWM is generated only within a time window of ps prior to the arrival of . As a result, with increasing , the FWM gets virtually suppressed. The data are supplementary to Fig. 4.
Supplementary References
36 A. Bambini and P. R. Berman, Analytic solutions to the two-state problem for a class of coupling potentials Phys. Rev. A 23, (1981).
37 Lorenza Viola and Seth Lloyd, Dynamical suppression of decoherence in two-state quantum systems Phys. Rev. A 58, (1998).
38 J. Kasprzak and W. Langbein, Coherent response of individual weakly confined exciton biexciton systems J. Opt. Soc. Am. B 29, 1776 (2012).