11email: rolandk@astro.su.se 22institutetext: Oskar Klein Centre for Cosmoparticle Physics, Stockholm University, SE-106 91 Stockholm, Sweden 33institutetext: Institut de RadioAstronomie Millimétrique 300 rue de la Piscine, Domaine Universitaire 38406 Saint Martín d’Hères, France
The OH-streamer in Sgr A revisited: analysis of hydroxyl absorption within 10 pc from the Galactic centre. ††thanks: Based on observations with the Karl G. Jansky Very Large Array, NRAO. The 1665 and 1667 MHz data cubes, presented in the on-line Appendices C and E, respectively, are also available in electronic form at the CDS (at http://vizier.u-strasbg.fr/viz-bin/VizieR).
Abstract
Aims. We study the structure and kinematics of the OH-streamer and the +80 km s-1 cloud and their interactions with the circumnuclear disk (CND) and with other molecular clouds in the vicinity of the Galactic centre (GC), and we map OH absorption at about 6″ resolution at 10 pc from the GC, with about 9 km s-1 of velocity resolution.
Methods. The VLA was used to map OH line absorption at the 1665 and 1667 MHz lambda doublet main lines of the state towards the Sagittarius A complex.
Results. Strong OH absorption was found in the OH-streamer, the southern streamer (SS), the +20, +50, and +80 km s-1 molecular clouds, the molecular belt, the CND, the expanding molecular ring (EMR), and the high negative velocity gas (HNVG). The OH-streamer was found to comprise three parts, head, middle, and tail, and to interact with the SS/+20, +80 km s-1 clouds and the CND. Optical depths and column densities divided by excitation temperatures have been calculated for the OH-streamer and the +80 km s-1 cloud.
Conclusions. The OH-streamer, the SS, the +20 and +80 km s-1 clouds, and the CND are intimately related in position and velocity space. The OH-streamer was found to be a clumpy object stretching in projection from the inner radius of the CND at about 1.8 pc from Sgr towards and partly engulfing Sgr . As a side result of our data, a possible link between the near side of the EMR and the CND’s southwest lobe was found. Additionally, we found OH absorption against all four of the previously known Compact H ii Regions A - D, located east of Sgr A East, indicating their close association with the +50 km s-1 cloud.
Key Words.:
Galaxy: centre – ISM: individual objects: Sgr A – ISM: molecules – ISM: cloudsRoland Karlsson,
1 Introduction
At the very core of the Milky Way Galaxy is the 4-million-solar-mass supermassive black hole (SMBH) whose non-thermal radio continuum signature is called Sgr . Surrounding it at a distance of one to a few pc and orbiting it with a velocity of about 100 km s-1is a rotating molecular structure called the circumnuclear disk (CND). In the cavity inside the CND, there is a central cluster of old stars and bright young stars clustered around the SMBH. Inside the cavity is also the mini-spiral-shaped H ii region called Sgr A West, which represents the inner western edge of the CND, and a northern streamer extending from the CND towards Sgr . A little farther out there is a large molecular belt extending from the southwest to the northeast (parallel to the plane of the Galaxy). The major components of this belt are the two giant molecular clouds, known as the +20 km s-1 cloud and the +50 km s-1 cloud. A giant energetic ( ergs) supernova-remnant-like non-thermal continuum radio shell (diameter about 8 pc), known as Sgr A East, is plowing into this molecular belt from the side near Sgr , creating regions of shock interaction especially at the inner surface of the +50 km s-1 cloud. Lunar occultation observations of OH absorptions at resolution showed the multiple structures within the Sgr A region (Kerr & Sandqvist ker68 (1968); Sandqvist san73 (1973), san74 (1974)). Interferometric observations of OH absorption in the Sgr A complex with an angular resolution of 45 were subsequently presented by Bieging bie76 (1976). Absorption measurements are useful for revealing the location of the clouds along the line of sight, relative to the continuum emission.
General reviews of the Galactic centre (GC) region have been presented by Mezger et al. (mez96 (1996)) and Morris & Serabyn (mor96 (1996)), among others, and an up-to-date introduction to the Sgr A complex is given by Ferrière (fer12 (2012)).
We performed observations of the GC region in all four 18-cm OH lines with the Karl G. Jansky Very Large Array, henceforth the VLA, in the wide array BnA configuration and in the two main OH lines also in the compact DnC configuration. The first preliminary 1667 MHz OH line results with about 4″ angular resolution were presented by Sandqvist et al. (san87 (1987), sad89 (1989)). One of the most interesting results was the discovery of an “OH-streamer” that stretches from the southwest part of the CND and subsequently sweeps northeastward projected inside the CND towards Sgr . However, the velocities of the OH-streamer and the SW CND differed by more than 100 km s-1 so their relation was unclear. Subsequently, the OH-streamer was also detected at 1612 and 1665 MHz in the high-resolution BnA observations with the VLA (Karlsson et al. kar03 (2003)). The full extent of the OH-streamer has not been detected in other molecular lines, probably owing to a lack of angular resolution and sensitivity. However, recent interferometric observations of CN emission by Martín et al. (mar12 (2012)) have revealed a few high-density clumps in the OH-streamer. No magnetic field with a upper limit of 2 mG has been found in the OH-streamer (Killeen et al. kil92 (1992)). Sandqvist et al. (san87 (1987)) also briefly noted “another feature at +78 km s-1” (henceforth the +80 km s-1 cloud) that seemed related to the OH-streamer.
In this paper, we present the concatenated VLA BnA and DnC observations of the two 1665 and 1667 MHz main OH lines. We concentrate here on the interplay between the OH-streamer, the +80 km s-1 cloud, and the CND and possible effects of the SMBH and the surrounding star cluster. Moreover, a possbile link between the CND SW lobe and the near side of the expanding molecular ring is suggested. A detailed study of all the features seen in the data and their interrelations is, however, beyond the present scope and will be the subject of a subsequent paper.
2 Observations

The main OH transition lines at 1665 and 1667 MHz and the satellite lines at 1612 and 1720 MHz were observed in June 1986 with the VLA in the BnA wide array configuration. The main transition lines were also observed with the VLA in its DnC compact array configuration in October 1989. The initial- and post-calibration of the observational data were done with the National Radio Astronomy Observatory (NRAO), Astronomical Image Processing System (AIPS) at the VLA site and at the Array Operations Center in Socorro, NM. The two sets of () data for each of the main lines were subsequently concatenated into one data set to improve sensitivity and reduce the effects of missing zero-spacing observations. The concatenation was done with the NRAO AIPS DBCON program package, and baselines were subtracted with the NRAO AIPS UVLSF program package in the ()-plane. Throughout this paper we define “OH absorption” as “continuum minus line flux” (), in units of mJy/beam. The angular resolution is , and the velocity resolution is 8.8 km s-1. Typical noise levels in the concatenated spectral line maps and line profiles are about 25 mJy/beam, and about 5 mJy/beam for the original angular resolution BnA 1667 MHz data. The concatenated data are used for the main part of this paper, but the original BnA 1667 MHz data are used as a complement. The subsequent processing of the data was done with both the NRAO AIPS and the XS111Developed by P. Bergman, Onsala Space Observatory program packages. Projected distances correspond to about 0.04 pc/″ assuming a distance to the GC of 8 kpc. The position of Sgr is (RA, Dec) = 17h45m4003, 276 (J2000.0). For further information about the observations, see Karlsson et al. (kar03 (2003), kar13 (2013)).
3 Results
3.1 Morphology and physical properties of the OH-streamer and the +80 km s-1 cloud
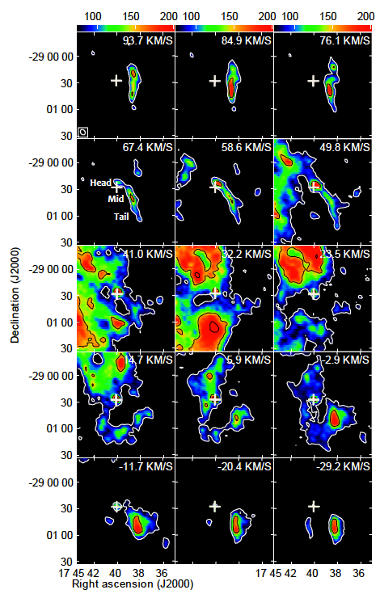
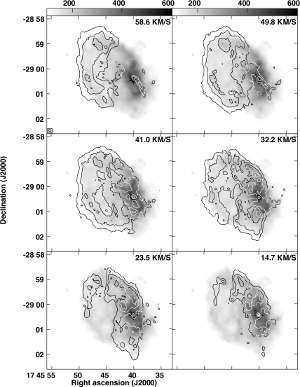
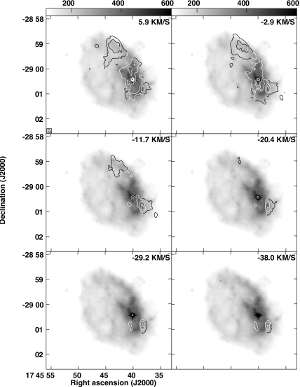
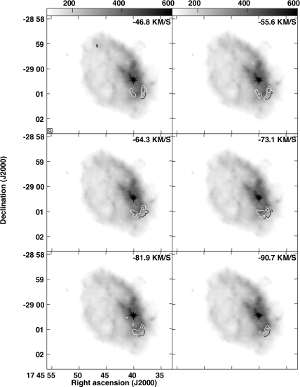
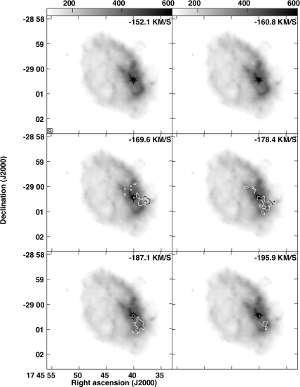
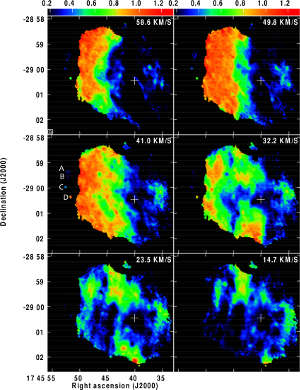
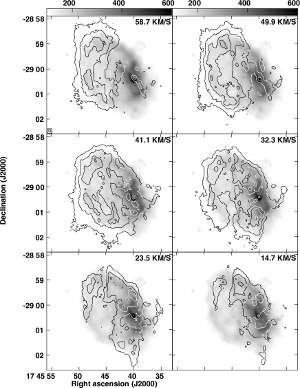
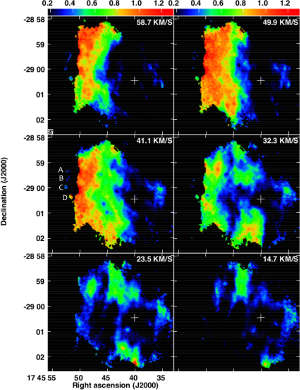
The OH-streamer is observed at 1667 MHz between velocities of 29 and 67 km s-1 (Figs. 1 and 2; and in the on-line-only Appendice Figs. B.1- B.3, C.1 - C.3). At 1665 MHz it is observed between 20 and 68 km s-1 (Figs. D.1 and E.1). It is slightly curved to the E with an average position angle (PA) of east of the north celestial pole. The projected length of the OH-streamer is 68″ (2.7 pc), and the width is (4 - 15)″ (0.2 - 0.6 pc), as measured at 59 km s-1. Three clumps, head, mid, and tail, are seen inside of the OH-streamer at velocities of 50, 59, and 67 km s-1in both the 1665 and 1667 MHz transitions. Inside of the mid part, a fine structure of smaller clumps is also observed.
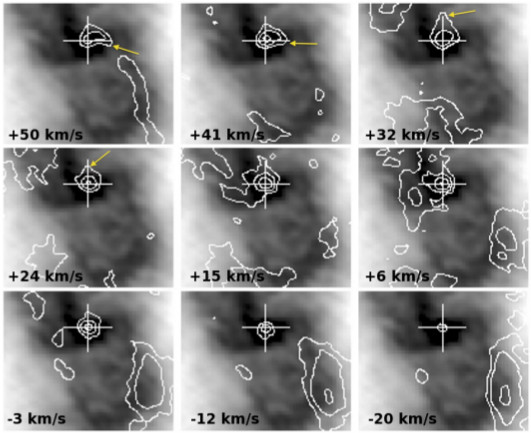
The geometry of OH-absorption in the head varies significantly with velocity, as can be seen in Fig. 3, where we present the higher resolution BnA maps from Karlsson et al. (kar03 (2003)). A winglike structure develops on the western side at velocities of about 50 km s-1and displays an anti-clockwise rotation as the velocity decreases, and the head becomes nearly circular at velocities below 15 km s-1.
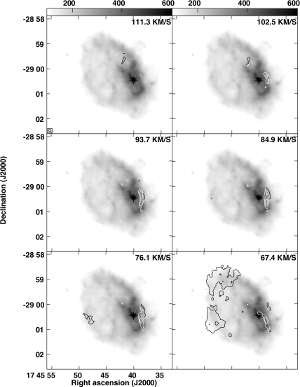
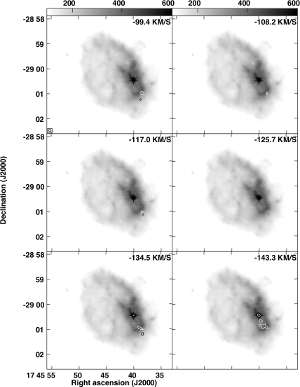
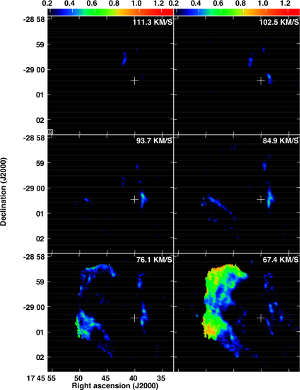
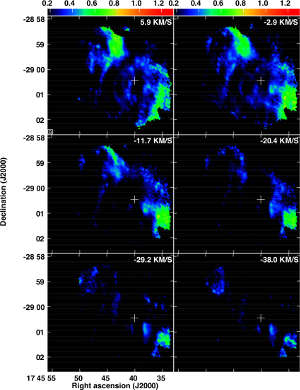
The +80 km s-1 cloud is observed at a distance of about 18″ (0.7 pc) W of Sgr at velocities between 67 and 111 km s-1 (Figs. 2, 4 and B.1, C.1). It is extended mainly in the north - south direction. The length extends to 65″ (2.6 pc), while the width is about 15″ (0.6 pc) at 76 km s-1. Two clumps are seen in the +80 km s-1 cloud between 76 km s-1 and 103 km s-1, separated by (1 pc). At 103 and 111 km s-1, the northern part of the cloud bends to the east, and points towards the northeastern extension of the CND northeastern lobe in a similar manner to a CN emitting feature, centred at 90 km s-1 in a 30 km s-1 wide bin (Martín et al. mar12 (2012)).
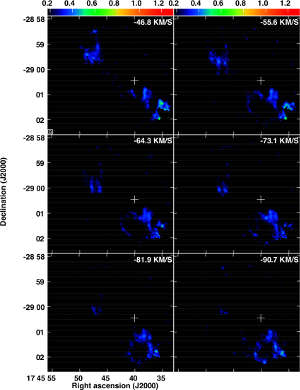
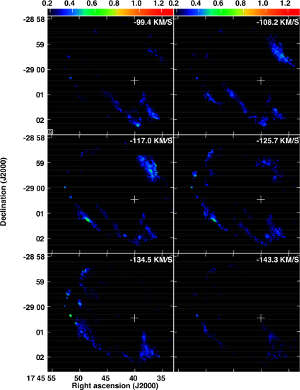
By dividing the spectral line maps () by the continuum map ), we reduce the effects of the varying continuum intensity in the region and obtain () maps at 1667 MHz and 1665 MHz. This ratio is proportional to the optical depth as , where 1 is often referred to as “apparent opacity”. Both the OH-streamer and the +80 km s-1 cloud retain their basic properties in Figs. C.1 and C.2, which validates the reality of the objects.
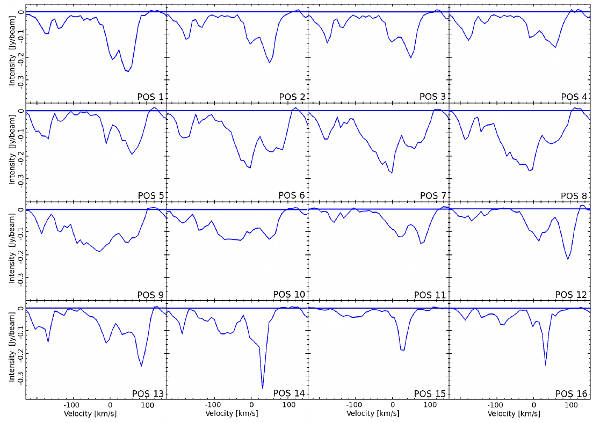
OH absorption line profiles were produced at 16 positions centred along the OH-streamer and the +80 km s-1 cloud, respectively (Figs. A.1 and A.2.). Optical depths () and column densities divided by excitation temperatures ((OH)/ex) were calculated at the positions of the profiles as described in Karlsson et al. (kar13 (2013)) (see Table A.1).
To get a first order of the mass of the OH-streamer and the +80 km s-1 cloud, we assume that each of the three clumps in the OH-streamerand the full length of the +80 km s-1 cloud can be represented by prolate ellipsoids (see Table 1). The material between the clumps in the OH-streamer are not considered, such that the mass of the OH-streamer is considered as a lower limit. The value of is taken as , which is in the lower range for molecular gas in the CND found in Ferrière (fer12 (2012)). We derive at a total mass of 400 M⊙ for the OH-streamer and about 2500 M⊙ for the more massive +80 km s-1 cloud (Table 1).
| Object | Length x Width | a𝑎aa𝑎aProjected distance from the position of Sgr . | Volume | Mass |
|---|---|---|---|---|
| (″ x ″)(pc x pc) | (pc) | () | () | |
| Head | (15 x 5) (0.6 x 0.2) | 0.3 | 0.013 | 65 |
| Mid | (20 x 5) (0.8 x 0.2) | 0.9 | 0.017 | 85 |
| Tail | (15 x 10) (0.6 x 0.4) | 1.5 | 0.050 | 250 |
| +80 km s-1 cl. | (65 x 15) (2.6 x 0.6) | 0.7 | 0.490 | 2450 |
3.2 Locations and interactions of the components
We present here three different displays of our data to shed some light on possible links between the objects: i) maps of projected locations, ii) position-velocity diagrams, and iii) a position angle-velocity diagram.
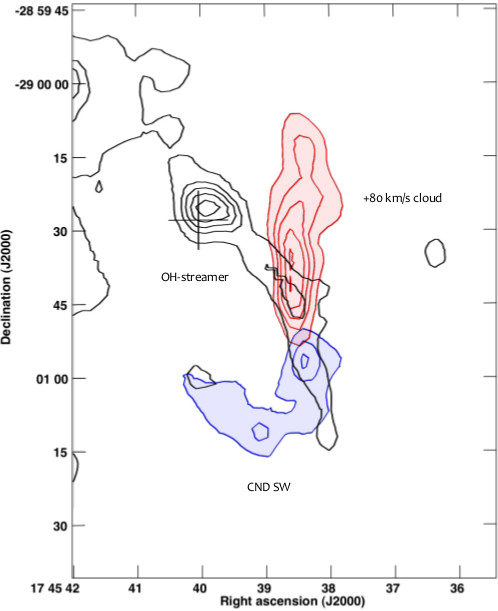
i) Projected locations: To study the relative positions of the OH-streamer, the +80 km s-1 cloud, and the CND southwest lobe, we have overlaid those three components in Fig. 4. The OH-streamer head is observed in absorption against Sgr , symmetrically between velocities of 29 to 15 km s-1. At 24 to 67 km s-1, the absorption moves to the northwest and is then only partly seen against Sgr (Figs. 2, 3, and 4). The Mid part overlaps the southern part of the +80 km s-1 cloud (Fig. 4). The tail partially overlaps the CND southwestern lobe in Fig. 4. In Fig. 2 the northern part of the +20 km s-1 cloud and the SS are clearly seen about 60″ (2.4 pc) south of the position of Sgr , at 32 km s-1, which also is in the region of the southwest lobe of the CND.

Three blobs of CN emission (Martín et al. mar12 (2012)) are observed in the OH-streamer head, mid, and tail (Fig. 5). Moreover, S emission is also found in the head, as seen in the lower left-hand panel of Fig. 6 in Liu et al. (liu12 (2012)). Both the CN and S emission trace high-density regions.
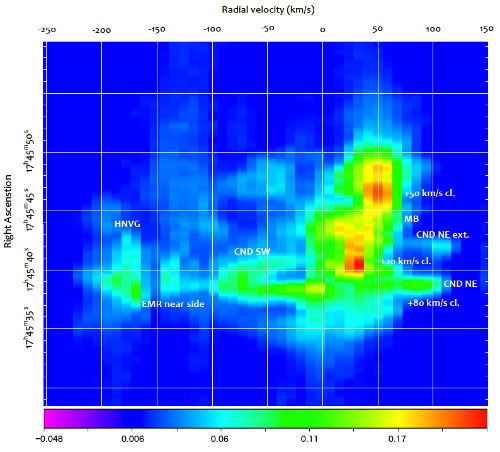
ii) Position-velocity diagrams: Position-velocity cuts of OH absorption at 1667 MHz for a 2′ x 2′ region around Sgr are shown in Fig. 6 and provide a detailed picture of interactions in the position-velocity space. Figure 6 e) is the RA scan at the declination of Sgr , and it passes from the +80 km s-1 cloud to the head of the OH-streamer. In the head, both negative and positive velocities appear. In Fig. 6 d), the +80 km s-1 cloud displays an increasing velocity from about 63 to 107 km s-1in the easterly direction towards the CND NE extension, corresponding to a velocity gradient of about 4.9 km s-1/″. A rapid acceleration, from about 30 to 80 km s-1 is also observed in the western part of the molecular belt/+20 km s-1 cloud, seen as the knee-like structure at an (RA) of about 17h45m385 in Figs. 6 f) and g). This occurs in the overlap region of the OH-streamer Mid and the southern part of the +80 km s-1 cloud. Moreover, the increases from 26 to 50 km s-1 in this region.
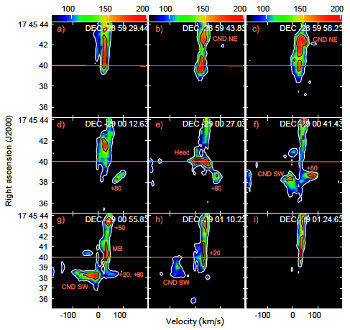

Figure 7 is a visualisation throughout the entire data cube, covering an region seen face-on from the declination side. It illustrates that right ascension structure can also be easily followed at the same time. The corresponding visualisation seen from the right ascension-velocity side is shown in Fig. 11. The OH-streamer tail is seen to interact with the +20 km s-1 cloud, and interactions between the +20, +80 km s-1 clouds can also be traced in Fig. 7. In those two figures the near side of the EMR seems to connect to the CND SW lobe. The interaction occurs at (RA, Dec) = 17h45m, , and the map position of this interaction is located on the southeastern side of the OH-streamer tail.
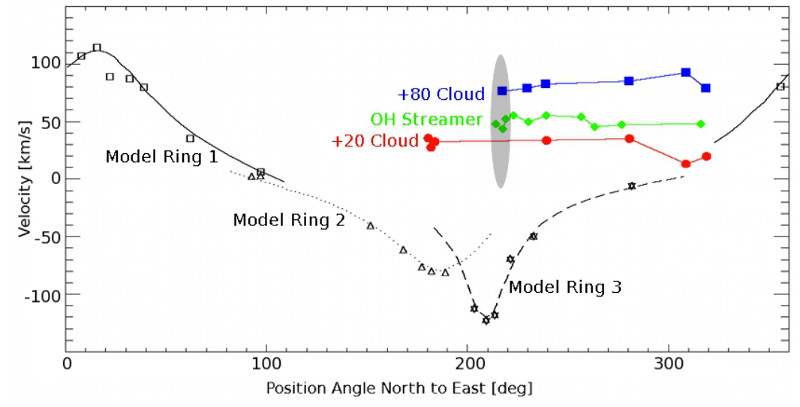
iii) Position angle-velocity diagram: Figure 8 is a modified diagram by Martín et al. (mar12 (2012)), their Fig. 9, which shows measured component velocities in CN emission as a function of position angle (PA) measured from the position of Sgr . In this figure we have suppressed all points observed by Martin et al. (mar12 (2012)), except for those belonging to their rotating partial ring models for the CND, and superimposed our own calculated velocities and PAs for the OH-streamer and the +80 km s-1 cloud at Positions 1 - 16 (Fig. A.1 and Table 2).
The OH-streamer shows a nearly flat velocity structure of about 50 km s-1 in the head between PAs from about 260° to 310° in Fig. 8. In the higher resolution BnA observations in Fig. 3, we find that a winglike structure of the head occurs at 50 km s-1and persists to 3 km s-1, while displaying an anti-clockwise rotation (the arrows in Fig. 3), and may be a signature of rotation of the OH gas in the head about Sgr or infalling of gas towards Sgr . The OH absorption also declines while the velocity drops from 50 km s-1 to 20 km s-1. In Fig. 8, the velocity is seen to increase about 10 km s-1 between PAs of about 230° and 260° corresponding to the mid part of the OH-streamer, which is also the overlap region of the mid part and the +80 km s-1 cloud. The velocity of the two outermost points in the tail decreases towards the values in the +20 km s-1 cloud; this region is indicated with an ellipse in Fig. 8.
The +80 km s-1 cloud is sampled well at PAs between 250 and 315 in Fig. 8, a similar interval as the “70 km s-1 sources” observed in CN emission (Martín et al. mar12 (2012)), and it appears that those sources are located in the +80 km s-1 cloud. It is clear from this figure that the dominant part of the +80 km s-1 cloud is not part of the western edge of the CND. However, its northernmost part might be connecting to the CND rotating ring model 1 in the sector of PAs about 320° to 330°.
The +20 km s-1 cloud shows a flat velocity signature from PAs of 180° to 280°, after which the velocity appears to approach that of the CND rotating ring model 3, near a PA of 310°.
4 Concatenated OH data cubes
Spectral line maps of OH absorption at 1667 MHz with an angular resolution of are provided in Appendix B at velocities between 196 and 111 km s-1. The corresponding OH maps at 1667 MHz are presented in Appendix C. As a representative of the 1665 MHz OH maps, we have chosen a few maps at velocities between 15 and 59 km s-1 which are presented in Appendices D and E. This limited velocity range covers some of the more pertinent components in this paper.
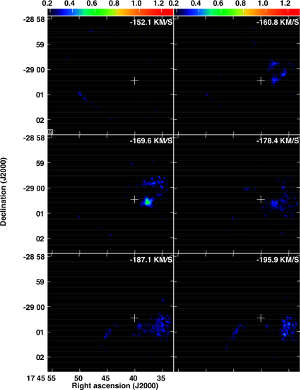
In additon to the objects discussed in this paper, many other known objects, such as the foreground spiral arm features at velocities of about 50, 30, and 0 km s-1, the high negative velocity gas, and the wide velocity feature (Karlsson et al. kar13 (2013)), can be seen in those maps.
Although much additional information can be gleaned from the maps, we wish here to restrict ourselves to an update concerning the Compact H ii regions (A - D) (Ekers et al. eke83 (1983)) on the eastern edge of the +50 km s-1 cloud. In Karlsson et al. (kar13 (2013)), we reported observations of OH absorption against the Compact H ii Region D. A further analysis of the data now reveals that OH absorption is also seen against the three other regions, A, B, and C, in the velocity ranges of 24 to 76 km s-1 and 32 to 76 km s-1, for the 1667 and 1665 MHz lines, respectively (Figs. C.1, C.2, D.1, and E.1).
The four complete data cubes of the OH absorption and at 1665 and 1667 MHz are available in electronic form at the CDS at http://vizier.u-strasbg.fr/viz-bin/VizieR.
5 Discussion
The OH-streamer is clearly observed between velocities of 29 and 67 km s-1. At velocities between 0 and 10 km s-1 confusion with foreground sources may occur. The OH-streamer is not observed in the maps at velocities less than 41 km s-1. Clipping of the different random noise levels in the channel and continuum maps and absorption in foreground objects may explain the absence of this feature at those velocities in the maps.
Species like CN and OH tend to be abundant in photo dissociation regions, suggesting that they mark the regions where UV radiation from the central star cluster interacts with the surrounding neutral gas. The OH column densities divided by excitation temperatures ((OH)/ex) for the different parts are given in Table 2. It is likely that increases with decreasing distance from Sgr , which would imply increasing OH column densities towards the head.
In the region of the head, UV-radiation pressure from the central star cluster may be a factor that could lead to outflow of OH gas from the head. However, Murray et al. (mur11 (2011)) find that outflows from clusters in a Milky way-like galaxy (their Fig. 4), would lead to outflow velocites of several hundreds of km s-1, at distances from the centre relevant for the OH-streamer head (0.3 pc), where we observe velocities of about 50 km s-1. At distances less than about 0.1 pc, the radiation pressure may, however, be significant in supporting self-gravitational disks that are supposed to fuel the SMBH at the centre (Thompson, tho09 (2009)). We therefore argue that radiation pressure is not significant for the kinematics of the head.
The influence radius of the SMBH and the surrounding star cluster can be estimated by calculating the total gravitational specific force in its surrounding few parsecs. Following Sanders (sad98 (1998)) and assuming a core radius of 0.085 pc and the mass of the SMBH to be 4.5106 , it becomes clear that the force from the SMBH and the surrounding star cluster is significant at distances less than about 0.25 pc ( 6 ″), i.e. in the region of the OH-streamer head. It decreases by more than one order of magnitude at distances greater than about 0.7 pc where the mid and tail parts of the OH-streamer reside. Thus, the gravitational pull of the SMBH and the surrounding star cluster is strong enough to affect the kinematics of the head, but not the mid or tail.
In a recent study, Yusef-Zadeh et al. (yus13 (2013)) identified blobs of weak radio emission at 8.4 GHz located on a line through the position of Sgr at a PA of E of N. Three of the blobs, b), c), and d), appear to be accommodated inside of the OH-streamer between the head and mid maxima. Furthermore, CN emission is observed at the position of blob d) (RA, Dec) = 17h45m388, 40. We note that this position also coincides with the region of intersection between the eastern part of the +80 km s-1 cloud and the mid part of the OH-streamer, i.e. where a steep intensity gradient is seen in Fig. 4.
The +80 km s-1 cloud interacts with the OH-streamer and the CND, while the cloud is not a part of the CND itself. The southern part of the cloud interacts with the OH-streamer Mid and Tail parts, as seen both in the map- and position-velocity planes. Interaction between the OH-streamer and the +80 km s-1 cloud in this region may also be indicated by the striking increase in the value of of line profile components here. Although shock-excited 1720-MHz OH maser sources were not found in 1985 in this region of interaction (Karlsson et al. kar03 (2003)), it may well be worthwhile repeating such a search at a later epoch. The velocity in the northern part of the +80 km s-1 cloud seems to be generally increasing to the north and to adapt to the velocity of the CND NE lobe as observed in CN emission. This part of the cloud may, however, be a detached clump of the +80 km s-1 cloud (Figs. B.1 and C.1).
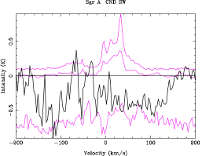
Interaction between the +20 km s-1 cloud and the CND SW lobe (via the SS) is consistent with the observation of Coil & Ho (coi99 (1999)) that the northern tip of the +20 km s-1 cloud/(SS) interacts with (feeds) the CND SW lobe. Additionally, Karlsson et al. (kar13 (2013)), observing this region in the C18O emission line, found that the northern part of the +20 km s-1 cloud/SS has an extension which bends abruptly from the northwest to the northeast, pointing in towards the OH-streamer tail and CND SW lobe (see their Fig. 11). The presence of shock activity in this common region of the OH-streamer, the +20 and +80 km s-1 clouds, and the CND SW is furthermore supported by recent observations of an unusually wide HO positive-velocity absorption line. The abundance ratio of H2O with respect to was found to be approximately , a high value indicative of the presence of strong shocks desorbing water from dust grains in this region (Karlsson et al. kar13 (2013), and Appendix F). In Fig. 8, we have tentatively indicated the region of interaction (in the map plane) between the +20 and +80 km s-1 clouds and the OH-streamer.
A new result in our data is that of a possible link between the near side of the EMR and the CND SW lobe (Figs. 7 and 11). Is the EMR a link in the process of transporting material from the 100 pc scale to the 10 pc scale of the CND via molecular clouds (Fathi et al. fat06 (2006))? Incidentally, this region also coincides with the rotating ring model of the CND where the velocity is about 115 km s-1 with a velocity width of 40 km s-1 (Martín et al. mar12 (2012)). Furthermore, Emsellem et al. (ems14 (2014)) have studied the interplay between a galactic bar and an SMBH by simulating a Milky Way-like galaxy. They found that gas is focused on (Lindblad) resonances into elongated ring-like structures and subsequently connects to the SMBH via mini-spirals inside of a few tens of pc. Ultimately, the gas accreted in the vicinity of the SMBH creates a series of winding tails of gas, supporting our results in this work. In particular, the OH-streamer resembles the features presented in Emsellem et al. (ems14 (2014)), which suggest that it could have been triggered by tidal-like forces owing to the interplay between the gravitational potential of the Galactic bar and that of the SMBH at the centre of the Galaxy.
6 Conclusions
We have presented an analysis of certain features in our concatenated data base of VLA BnA and DnC observations of 1665 and 1667 MHz OH absorption towards the Sgr A Complex at the GC. Our data have an angular resolution of about 6″ and a velocity resolution of about 9 km s-1, and the full data set has been made available to the scientific community using the CDS 222http://vizier.u-strasbg.fr/viz-bin/VizieR.
Our investigation of the properties and kinematics of the OH-streamer and the +80 km s-1 cloud in OH absorption indicated that the OH-streamer is an object inside of the CND and interacting with the +80 km s-1 cloud, the CND, and possibly with the strong gravitational field from the SMBH and the surrounding star cluster. We also ouind indications of interaction between the +80 km s-1 cloud, or a detached clump of it, and the northeastern lobe of the CND via the CND NE extension.
We interpreted those kinematical and morphological links as indications that gas clumps were disrupted from the SW lobe of the CND and may have produced the OH-streamer and the +80 km s-1 cloud. At least the OH-streamer seems to be feeding material radially inwards, inside of the CND. For the +80 km s-1 cloud the kinematics have still not been resolved. Although the projected image of this cloud may suggest that it is a part of the CND, the position-velocity diagrams clearly dispute this.
Our conclusions are that the OH-streamer head is located in front of Sgr at velocities between about 15 and 50 km s-1 and partly behind at velocities between 59 and 67 km s-1 and that the OH-streamer head represents a part of an inflow of gas from the CND region. In the mid and tail parts, as well as in the head, we note a negative velocity gradient from the +80 km s-1 cloud and towards the GC, where one would expect increasing velocity inwards from the CND. If the OH-streamer and the +80 km s-1 cloud are located on the “far” side of the CND and behind Sgr A West, a flow from “behind” towards the centre would display such a negative velocity gradient.
Moreover, a detailed analysis of the position-velocity diagrams revealed a possible link between the near side of the EMR and the CND SW lobe. In this analysis we also found OH absorption against all four of the compact H ii regions A - D, east of Sgr A East, both in the 1665 and 1667 MHz transitions.
Further progress on the matter of relative locations and relations between the OH-streamer, the +80 km s-1 cloud, and the surrounding molecular clouds and Sgr would be gained from observations of OH with still higher angular and velocity resolutions and from searches for those objects in other species. Furthermore, a state-of-the-art 3D modelling would be highly beneficial to reveal the relative locations of molecular clouds in the 10 pc region surrounding the GC.
Acknowledgements.
The authors acknowledge the open policy for the use of NRAOs VLA. The National Radio Astronomy Observatory (NRAO) is operated by Associated Universities Inc., under cooperative agreement with the National Science Foundation. Kambiz Fathi acknowledges support from the Swedish Royal Academy of Sciences’ Crafoord Foundation. Furthermore, the extensive support from the Swedish National Space Board (Rymdstyrelsen) is gratefully acknowledged by Aage Sandqvist. We also acknowledge with gratitude the support from Miller Goss with concatenation of the observations with the VLA in its BnA and DnC configurations.References
- (1) Bieging, J. H., 1976, A&A, 51, 289
- (2) Coil, A. L., & Ho, P. T. P. 1999, ApJ, 513, 752
- (3) Ekers, R. D., van Gorkom, J. H., Schwarz, U. J., & Goss, W. M. 1983, A&A,122,143
- (4) Emsellem, E., Renaud, F., Frédéric B., et al. 2015, 446, 2468
- (5) Fathi, K., Storcgi-Bergmann, T., Riffel, R. A., et al. 2006, ApJ, 641, L25
- (6) Ferrière, K. 2012, A&A, 540, A50
- (7) Goldsmith, P., F. 1999, Millimeter-Wave Astronomy: Molecular Chemistry & Physics in Space, W. F. Wall et al. (eds.), ASSL, 241, 57
- (8) Karlsson, R., Sjouwerman, L. O., Sandqvist, Aa., & Whiteoak, J. B. 2003, A&A, 403, 1011
- (9) Karlsson, R., Sandqvist, Aa., Hjalmarson, Å., et al. 2013, A&A, 554, A141
- (10) Kerr, F. J., & Sandqvist, Aa. 1968, Astrophys. Let., 2, 195
- (11) Killeen, N. E. B., Lo, K. Y. & Crutcher, R. 1992, ApJ, 385, 585
- (12) Liu, H. B., Hsieh, P-Y., Ho, P. T. P., et al. 2012, ApJ, 756, 195
- (13) Martín, S., Martín-Pintado, J., Montero-Castao, M., Ho, P. T P., et al. 2012, A&A, 539, A29
- (14) Mezger, P.G., Duschl, W.J., & Zylka, R. 1996, A&AR, 7, 289
- (15) Morris, M., & Serabyn, E. 1996, ARA&A, 34, 645
- (16) Murray, N., Ménard, B., & Thompson, T. A. 2011, ApJ, 735, 66
- (17) Persson, C. M., Olofsson, A. O. H., Koning, N., et al. 2007, A&A, 476, 807
- (18) Sanders, R. H. 1998, MNRAS, 294, 35
- (19) Sandqvist, Aa. 1973, A&AS, 9, 391
- (20) Sandqvist, Aa. 1974, A&A, 33, 413
- (21) Sandqvist, Aa., Karlsson, R., Whiteoak, J. B., & Gardner, F. F. 1987, in The Galactic Center, ed. D. C. Backer, AIP Conf. Proc. 155, 95
- (22) Sandqvist, Aa., Karlsson, R., & Whiteoak, J. B. 1989, in The Center of the Galaxy, ed. M. Morris, IAU Symp. 136, p. 421 (Kluwer)
- (23) Thompson, T. A. 2009, ASPC, 408, 128
- (24) Wilson, T. L. & Rood, R. 1994, ARA&A, 32, 191
- (25) Yusef-Zadeh, F., Royster, M., Wardle, M., et al. 2013, ApJ, 767L, 32
Appendix A OH absorption
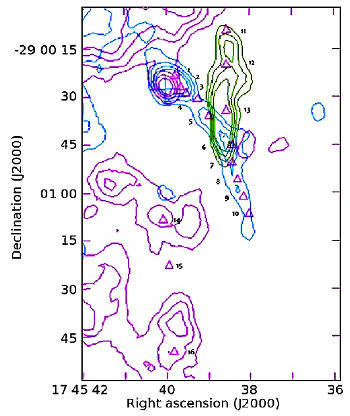
Figure 9 is a map that indicates the positions where the profiles in Fig. A.2 were produced using the 1667-MHz OH absorption data cube. Positions 1 - 4 are located in the OH-streamer head, 5 - 7 in the mid, and 8 - 10 in the tail part. Positions 11 - 13 are in the +80 km s-1 cloud, and positions 14 - 16 are in the northern part of the +20 km s-1 cloud. The OH parameters, obtained from a Gaussian analysis of these profiles, are presented in Table 2.
Figure 11 is a position-velocity diagram of the OH absorption at 1667 MHz of the inner region of the GC. It is a visualisation through the entire data cube seen face-on from the right ascension-velocity side. The angular resolution is , and the velocity resolution is 8.8 km s-1. The prominent features are labelled in the figure. We note the bridge between the EMR near side and the CND SW lobe.
| Pos.# | PA | fr. Sgr | b𝑏bb𝑏bfootnotemark: | , a𝑎aa𝑎afootnotemark: | c𝑐cc𝑐cfootnotemark: | (OH)/ | ||
|---|---|---|---|---|---|---|---|---|
| (deg) | (″, pc) | ( km s-1) | (Jy/beam) | ( km s-1) | (cm) | |||
| 1 OH-streamer head | 315 | 5.1, 0.20 | 50 | 0.256, 0.173 | 33 | 1.48 | 1.0(+0.5/0.4) | |
| 2 | 277 | 6.3, 0.25 | 49 | 0.216, 0.150 | 40 | 1.44 | 1.0(+0.7/0.2) | |
| 3 | 263 | 7.6, 0.30 | 47 | 0.194, 0.125 | 35 | 1.55 | 0.9(+0.3/0.4) | |
| 4 | 256 | 10.1, 0.40 | 56 | 0.150, 0.094 | 35 | 1.60 | 0.6(+0.4/0.4) | |
| 5 OH-streamer mid | 239 | 16.1, 0.64 | 57 | 0.194, 0.131 | 35 | 1.48 | 1.2(+0.3/0.6) | |
| 239 | 16.1, 0.64 | 84 | 0.127, 0.108 | 21 | 1.18 | 2.9(+1.6/0.8) | ||
| 6 | 230 | 27.5, 1.10 | 52 | 0.183, 0.113 | 26 | 1.62 | 0.5(+0.4/0.3) | |
| 230 | 27.5, 1.10 | 80 | 0.173, 0.115 | 40 | 1.50 | 1.0(+0.4/0.4) | ||
| 230 | 27.5, 1.10 | 33 | 0.151, 0.111 | 38 | 1.36 | 1.6(+0.6/0.5) | ||
| 7 | 223 | 30.6, 1.22 | 57 | 0.166, 0.102 | 50 | 1.63 | 0.5(+0.3/0.3) | |
| 8 OH-streamer tail | 219 | 36.1, 1.44 | 54 | 0.146, 0.101 | 45 | 1.45 | 1.2(+0.4/0.4) | |
| 9 | 217 | 41.4, 1.66 | 45 | 0.142, 0.088 | 48 | 1.61 | 0.6(+0.3/0.4) | |
| 217 | 41.4, 1.66 | 77 | 0.109, 0.085 | 24 | 1.28 | 2.1(+0.8/0.6) | ||
| 10 | 214 | 46.7, 1.87 | 50 | 0.130, 0.085 | 43 | 1.53 | 0.8(+0.4/0.3) | |
| 11 +80 km s-1 cl. | 318 | 28.5, 1.14 | 80 | 0.147, 0.132 | 38 | 1.11 | 3.9(N/A1.3) | |
| 318 | 28.5, 1.14 | 19 | 0.120, 0.076 | 50 | 1.58 | 0.7(+0.3/0.4) | ||
| 12 | 308 | 24.7, 0.99 | 92 | 0.224, 0.175 | 33 | 1.28 | 2.1(+0.8/0.6) | |
| 308 | 24.7, 0.99 | 13 | 0.142, 0.094 | 13 | 1.51 | 0.9(+0.4/0.4) | ||
| 13 | 280 | 19.6, 0.78 | 84 | 0.253, 0.209 | 33 | 1.21 | 2.6(+1.3/0.7) | |
| 280 | 19.6, 0.78 | 38 | 0.113, 0.087 | 44 | 1.30 | 1.9(+0.8/0.5) | ||
| 14 +20 km s-1 cl. | 181 | 41.0, 1.64 | 34 | 0.368, 0.269 | 16 | 1.37 | 1.5(+0.7/0.4) | |
| 15 | 182 | 55.6, 2.22 | 28 | 0.184, 0.138 | 27 | 1.33 | 1.9(+0.6/0.7) | |
| 16 | 184 | 81.6, 3.26 | 32 | 0.244, 0.197 | 17 | 1.24 | 2.4(+1.0/0.7) |
Appendix B 1667 MHz OH-absorption
Appendix C at 1667 MHz
Appendix D 1665 MHz OH-absorption
Appendix E at 1665 MHz
Appendix F HO in the OH-streamer/+80 km s-1 cloud/CND SW shock region
To further investigate the proposed shock region towards the SW part of the CND, we have used the satellite to observe the water isotope, HO, which is tracer of shock (or strong UV) regions (Karlsson et al. kar13 (2013)). The observations were performed towards the position (RA, Dec) of (J2000.0) during April 2013 and April 2014. The total ON-source integration time of the combined data was 62.5 hours. An HO profile was also obtained towards the same position in February 2013, with a total ON-source integration time of 9.4 hours. ’s HPBW at the H2O frequencies is 21. The profiles are shown in Fig. 26, together with C18O and profiles obtained with SEST. We refer to Karlsson et al. (kar13 (2013)) for a detailed description of and SEST observations and analysis of the Sgr A complex region. Here we simply present our new results and their interpretation.
The HO profile shows a remarkably wide absorption component at positive velocities, in addition to the well-known expanding molecular ring (EMR) and 3-kpc Arm features near and km s-1, respectively. This positive-velocity region covers the velocity range of the interacting components discussed in the main part of the paper, viz. the OH-Streamer, the +80 km s-1 cloud and the +20 km s-1 cloud/SS. We obtain a total column density of the order of (HO) cm-2, which corresponds to (HO) , assuming a HO/HO abundance ratio of 250 in the inner Galactic centre (Wilson & Rood wil94 (1994)). From our two C18O lines we obtain, in the same region and velocity interval, a molecular hydrogen column density of (H2) cm-2, assuming a C18O/H2 abundance ratio of (Goldsmith gol99 (1999)). These values result in an abundance ratio [o-H2O/H2] = (o-H2O) . Such a high abundance ratio of H2O is comparable to what is found in, for example, the low-velocity outflow region of Orion (Persson et al. per07 (2007)), where it has been interpreted as desorption of water ice from dust grains due to shock effects.
