Identification of a Class of Low-Mass Asymptotic Giant Branch Stars Struggling to Become Carbon Stars in the Magellanic Clouds
Abstract
We have identified a new class of Asymptotic Giant Branch (AGB) stars in the Small and Large Magellanic Clouds (SMC/LMC) using optical to infrared photometry, lightcurves, and optical spectroscopy. The strong dust production and long-period pulsations of these stars indicate that they are at the very end of their AGB evolution. Period-mass-radius relations for the fundamental-mode pulsators give median current stellar masses of in the LMC and in the SMC (with dispersions of 0.21 and 0.18 , respectively), and models suggest initial masses of 1.5 and 1.25 , respectively. This new class of stars includes both O-rich and C-rich chemistries, placing the limit where dredge-up allows carbon star production below these masses. A high fraction of the brightest among them should show S star characteristics indicative of atmospheric C/O 1, and many will form O-rich dust prior to their C-rich phase. These stars can be separated from their less-evolved counterparts by their characteristically red colors.
1. INTRODUCTION
1.1. Asymptotic Giant Branch Stars
Thermally-pulsing Asymptotic Giant Branch (TP-AGB) stars contribute substantially to the rest-frame near-infrared (NIR) luminosities (Maraston et al., 2006; Melbourne et al., 2012; Melbourne & Boyer, 2013) and to the dust budgets of galaxies (e.g., Zhukovska & Henning, 2013; Schneider et al., 2014; McKinnon et al., 2015). The Magellanic Clouds are excellent galaxies for investigating the global effects of TP-AGB stars because they are very nearby (65 kpc), sufficiently massive (0.5–1.5), and have high star-formation rates at epochs required to form TP-AGB populations in the present day (McConnachie, 2012, and references therein). The TP-AGB stars in both the Large and Small Magellanic Clouds (LMC/SMC) are therefore extensively studied. In Boyer et al. (2011) (hereafter B11), we compiled a catalog of TP-AGB stars in the MCs using photometry from visible, NIR, and IR surveys and noted a distinct population of TP-AGB stars with 8-µm excesses that separated from the bulk TP-AGB population in color. We dubbed these the anomalous oxygen-rich (aO)-AGB stars. In this work, we investigate the nature of these stars using additional multi-wavelength and time series data.
Before the onset of thermal pulses, stars in the AGB evolutionary stage are oxygen-rich and their optical to NIR spectra are dominated by O-rich molecules such as TiO, VO, and H2O. Once thermal pulsing begins, newly-synthesized elements are dredged-up to the surface. In intermediate-mass TP-AGB stars, the dredged-up material includes carbon, which quickly pairs with free oxygen to make CO molecules. If the dredge-up is efficient enough, the ratio of carbon to oxygen exceeds unity and the excess carbon is free to form carbon-rich molecules such as CN and C2. Stellar evolution models (e.g., Karakas et al., 2002; Marigo et al., 2008, 2013) predict a higher dredge-up efficiency as metallicity decreases. This, combined with less free oxygen, results in the rapid formation of C stars with fewer dredge-up events. Carbon stars are therefore more easily formed in metal-poor environments.
Whether a star remains O-rich or becomes C-rich has drastic consequences for its subsequent evolution, perhaps affecting the chemical evolution of its host galaxy. C-rich TP-AGB stars (C-AGB) easily form dust and quickly develop strong, radiation-driven winds. O-rich TP-AGB stars (O-AGB) can also exhibit large mass-loss rates, but in galaxies like the Magellanic Clouds, it is the C-rich stars that currently dominate the stellar dust production despite having much smaller numbers than their O-rich counterparts (Matsuura et al., 2009; Srinivasan et al., 2009; Boyer et al., 2012; Riebel et al., 2012). The aO-AGB stars identified in B11 show IR colors intermediate to the O-AGB and C-AGB population, and their nature was therefore unclear.
1.2. Photometric Classifications of TP-AGB stars
O- and C-rich molecular absorption features are strong at optical and NIR wavelengths, causing the colors of C-AGB and O-AGB stars to be drastically different in NIR photometry with commonly used filters. Several works (e.g., Cioni et al., 2006) have shown that O-AGB stars exhibit mag, extending along a mostly vertical sequence in Figure 1, upwards from the tip of the Red Giant Branch (TRGB). C-rich stars follow a more horizontal sequence in Figure 1, reaching mag, though very dusty or very cool O-AGB stars (such as OH/IR stars and metal-rich stars, e.g.; van Loon et al., 1998; Boyer et al., 2013) can also show these red colors. These molecular features therefore make NIR photometry an effective, if imperfect, tool for separating C-AGB and O-AGB stars when spectra are not available.
NIR data from the Two-Micron All-sky Survey (2MASS; Skrutskie et al., 2006) for the Small and Large Magellanic Clouds (SMC/LMC) show this clear separation between the two types of AGB stars in color (e.g., Cioni et al., 2006; Blum et al., 2006; Boyer et al., 2011). However, B11 found that, when combined with 8 µm photometry, a third group of stars distinguishes itself from both the C-AGB and O-AGB stars by showing colors that are redder than the O-AGB stars and bluer than the C-AGB stars (Fig. 1). More than 95% of these stars are classified as O-rich based on the NIR photometric criteria from Cioni et al. (2006), so we dubbed them anomalous O-rich AGB stars (aO-AGB).


In B11, we put forth three possible explanations for the seemingly anomalous colors of the aO-AGB stars. First, they may be a subset of the O-AGB stars that have formed, or are just beginning to form, dust in their circumstellar envelopes. Second, these stars may be a subset of O-AGB stars with particularly strong and/or broad silicate emission, enhancing their 8-µm flux. A third possibility is that the aO-AGB stars are S-type AGB stars, which are transitioning from O-rich to C-rich as they evolve. It is impossible to discern whether one of these scenarios is correct with only optical to mid-IR photometry. Indeed, we cannot even be sure that the aO-AGB stars are truly O-rich without additional information.
In this work, we bring together optical spectroscopy, optical to mid-IR photometry, and optical pulsation information to characterize the aO-AGB stars with respect to the other O-AGB and C-AGB stars. One finding, discussed in Section 2.3.1, is that the aO-AGB stars are not, in fact, all O-rich. We therefore do not wish to propagate this potentially confusing nomenclature and will instead refer to the aO-AGB stars simply as a-AGB stars. While the name has changed, we emphasize that the a-AGB stars are photometrically classified with a scheme identical to the aO-AGB classification scheme described by B11 (Section 2.1.1).
With the rich data set compiled here, we compare the chemistry (Section 3.1), pulsation (Section 3.2), stellar parameters (Section 3.3), and dust-production (Section 3.4) of the a-AGB stars to the rest of the Magellanic Cloud TP-AGB stars. All evidence suggests that the a-AGB stars are low-mass stars at the very end of their evolution. In Section 4, we compare the results to existing empirical mass-loss models and to stellar evolution models, and we suggest a refinement of the canonical TP-AGB classification scheme.
| Catalog | filter | Resolution | Refs. |
|---|---|---|---|
| (µm or band) | (″/pix) | ||
| 2MASS | 1.2, 1.6, 2.2 | 1″ | 1 |
| SAGE | 3.6, 4.5, 5.8, 8.0, 24 | 122–24 | 2,3 |
| WISE | 3.4, 4.6, 12, 22 | 61-120 | 4 |
| AKARI | 3.2, 4.1, 7, 11, 15, 24 | 29–28 | 5,6 |
| MCPS | 0.37 (U),0.44 (B) | 12–18 | 7 |
| 0.55 (V),0.81 (I) | 12–18 | 7 |
2. Data & Source Classification
Table 2 summarizes the final source counts used in our analysis, classified as described in this section.
| Photometric Class | ||||
|---|---|---|---|---|
| O-AGB | C-AGB | x-AGB | a-AGB | |
| SMC: | ||||
| Total | 2453 | 1708 | 349 | 1266 |
| O-rich spectrum | 100 | |||
| C-rich spectrum | 122 | |||
| S-type spectrum | 23 | |||
| Unknown spectrum | 28 | |||
| No Spectrum | 2453 | 1708 | 349 | 993 |
| In OGLE-III | 1784 | 1459 | 229 | 1006 |
| LMC: | ||||
| Total | 10 810 | 6184 | 1389 | 6342 |
| O-rich spectrum | 1041 | 44 | 4 | 419 |
| C-rich spectrum | 87 | 1501 | 112 | 122 |
| Unknown spectrum | 20 | 23 | 142 | 7 |
| No spectrum | 9662 | 4616 | 1131 | 5794 |
| In OGLE-III | 7445 | 4538 | 710 | 4939 |
Note. — These are the source counts and classifications included in our analysis. The columns represent the photometric classifications, the rows indicate spectral classifications and whether a source is included in the OGLE-III spatial coverage. The LMC numbers exclude the kinematically-distinct population (Section 2.3).
2.1. Photometry
We use the photometry databases compiled by the Surveying the Agents of Galaxy Evolution (SAGE) Legacy programs (Meixner et al., 2006; Gordon et al., 2011), which includes photometry from the Magellanic Clouds Photometric Survey (MCPS, ; Zaritsky et al., 2002), 2MASS (; Skrutskie et al., 2006), and Spitzer (3.6, 4.5, 5.8, 8.0, and 24 µm) photometry. To this, we add available archival and literature photometry from the Wide-Field Infrared Survey Explorer (WISE: 3.4, 4.6, 11.6, and 22 µm; Wright et al., 2010) and the AKARI targeted surveys of the SMC and LMC (3.2, 4.1, 7, 11, 15, and 24 µm; Ita et al., 2010; Kato et al., 2012). Table 1.2 summarizes the photometric data used in this study.
The galaxies were covered by Spitzer twice, 3 months apart. The photometry used here is derived by combining these two epochs into a single, co-added stack. The magnitudes are therefore a flux average between the two epochs, making them less susceptible to stellar pulsations. All magnitudes are corrected for foreground extinction using the same parameters listed in Table 1 from B11 and the wavelength dependence derived by Indebetouw et al. (2005).
2.1.1 Photometric Classification
A detailed description of the selection criteria for TP-AGB stars is discussed by B11, and we use identical classifications in this work. In brief, the NIR vs. color-magnitude diagram (CMD; Fig. 1) is used to initially separate the C-AGB and O-AGB stars, following Cioni et al. (2006). We also classify “extreme” dusty AGB stars (x-AGB) as those with mag or mag. Many studies indicate that the majority of the x-AGB stars in the MCs are C-rich (Woods et al., 2011; van Loon et al., 2008; Blum et al., 2014; Ruffle et al., 2015), though obscured O-rich stars can also reach very red colors (e.g., the LMC OH/IR star IRAS 052986957; Wood et al., 1992; van Loon et al., 2001). We emphasize that this classification scheme includes only stars that are brighter than the 3.6 µm TRGB, which is dominated by AGB stars undergoing thermal pulsations; we do not include the fainter, less evolved early-AGB stars since these are difficult to distinguish from red giant branch stars. Hereafter, we use the term AGB interchangeably with TP-AGB.
The a-AGB stars are isolated from the initial NIR-selected C- and O-AGB populations based on their position in the vs. CMD (Fig. 1). Specifically, the a-AGB sample includes O-AGB stars redder in than the line described by eq. 3 in B11:
| (1) |
with , and C-AGB stars bluer than the same line with . The LMC includes 6000 a-AGB stars, and they comprise 26% of the entire LMC TP-AGB population. In the SMC, there are 1200 a-AGB stars, and they account for a slightly smaller fraction of the SMC’s TP-AGB population (21%).
These photometric classification are not precise, and there is a small amount of cross-contamination between each class of stars. We also stress that the a-AGB and x-AGB classes are defined purely by the photometric colors; both classes can contain both O-rich and C-rich AGB stars. In Section 2.3.1, we compare the photometric classifications to spectral classifications.
2.2. Variability
To investigate the pulsation properties of the AGB stars, we include data from the Optical Gravitational Lensing Experiment (OGLE-III; Soszyński et al., 2008) surveys of the Magellanic Clouds. The OGLE survey monitored the MCs in the -band for approximately 8 years, covered the stellar bars in both galaxies, and derived periods and amplitudes for every variable star.

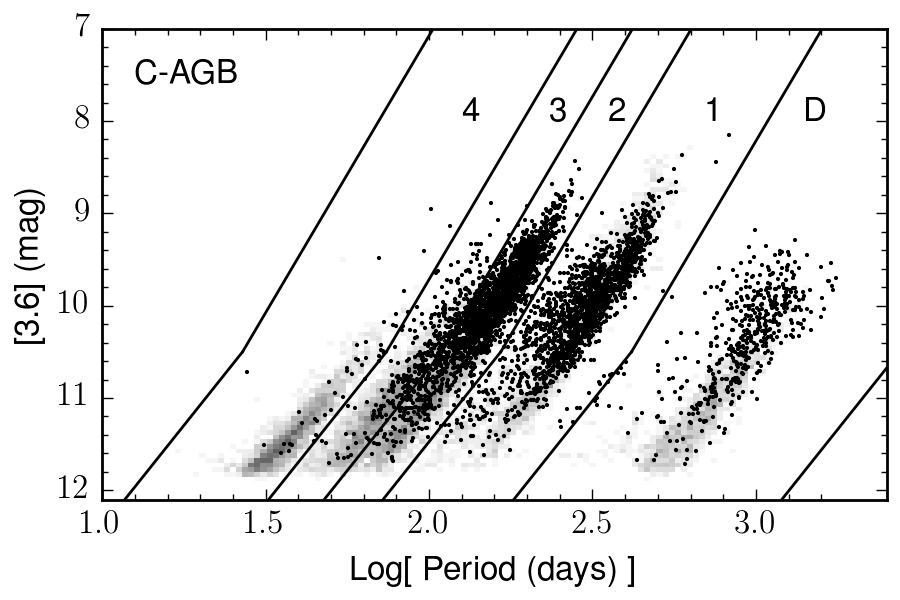
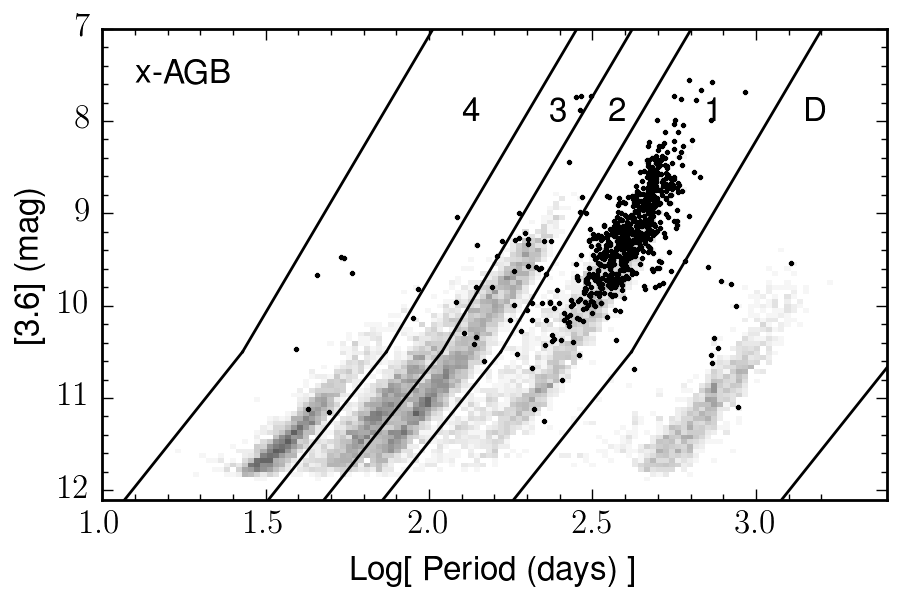
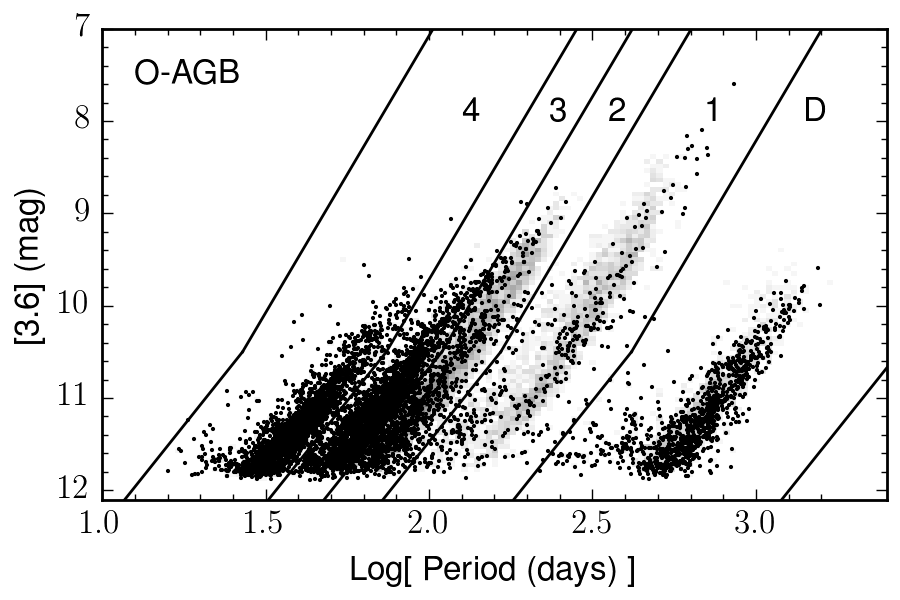
The 3.6 µm period-luminosity (-) relationship for the LMC is shown in Figure 2. The sequences first described by Wood et al. (1999) and further subdivided by Ita et al. (2004) are clearly evident. We adopt the Fraser et al. (2005) numbering scheme: sequences 1–4 describe an evolutionary sequence, with stars evolving to longer periods and brighter magnitudes as they age. Stars on Sequence 1 are pulsating in the fundamental mode and higher overtone pulsators occupy Sequences 2–4. Stars on the upper end of Sequence 1 are often called Mira variables after the prototype Mira, Ceti. The cause of the long secondary periods in stars on Sequence D is unknown, but might have to do with binarity, nonradial pulsation, or nonspherical geometry (e.g., Wood & Nicholls, 2009). Here, we assign stars to each sequence based on the lines drawn in Figure 2, with a shift to fainter absolute 3.6-µm magnitudes in the SMC to account for the difference in distance.
| Galaxy | Instrument | Date | ||
|---|---|---|---|---|
| SMC | AAOmega/2dF | 4225–4975Å | 3700 | Sep 2011 |
| SMC | AAOmega/2dF | 6325–6775Å | 8000 | Sep 2011 |
| LMC | Hydra-CTIOaa See Olsen et al. (2011) for a detailed description of the Hydra-CTIO observations and data reduction. | 6850–9150Å | 7000 | Nov 2007 |
2.3. Spectra
We obtained medium-resolution optical spectra of 273 randomly selected a-AGB stars in the SMC bar using the AAOmega/2dF multi-object spectrograph (Lewis et al., 2002; Saunders et al., 2004; Sharp et al., 2006) on the Anglo-Australian Telescope. The total exposure time was 3 hr, and reductions were carried out with the 2dF pipeline (2dFdr, version 4.66, 2011 October). Medium-resolution optical spectra for AGB stars in the LMC were obtained from 2007 November 20–26 at the CTIO 4 m Blanco telescope with the Hydra-CTIO multi-fiber spectrograph (Barden & Ingerson, 1998). The LMC sample comprises 3791 AGB stars in both the stellar bar and the disk. See Olsen et al. (2011) for a detailed description of the observations and data reductions. Olsen et al. (2011) used the LMC spectra to identify a kinematically- and chemically-distinct population of stars among the LMC sample. They concluded that this distinct population was accreted from the SMC during a close passage between the clouds. We exclude this accreted population from the analysis in this paper; 3522 AGB stars, including 548 a-AGB stars, remain in our sample (Table 2).
Spectroscopic data are summarized in Table 3. Figure 3 shows the map of the a-AGB spectra in both galaxies, classified as described in the next section.
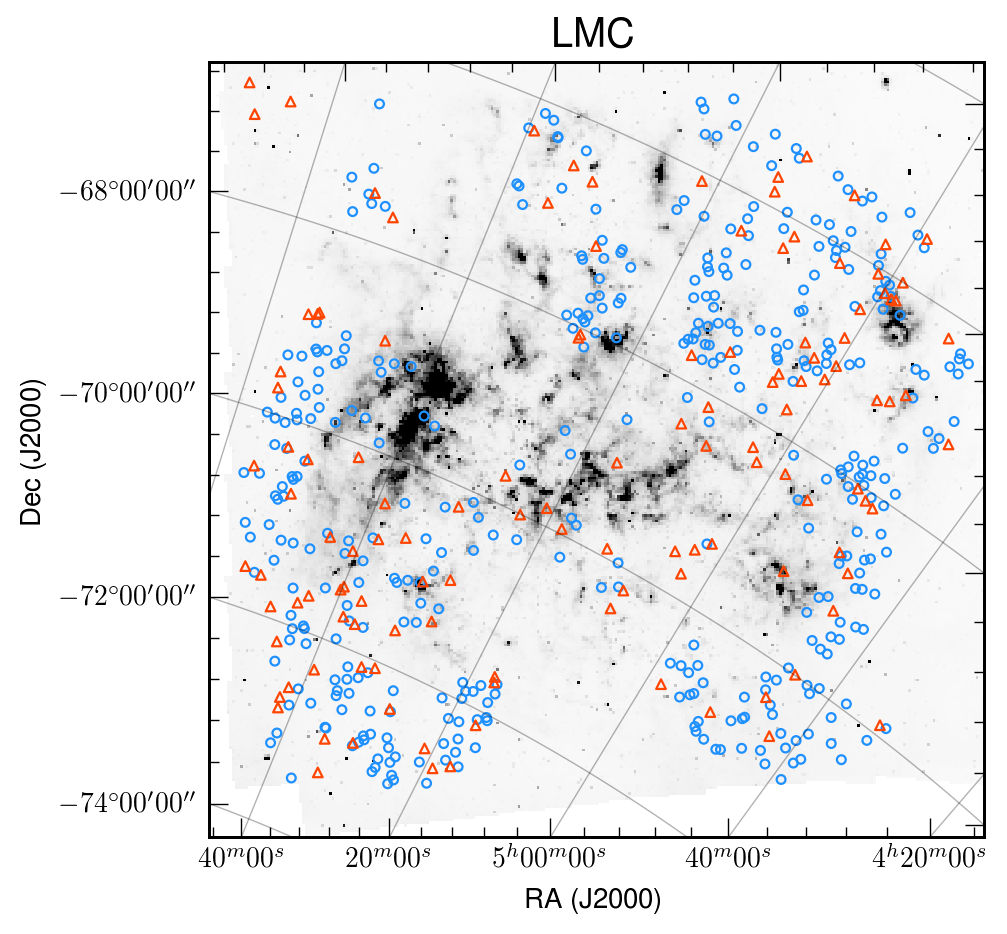
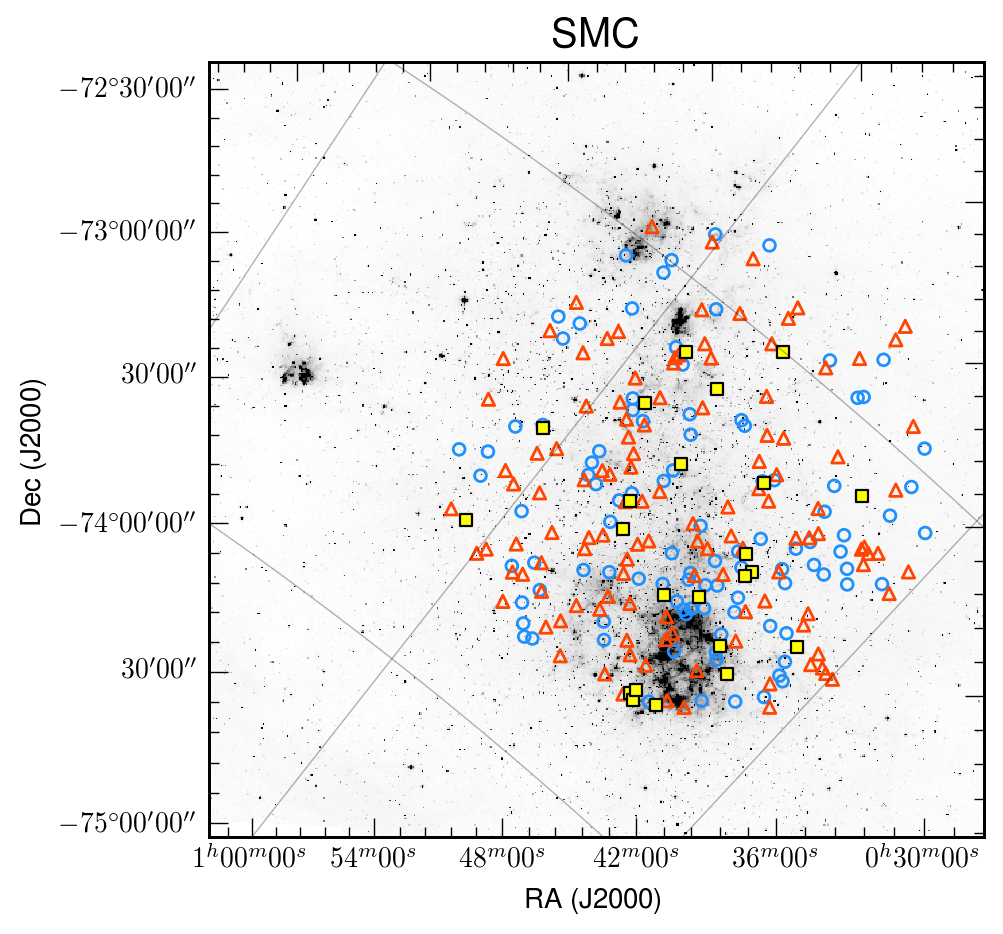
2.3.1 Spectral Classification
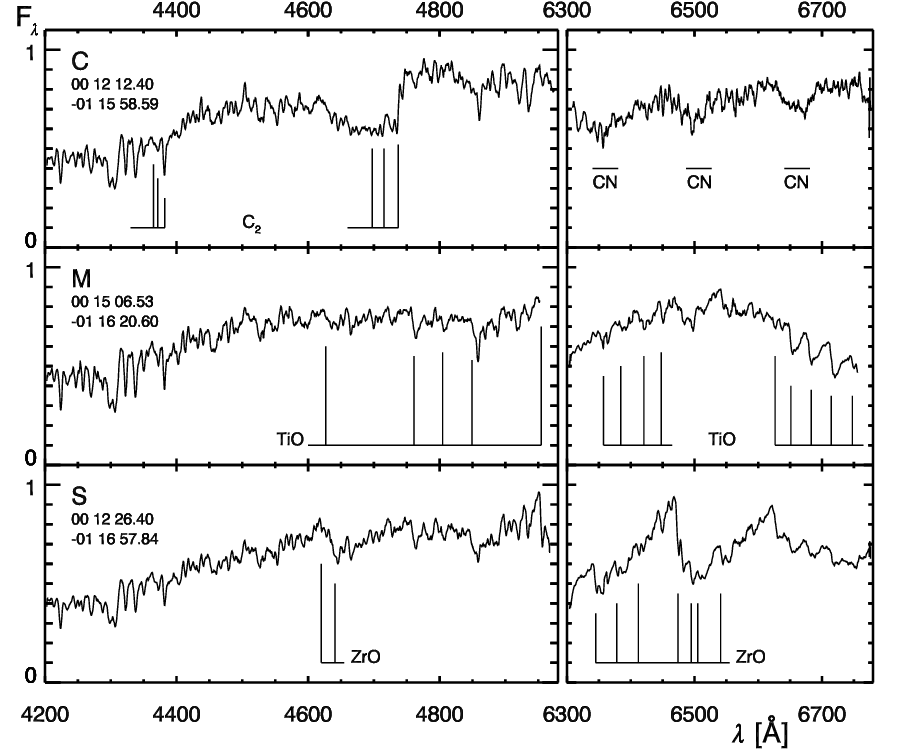
The AAOmega/2dF spectra (SMC; a-AGB stars only) are classified by eye as C (C-rich) or M (O-rich) stars based on the presence of C2CN or TiO, respectively (Fig. 4). S-type AGB stars are identified by the presence of ZrO. This classification scheme results in 122 C stars, 100 M stars, 23 S stars, and 28 unknown sources (Table 2). We list the SMC S stars in Table 4.
| Designation | [3.6] | [8.0] | Period | |
|---|---|---|---|---|
| (SSTISAGEMA) | (mag) | (mag) | (d) | |
| 1 | J004234.17-725300.6 | 11.290.01 | 10.920.03 | |
| 2 | J004428.44-730927.9 | 11.780.02 | 11.700.02 | 80 |
| 3 | J004526.04-721432.9 | 11.660.03 | 11.390.03 | |
| 4 | J004547.21-730535.0 | 11.310.01 | 11.180.01 | 110 |
| 5 | J004618.11-732652.4 | 12.440.02 | 12.200.05 | 401 |
| 6 | J004712.99-724637.6 | 11.380.01 | 11.030.02 | 653 |
| 7 | J004721.34-724834.3 | 11.650.01 | 11.450.02 | 91 |
| 8 | J004731.02-732942.6 | 11.200.01 | 11.040.02 | 165 |
| 9 | J004745.83-732719.6 | 11.510.01 | 11.330.02 | 95 |
| 10 | J004755.46-732855.3 | 11.420.01 | 11.360.02 | 82 |
| 11 | J004808.00-724406.3 | 11.650.01 | 11.450.02 | 685 |
| 12 | J004833.34-725953.1 | 11.620.02 | 11.380.02 | 88 |
| 13 | J004955.64-722755.3 | 11.700.03 | 11.490.04 | 89 |
| 14 | J005005.38-730500.1 | 11.850.01 | 11.650.02 | 116 |
| 15 | J005342.03-720007.5 | 11.860.03 | 11.730.04 | 99 |
| 16 | J005404.72-723727.8 | 11.370.01 | 11.270.02 | 89 |
| 17 | J005418.85-725905.5 | 11.370.02 | 11.250.02 | 105 |
| 18 | J005458.13-725233.2 | 11.900.02 | 11.670.02 | 659 |
| 19 | J005510.79-721734.0 | 11.440.01 | 11.330.02 | 109 |
| 20 | J005744.57-721509.1 | 10.660.01 | 10.520.02 | 123 |
| 21 | J005746.46-723130.4 | 11.760.01 | 11.580.02 | 93 |
| 22 | J010119.74-725149.3 | 11.620.02 | 11.440.02 | 606 |
| 23 | J010133.86-732135.8 | 11.610.03 | 11.410.04 | 92 |
Note. — The full photometric catalog is available online, including from MCPS, from 2MASS, and IRAC and MIPS magnitudes from SAGE (see Table 1.2 for references). The OGLE-III periods and amplitudes are also included in the online version.
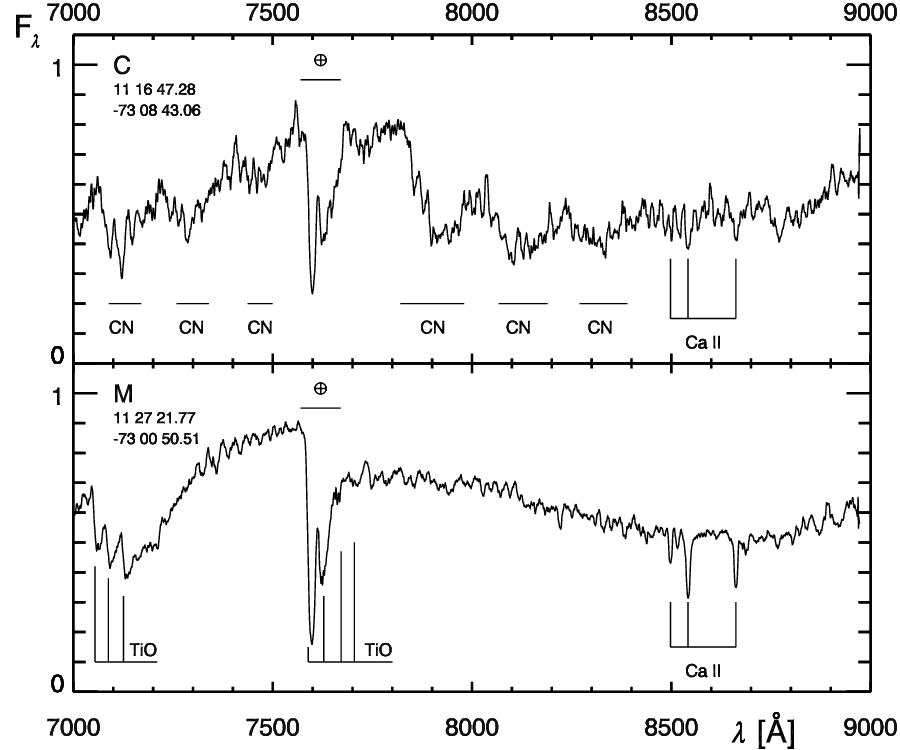
The Hydra-CTIO spectra (LMC AGB stars only) are classified by computing band-strength indices covering TiO and CN to measure the strength of these spectral features (Fig. 5; Table 5). We calculate the index for each feature as follows:
| (2) |
where and are the normalized flux in the continuum and band ranges, respectively (Table 5). The only S-type molecular features present in the wavelength region covered by the CTIO spectra are due to LaO at 7385Å and 7406Å, but these features are weak and cannot be reliably identified in this sample. We are thus limited to classifying the LMC stars as either C-rich () or O-rich (). We classify sources with as C-rich and sources with and as O-rich. Figure 6 shows the classification of the LMC spectra compared to the photometric classifications from B11 (Sect. 2.1.1). The B11 photometric classifications agree with the spectral classifications for 96% of the C-AGB stars and 91% of the O-AGB stars (see Table 2).
There are 118 spectra that do not meet one of the spectral index criteria described above, and we classify these by eye (i.e., those in the white areas of Fig. 6 – note that some fall outside of the plotted range). We also visually inspect and, if necessary, adjust the classification for the stars with a spectroscopic index that disagrees with the photometric classification (see Fig. 6), which included 55 and 206 photometrically classified O-AGB and C-AGB stars, respectively.
The x-AGB stars are faint in the optical, resulting in noisy spectra that make spectral index analysis difficult. We therefore check by eye, and revise if necessary, the spectral classification of all x-AGB stars. We are able to identify carbon or oxygen molecular features in 116 of the 258 x-AGB stars in the sample. All but four of these 116 are C-rich; the O-rich x-AGB stars include SSTISAGEMA J045414.27684413.9, SSTISAGEMA J051333.64683644.4, SSTISAGEMA J052710.19693626.9 (WOH G339), and SSTISAGEMA J044525.22704648.3. The first of these is a known O-rich Mira variable, with strong 10-µm silicate emission (alternate identifications: LI-LMC 153, SP77 30-6, and IRAS 04544-6849; Loup et al., 1997; van Loon et al., 1999; Dijkstra et al., 2005). WOH G339 is also known to show weak silicate emission (Sloan et al., 2008).
| Feature | Band | Continuum |
|---|---|---|
| (Å) | (Å) | |
| TiO-1 | 7051—7057 | 7014—7051 |
| TiO-2 | 7122—7128 | 7014—7051 |
| TiO-3 | 7700—7750 | 7480—7530 |
| CN-1 | 7250—7300 | 7215—7240 |
| CN-2 | 7860—7920 | 7800—7845 |

3. Analysis: Properties of a-AGB Stars
In this section, we summarize the observable properties of a-AGB stars.

3.1. Chemistry
Table 2 summarizes the spectral classifications of the a-AGB stars. In the LMC, 76% of the a-AGB spectra are O-rich, and this fraction decreases to 45% in the SMC (including M and S stars). In Figure 7, we show the histogram of a-AGB stars in . In both galaxies, a-AGB stars are equally likely to be C-rich or O-rich at red colors ( mag in the LMC and 1.55 mag in the SMC), and O-rich stars dominate at bluer colors, though to a lesser degree in the SMC.
The high fraction of C-rich stars among the a-AGB sample indicates that caution is necessary when using the standard color method to separate O-rich and C-rich stars. Although the spectra indicate that only about half of the a-AGB stars are O-rich in the SMC, more than 96% of them would classify as O-rich with the color cuts suggested by Cioni et al. (2006). The exact placement of these cuts also varies depending on the chosen foreground extinction correction and the assumed metallicity of the galaxy, and slight shifts result in potentially large uncertainties in the C/M ratio. By assuming that all a-AGB stars are O-rich, B11 found C/M ratios of 0.56 in the SMC and 0.42 in the LMC. After correcting for the fraction of a-AGB stars that are spectrally classified here as C-rich, we find revised C/M ratios of 0.87 and 0.56, respectively. Relying on the color is therefore not ideal for separating C and M stars.
Between M and C stars lie the S-type stars; as an AGB star evolves, carbon and s-process elements are dredged up to the surface. As C/O in the stellar envelope approaches unity, TiO bands in M stars begin to disappear in favor of ZrO bands, which are prominent in S-type AGB stars (though C/O can be near unity even in the absence of ZrO bands). As more carbon is dredged up, free oxygen is tied up into CO and carbon molecules dominate the stellar spectrum. ZrO features are prominent in two types of S stars: intrinsic and extrinsic. Intrinsic S stars follow the evolution sequence just mentioned. Extrinsic S stars are enriched in carbon and s-process elements through accretion from a binary companion that has already finished its AGB evolution. Extrinsic S stars are less evolved than intrinsic S stars, and are usually found on the RGB or among early-AGB stars that have not yet begun to thermally pulse. To identify intrinsic S stars, studies rely on (1) the presence of technetium, which will have decayed in the time since the mass transfer episode that created the extrinsic S star (e.g., Jorissen, 2003), (2) infrared colors that indicate the presence of dust, which cannot form in less-evolved RGB and E-AGB stars (e.g., Groenewegen, 1993; Jorissen et al., 1993; Otto et al., 2011), and (3) high luminosities that are characteristic of thermally-pulsing AGB stars (e.g., Guandalini & Busso, 2008).
Yang et al. (2006) identified Galactic intrinsic and extrinsic S-type AGB stars based on their IR colors. B11 noted that the colors of the a-AGB stars are consistent with the Yang et al. (2006) extrinsic S stars, but without spectroscopy, we could not confirm or rule out the presence of S stars among the a-AGB sample. Here, we find ZrO features in the spectra of only 9% of our SMC sample of a-AGB stars, so an S-type nature cannot explain the red colors of the entire a-AGB population. Moreover, despite their similar colors to Galactic extrinsic S stars, the S stars detected here are likely to be intrinsic because their luminosities (Section 3.3) and pulsation properties (Section 3.2) are consistent with AGB stars undergoing thermal pulses. The overlap in color between the a-AGB stars and the Yang et al. (2006) extrinsic sample suggests that IR colors may not be a reliable way to separate intrinsic and extrinsic S stars.
| AGB | Seq. 4 | Seq. 3 | Seq. 2 | Seq. 1 | Seq. D |
|---|---|---|---|---|---|
| class | N (%) | N (%) | N (%) | N (%) | N (%) |
| – Photometric Classifications – | |||||
| LMC | |||||
| a | 213 (4) | 448 (9) | 2135 (43) | 1140 (23) | 1003 (20) |
| O | 2756 (37) | 2248 (30) | 1066 (14) | 373 (5) | 1002 (13) |
| C | 41 (1) | 297 (7) | 2096 (46) | 1634 (36) | 470 (10) |
| x | 9 (1) | 10 (1) | 23 (3) | 656 (92) | 12 (2) |
| SMC | |||||
| a | 56 (6) | 118 (12) | 317 (32) | 160 (16) | 355 (35) |
| O | 566 (32) | 443 (25) | 224 (13) | 103 (6) | 448 (25) |
| C | 7 (1) | 53 (4) | 588 (40) | 603 (41) | 208 (14) |
| x | 0 (0) | 2 (1) | 4 (2) | 219 (96) | 2 (1) |
| – Spectral Classifications; a-AGB only – | |||||
| LMC | |||||
| O | 6 (3) | 15 (6) | 99 (43) | 63 (27) | 48 (21) |
| C | 7 (9) | 19 (25) | 19 (25) | 11 (15) | 19 (25) |
| SMC | |||||
| O | 5 (6) | 5 (6) | 29 (32) | 9 (10) | 42 (47) |
| C | 14 (13) | 28 (26) | 24 (22) | 13 (12) | 29 (27) |
| S | 0 (0) | 1 (6) | 12 (57) | 3 (14) | 5 (24) |
Note. — Position of AGB stars on the 3.6 µm P-L diagram. The percentage of the total population of a particular subtype is shown in parentheses. For example, 213 of 4939 a-AGB stars (4%) are found on Sequence 4 in the LMC (see Table 2). For an independent accounting of the pulsation sequences, see Spano et al. (2011).
3.2. Pulsation Properties
Figure 8 shows the LMC 3.6 µm - diagram for each type of (photometrically-classified) AGB star; the proportions of stars on each sequence in the SMC are similar. Table 6 shows that the a-AGB stars preferentially occupy Sequences 1, 2, and D (we discuss Sequence D stars in Section 4.4). Most a-AGB stars are classified by OGLE as semi-regular variables (SRVs), which have pulsation properties similar to Miras, but with less regular light curves and smaller -band amplitudes.
In both galaxies, the majority of the fundamental-mode pulsators (Sequence 1; those at the end of the TP-AGB phase) are photometrically classified as C-rich (either C-AGB or x-AGB). Only 9–10% of them are photometrically classified as O-rich, and 15–30% are a-AGB stars. Almost 90% of the O-AGB stars have shorter periods (Sequences 3 and 4), indicating that the O-AGB class as defined in B11 comprises mostly stars at the beginning of the TP-AGB phase.
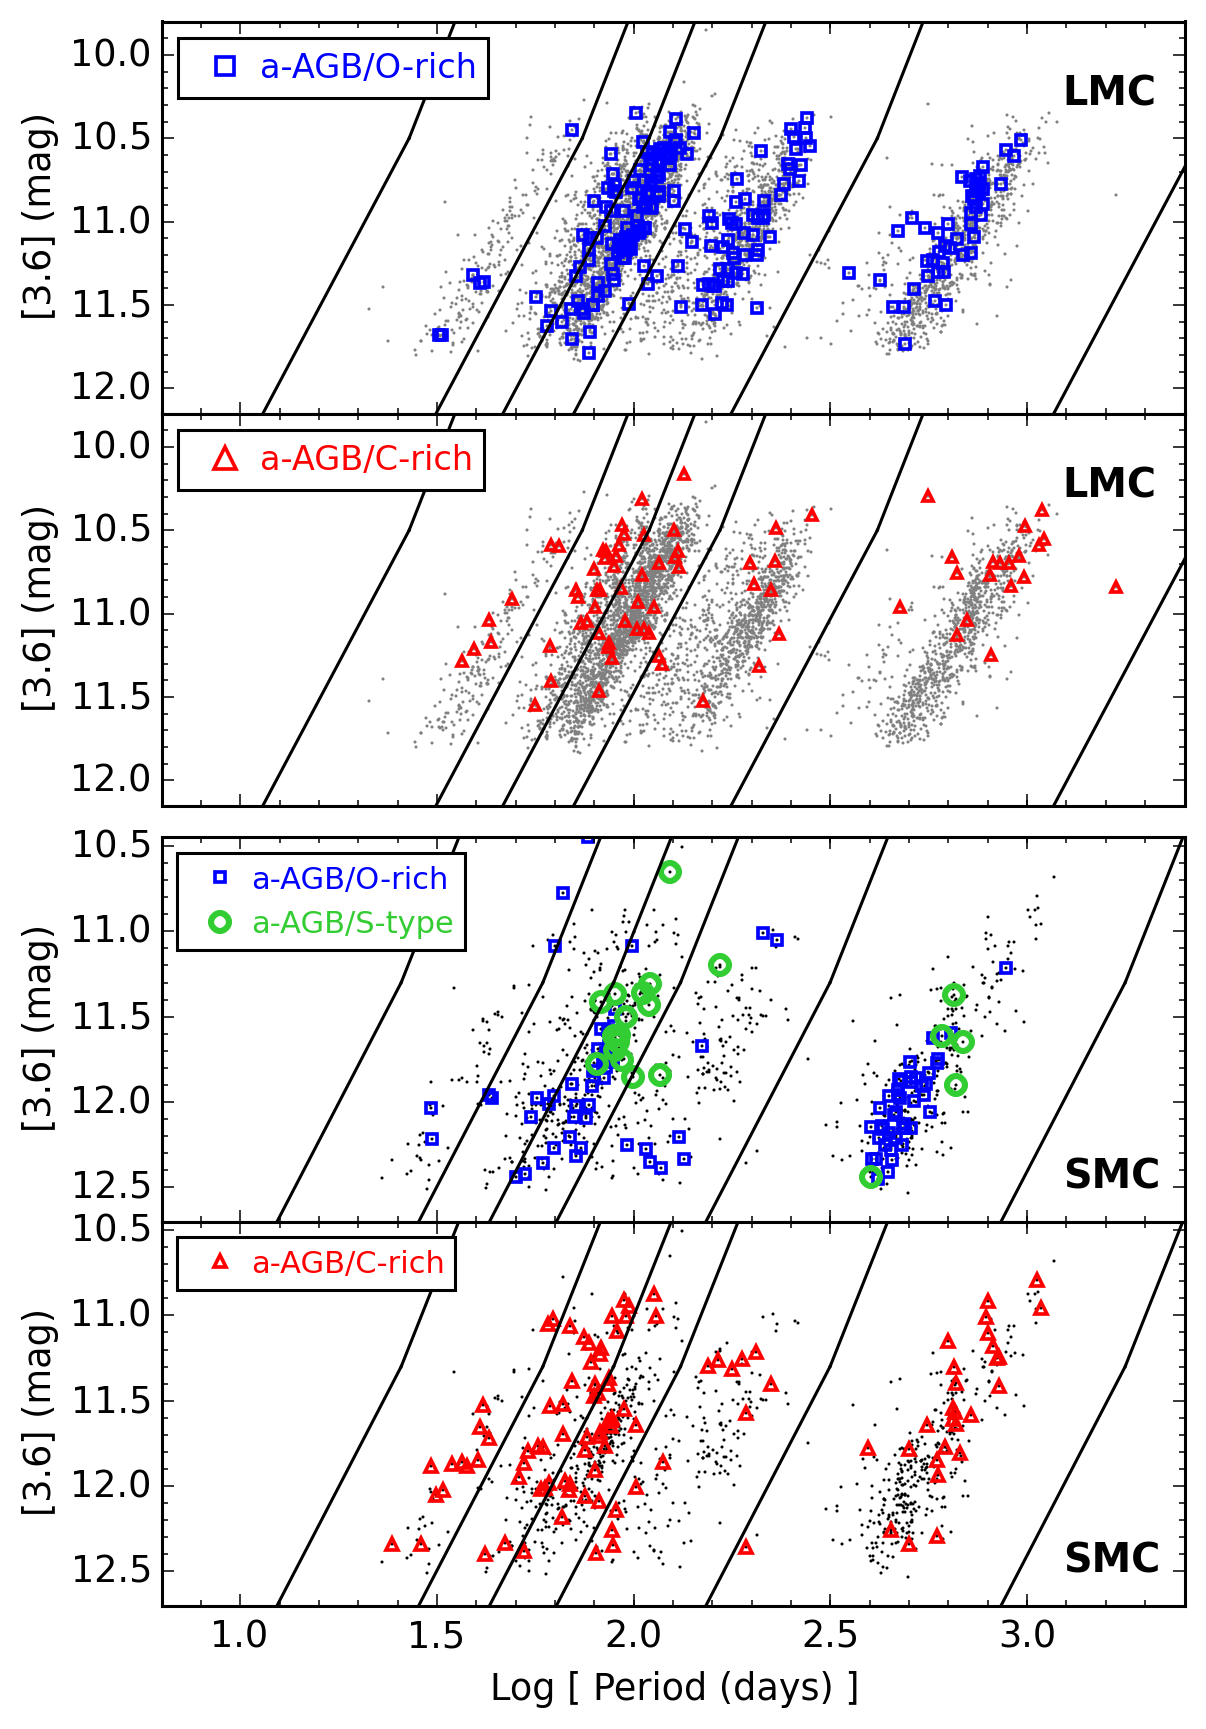
In Figure 9, we show the 3.6 µm - relationship for a-AGB stars classified via their optical spectra. In both galaxies, the O-rich a-AGB stars (with TiO or ZrO features) lie on sequences 2 and D. In the LMC, they also occupy Sequence 1. Pulsation models (Wood, 2015) show that stars move to longer periods as their luminosities increase, suggesting that many high-L a-AGB stars on Sequence 2 will evolve into C stars as they cross to Sequence 1 and that most of the O-rich a-AGB stars on Sequence 1 will remain O-rich. The absence of a-AGB stars on Sequence 1 in the SMC reflects the efficiency of this transition in metal-poor environments.
We have identified 24 S-type stars in the SMC, and 22 of them are classified as AGB stars by the OGLE-III survey (the remaining 2 fall just outside the OGLE-III spatial coverage). The OGLE light curves thus provide additional evidence that the s-process elements evident in their spectra are from the dredge-up of carbon during a thermal pulse (intrinsic S-type), and not due to mass transfer (extrinsic S-type). The clustering of these intrinsic S stars on the 3.6-µm - diagram is an intriguing clue about the dredge-up process. However, the SMC spectral sample does not include stars from the C-AGB and O-AGB photometric categories, so the frequency of S-type stars among those groups remains unknown, as does the position of any such stars on the - diagram.
3.3. Fundamental Parameters: L, , M, and [Fe/H]
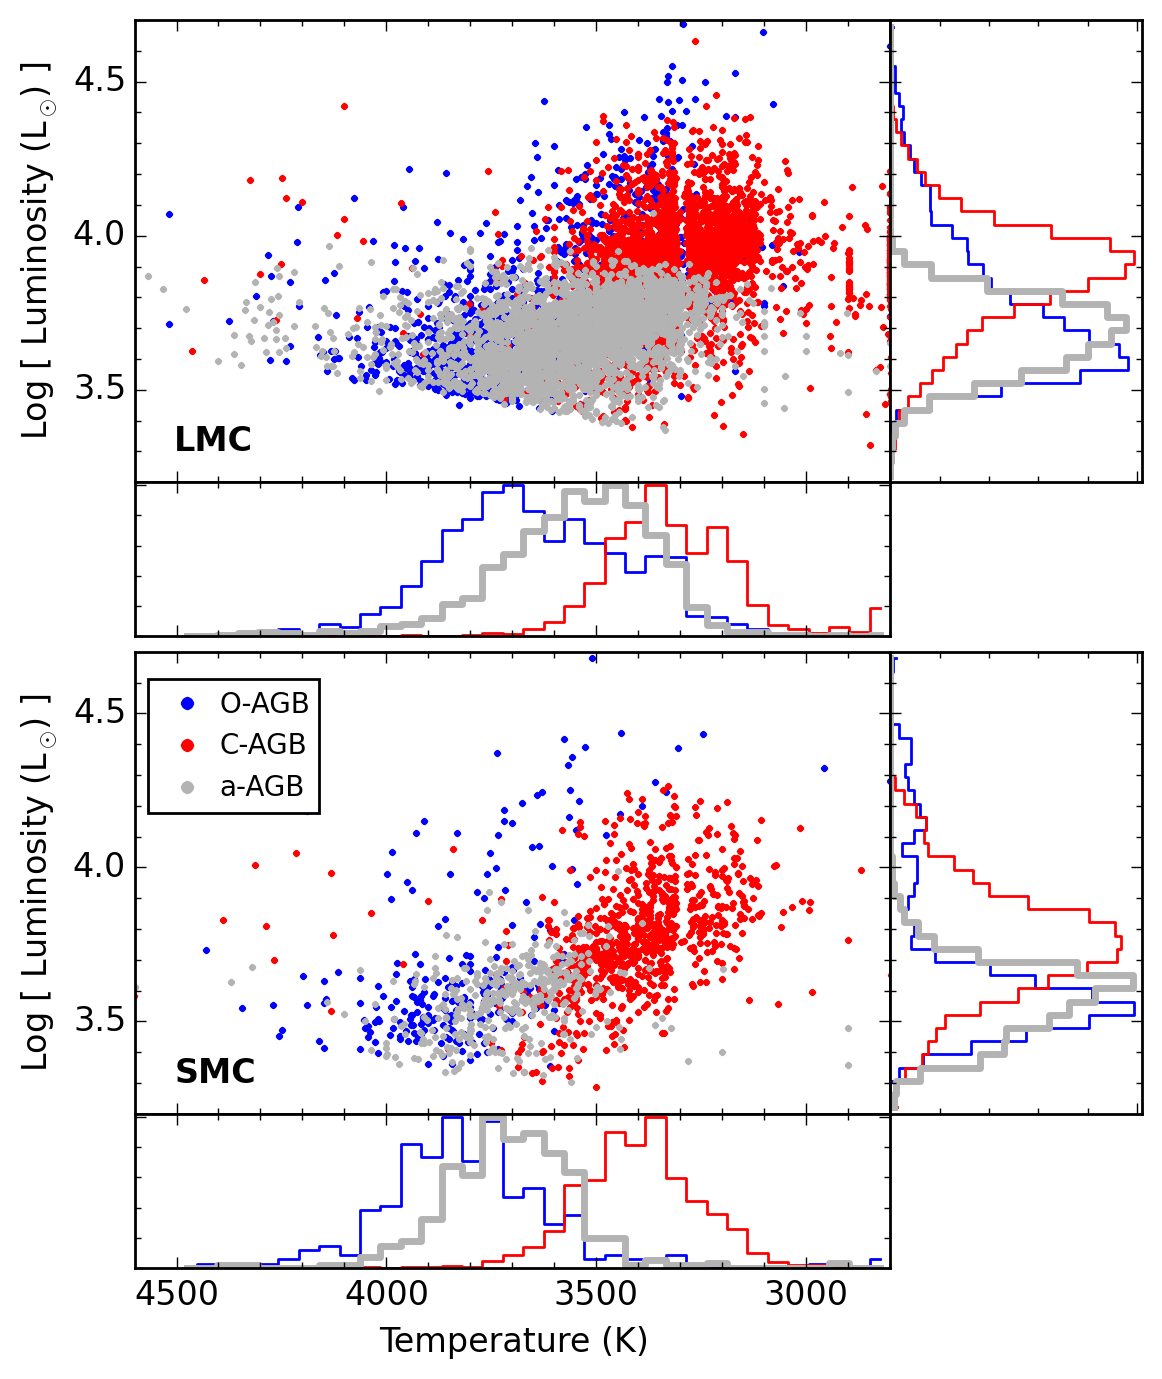
To estimate the luminosities () and effective temperatures (), we fit the spectral energy distributions (SEDs) of the AGB stars using the photometry listed in Table 1.2 and following the procedure outlined by McDonald et al. (2009, 2012). Each SED was compared to a grid of bt-settl stellar atmosphere models (Allard et al., 2011) using minimization and scaled in flux to derive a bolometric luminosity. We assume , , kpc (61 kpc), and mag (0.070 mag) for the LMC (SMC).
Uncertainties are large for stars with significant circumstellar dust since this method compares SEDs to dustless photospheres. In practice, we find that SED fits with temperatures less than 2800 K, encompassing most of the x-AGB stars, are unreliable. We therefore exclude most x-AGB stars when discussing effective temperatures, luminosities, and pulsation masses.
We show the Hertzprung-Russell diagram in Figure 10. To compare stars in a similar evolutionary phase, we include only stars on pulsation Sequences 1 and 2. In both galaxies, the a-AGB stars have temperatures and luminosities intermediate to the O-AGB and C-AGB stars. This suggests that a-AGB stars are those that are near a transition from O- to C-rich. The temperatures and luminosities of the a-AGB stars here are similar to those determined for the C-rich and S-type stars in the Hipparcos catalog using the same method (McDonald et al., 2012).
To derive the stellar masses, we rely on the period-mass-radius relationship described by Vassiliadis & Wood (1993). This relationship is valid only for stars that lie on pulsation Sequence 1 and are therefore pulsating in the fundamental mode:
| (3) |
with derived using . The mass derived from this relationship is the pulsation mass (), which reflects the current mass of the star, so small masses could either indicate a low-mass star that has undergone little mass loss or a high-mass star that has undergone substantial mass loss.
Figure 11 shows the distribution in pulsation mass for the fundamental-mode pulsators, divided by stellar type. Most stars (95%) have pulsation masses of 0.5–2.5 , in agreement with Wood (2015), and the a-AGB stars show the lowest median pulsation masses. Since the a-AGB mass-loss rates are not particularly high (see Section 3.4), we can infer that the a-AGB stars have the lowest initial masses among the stars pulsating in the fundamental mode.

Metallicities were derived using the Ca triplet by Olsen et al. (2011), including 36 a-AGB stars and 268 O-AGB stars in the LMC. Abundances were not reliably measured for any C-AGB or x-AGB stars. The median metallicity of the O-AGB population is dex, with dispersion (median absolute deviation) of 0.38 dex and a median uncertainty of 0.17 dex. The a-AGB population is more metal-poor, with a median dex, dispersion 0.36 dex, and median uncertainty 0.19 dex. The lower metallicities suggest that the a-AGB population is older, having formed earlier in the LMC’s chemical evolution history. This finding is consistent with the lower masses inferred from the pulsation. Alternatively, the a-AGB stars may have been accreted from the SMC or formed from gas accreted from the SMC.
3.4. Mass Loss and Dust Production
Fourteen of the LMC a-AGB stars were observed with Spitzer’s infrared spectrograph (IRS) from 5–16 µm as part of the SAGE-Spec program (Kemper et al., 2010). The equivalent program for the SMC does not include any a-AGB stars (Ruffle et al., 2015). Of the 14 LMC stars, four are classified by Woods et al. (2011) as Stars (their AGB nature is unconfirmed) and the remaining ten as O-rich AGB stars, nine of which show strong silicate emission at 10 µm (see Section 4.6). With only 14 examples, we cannot draw any broad conclusions about the IR spectral features in a-AGB stars, but the presence of a silicate feature in these examples demonstrates that a-AGB stars are capable of significant dust production.
Riebel et al. (2012) computed the mass-loss and dust-production rates (DPRs) for the LMC AGB stars by fitting the full optical to mid-IR SEDs to the Grid of AGB and RSG ModelS (GRAMS; Sargent et al., 2011; Srinivasan et al., 2011). The GRAMS grid includes the COMARCS stellar photospheres for C stars (Gautschy-Loidl et al., 2004) and PHOENIX models for O-rich stars (Hauschildt et al., 1999). Silicate dust or a mixture of amorphous carbonSiC were added to create a grid that reproduced the full luminosity and infrared color distribution of the LMC AGB population. We note that luminosities derived with GRAMS using a simple trapezoidal integration are systematically lower than those derived by the SED fitting (Section 3.3) by about 16% for O-rich stars and 18% for C-rich stars.
For a subset of sources, the GRAMS classification from Riebel et al. (2012) disagrees with our spectral classification. This includes 29 of the spectrally-confirmed O-rich sources that were classified by GRAMS as C-rich, and 241 of the spectrally-confirmed C-rich sources that were likewise classified as O-rich by GRAMS. GRAMS provides a best-fit O-rich and C-rich model for each star, and the GRAMS classification is assigned depending on which provides a smaller , so many misclassifications are the result of only a very slight preference for one fit over the other. Here, we assign the best-fit C- or O-rich GRAMS model that matches the spectral classification.
The GRAMS grid assumes a wind expansion velocity of km s-1, a spherical dust shell geometry, and a constant DPR throughout the AGB lifetime. The DPR scales linearly with , which itself scales with luminosity and the gas-to-dust ratio () as . To scale the GRAMS DPRs, we use different gas-to-dust ratios depending on the stellar chemistry. For O-rich stars, we assume that scales with metallicity, so for and (here we use the typically assumed LMC metallicity). For a-AGB stars, we scale according to the difference in metallicities between O-AGB and a-AGB stars discussed in Section 3.3, so . Since C stars make their own carbon, we expect their gas-to-dust ratios to be near solar, so we use .
Estimated DPRs from SED fitting are highly sensitive to the choice of dust optical constants and dust compositions, which may differ at these metallicities (e.g., McDonald et al., 2010; Jones et al., 2014). We therefore note that while the relative GRAMS-derived DPRs for different stellar types are valid, absolute DPRs are inaccurate by a factor of 4 (Groenewegen et al., 2009; Srinivasan et al., 2011; Sargent et al., 2011; McDonald et al., 2011).
The DPRs indicate that the a-AGB stars are moderately strong dust producers (also see Boyer et al., 2012). The median DPR of the a-AGB population is (dispersion ). This is an order of magnitude higher than the median DPR of the O-AGB population, which includes many non-dusty stars, and a few bright very dusty stars. The C-AGB and x-AGB populations are very dusty, with median DPRs that are 2 and 2 orders of magnitude higher than the a-AGB median DPR, respectively.
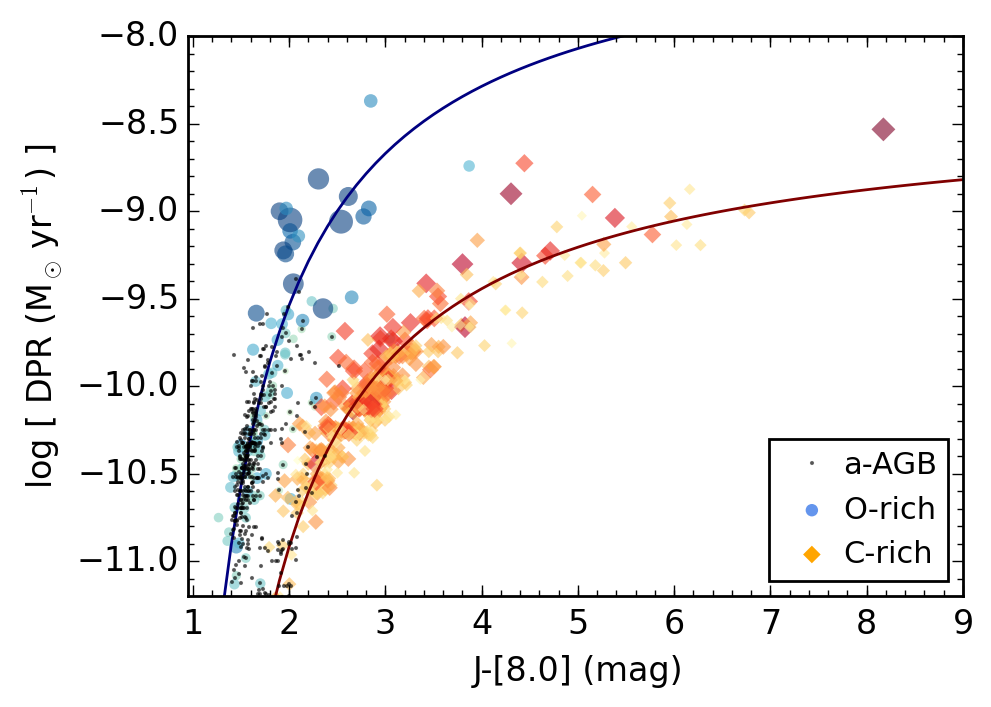
Figure 12 shows how the color varies with the DPR; colors represent the spectral classification and symbol sizes represent the pulsation mass (only Sequence 1 stars are plotted, so the low-DPR O-AGB population, which resides on Sequences 3 and 4 are not included). The relationship between and DPR is bimodal, with O-rich stars reaching higher DPRs at bluer colors than C stars and a clean separation between the two spectral types. O-rich stars increase in mass as the DPR increases, but the masses of C-rich stars is mixed along the entire range of DPRs. Fits to each branch shown in Figure 12 are of the form:
| (4) |
for stars with mag. For C-rich stars, , , and . For O-rich stars, , , and , though it is unclear whether this relationship applies to O-rich stars with mag, since we have few examples of O-rich stars at those extreme colors.
Overplotted as dots in Figure 12 is the entire population of a-AGB stars, including all pulsation sequences. The bulk of the a-AGB stars smoothly continue the O-rich branch to low DPRs and masses, indicating that the a-AGB stars are a subset of the general (dust-producing) O-rich AGB population in the LMC.
4. Discussion
The properties of the a-AGB stars presented in the previous section all suggest that they are low-mass, very evolved dusty AGB stars. The broad spatial distributions of the a-AGB stars compared to other AGB stars in the SMC presented in B11 also suggests that a-AGB stars originate from an older stellar population. The star-formation histories of the Magellanic Clouds have been computed globally by Harris & Zaritsky (2004, 2009), and in smaller fields by Rubele et al. (2012, 2015) and Weisz et al. (2013). While there is strong variation in the star-formation histories regionally, global histories show a peak near – Gyr, which corresponds to an initial stellar mass of 1–1.3 . The a-AGB stars likely originated from this star-formation event. This mass range encompasses the lower-mass limit for stars that will become C-rich during their evolution (e.g., Marigo et al., 2013).
In this section, we explore additional evidence supporting this low-mass hypothesis, compare the characteristics of the a-AGB stars to their more massive counterparts, and discuss the opportunities that arise with a simple photometric technique for distinguishing low-mass TP-AGB stars. We note that the O-AGB population, as defined in Section 2.1.1 can be separated into more evolved (pulsation Sequences 1 and 2), and less-evolved (pulsation Sequences 3 and 4) TP-AGB stars. The following sections exclude the less evolved O-AGB stars, except where explicitly stated.
4.1. Dust Production and Pulsation

Several works point to pulsation as one of the drivers of AGB dust production and mass loss, and we now explore the influence of pulsation on the dust-production rates of a-AGB stars. The influence of pulsation is clear: the median DPR increases by an order of magnitude from Sequences 4 to 3, and again from Sequences 3 to 2, only surpassing on Sequences 2, 1, and D, where the a-AGB stars reside.
Vassiliadis & Wood (1993, VW93) found that for Galactic C-rich and O-rich AGB stars pulsating in the fundamental mode, the mass-loss rate increases exponentially with period as:
| (5) |
until days, when the star enters the superwind phase and the mass-loss rate reaches a maximum near . For stars more massive than 2.5 , their models suggest that this relation changes to
| (6) |
The VW93 parameterization is shown for the LMC in Figure 13 along with the scaled dust-production rates from Riebel et al. (2012) and the periods from OGLE, using the spectral classifications to exclude stars that are photometrically misclassified. We convert the gas mass-loss rates from VW93 to DPRs using a solar gas-to-dust ratio () for C stars and scaling the ratio with metallicity for O-rich stars (). Equation 5 provides a reasonably good description of the behavior of C-rich stars. The predicted trend for more massive stars to move to longer periods is evident in Figure 13 for the O-rich stars.
Groenewegen et al. (1998) (and later Groenewegen et al., 2009) fit the spectral energy distributions of several Galactic C-rich Miras to revise the VW93 - relationship. They find
| (7) |
which we show in Figure 13, scaled down by a factor of 4 to account for differences in optical constants as described by Srinivasan et al. (2011) and by the gas-to-dust ratio (; ). The LMC AGB stars do not deviate strongly from the G98 Galactic - relationship, despite their lower metallicities ().
The LMC a-AGB stars on pulsation Sequence 1 (and thus included in Fig. 13) are primarily O-rich. Their position to the left of the dashed line from VW93 indicates masses 2.5 (the O-AGB stars within the a-AGB locus could easily also be classified as a-AGB stars with a slight shift in the color classifications – see Section 4.5). Unlike the more massive O-rich stars and the x-AGB/C-AGB stars, the a-AGB DPRs are not strongly dependent on the pulsation period: their DPRs span two orders of magnitude over the full a-AGB period distribution. The DPRs of the x-AGB and massive O-AGB stars, on the other hand, show a strong positive correlation with both pulsation periods and amplitudes. These a-AGB star characteristics suggest that once a low-mass star is pulsating in the fundamental mode, the pulsation plays only a small role in its dust production, at least compared to their more massive counterparts.
4.2. Comparison to Stellar Evolution Models
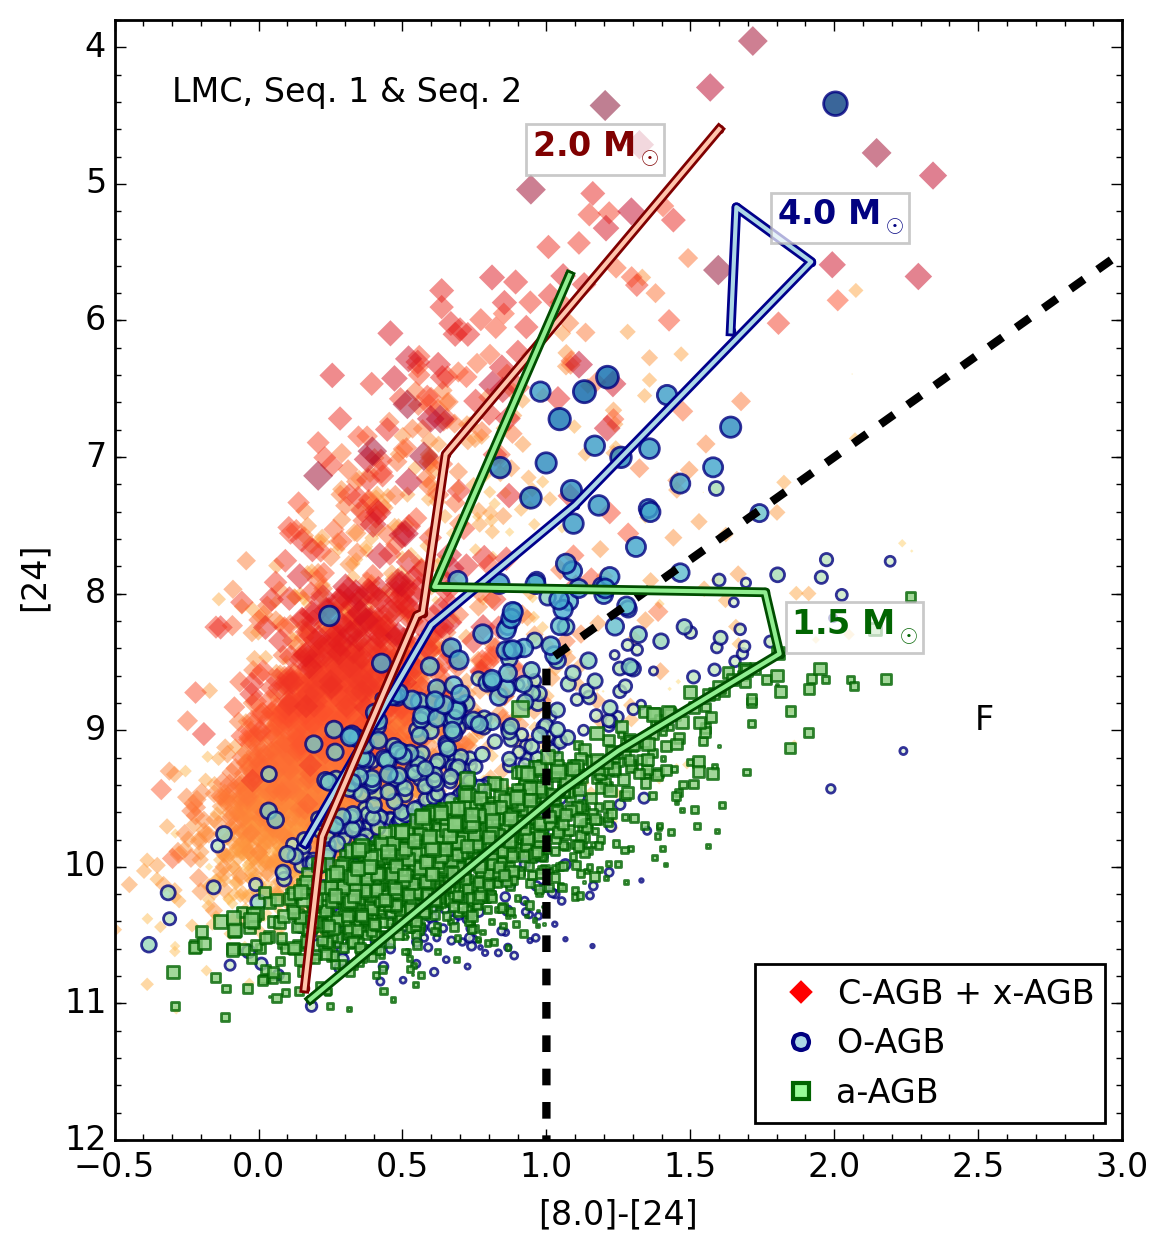
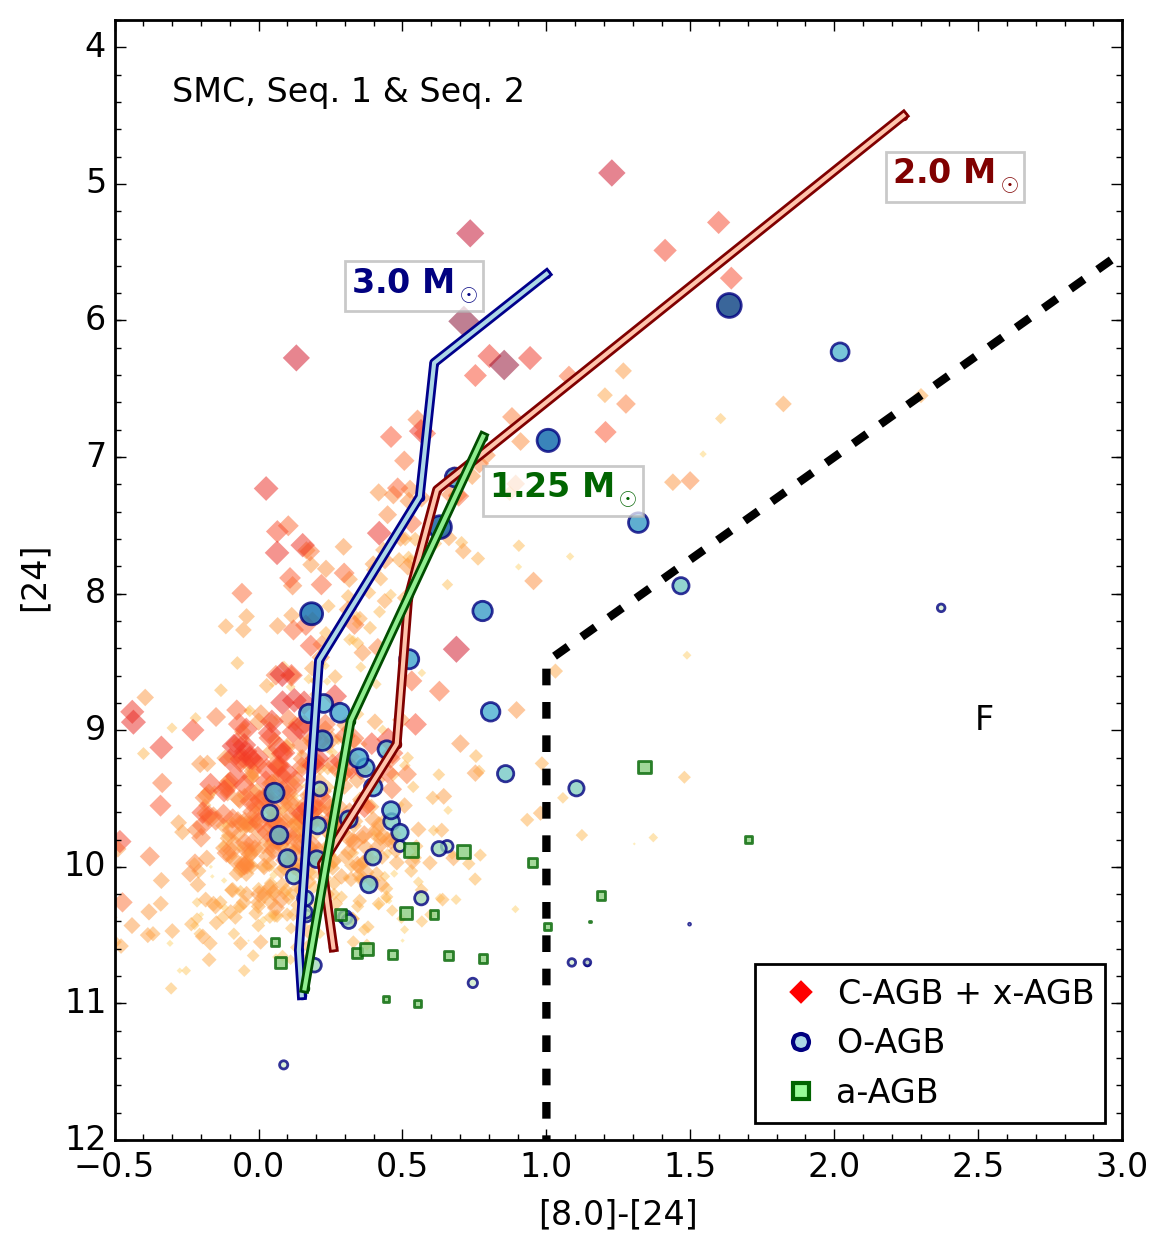
Dell’Agli et al. (2015) (hereafter D15) computed theoretical evolutionary tracks of AGB stars, including dust formation. They found that the masses of AGB stars can be inferred by their positions in a Spitzer vs. CMD. In the upper panel of Figure 14, we show the CMD of the LMC for Sequence 1 and 2 stars. As stars increase in bolometric luminosity (Section 3.3), the size of the symbol increases and the color darkens. The most luminous (and by extension, the most massive) stars are found at the bright/red end of the CMD, following the predictions of D15.
The a-AGB stars occupy a finger at faint 24-µm magnitudes, with a broad range in color. In D15, this region of the CMD is populated by stars with initial masses 1.5 , prior to transitioning from O-rich to C-rich, which they designate “F” stars (dashed line in Fig. 14a). Their models indicate that “F” stars evolve along this finger to brighter 24 µm magnitudes before shifting horizontally to the C star sequence when dredge-up causes C/O to exceed unity at the very end of the AGB phase. Stars with lower masses, and thus insufficient dredge up for , would remain on this finger. Indeed, dusty AGB stars in Globular Clusters () also occupy the “F” region (Boyer et al., 2008, 2009; McDonald et al., 2012). The D15 models support our assertion that the a-AGB are low mass stars with insufficient dredge-up: those with the lowest masses will remain O-rich, while those with higher masses will produce significant quantities of O-rich dust prior to becoming C stars.
At lower metallicities, the lower-mass limit for the O- to C-rich transition decreases, and the D15 models predict that the F sequence should therefore be more sparsely populated in metal-poor environments. Indeed, the “F” finger is not pronounced in the more metal-poor SMC (Fig. 14). This is partially caused by limited sensitivity at 24 µm, which is 0.4 mag worse in the more distant SMC. However, since the a-AGB stars increase in brightness at 24 µm as color increases, any in the “F” region of the CMD in the SMC are detectable. We thus conclude that metallicity is the dominant cause of the empty “F” region in the SMC. This effect may be compounded by less-efficient dust production in O-rich stars at low metallicity due to a lack of condensation seeds, which will result in fewer O-rich stars with 24-µm excess. Based on the D15 models, any low-mass stars in the SMC that will remain O-rich must have initial masses , in good agreement with the masses inferred from the star-formation histories.
The Padova TP-AGB models111http://stev.oapd.inaf.it/cgi-bin/cmd (Marigo et al., 2008) generally follow the D15 models, with slightly higher mass transitions. Here, we use the option with 60% silicate 40% AlOx for O-rich stars and 85% amorphous carbon 15% SiC for C-rich stars (Groenewegen, 2006). These models show that, in the LMC, all stars with initial mass 1.5 remain on the “F” branch marked in Figure 14; transitions over to the C-star side (left side) of the diagram occur only for stars with 1.6. The Padova models indicate that this transition happens at in the SMC.
4.3. Probing the lower mass bound for C stars
The a-AGB photometric classification appears to include initial stellar masses that straddle the lower-mass limit for the O-to-C transition caused by the dredge-up of carbon. They therefore include both stars that will undergo this transition and stars that will remain O-rich. We can probe this transition several ways using the a-AGB stars.
First, this boundary is reflected in the pulsation masses estimated in Section 3.3 for stars pulsating in the fundamental mode (Sequence 1). The median pulsation mass for a-AGB stars is 1.14 in the LMC and 0.94 in the SMC, with dispersions of 0.21 and 0.18 , respectively (Section 3.3).
Second, the luminosities of S-type stars can probe the O-to-C mass transition. In Figure 9, we show the spectral classifications of a-AGB stars on the 3.6-µm - diagram. In the SMC, we see a curious pile-up of S-type a-AGB stars on Sequence 2 near – mag, corresponding to – and mag. Assuming these are all intrinsic S-type stars (Section 3.2), it suggests that stars fainter than this cutoff on Sequence 2 will likely remain O-rich as they evolve to Sequence 1. Indeed, this is supported by the relative lack of faint C-rich a-AGB stars on Sequence 1 in both galaxies. This scenario would be confirmed if LMC S-type stars showed a similar S-type star limit, but at a brighter luminosity. Unfortunately, the only -process molecular feature covered by the LMC spectra is LaO, which is too weak for reliable S-type classification.

Third, a comparison of the luminosity functions of a-AGB stars and C-rich AGB stars on different pulsation sequences could be used to calibrate the O-to-C transition in stellar evolution models. We show these functions in Figure 15, combining the C-AGB and x-AGB photometric classes into the C-rich category. In both galaxies, the number of a-AGB stars decreases from Sequence 2 to 1, and the number of C-rich stars increases in the same luminosity range, hinting that these new C-AGB stars originated from the Sequence 2 a-AGB sample. Moreover, the change in the ratio of a-AGB stars to C-rich stars from Sequences 2 to 1 is larger in the SMC by a factor of 1.4, indicating a higher transition efficiency. This is consistent with stellar evolution models, which predict a higher dredge-up efficiency at low metallicities due both to less available free oxygen and because the depth of the dredge-up events increases at low metallicities.
Stellar evolution models (e.g., Karakas et al., 2002; Marigo et al., 2008, 2013) also predict that the dredge-up efficiency rapidly decreases at lower masses. The late transition from O- to C-rich among the a-AGB stars supports this prediction, suggesting that they require more dredge-up events to reach compared to their more massive C-AGB counterparts. Karakas (2014) compute that C/O in an LMC-like 1.5 star () will increase by 0.2–0.25 after each thermal pulse. With an initial C/O near 0.4, LMC a-AGB stars thus require a few thermal pulses to become C stars. This is reflected in the low fraction (23%) of C-rich a-AGB stars in the LMC.
According to the same Karakas (2014) models, an SMC-like star (, ), becomes C-rich after a single pulse, with an increase in C/O of 1.5. We would therefore expect about half of the a-AGB stars to be C-rich if they are all at or above the O-to-C transition mass, and indeed this is exactly what we find. This indicates that there are few stars in the SMC with masses below the O-to-C transition that have reached the final stage of the AGB phase.
4.4. Long Secondary Periods
Stars with long secondary periods (LSPs) lie on pulsation Sequence D, the cause of which is unknown. With the collection of data we have here, we have found some clues to the origin of the LSP: (1) Sequence D is dominated by O- and a-AGB stars (80%; Table 6); (2) DPRs on Sequence D are similar to those on Sequences 1 and 2; (3) unlike on other Sequences, the ratio of C/M stars on Sequence D is almost the same in both galaxies (0.39 in the LMC; 0.46 in the SMC), despite the difference in metallicity; and (4) there are almost no x-AGB stars on Sequence D.
The lack of x-AGB stars on Sequence D may be partially caused by circumstellar extinction; a significant fraction are not detected as variable in OGLE, but are recovered as variable in the infrared (Riebel et al., 2015). If this is the case, then any x-AGB stars with LSPs are dustier than those found on Sequence 1. Of the a-AGB stars that show significant dust production (based on whether they are detected at 24 µm), 19% (LMC) and 32% (SMC) are found on Sequence D. This is consistent with Wood & Nicholls (2009), who find that the LSP is associated with dusty mass ejection.
Wood (2015) show that the primary periods (i.e., the second-longest period) of most LSP stars lies near Sequences 2 and 3, as expected if most of the LSP stars are O- or a-AGB. The preference for stars with low initial masses and O-rich chemistries on Sequence D is a compelling hint for the nature of the LSP and may point to a connection between the LSP and the initial onset of dust production. A higher fraction of the a-AGB stars reside on Sequence D in the SMC, suggesting that metallicity may also play a role in the origin of the LSP.
4.5. Implications for Photometric Classification
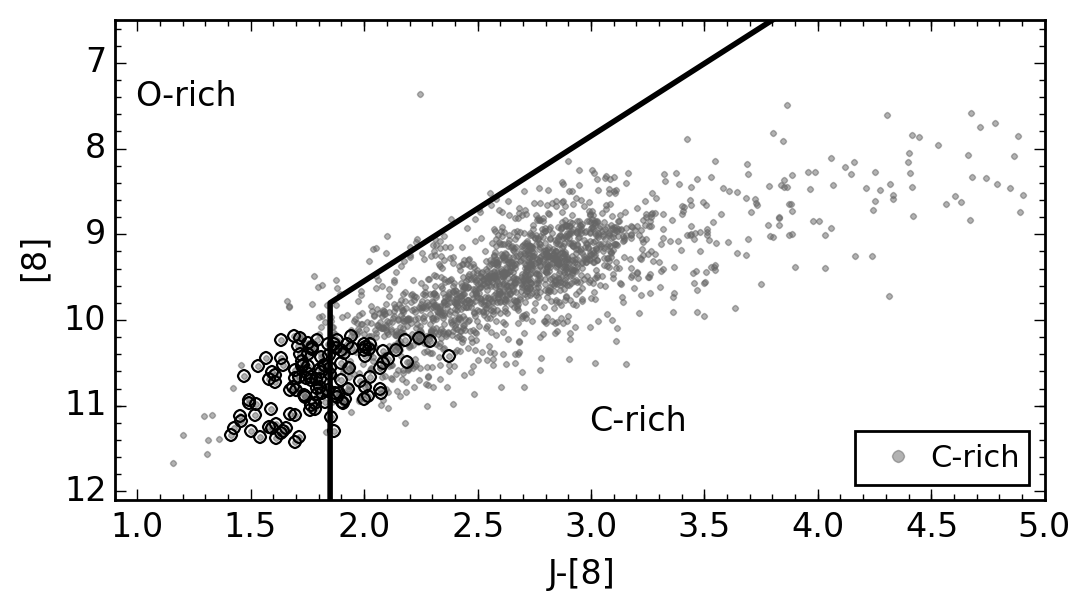
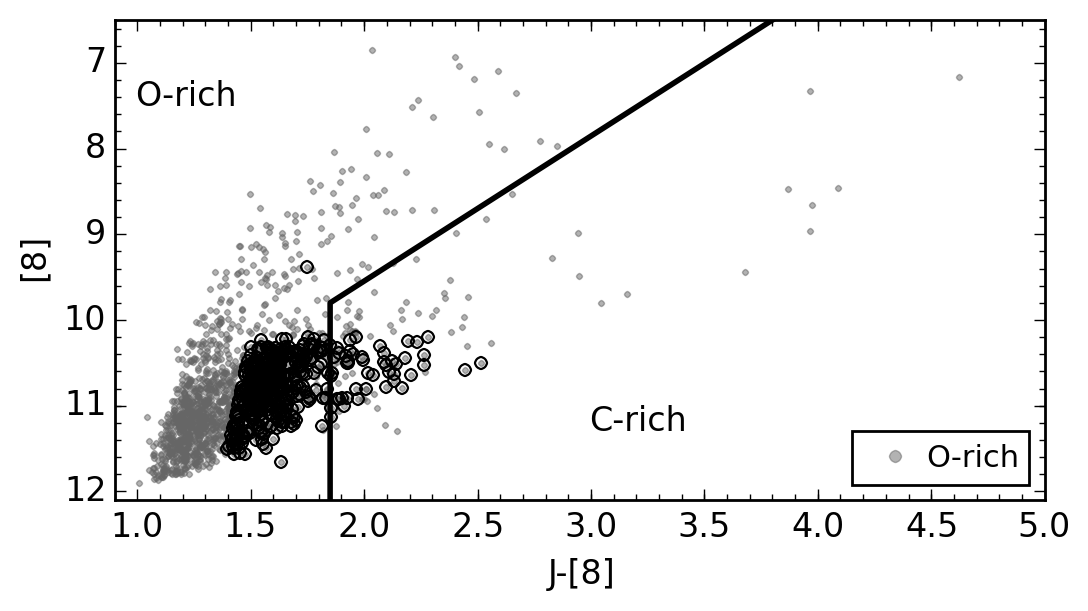

Even though the a-AGB stars have distinct colors from the O-AGB and C-AGB populations, the Cioni et al. (2006) classification scheme works relatively well in the MCs from a statistical perspective (Section 2.3.1). However, this scheme fails when the goal is to classify the most evolved, dust-producing sources, including both the a-AGB stars and the more massive O-AGB stars with high DPRs (Fig. 16). The results for M31 described in Boyer et al. (2013) suggest that the fraction of misclassified O-rich stars will also increase with metallicity due to strong water absorption in late-type O-rich giants.
The black line in the lower panel of Figure 16 shows the best separation in the LMC, resulting in the correct classification for 93% of the C stars and 92% of the O-rich stars. The misclassifications may be partially explained by non-simultaneous observations between 2MASS and Spitzer, which can cause artificially blue or red colors owing to variability. The James Webb Space Telescope (JWST) will include filters covering 0.7–25.5 µm, allowing for near-simultaneous imaging over a wide wavelength range. JWST will also have a filter centered on the 10-µm silicate feature present in most dusty O-rich stars, which may be a better choice than the IRAC 8.0-µm filter for separating dusty M and C stars.
Even though the statistical separation of C and M stars is only marginally improved by including the 8-µm photometry, we recommend using the color to distinguish evolved TP-AGB stars (especially the a-AGB stars) from their less evolved counterparts when pulsation information is not available. This separation is impossible in and in various combinations with the other three IRAC filters. We show the color distribution for stars on each pulsation sequence in Figure 17; there is overlap depending on the exact definition of each pulsation sequence, but it is clear that stars redder than the solid line are dominated by evolved AGB stars on sequences 1 and 2 (a-AGB, C-AGB, x-AGB, and massive O-AGB stars). Without this or a similar color cut, it is difficult to identify the highly evolved, low-mass stars (the a-AGB stars) without either the pulsation information or complete spectral energy distribution fits for estimating the DPR.
The color (Fig. 14) is also a reliable way to separate the evolved a-AGB stars from less-evolved O-AGB stars. However, it results in an incomplete sample owing to the limited sensitivity at long wavelengths. JWST will be approximately 3–4 times more sensitive than Spitzer at 24 µm.
4.6. The Cause of the Red colors

B11 first noticed the a-AGB stars by their red colors. Their colors must be caused by the flux in the 8-µm filter since the a-AGB stars do not stand out in other color combinations involving . There are two possible spectral features that might affect this wavelength range: SiO absorption at 8 µm and silicate dust emission at 10 µm. The a-AGB stars have modestly high DPRs, confirming the presence of dust. Dust can cause both strong silicate emission and/or veiling of the SiO molecular band, and both scenarios would increase the color. Ten of the LMC a-AGB stars have been observed with the IRS and their AGB nature confirmed. Of these, nine show strong silicate emission (Fig. 18).
In dustless stars, Sloan et al. (2008) showed that the strength of SiO absorption decreases with metallicity. If SiO is the dominant factor causing the red color, we would therefore expect redder colors for the SMC a-AGB stars. Figure 7 shows the distribution in a-AGB colors, and the SMC colors are, in fact, slightly bluer, on average. We therefore conclude that the silicate feature is the dominant cause of the red color for O-rich a-AGB stars. The colors of the massive dusty O-AGB stars are similar to the a-AGB colors (see, for example, Fig. 12). It is therefore reasonable that the red colors are caused by the same mechanism, i.e., the silicate feature.
B11 speculated that the red colors of a-AGB stars might be caused by an unusually shaped silicate feature. The silicate features of these nine examples are not remarkable compared to other O-rich AGB stars in the SAGE-Spec program (Woods et al., 2011; Ruffle et al., 2015), so we rule out an unusual feature shape as a cause of the red colors of a-AGB stars. Instead, the red colors are more likely caused by the overlap between the wing of the silicate feature and the 8-µm filter transmission (Fig. 18).
Dusty C-rich a-AGB stars would also be red in because of the contribution of the dust continuum of amorphous carbon dust at 8 µm; dustier stars would exhibit redder colors. Compared to other C-AGB stars, the C-rich a-AGB stars have low DPRs, so their colors at the blue end of the C-AGB branch in Fig. 1 is to be expected.
C-rich and O-rich a-AGB stars are similarly indistinguishable in color combinations that include the AKARI 11-µm flux since both C-rich and O-rich dusty stars have strong excess at 11 µm.
5. Conclusions
Using Spitzer SAGE data, Boyer et al. (2011) noted a group of thermally-pulsing AGB stars in the Magellanic Clouds which classify as O-rich based on their colors, but that show redder colors than the bulk of their parent population. That work dubbed these the anomalous O-rich (aO-)AGB stars. We have gathered evidence from multiple perspectives to ascertain the nature of these stars and conclude that they are low-mass AGB stars that are straddling the mass limit where dredge up is sufficient to transform them into carbon stars. Since a high fraction of the aO-AGB stars turned out to be C-rich, we now refer to the B11 aO-stars as simply a-AGB stars, and find that they are evolved, low-mass dusty AGB stars. We reach this conclusion by interpreting the following observations:
-
•
Their optical spectra show a high fraction of both C- and O-rich chemistries despite having colors that are typically assigned to O-rich stars. There is a higher fraction of C-rich a-AGB stars in the more metal-poor SMC (50%, compared to 23% in the LMC).
-
•
Light curves indicate they are pulsating primarily in the fundamental mode and first overtone, suggesting they are at the very end of their evolution. Among those pulsating in the fundamental mode, the a-AGB median pulsation masses are lower than those of the O-AGB and C-AGB populations.
-
•
We identified (likely intrinsic) S-type stars in the SMC, and find that they comprise 9% of the a-AGB population. These pulse primarily in the first overtone and cluster near – mag, suggesting that stars with similar properties will transition to C-rich as they move to the fundamental mode.
-
•
Their dust-production rates are consistent with low-mass O-AGB stars.
-
•
Their colors match stellar evolution tracks for low-mass AGB stars.
-
•
Their metallicities are low compared to the O-AGB stars, implying that they originated from an older, less chemically-evolved, stellar population.
The results here suggest that a-AGB stars can be easily selected photometrically using the color, which is more reliable than for the most evolved stars, and particularly for the dust-enshrouded O-rich stars. In addition, surveys searching for S-type stars may be wise to search among the brightest a-AGB stars.
With the compiled rich data set for the Magellanic Clouds, we have noted some general properties of the a-AGB stars in addition to the evidence listed above. First, their dust-production rates are not strongly dependent on their periods, at least compared to other O- and C-AGB stars pulsating in the fundamental mode (Mira variables). Second, they are over represented among stars with a long secondary period. Third, their effective temperatures are similar to high-luminosity O-rich evolved stars. Finally, even those that will eventually transition into C-AGB stars will produce significant quantities of O-rich dust prior to this transition. More massive stars will become C-rich before the onset of strong dust production (except the most massive hot-bottom-burning AGB stars, which will remain O-rich).
In the LMC, models suggest the a-AGB stars have initial masses up to , and up to in the SMC. The transition mass would therefore be a bit below this limit. In both of the Magellanic Clouds, there is a peak in the star-formation history that corresponds to initial stellar masses of 1–1.3 (Harris & Zaritsky, 2004, 2009). The evidence presented here suggests that this star formation event is the origin of the a-AGB stars, and may have been caused by an encounter between the LMC and SMC 2.5 Gyr ago.
References
- Allard et al. (2011) Allard, F., Homeier, D., & Freytag, B. 2011, in Astronomical Society of the Pacific Conference Series, Vol. 448, 16th Cambridge Workshop on Cool Stars, Stellar Systems, and the Sun, ed. Johns-Krull, C. and Browning, M. K. and West, A. A., 91
- Astropy Collaboration et al. (2013) Astropy Collaboration, et al. 2013, A&A, 558, A33
- Barden & Ingerson (1998) Barden, S. C. & Ingerson, T. E. 1998, in Astronomical Society of the Pacific Conference Series, Vol. 152, Fiber Optics in Astronomy III, ed. . F. W. S. Arribas, E. Mediavilla, 60
- Blum et al. (2006) Blum, R. D., et al. 2006, AJ, 132, 2034
- Blum et al. (2014) —. 2014, AJ, 148, 86
- Boyer et al. (2013) Boyer, M. L., et al. 2013, ApJ, 774, 83
- Boyer et al. (2008) —. 2008, AJ, 135, 1395
- Boyer et al. (2009) —. 2009, ApJ, 705, 746
- Boyer et al. (2012) —. 2012, ApJ, 748, 40
- Boyer et al. (2011) —. 2011, AJ, 142, 103
- Cioni et al. (2006) Cioni, M., et al. 2006, A&A, 448, 77
- Davis (1987) Davis, S. P. 1987, PASP, 99, 1105
- Dell’Agli et al. (2015) Dell’Agli, F., et al. 2015, MNRAS, 447, 2992
- Dijkstra et al. (2005) Dijkstra, C., et al. 2005, ApJ, 633, L133
- Fraser et al. (2005) Fraser, O. J., et al. 2005, AJ, 129, 768
- García-Hernández et al. (2007) García-Hernández, D. A., et al. 2007, A&A, 462, 711
- Gautschy-Loidl et al. (2004) Gautschy-Loidl, R., et al. 2004, A&A, 422, 289
- Gordon et al. (2011) Gordon, K. D., et al. 2011, AJ, 142, 102
- Groenewegen (1993) Groenewegen, M. A. T. 1993, A&A, 271, 180
- Groenewegen (2006) —. 2006, A&A, 448, 181
- Groenewegen et al. (2009) Groenewegen, M. A. T., et al. 2009, A&A, 506, 1277
- Groenewegen et al. (1998) —. 1998, MNRAS, 293, 18
- Guandalini & Busso (2008) Guandalini, R. & Busso, M. 2008, A&A, 488, 675
- Harris & Zaritsky (2004) Harris, J. & Zaritsky, D. 2004, AJ, 127, 1531
- Harris & Zaritsky (2009) —. 2009, AJ, 138, 1243
- Hauschildt et al. (1999) Hauschildt, P. H., Allard, F., & Baron, E. 1999, ApJ, 512, 377
- Indebetouw et al. (2005) Indebetouw, R., et al. 2005, ApJ, 619, 931
- Ita et al. (2010) Ita, Y., et al. 2010, PASJ, 62, 273
- Ita et al. (2004) —. 2004, MNRAS, 353, 705
- Jones et al. (2014) Jones, O. C., et al. 2014, MNRAS, 440, 631
- Jorissen (2003) Jorissen, A. 2003, in Asymptotic giant branch stars, by Harm J. Habing and Hans Olofsson. Astronomy and astrophysics library, New York, Berlin: Springer, 2003, p. 461, ed. Habing, H. J. and Olofsson, H., 461
- Jorissen et al. (1993) Jorissen, A., et al. 1993, A&A, 271, 463
- Karakas (2014) Karakas, A. I. 2014, MNRAS, 445, 347
- Karakas et al. (2002) Karakas, A. I., Lattanzio, J. C., & Pols, O. R. 2002, PASA, 19, 515
- Kato et al. (2012) Kato, D., et al. 2012, AJ, 144, 179
- Kemper et al. (2010) Kemper, F., et al. 2010, PASP, 122, 683
- Lewis et al. (2002) Lewis, I. J., et al. 2002, MNRAS, 333, 279
- Loup et al. (1997) Loup, C., et al. 1997, A&AS, 125, 419
- Maraston et al. (2006) Maraston, C., et al. 2006, ApJ, 652, 85
- Marigo et al. (2013) Marigo, P., et al. 2013, MNRAS, 434, 488
- Marigo et al. (2008) —. 2008, A&A, 482, 883
- Matsuura et al. (2009) Matsuura, M., et al. 2009, MNRAS, 396, 918
- McConnachie (2012) McConnachie, A. W. 2012, AJ, 144, 4
- McDonald et al. (2011) McDonald, I., et al. 2011, ApJS, 193, 23
- McDonald et al. (2010) —. 2010, ApJ, 717, L92
- McDonald et al. (2009) —. 2009, MNRAS, 394, 831
- McDonald et al. (2012) —. 2012, MNRAS, 427, 2647
- McKinnon et al. (2015) McKinnon, R., Torrey, P., & Vogelsberger, M. 2015, ArXiv e-prints
- Meixner et al. (2006) Meixner, M., et al. 2006, AJ, 132, 2268
- Melbourne & Boyer (2013) Melbourne, J. & Boyer, M. L. 2013, ApJ, 764, 30
- Melbourne et al. (2012) Melbourne, J., et al. 2012, ApJ, 748, 47
- Olsen et al. (2011) Olsen, K. A. G., et al. 2011, ApJ, 737, 29
- Otto et al. (2011) Otto, E., Green, P. J., & Gray, R. O. 2011, ApJS, 196, 5
- Riebel et al. (2015) Riebel, D., et al. 2015, ArXiv e-prints
- Riebel et al. (2012) —. 2012, ApJ, 753, 71
- Rubele et al. (2015) Rubele, S., et al. 2015, MNRAS, 449, 639
- Rubele et al. (2012) —. 2012, A&A, 537, A106
- Ruffle et al. (2015) Ruffle, P. E., et al. 2015, MNRAS, submitted
- Sargent et al. (2011) Sargent, B. A., Srinivasan, S., & Meixner, M. 2011, ApJ, 728, 93
- Saunders et al. (2004) Saunders, W., et al. 2004, in Society of Photo-Optical Instrumentation Engineers (SPIE) Conference Series, Vol. 5492, Society of Photo-Optical Instrumentation Engineers (SPIE) Conference Series, ed. A. F. M. M. . M. Iye, 389–400
- Schneider et al. (2014) Schneider, R., et al. 2014, MNRAS, 442, 1440
- Sharp et al. (2006) Sharp, R., et al. 2006, in Society of Photo-Optical Instrumentation Engineers (SPIE) Conference Series, Vol. 6269, Society of Photo-Optical Instrumentation Engineers (SPIE) Conference Series
- Skrutskie et al. (2006) Skrutskie, M. F., et al. 2006, AJ, 131, 1163
- Sloan et al. (2008) Sloan, G. C., et al. 2008, ApJ, 686, 1056
- Soszyński et al. (2008) Soszyński, I., et al. 2008, AcA, 58, 163
- Spano et al. (2011) Spano, M., et al. 2011, A&A, 536, A60
- Srinivasan et al. (2009) Srinivasan, S., et al. 2009, AJ, 137, 4810
- Srinivasan et al. (2011) Srinivasan, S., Sargent, B. A., & Meixner, M. 2011, A&A, 532, A54
- Valenti et al. (1998) Valenti, J. A., Piskunov, N., & Johns-Krull, C. M. 1998, ApJ, 498, 851
- van Loon et al. (1998) van Loon, J. r., et al. 1998, A&A, 329, 169
- van Loon et al. (2008) van Loon, J. Th., et al. 2008, A&A, 487, 1055
- van Loon et al. (1999) —. 1999, A&A, 351, 559
- van Loon et al. (2001) —. 2001, A&A, 368, 239
- Vassiliadis & Wood (1993) Vassiliadis, E. & Wood, P. R. 1993, ApJ, 413, 641
- Weisz et al. (2013) Weisz, D. R., et al. 2013, MNRAS, 431, 364
- Wood (2015) Wood, P. R. 2015, ArXiv e-prints
- Wood et al. (1999) Wood, P. R., et al. 1999, in IAU Symposium, Vol. 191, Asymptotic Giant Branch Stars, ed. Le Bertre, T. and Lebre, A. and Waelkens, C., 151
- Wood & Nicholls (2009) Wood, P. R. & Nicholls, C. P. 2009, ApJ, 707, 573
- Wood et al. (1992) Wood, P. R., et al. 1992, ApJ, 397, 552
- Woods et al. (2011) Woods, P. M., et al. 2011, MNRAS, 411, 1597
- Wright et al. (2010) Wright, E. L., et al. 2010, AJ, 140, 1868
- Yang et al. (2006) Yang, X., et al. 2006, AJ, 132, 1468
- Zaritsky et al. (1997) Zaritsky, D., Harris, J., & Thompson, I. 1997, AJ, 114, 1002
- Zaritsky et al. (2002) Zaritsky, D., et al. 2002, AJ, 123, 855
- Zhukovska & Henning (2013) Zhukovska, S. & Henning, T. 2013, A&A, 555, A99