Circular FREAK-ORB Visual Odometry
Abstract
We present a novel Visual Odometry algorithm entitled Circular FREAK-ORB (CFORB). This algorithm detects features using the well-known ORB algorithm [12] and computes feature descriptors using the FREAK algorithm [14]. CFORB is invariant to both rotation and scale changes, and is suitable for use in environments with uneven terrain. Two visual geometric constraints have been utilized in order to remove invalid feature descriptor matches. These constraints have not previously been utilized in a Visual Odometry algorithm. A variation to circular matching [16] has also been implemented. This allows features to be matched between images without having to be dependent upon the epipolar constraint. This algorithm has been run on the KITTI benchmark dataset and achieves a competitive average translational error of and average rotational error of . CFORB has also been run in an indoor environment and achieved an average translational error of . After running CFORB in a highly textured environment with an approximately uniform feature spread across the images, the algorithm achieves an average translational error of and an average rotational error of .
I Introduction
Visual Odometry (VO) involves estimating the ego-motion of an object using the images from single or multiple cameras as an input. VO is a fully passive approach and offers a cheaper and mechanically easier-to-manufacture solution compared to Lidar and Radar sensors. The ability to estimate the ego-motion of an object is crucial in many applications where accurate localization sensors such as GPS are not available. One such application is indoor navigation where an agent is required to navigate to a specified location, without the use of GPS, in order to perform a task [2, 1]. This is crucial for navigating in environments such as warehouses, hospitals and museums to name a few.
Another application involves ego-motion estimation for planetary landing in space exploration tasks[4]. VO has also been utilised on the Mar’s rovers to track its motion, perform slip checks, monitor vehicle safely whilst driving near obstacles as well as approaching various targets and objects efficiently [5, 6]. This includes performing complex approaches towards targets and obstacles. VO has been used on Unmanned Aerial Vehicles to perform tasks which include point-to-point navigation as well as autonomous take-off and landing [7]. Another important application of VO is in underwater robots [8]. These robots do not have access to or cannot rely on GPS coordinates. The ocean floor is generally rich in texture and therefore provides a good environment for robust feature extraction which is a key requirement to performing VO.
VO is an active field and numerous works have been published on this topic. Both monocular and stereo algorithms have been developed. Real-time Topometric Localization performs monocular VO using features called Whole Image SURF (WI-SURF) descriptors [15]. This method is prone to occlusion errors but exhibits good performance over large distances. Another monocular algorithm detects features using the Kanade-Lucas-Tomasi feature detector and requires only a single correspondence to perform ego-motion estimation which is computationally efficient [18]. Among the stereo algorithms, Multi-frame Feature Integration detects features using a combination of Harris Detectors and FREAK descriptors. The features are tracked using an optical flow algorithm. Ego-motion is estimated by minimizing the re-projection errors [3]. This algorithm exhibits very good VO performance on the well-known KITTI dataset. StereoScan is another method that detects features using custom-made corner and blob masks. Features are matched using their Sobel responses and a further circular matching procedure is performed in order to determine the features to be used for ego-motion estimation [16].
Both [3] and [16] have inspired the development of our algorithm entitled Circular FREAK-ORB. This algorithm detects features using an ORB detector and matches features using FREAK descriptors. A variation of circular matching, similar to that using in [16], has been utilized to select the correct features for ego-motion estimation and novel geometrical constraints, that have not previously been utilized in VO applications, are utilized to remove incorrect matches.
Therefore the main technical contributions in this work are three-fold:
- •
-
•
Visual geometrical constraints that have not previously been utilized in a VO application to remove bad matches
-
•
A variation to the circular matching procedure performed by StereoScan [16] which removes the requirement of utilizing the epipolar constraint to match features between images.
II Background
II-A ORB Detector
Oriented FAST and Rotated BRIEF (ORB) is a feature extraction algorithm that detects features using the FAST detection method with an added orientation component [12]. The FAST method typically detects corner features using an intensity threshold which compares the intensity of the central pixel to a circular ring of pixels around the central pixel. FAST does not contain an orientation component. ORB adds an orientation component to FAST by computing the Intensity Centroid (IC) of the corner feature that has been detected. The IC assumes that the intensity of a corner is offset from the corner itself and this can be used to determine a patch orientation [12]. The IC is calculated according to (1).
| (1) |
where is the moment of a patch. This is then utilized to calculate the intensity centroid as
| (2) |
By constructing a vector from the corner to the IC, it is possible to determine the orientation of the patch as
| (3) |
The moments are computed within a radius from the corner feature. This radius defines the patch size. This improves rotation invariance [12]. Once the features have been detected, descriptors need to be computed and these descriptors then need to be matched.
II-B FREAK Descriptors
The Fast Retina Keypoints (FREAK) descriptor is a relatively new and efficient feature descriptor [14]. FREAK shares similarities with BRISK descriptors [11] as it also makes use of a sampling pattern around the detected feature in order to generate the feature descriptor. However, this sampling pattern is inspired by the human retina and contains a dense sampling pattern in the immediate vicinity of the detected feature corresponding to the fovea. This is used to capture high-resolution information. In the outer vicinity of the detected feature, the sampling pattern becomes more sparse corresponding to the perifoveal region. This region is used to detect lower resolution, coarse information. It is these points that help determine whether a pair of descriptors match or not.
The first Bytes of the FREAK descriptor contain the coarse information and if these bytes for a pair of descriptors are not within a pre-defined threshold of one another, then the match is discarded. This leads to efficient matching which outperforms BRISK, SURF and SIFT by multiple orders of magnitude. It is invariant to both rotation and scale.
Matching of the FREAK descriptors can then be performed using a method such as the Hamming distance [11].
II-C Ego-motion Estimation
Once the features have been detected and matched between corresponding images, the ego-motion estimation of the cameras can then be computed. One way to compute the ego-motion estimation is by minimizing the sum of re-projection errors as shown in (4).
The feature points detected in the left and right image frames at time are triangulated into 3D and then reprojected into the current image frame at time . The objective function is the sum of reprojection errors and a minimization is performed according to the equation below to obtain the rotation matrix and the translation vector .
| (4) |
Here, and denote the feature locations in the left and right images respectively. and denote the left and right image reprojections respectively.
II-D Epipolar Geometry and Rectification
Epipolar geometry provides a complete description of the relative camera geometry between two cameras [9] as seen in Figure 1. The line adjoining the two optical centers, and , intersects the images and at their respective epipoles and . The projection of the 3D point onto each image plane is denoted for image and for image respectively. The line that intersects and in image is called the epipolar line. The corresponding line in image is denoted . Given a point in image , the corresponding point in image is constrained to lie on the epipolar line . The epipolar constraint is defined as:
| (5) |
where F is the fundamental matrix.
Image rectification allows for a simplification of the epipolar constraint where the epipolar lines are made to be parallel with the image axis as seen in Figure 1 [10]. A point in image is constrained to lie along the epipolar line in the same row in image . This allows for simplified matching of points between images.
 |
 |
 |
| () | () | () |
III CFORB Overview
The CFORB algorithm, presented in Figure 1 consists of two major components, namely feature extraction and ego-motion estimation. First, feature extraction is performed on both of the camera images. This includes detecting the features, computing the relevant descriptors and finally matching the descriptors between each of the corresponding stereo images. This also includes visual geometric constraints to weed out bad matches. The ego-motion estimation component performs circular matching similar to StereoScan [16], computes the inlier circular features and then estimates the rotation matrix and translation vector which is used to update the location of the camera.
III-A Feature Extraction
Definition 1
Let and be defined as the detected 2D features for the left image and the right image at time respectively. Let and be defined as the corresponding predicted 2D features. These features have been (1) triangulated into 3D from the previous image pair at time and (2) projected into the image pair at time . An inlier is defined as a feature that satisfies:
| (6) |
where is the inlier threshold. A set of corresponding features satisfying this constraint are said to be repeatable.
III-A1 Feature Detection
There are a number of possible feature detectors that may be utilized for CFORB. The detectors to be compared are BRISK and ORB. We chose these detectors for comparison based on their computational efficiency. The advantage of an ORB detector is the fact that it is invariant to both rotation and scale changes. The rotation invariance comes as a result of computing Intensity Centroids as mentioned in Section II-A. This is crucial in many VO applications since the camera trajectory may not necessarily be smooth [5, 8].
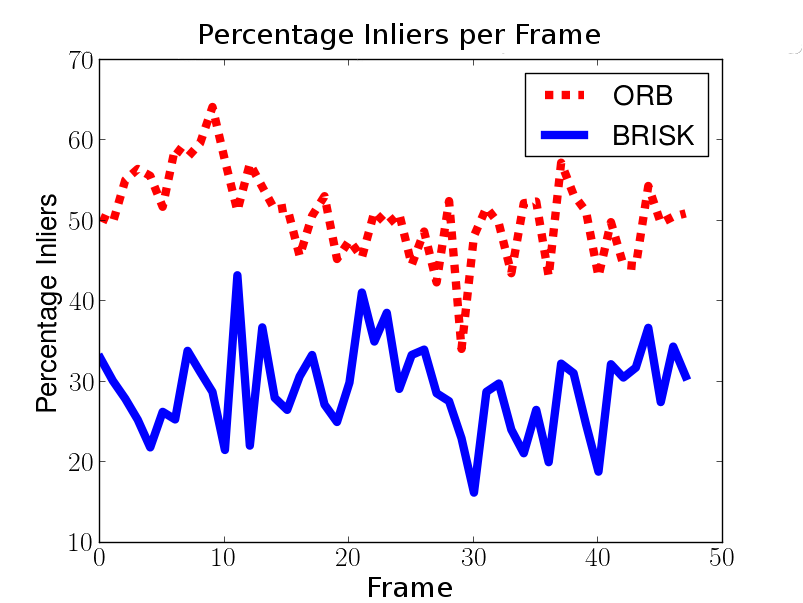
The BRISK detector, however, may exhibit better performance than the ORB detector due to its superior computational efficiency. The BRISK detector is indeed faster than ORB, but is more sensitive to changes in rotation [12]. In addition, ORB features are more repeatable than BRISK features. To verify this, we ran two variations of the CFORB algorithm on a subset of the KITTI dataset using BRISK and ORB detectors respectively. We compared the inlier percentage for each detector. The inlier percentage indicates the percentage of detected features that are within a pre-defined inlier threshold as defined in Definition 1. The percentage of inliers is higher for ORB features compared to BRISK features as seen in Figure 2. An ORB detector therefore results in more repeatable features as well as accurate ego-motion estimates and has therefore been chosen as the feature detection algorithm for CFORB.
III-A2 Feature Descriptors and Matching
Descriptors for the ORB features are then computed using the FREAK algorithm. FREAK is multiple orders of magnitude faster than BRISK and ORB descriptors and therefore is an intuitive descriptor choice [14]. Since FREAK descriptors are generated from multiple binary brightness comparisons, the descriptors can be efficiently matched using the Hamming distance.
III-A3 Geometrical Constraints
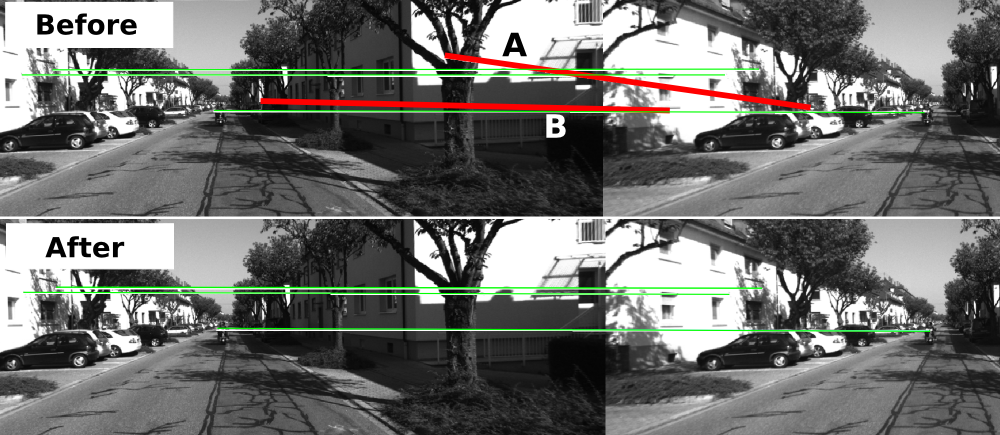
When matching FREAK descriptors, there were numerous incorrect matches. We have found it possible to remove many of these matches using two visual geometric constraints [13]. These constraints, namely the vertical and horizontal constraints, have not previously been utilized in a VO algorithm. An example of these constraints in action is presented in Figure 3. The vertical constraint assumes that matches between corresponding images lie on approximately the same row. This assumes that there is not a great deal of rotation between the stereo cameras. The constraint removes a match between corresponding images when the vertical pixel difference between features connected via the red matching line (marked ‘A’ in the figure) is above a pre-defined threshold. The horizontal constraint assumes that matches lie in approximately the same column which is perfectly reasonable in stereo images. Therefore a matching line (marked ‘B’ in the figure) that is significantly below or above the pre-defined pixel difference threshold is removed. Matches that are not removed using these constraints are then passed forward to the ego-motion estimation module.
III-B Ego-motion Estimation
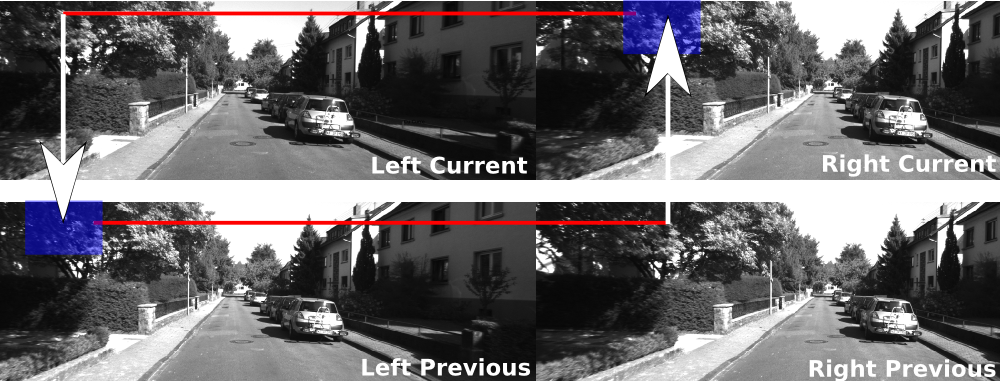
In order to perform ego-motion estimation, a variation of the method utilized by StereoScan [16] has been implemented. As in the StereoScan algorithm, features which are to be utilized in the ego-motion estimation step need to be ‘circularly’ matched between the left and right current images at time , as well as between the left and right images from the previous timestep . Our procedure is performed as seen in Figure 4. First, FREAK descriptors are matched between the current left and right stereo images. A single descriptor match, (the descriptor in the left image) and (the corresponding descriptor match in the right image), in Figure 4 is used as an example. The descriptor in the current left image is then matched to the best matching descriptor in the previous left image within a pre-defined window indicated by the large square. Once is found, the corresponding descriptor match in the previous right image is available as this has been computed in the previous step. A match between the previous right image descriptor and the best current right image descriptor is then computed within a pre-defined window. If matches , then a circular match is found. All circular matches are then utilized to perform ego-motion estimation.
StereoScan utilizes the epipolar constraint to efficiently match descriptors between the left and right images [16]. Our variation does not require the epipolar constraint to match features between images as feature descriptors have already been matched between images using the FREAK algorithm and therefore are instantly available.
The circular matches are then utilized to minimize the sum of reprojection errors using Gauss-Newton Optimization as performed in [16]. RANSAC is then performed times to ensure that the rotation matrix and translation vector are accurately estimated.
IV Experiments and Results
This algorithm has been tested on the KITTI dataset [17] and Tsukuba Dataset [19, 20]. KITTI is arguably the best available benchmark dataset for Visual Odometry. The dataset is comprised of images taken from a stereo mount placed on a car driving around Karlsruhe, Germany. The CFORB algorithm achieved very competitive results being ranked among the top VO algorithms on this dataset 111KITTI Visual Odometry Rankings:
http://www.cvlibs.net/datasets/kitti/eval_odometry.php. On the Tsukuba dataset, CFORB achieved a competitive, average translational accuracy of . CFORB has been tested on an core, desktop.
V KITTI Performance
After running CFORB on the entire KITTI dataset, the algorithm achieved an average translation accuracy of and a rotational error of . The average run-time of the algorithm is without optimization222The current code run-time can be improved upon by at least an order of magnitude. We also decided to analyze the performance of CFORB on a highly textured subset of the KITTI dataset. The length of this subset sequence is approximately long. This specific sequence produced significantly better results than the overall average performance obtained from running the algorithm on the entire dataset. The reason for this performance improvement is discussed in the section to follow.
V-A Performance as a Function of Length
We ran CFORB on the highly textured subset sequence from the KITTI dataset. CFORB generated the dashed line trajectory shown in Figure 5. The average translation error as a function of length is as has been calculated from Figure 6. The average rotational error is and has been calculated from Figure 8.


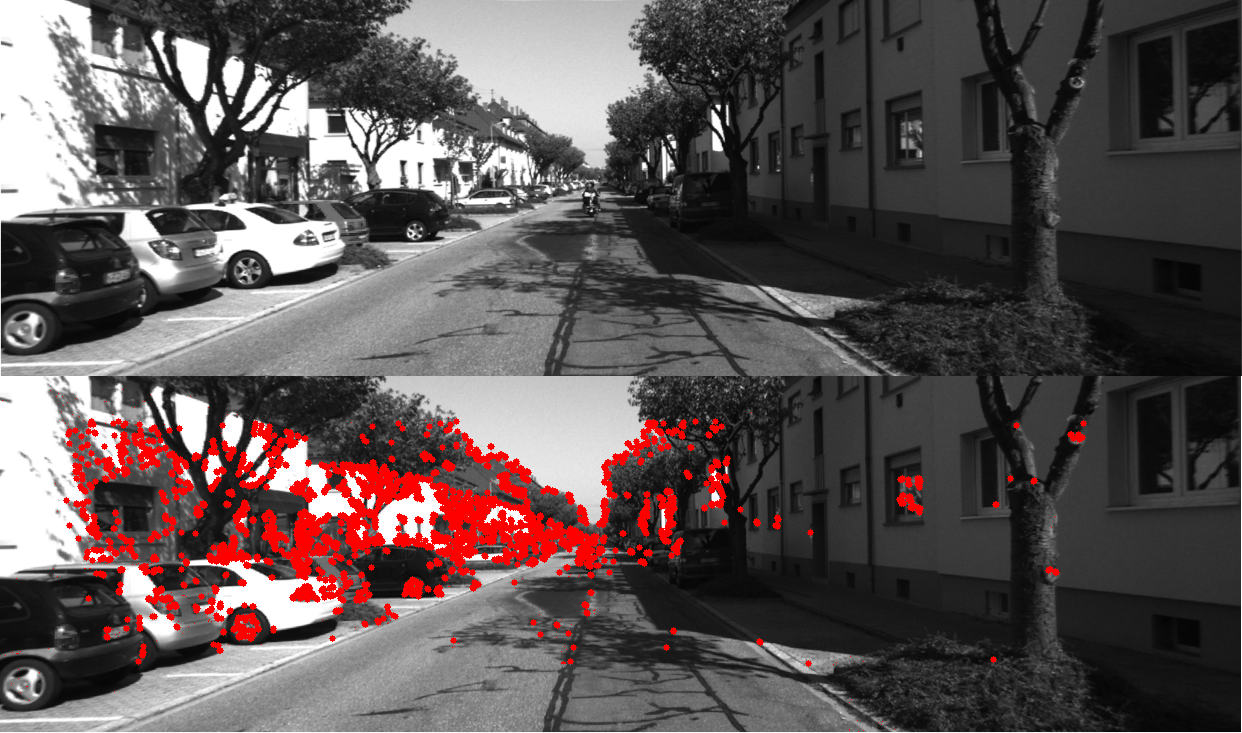
These results are significantly better than the average CFORB performance for a number of reasons. Firstly, if the dataset was generated in a highly textured environment, better performance is obtained as more unique and repeatable interest points are detected. This dataset is indeed highly textured and an example image with detected ORB features (indicated by red dots) can be seen in Figure 7. Many of the detected features corresponds to unique objects such as cars, the motorcycle in the center of the road and houses which are both unique and consistent in subsequent images.
In addition, if the detected features are uniformly spread around the image, then a better estimation of the ego-motion can be obtained [16]. It is therefore possible to detect features with a uniform spread across the image using techniques such as feature bucketing.
V-B Performance as a Function of Speed
The performance of CFORB on the above-mentioned KITTI sequence has also been tabulated as a function of the speed at which the stereo-rig is travelling. The average translation error as a function of speed is , calculated from Figure 9, and the average rotational error is , calculated from Figure 10. As seen in Figure 9, CFORB is robust to changes in speed as the average translational error is consistently between regardless of the speed at which the stereo-rig is travelling. The performance degrades slightly at higher speeds. This may be due to the fact that less repeatable features are detected at high speeds due to factors such as motion blur. The rotational error is consistent at speeds greater than . At lower speeds, the car tends to turn corners more frequently resulting in larger changes in orientation. At higher speeds the car does not drastically change its orientation resulting in better rotation estimates.


V-C Tsukuba Performance
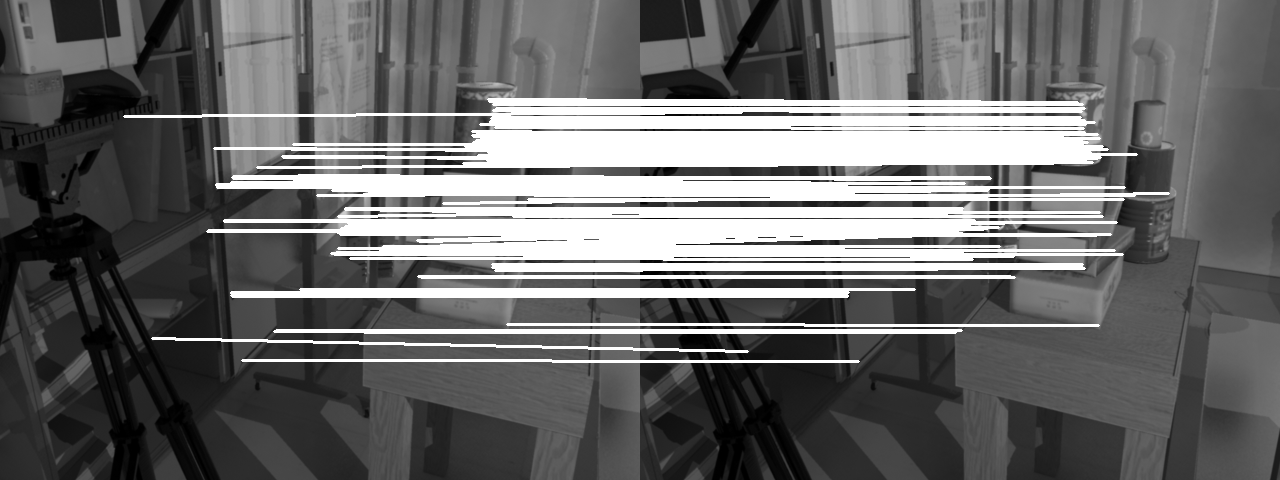
As mentioned in Section I, indoor localization is crucial in many applications ranging from inventory management to robotic tour guides. We therefore decided to test the algorithm on an indoor dataset in order to verify the robustness of the algorithm to these types of environments. The algorithmic performance on the Tsukuba dataset achieved a competitive average translation accuracy of . This is comparable to outdoor datasets as the average translational accuracy on the entire KITTI dataset is . The path trajectory compared to the ground truth is shown in Figure 11. This is highly accurate and indicates that the algorithm is indeed suitable for use in indoor environments. In addition, this algorithm is robust to camera movements over uneven terrain. An example of this is seen in Figure 11 where matches between a stereo image pair from the Tsukuba dataset are shown. The stereo-rig moves unevenly through the environment and still manages to detect and match features between the images.

VI Discussion
We have presented the novel Circular FREAK-ORB (CFORB) Visual Odometry (VO) algorithm. This algorithm detects features using the ORB algorithm and computes FREAK descriptors. This algorithm is invariant to both rotation and scale. Invalid matches are removed using the vertical and horizontal geometric constraints which have not previously been utilized in a VO algorithm. CFORB also implements a variation of circular matching [16] which removes the need to match features between images using the epipolar constraint. This algorithm exhibits competitive performance on the KITTI dataset achieving an average translational accuracy of and an average rotational accuracy of . It is among the top algorithms on the KITTI VO rankings. We tested the algorithm in a highly textured environment with an approximately uniform feature spread across the images and achieved an average translation error of and an average rotational error of . In addition, this algorithm is suitable for indoor applications achieving an average translational error on the Tsukuba dataset of . The algorithm is also robust to uneven terrain as shown in Section V-C.
References
- [1] C. McCarthy, and N. Bames, (2004, April). Performance of optical flow techniques for indoor navigation with a mobile robot. In Robotics and Automation, 2004. Proceedings. ICRA’04. 2004 IEEE International Conference on (Vol. 5, pp. 5093-5098). IEEE.
- [2] M. Achtelik, A. Bachrach, R. He, S. Prentice, and N. Roy, (2009, May). Stereo vision and laser odometry for autonomous helicopters in GPS-denied indoor environments. In SPIE Defense, Security, and Sensing (pp. 733219-733219). International Society for Optics and Photonics.
- [3] H. Badino, A. Yamamoto, and T. Kanade, (2013, December). Visual odometry by multi-frame feature integration. In Computer Vision Workshops (ICCVW), 2013 IEEE International Conference on (pp. 222-229). IEEE.
- [4] G. Sibley, L. Matthies, and G. Sukhatme, (2010). Sliding window filter with application to planetary landing. Journal of Field Robotics, 27(5), 587-608.
- [5] M. Maimone, and L. Matthies, (2005). Visual Odometry on the Mars Exploration Rovers. 2005 IEEE International Conference on Systems, Man and Cybernetics, 1, 903-910.
- [6] M. Maimone, Y. Cheng, and L. Matthies, (2007). Two years of Visual Odometry on the Mars Exploration Rovers. Journal of Field Robotics, 24(3), 169-186.
- [7] S. Weiss, D. Scaramuzza, and R. Siegwart, (2011). Monocular SLAM-based navigation for autonomous micro helicopters in GPS-denied environments. Journal of Field Robotics, (1).
- [8] M. Dunbabin, and J. Roberts, (2005). A hybrid AUV design for shallow water reef navigation., 2005. ICRA, (April), 5-10.
- [9] Z. Zhang, (1998). Determining the epipolar geometry and its uncertainty: A review. International journal of computer vision, 27(2), 161-195.
- [10] C. Loop, and Z. Zhang, (1999). Computing rectifying homographies for stereo vision. In Computer Vision and Pattern Recognition, 1999. IEEE Computer Society Conference on. (Vol. 1).
- [11] S. Leutenegger, M. Chli and R. Siegwart, BRISK: Binary robust invariant scalable keypoints.: In Proc. International Conference on Computer Vision (ICCV) pp. 2548-2555. IEEE (2011)
- [12] E. Rublee, V. Rabaud, K. Konolige, and G. Bradski, ORB: an efficient alternative to SIFT or SURF: In Proc. International Conference on Computer Vision (ICCV) pp. 2564-2571. IEEE (2011)
- [13] D.J. Mankowitz, S. Ramamoorthy, BRISK-based Visual Feature Extraction Using Resource Constrained Robots. In Proc. RoboCup International Symposium. Springer. (2013)
- [14] A. Alahi, R. Ortiz, and P. Vandergheynst, (2012, June). Freak: Fast retina keypoint. In Computer Vision and Pattern Recognition (CVPR), 2012 IEEE Conference on (pp. 510-517). Ieee.
- [15] H. Badino, D. Huber, and T. Kanade (2012). Real-time topometric localization. 2012 IEEE International Conference on Robotics and Automation, (Icra), 1635-1642.
- [16] A. Geiger, J. Ziegler, and C. Stiller, (2011). StereoScan: Dense 3d reconstruction in real-time. 2011 IEEE Intelligent Vehicles Symposium (IV), (Iv), 963-968.
- [17] A. Geiger, P. Lenz, C. Stiller, and R. Urtasun, (2013) The KITTI Vision Benchmark Dataset, http://www.cvlibs.net/datasets/kitti/eval_odometry.php
- [18] D. Scaramuzza, F. Fraundorfer, and R. Siegwart, (2009). Real-time monocular visual odometry for on-road vehicles with 1-point RANSAC. 2009 IEEE International Conference on Robotics and Automation, 4293-4299.
- [19] M. P. Martorell, A. Maki, S. Martull, Y. Ohkawa, and K. Fukui, ”Towards a Simulation Driven Stereo Vision System”. ICPR2012, pp.1038-1042, 2012.
- [20] S. Martull, M. P. Martorell, and K. Fukui, ”Realistic CG Stereo Image Dataset with Ground Truth Disparity Maps”, ICPR2012 workshop TrakMark2012, pp.40-42, 2012.