Visualization of superparamagnetic dynamics in magnetic topological insulators
Quantized Hall conductance is a generic feature of two dimensional electronic systems with broken time reversal symmetry. In the quantum anomalous Hall state recently discovered in magnetic topological insulators, time reversal symmetry is believed to be broken by long-range ferromagnetic order, with quantized resistance observed even at zero external magnetic field. Here, we use scanning nanoSQUID magnetic imaging to provide a direct visualization of the dynamics of the quantum phase transition between the two anomalous Hall plateaus in a Cr-doped (Bi,Sb)2Te3 thin film. Contrary to naive expectations based upon macroscopic magnetometry, our measurements reveal a superparamagnetic state formed by weakly interacting magnetic domains with a characteristic size of few tens of nanometers. The magnetic phase transition occurs through random reversals of these local moments, which drive the electronic Hall plateau transition. Surprisingly, we find that the electronic system can in turn drive the dynamics of the magnetic system, revealing a subtle interplay between the two coupled quantum phase transitions.
The integer quantum Hall effect (QHE), first observed in clean two dimensional electron systems at high magnetic fields (?), is the paradigmatic example of a topological phase: different integer quantum Hall states are characterized by identical symmetries but different integer topological quantum numbers , with the quantized Hall resistance given by (?). However, Hall quantization may occur also in the absence of an external field as long as time-reversal symmetry (TRS) is broken (?). This quantum anomalous Hall (QAH) state was recently realized experimentally (?, ?, ?, ?, ?, ?) following theoretical proposals based on combining strong spin-orbit coupling with long-range ferromagnetic (FM) order in magnetically doped topological insulators (TI) (?, ?, ?, ?, ?, ?, ?, ?, ?). The QH plateau transition represents the canonical example of a topological phase transition, described by the divergence of the localization length and a universal critical scaling of transport coefficients (?). Recent theoretical calculations show that under certain assumptions, the QAH plateau transition can be mapped onto the same network model used to describe the integer QH plateau transition, leading to the same scaling laws (?).
While the electronic topological transition in QH and QAH systems, taken in isolation, can be viewed as identical, the two experimental systems differ in several key aspects. The QH plateau transition is a purely electronic effect, in which delocalization occurs against a background of quenched electronic disorder. In contrast, the QAH plateau transition results from two coupled quantum phase transitions: the field-driven magnetic transition of the FM order and the electronic transition that is driven by TRS breaking of the FM transition. The dynamics of the FM reversal can endow the QAH electronic transition with features that do not have an analog in QHE systems. Exactly at the transition, both systems can be understood as a network of domain walls—magnetic domain walls for the QAH, and domain walls of different filling factor in the QHE—that host counterpropagating chiral edge states. Crucially, however, in contrast to the QH plateau transition, which describes the phase diagram of the system in thermodynamic equilibrium, the FM domain structure in the QAH is metastable leading to hysteresis and relaxation dynamics that can directly affect the electronic system. Moreover, the energy scale of the electronic delocalization transition and its critical scaling may depend on the details of the microscopic FM structure and on the scaling of the magnetic phase transition. Finally, the electronic system, which commonly mediates FM interactions in dilute magnetic systems, can in turn modify the phase transition of the magnetic system. Most previous studies of QAH systems have used electronic transport measurements to probe the combined effect of magnetic and electronic evolutions, making it difficult to disentangle the individual roles of the two phase transitions. Exploring the reciprocal coupling of the magnetic and electronic quantum phase transitions thus requires selective measurement tools that can address the two systems independently.
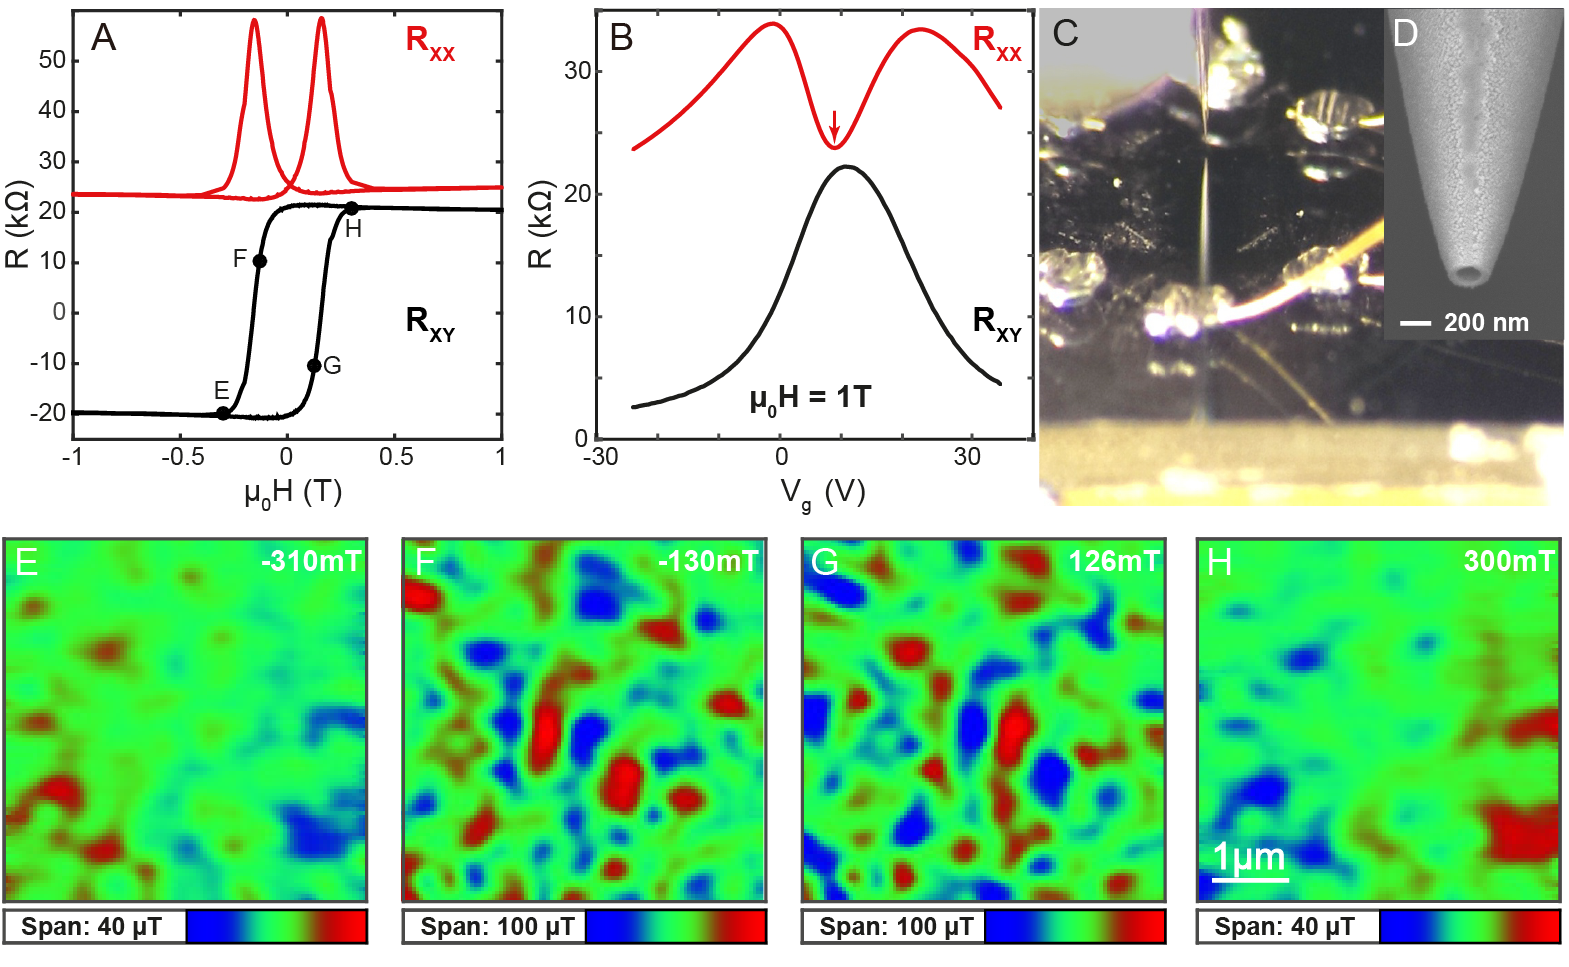
Here we combine electronic transport with a scanning superconducting quantum interference device (SQUID) of 200 nm diameter that resides on the apex of a quartz tip (SQUID-on-Tip (SOT)) (?, ?) to simultaneously probe the magnetic and electronic transitions at 3He temperatures in a 7 quintuple layer (QL) thick Cr0.1(Bi0.5Sb0.5)1.9Te3 film grown by molecular beam epitaxy on a SrTiO3 substrate (Fig. 1). The large dielectric constant of the substrate allows effective control of the chemical potential through back gating. The hysteretic transition between two Hall resistance () plateaus occurs at a coercive field of mT at 250 mK (Fig. 1A). At elevated fields, the longitudinal resistance () shows a pronounced dip as a function of the back gate voltage at V due to an incipient QAH state (Fig. 1B). At the lowest measurement temperature (250 mK) used here, the sample we discuss does not yet show the fully developed QAH. This is similar to previous experiments on Cr-doped topological insulator films (?, ?, ?, ?, ?, ?) where quantized Hall resistance appears only at dilution refrigerator temperatures, far below the onset temperature of hysteretic magnetic behavior (?, ?). Figures 1E-H show images of the local distribution of the magnetic field in the sample at various points along the magnetization loop. We find to be highly inhomogeneous at all fields, with peak contrast at , where the average magnetization vanishes (Figs. 1F,G). Surprisingly, submicron structure is evident even at fields corresponding to saturation of transport coefficients (Figs. 1E,H). Images corresponding to opposite magnetization are highly anticorrelated on microscopic scales—including at full saturation. This suggests an inhomogeneous distribution of magnetic moments due to segregation of the Cr dopants. While high resolution transmission electron microscopy measurements on our samples have yet to show any obvious evidence of Cr clustering (see Fig. S11), we cannot preclude inhomogeneity at the nanoscale, akin to that found in other magnetically doped semiconductors such as Cr-doped ZnTe (?). Clear evidence of phase separation has only been seen in Cr doped Bi2Se3 thin film (?) samples that do not show the QAH state, while large nanoscale fluctuations in the local Cr density have been observed in Te based samples (?) due to random doping that introduces strong disorder in the material (?).
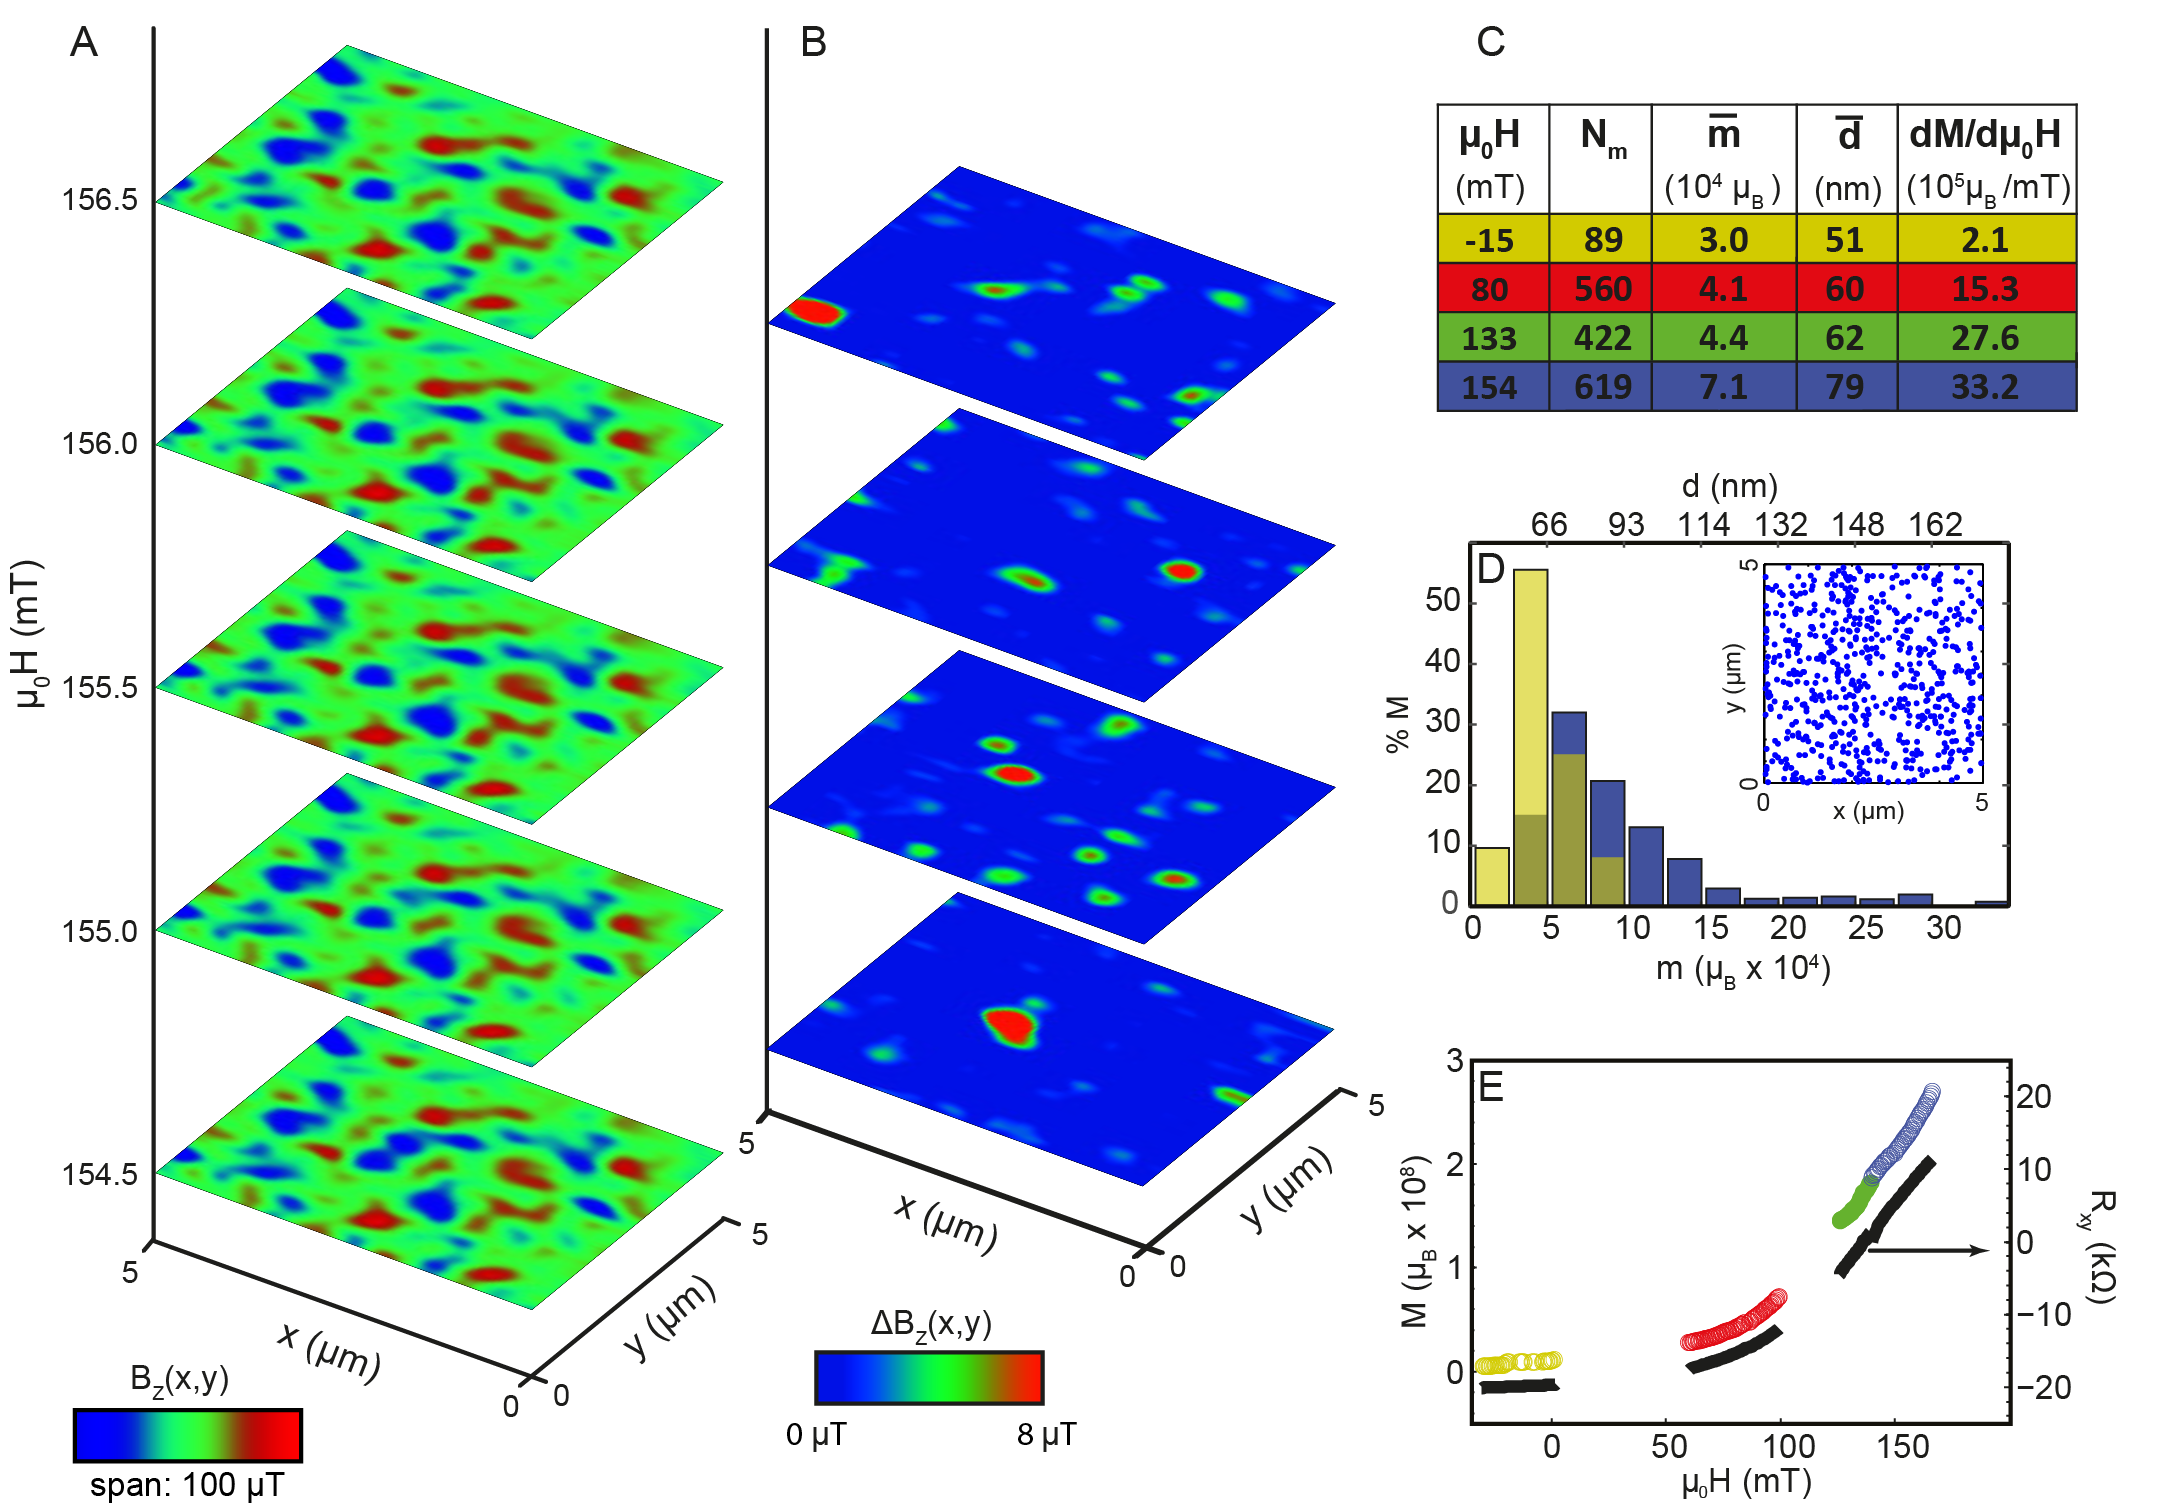
In metallic FM thin films with out-of-plane magnetization, it is well established that magnetization reversal develops via the nucleation and propagation of domain walls (DWs) separating regions of opposite magnetization. Such DW mediated magnetization reversal has also been imaged in ferromagnetic semiconductor films (?, ?) at magnetic dopant concentrations comparable to those in our magnetic TI films. However, scanning SOT microscopy reveals a very different picture of the magnetization reversal process in magnetic TIs. Figure 2A shows a sequence of images acquired for increasing values of near . The five images appear almost identical; however, numerical subtraction of successive image data (, see Fig. 2B) reveals the underlying dynamic process. Instead of the anticipated DW motion, magnetization reversal occurs through a series of random events in which isolated nanoscale islands undergo a reversal of their out-of-plane magnetic moment (see Movie S1). As we discuss below, this constitutes a direct microscopic observation of superparamagnetism in magnetically doped TI films. Our observations caution against drawing conclusions about the ferromagnetic state solely from macroscopic magnetization probes (SQUID magnetometry, magneto-optical Kerr effect) which show square hysteresis loops with robust zero field remanence (?).
To quantify the superparamagnetic dynamics across the Hall plateau transition, we fit each of the local features in the maps with a point-like out-of-plane magnetic moment (Fig. S3). Figure 2C summarizes 1700 such fits, accumulated over four different ranges of magnetic field. Throughout the measured range, the spatial distribution of reversal events is random (Fig. 2D inset and Fig. S4), suggesting weak interactions between neighboring islands and supporting the conclusion that superparamagnetism in Cr-doped BiSbTe films is characterized by aggregations of dopant atoms. The deviation of the Hall resistance from its saturation value begins around and is accompanied by the reversal of nanoscale moments with average (Figs. 2C,D). Given an average saturation magnetization of atom as obtained from global magnetization measurements (Fig. S14), the estimated average diameter of these flipping islands is nm for our 7 nm thick film, considerably below our spatial resolution of 300 nm. As the field is increased towards , however, a pronounced change in the moment distribution is observed with a shift to higher values and appearance of a long tail of large moments with 10 (Figs. 2C,D). The microscopic reversal moments can be summed to obtain the net change in magnetization over a continuous field range (Fig. 2E). Comparison with simultaneously acquired shows a qualitative match, implying that the behavior of the transport coefficients through the plateau transition is mainly determined by the underlying change in magnetization. Superparamagnetic behavior and a similar relationship between measured magnetization and transport coefficients were found in a second sample as well as in a Mn-doped Bi2Te3 film (see Movie S2 and Figs. S2, S12-13 and S15).
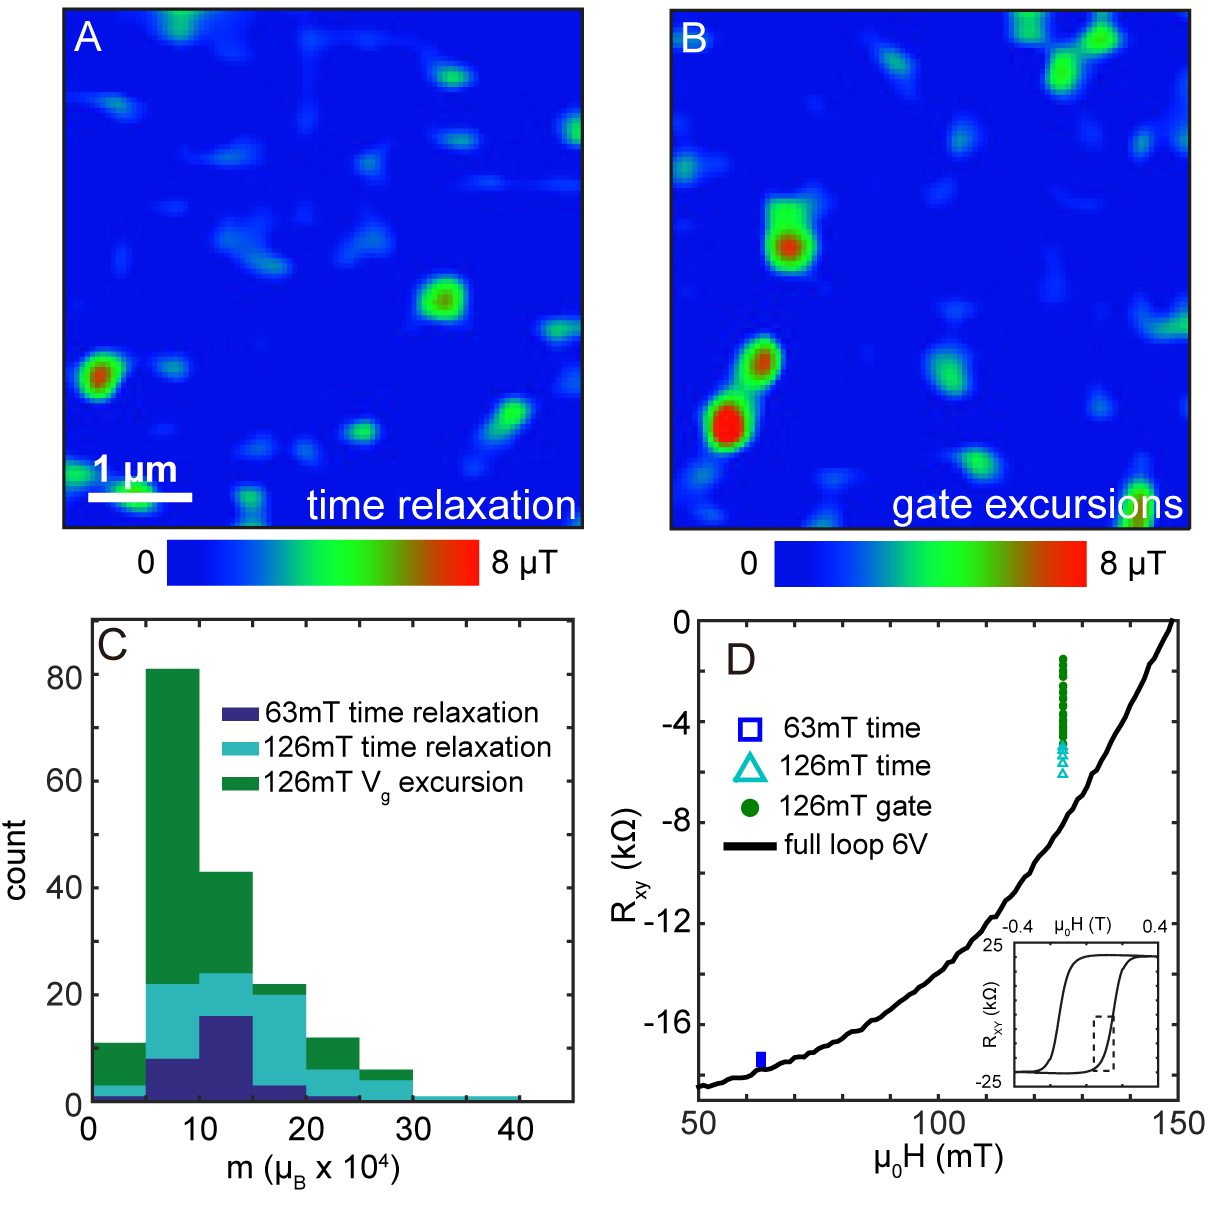
Hysteretic magnetic transitions are a signature of metastability, and typically display temporal relaxation via thermal activation or quantum tunneling. We probe magnetic relaxation in real time by polarizing the system at T and then ramping the field to a positive set point . We then acquire repeated images of while simultaneously monitoring electronic transport. No relaxation is observed on laboratory time scales for in either magnetization or transport coefficients. Spontaneous relaxation begins to be evident at small positive fields ( mT), manifesting as magnetic reversal events and a slow upward drift of . The frequency and number of these reversals increases significantly near the coercive field at mT (Figs. 3A,C).
The temporal relaxation measurements further corroborate the superparamagnetic behavior: at temperatures well below the blocking temperature, the magnetization of a superparamagnet is hysteretic, showing minimal relaxation at low fields. On approaching the magnetic anisotropy barrier is reduced, leading to relaxation when . Since is proportional to the volume of the superparamagnetic particles, smaller islands undergo thermal activation at a lower field. Simultaneous transport measurements (Fig. 3D) indicate that the electronic transition closely tracks the magnetic relaxation, with transport coefficient relaxation evident at mT and pronounced at 126 mT, in accord with the total temporal change in magnetization extracted from the SOT data (Fig. 3C).
The plateau transition observed in electronic transport appears to be mainly dictated by the underlying magnetic reversal. Surprisingly, however, we find that the dynamics of the magnetic system can in turn be influenced by the electronic system. To explore this effect, we perform a sequence of magnetic imaging at 126 mT interspersing consecutive scans with small excursions of the back gate voltage (Fig. 3B). Remarkably, even small V excursions enhance the relaxation of the superparamagnetic islands significantly, as is evident from the statistics of the observed moment reversals (Fig. 3C). This enhancement in turn is evident in the transport coefficients, as shown in Fig. 3D.
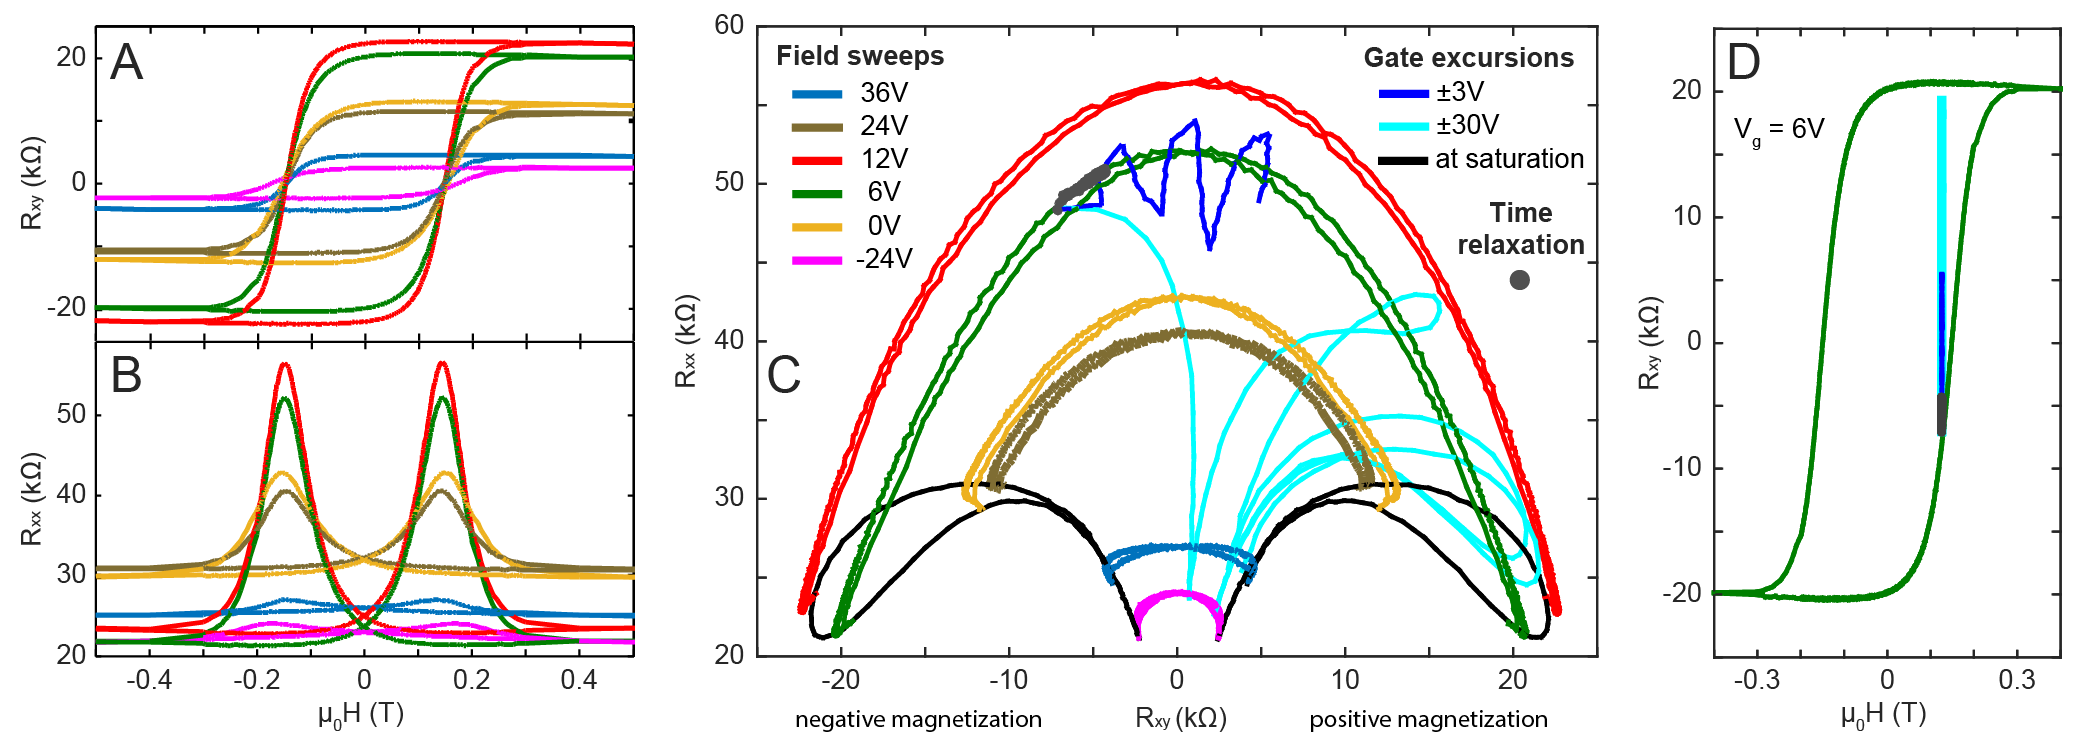
A full comparison of the effects of applied magnetic field, gate voltage, and time on transport coefficients is presented in Fig. 4C, which shows a unified parametric plot of the transport coefficient vector (, ). On this plot, the large magnetic hysteresis evident in Figs. 4A,B is absent, demonstrating that the relation between and (at a given ) is a universal function determined by the magnetization. Within a single constant- arc-shaped plot, zero net magnetization corresponds to the maximum of the arc at zero Hall angle, while the varying Hall angle along the arc reflects the varying sample magnetization. Variable traces over V at T, marked in black, show contours of variable carrier density at constant saturated magnetization. Note that at full saturation, variable data retraces the same path upon repetition.
On this plot, the temporal relaxation of transport coefficients (Fig. S8) is seen to track constant arcs, implying that temporal magnetic relaxation is the dominant mechanism and consistent with the scanning magnetometry results (Figs. 4C,D, gray dots along V arc). Again consistent with magnetometry data, excursions enhance the magnetization relaxation dramatically in the metastable regime (Figs. 4 C,D). The blue trace shows the evolution of the transport coefficients during three excursions with increasing from V to V at a constant field of 126 mT. Successive sweeps do not retrace each other, consistent with an irreversible change in the net magnetization. Repeating the same experiment for larger excursion of V, the magnetization is observed to rapidly relax, nearly reaching complete saturation (cyan in Figs. 4C,D). As Fig. 4C makes clear, the gate-induced magnetic relaxation is strongly dependent on maximum extent of the voltage excursion, although we find it to be independent of sweep direction and rate.
Strikingly, despite the dramatic effect of gate voltage variations on magnetic relaxation, field sweeps at different values of show only small deviations in the coercive field (Figs. 4A,B) indicating that carrier density has little effect on the average magnetization. These seemingly contradictory observations can be qualitatively understood by invoking the strongly disordered nature of the superparamagnetic state. In our strongly disordered system, the global gap in the density of states is bridged by a proliferation of subgap states induced by the random polarization of the superparamagnetic islands. These localized states can in turn mediate the FM, in addition to the proposed global van Vleck mechanism that arises from band states (?). excursions may modify the magnetic anisotropy energy of individual islands through the strong dependence of local density of states on position and energy, randomly changing the magnetic potential landscape without significantly changing the average magnetization and coercive field. Unlike in QHE systems, however, this disorder is not quenched: the weakly interacting superparamagnetic islands are metastable. At any positive field, some local configurations are separated from the ground state by small energy barriers , and any local perturbation can cause irreversible flipping of some of the islands leading to rapid stimulated relaxation upon repeated excursions of . This mechanism is of course enhanced near . Our statistical analysis of the flipping moments at various in Fig. S5 qualitatively supports this mechanism.
The observed superparamagnetic state and its rich dynamics emphasize the intricate coupling between the electronic and magnetic sub-systems in magnetic TIs. Our results suggest that the quantum phase transition between QAH states can be strongly affected by the nature of the underlying magnetic transition leading to deviations from the expected universal scaling of the plateau transition as indicated by recent transport studies (?). Even though the topological state is robust to the presence of magnetic disorder at very low temperatures, nanoscale superparamagnetism may be responsible for the fragility of the QAH state at elevated temperatures.
References
- 1. K. v. Klitzing, G. Dorda, and M. Pepper, “New method for high-accuracy determination of the fine-structure constant based on quantized hall resistance,” Phys. Rev. Lett., vol. 45, pp. 494–497, Aug. 1980.
- 2. D. J. Thouless, M. Kohmoto, M. P. Nightingale, and M. den Nijs, “Quantized Hall conductance in a two-dimensional periodic potential,” Phys. Rev. Lett., vol. 49, p. 405, Aug. 1982.
- 3. F. D. M. Haldane, “Model for a quantum hall effect without landau levels: Condensed-matter realization of the ”parity anomaly”,” Phys. Rev. Lett., vol. 61, pp. 2015–2018, Oct. 1988.
- 4. C.-Z. Chang, J. Zhang, X. Feng, J. Shen, Z. Zhang, M. Guo, K. Li, Y. Ou, P. Wei, L.-L. Wang, Z.-Q. Ji, Y. Feng, S. Ji, X. Chen, J. Jia, X. Dai, Z. Fang, S.-C. Zhang, K. He, Y. Wang, L. Lu, X.-C. Ma, and Q.-K. Xue, “Experimental observation of the quantum anomalous hall effect in a magnetic topological insulator,” Science, vol. 340, no. 6129, pp. 167–170, 2013.
- 5. J. G. Checkelsky, R. Yoshimi, A. Tsukazaki, K. S. Takahashi, Y. Kozuka, J. Falson, M. Kawasaki, and Y. Tokura, “Trajectory of the anomalous hall effect towards the quantized state in a ferromagnetic topological insulator,” Nature Physics, vol. 10, pp. 731–736, Oct. 2014.
- 6. X. Kou, S.-T. Guo, Y. Fan, L. Pan, M. Lang, Y. Jiang, Q. Shao, T. Nie, K. Murata, J. Tang, Y. Wang, L. He, T.-K. Lee, W.-L. Lee, and K. L. Wang, “Scale-invariant quantum anomalous Hall effect in magnetic topological insulators beyond the two-dimensional limit,” Phys. Rev. Lett., vol. 113, p. 137201, Sep 2014.
- 7. J. Bestwick, A. J. Fox, E. X. Kou, L. Pan, K. L. Wang, and D. Goldhaber-Gordon, “Precise quantization of the anomalous hall effect near zero magnetic field,” Phys. Rev. Lett., vol. 114, p. 187201, May 2015.
- 8. C.-Z. Chang, W. Zhao, D. Y. Kim, H. Zhang, B. A. Assaf, D. Heiman, S.-C. Zhang, C. Liu, M. H. W. Chan, and J. S. Moodera, “High-precision realization of robust quantum anomalous hall state in a hard ferromagnetic topological insulator,” Nature Materials, vol. 14, pp. 473–477, 2015.
- 9. A. Kandala, A. Richardella, S. Kempinger, C. Liu, and N. Samarth, “Giant anisotropic magnetoresistance in a quantum anomalous hall insulator,” arXiv 1503.03556, 2015.
- 10. M. Z. Hasan and C. L. Kane, “Colloquium: Topological insulators,” Rev. Mod. Phys, vol. 82, no. 4, pp. 3045–3067, 2010.
- 11. X.-L. Qi and S.-C. Zhang, “Topological insulators and superconductors,” Rev. Mod. Phys., vol. 83, pp. 1057–1110, Oct. 2011.
- 12. M. Onoda and N. Nagaosa, “Quantized anomalous hall effect in two-dimensional ferromagnets: Quantum hall effect in metals,” Phys. Rev. Lett., vol. 90, p. 206601, May 2003.
- 13. C. Liu, T. L. Hughes, X.-L. Qi, K. Wang, and S.-C. Zhang, “Quantum spin hall effect in inverted type-ii semiconductors,” Phys. Rev. Lett., vol. 100, pp. 236601–, June 2008.
- 14. Z. Qiao, S. A. Yang, W. Feng, W.-K. Tse, J. Ding, Y. Yao, J. Wang, and Q. Niu, “Quantum anomalous hall effect in graphene from rashba and exchange effects,” Phys. Rev. B, vol. 82, p. 161414, Oct 2010.
- 15. R. Yu, W. Zhang, H.-J. Zhang, S.-C. Zhang, X. Dai, and Z. Fang, “Quantized anomalous hall effect in magnetic topological insulators,” Science, vol. 329, no. 5987, pp. 61–64, 2010.
- 16. M. Ezawa, “Valley-polarized metals and quantum anomalous hall effect in silicene,” Phys. Rev. Lett., vol. 109, p. 055502, Aug 2012.
- 17. K. F. Garrity and D. Vanderbilt, “Chern insulators from heavy atoms on magnetic substrates,” Phys. Rev. Lett., vol. 110, p. 116802, Mar 2013.
- 18. G. Xu, J. Wang, C. Felser, X.-L. Qi, and S.-C. Zhang, “Quantum anomalous hall effect in magnetic insulator heterostructure,” Nano Lett., vol. 15, p. 2019, Feb. 2015.
- 19. B. Huckestein, “Scaling theory of the integer quantum hall effect,” Rev. Mod. Phys., vol. 67, pp. 357–396, Apr 1995.
- 20. J. Wang, B. Lian, and S.-C. Zhang, “Universal scaling of the quantum anomalous hall plateau transition,” Phys. Rev. B, vol. 89, p. 085106, Feb 2014.
- 21. A. Finkler, Y. Segev, Y. Myasoedov, M. L. Rappaport, L. Ne’eman, D. Vasyukov, E. Zeldov, M. E. Huber, J. Martin, and A. Yacoby, “Self-aligned nanoscale squid on a tip,” Nano Lett., vol. 10, pp. 1046–1049, Mar. 2010.
- 22. D. Vasyukov, Y. Anahory, L. Embon, D. Halbertal, J. Cuppens, L. Neeman, A. Finkler, Y. Segev, Y. Myasoedov, M. L. Rappaport, M. E. Huber, and E. Zeldov, “A scanning superconducting quantum interference device with single electron spin sensitivity,” Nature Nanotechnology, vol. 8, pp. 639–644, Sept. 2013.
- 23. C.-Z. Chang, J. Zhang, M. Liu, Z. Zhang, X. Feng, K. Li, L.-L. Wang, X. Chen, X. Dai, Z. Fang, X.-L. Qi, S.-C. Zhang, Y. Wang, K. He, X.-C. Ma, and Q.-K. Xue, “Thin films of magnetically doped topological insulator with carrier-independent long-range ferromagnetic order,” Advanced Materials, vol. 25, no. 7, pp. 1065–1070, 2013.
- 24. S. Kuroda, N. Nishizawa, K. Takita, M. Mitome, Y. Bando, K. Osuch, and T. Dietl, “Origin and control of high-temperature ferromagnetism in semiconductors,” Nature Materials, vol. 6, pp. 440–446, 2007.
- 25. C.-Z. Chang, P. Tang, Y.-L. Wang, X. Feng, K. Li, Z. Zhang, Y. Wang, L.-L. Wang, X. Chen, C. Liu, W. Duan, K. He, X.-C. Ma, and Q.-K. Xue, “Chemical-potential-dependent gap opening at the dirac surface states of induced by aggregated substitutional cr atoms,” Phys. Rev. Lett., vol. 112, p. 056801, Feb 2014.
- 26. I. Lee, C. K. Kim, J. Lee, S. J. L. Billinge, R. Zhong, J. A. Schneeloch, T. Liu, T. Valla, J. M. Tranquada, G. Gu, and J. C. S. Davis, “Imaging dirac-mass disorder from magnetic dopant atoms in the ferromagnetic topological insulator crx(bi0.1sb0.9)2-xte3,” PNAS, vol. 112, no. 5, pp. 1316–1321, 2015.
- 27. H. Beidenkopf, P. Roushan, J. Seo, L. Gorman, I. Drozdov, Y. S. Hor, R. J. Cava, and A. Yazdani, “Spatial fluctuations of helical Dirac fermions on the surface of topological insulators,” Nature Physics, vol. 7, pp. 939–943, Oct. 2011.
- 28. M. Yamanouchi, J. Ieda, F. Matsukura, S. E. Barnes, S. Maekawa, and H. Ohno, “Universality classes for domain wall motion in the ferromagnetic semiconductor (ga,mn)as,” Science, vol. 317, pp. 1726–1729, 2007.
- 29. A. L. Balk, M. E. Nowakowski, M. J. Wilson, D. W. Rench, P. Schiffer, D. D. Awschalom, and N. Samarth, “Measurements of nanoscale domain wall flexing in a ferromagnetic thin film,” Phys. Rev. Lett., vol. 107, p. 077205, 2011.
- 30. X. Kou, L. He, M. Lang, Y. Fan, K. Wong, Y. Jiang, T. Nie, W. Jiang, P. Upadhyaya, Z. Xing, Y. Wang, F. Xiu, R. N. Schwartz, and K. L. Wang, “Manipulating surface-related ferromagnetism in modulation-doped topological insulators,” Nano Lett., vol. 13, pp. 4587–4593, 2013.
- 31. X. Kou, L. Pan, J. Wang, Y. Fan, E. S. Choi, W.-L. Lee, T. Nie, K. Murata, Q. Shao, S.-C. Zhang, and K. L. Wang, “Mapping the global phase diagram of quantum anomalous hall effect,” arXiv 1503.04150, 2015.
Acknowledgements
We thank E. Berg for illuminating discussions. This work was supported by the Minerva Foundation with funding from the Federal German Ministry of Education and Research and by the Israel Science Foundation (grant No 132/14). NS, AR, AK and SK acknowledge support from DARPA MESO (Grant No. N66001-11-1-4110), ONR (Grant No. N00014-12-1-0117) and ARO MURI (Grant No. W911NF-12-1-0461), as well as use of the NSF National Nanofabrication Users Network Facility at Penn State. AFY acknowledges the support of Goldschleger Center for Nanophysics.
Additional images and data obtained in the present work are presented in the supplementary materials.


