Precision multi-band photometry with a DSLR camera
Abstract
Ground-based exoplanet surveys such as SuperWASP, HATNet and KELT have discovered close to two hundred transiting extrasolar planets in the past several years. The strategy of these surveys is to look at a large field of view and measure the brightnesses of its bright stars to around half a percent per point precision, which is adequate for detecting hot Jupiters. Typically, these surveys use CCD detectors to achieve high precision photometry. These CCDs, however, are expensive relative to other consumer-grade optical imaging devices, such as digital single-lens reflex cameras (DSLRs).
We look at the possibility of using a digital single-lens reflex camera for precision photometry. Specifically, we used a Canon EOS 60D camera that records light in 3 colors simultaneously. The DSLR was integrated into the HATNet survey and collected observations for a month, after which photometry was extracted for 6600 stars in a selected stellar field.
We found that the DSLR achieves a best-case median absolute deviation (MAD) of 4.6 mmag per 180 s exposure when the DSLR color channels are combined, and 1000 stars are measured to better than 10 mmag (1%). Also, we achieve 10 mmag or better photometry in the individual colors. This is good enough to detect transiting hot Jupiters. We performed a candidate search on all stars and found four candidates, one of which is KELT-3b, the only known transiting hot Jupiter in our selected field. We conclude that the Canon 60D is a cheap, lightweight device capable of useful photometry in multiple colors.
Subject headings:
instrumentation: photometers — planetary systems — techniques: photometric1. Introduction
The last two decades have been very exciting for exoplanetary science. Since 1995, when 51 Pegasi b became the first planet discovered around a main-sequence star, over 1000 exoplanets have been discovered, and thousands of candidates are waiting to be confirmed.
So far, the two most common ways to detect exoplanets are the transit and radial velocity methods, respectively. The former looks for dips in a starlight due to planets passing in front of them. The latter uses spectroscopy to look for changes in the radial velocity of the star as it orbits around the barycenter of the planetary system. The most well-known project using the transit method is the Kepler Space Mission, which examined 100 square degrees of the sky, and measured the brightness of 150,000 stars to a precision high enough to detect Earth-size planets near the habitable-zones of Sun-like stars in the best cases. Most of the stars observed by Kepler are necessarily very faint, and therefore not easy targets for follow-up observations.
Ground-based transit searches have been operating before, during, and after Kepler, using the same principle, but not achieving the ultra-high-precision photometry possible from space. Their strategy is to take wide-field images of the night sky and measure the bright stars within using commercially available CCDs. With the exception of a few hot Neptunes, such as HAT-P-11b (Bakos et al., 2010), HAT-P-26b (Hartman et al., 2011) and HATS-8b (Hartman et al., 2015), this strategy is only precise enough to detect hot Jupiters. However, because the surveys monitor a large number of fields at multiple sites over many years, they routinely detect hot Jupiters around bright stars that are suitable for follow-up observations. Exames of ground-based transit searches include HATNet (Bakos et al., 2002, 2004), SuperWASP (Street & SuperWASP Consortium, 2004), KELT (Pepper et al., 2007), and HATSouth (Bakos et al., 2013), which have collectively discovered and characterized close to two hundred transiting exoplanets.
HATNet, in particular, was established in 2003, and consists of 6 fully automated observatories at two sites: Arizona and Hawaii. Each observatory has a 11 cm f/1.8 lens in front of a front-illuminated CCD, giving a field of view. Every night, the mini-observatories use a weather sensor to measure wind speed, humidity, cloud cover, precipitation, and nearby lightning strikes. If the weather is appropriate, the domes open and the telescopes use their CCDs to take images of designated fields for the entire night. HATNet now monitors more than 100,000 stars at better than 1% precision every year, for a lifetime total of close to 1 million such stars, and has discovered more than 50 transiting exoplanets.
The CCDs that HATNet and other surveys use typically cost at least 10,000 USD, which is a significant obstacle against the creation of new exoplanet surveys, or the expansion of existing ones. For this reason, we investigate the possibility of using a mid-range, commercial digital single-lens reflex (DSLR) camera for precision photometry. These devices have excellent electronic characteristics for their price, which is around 1000 USD, and are more affordable for the public. Furthermore, they have improved drastically over the past several years, and consumer demand continues to force manufacturers to produce better products.
Several authors have already tested the use of DSLRs for photometry. Hoot (2007) discusses the basic characteristics of DSLRs, then used a Canon EOS 350D to perform absolute photometry by transforming instrumental magnitudes to magnitudes in standard Landolt filters. They found RMS errors of 0.347, 0.134, and 0.236 mag for the B, V, and R bands respectively. Littlefield (2010) used the 12-bit Canon 20Da camera, and measured the transit of exoplanet HD 189733b, whose star is at V=7.67, to around 6 mmag accuracy. The author achieved this accuracy by using a high ISO setting and extreme defocusing, so that the star image was around 35 pixels in diameter. This defocusing improves photometry through reducing intra- and inter-pixel variations, but is not suitable for exoplanet surveys because of stellar crowding, and because when faint stars are defocused, photon noise from the sky background, read noise, and dark noise start to dominate.
Kloppenborg et al. (2012) took 500 DSLR images in groups of ten, 12-second exposures and measured the brightness of stars with to a mean uncertainty of 0.01 mag, and stars with to a mean uncertainty of 0.02 mag or better. They used a Canon 450D and defocused so that stellar images were 10-15 pixels in diameter, and used the Tycho catalogue to account for stellar blending in aperture photometry. Unfortunately, there are two aspects of this process that are not ideal for the purposes of a wide-field photometric survey. One of them is defocusing, mentioned earlier; the other is the 12-second exposure time. Our 60D has a mean shutter lifetime of 100,000 exposures (according to the Canon website), and at 12 seconds a frame, it would last on the order of two months before failing.
Finally, Guyon & Martinache (2012) used a Canon 550D and 500D to observe the star HD 54743 without defocusing, by recombining the 4 color channels into a single image, and choosing comparison stars with a similar PSF as that of the target. This step implicitly selects a comparison star with similar color, optical aberrations, and position on the Bayer filter. With regular aperture photometry, they achieved a precision of around 10%. With the PSF selection technique, they achieved 2% in the green channel, 2.5% in the red, and 3.5% in the blue, which is close to the photon noise limit. However, it must be noted that they observed a relatively faint star during bright time, and in this work they did not test the accuracy of their system during better observing conditions.
1.1. DSLR vs CCD
There are a number of advantages and disadvantages of using DSLRs instead of CCDs. The disadvantages are severe. DSLRs have lower quantum efficiency and a smaller full well capacity—both of which increase the Poisson noise of detected starlight, thus imposing a strict upper limit on the photometric precision. DSLRs are generally not cooled, and dark current increases dramatically with temperature. This increases the dark noise at high ambient temperatures and makes dark frames a less accurate reflection of the dark-current signature of image frames. Additionally, DSLRs have a Bayer filter superimposed on top of their sensors. This makes aperture photometry difficult because as the star moves across the image due to tracking or pointing errors, a varying fraction of its light falls onto a pixel of a given color. Thus, the brightness of a constant star appears to vary by as much as 13%, as indicated by Guyon & Martinache (2012). Finally, as we will show in this paper, cameras like the Canon EOS 60D perform post-processing on images even when writing in “RAW” format. There is no documentation of this post-processing, and frames exhibit a variety of disturbing behavior that we have no explanation for.
The primary advantage of a DSLR is its low cost. The Canon EOS 60D that we use is around 700 USD as of writing. By comparison, a CCD camera with a Kodak KAF16803 chip is 10,000 USD, and even a lower-end CCD is a few thousand dollars. Additionally, DSLRs require no external device for focusing; a DSLR setup is cheaper and more lightweight, making it more accessible for amateur astronomers. Finally, the Bayer filters of DSLRs allow for fully simultaneous photometry at three colors, which is very difficult for CCDs, though can be done through the use of expensive dichroic beam splitter systems (Greiner et al., 2008).
2. Hardware setup
2.1. Initial tests
We attached the Canon 60D camera to a Fornax F50 telescope mount on the roof of Peyton hall at Princeton University’s campus. We observed selected stellar fields by simple tracking of the mount, without autoguiding. Focusing was performed using a very rudimentary algorithm. Most features of the camera, such as USB connectivity, external power supply, communication from Linux, were all tested from Peyton hall’s roof. While the astro-climate from Princeton is sub-optimal (heavy light pollution, small fraction of clear skies), these tests on real stars over multiple nights helped prototype operations. Once we reached stable operations, we relocated the camera to the Fred Lawrence Whipple Observatory in Arizona.
2.2. HAT10
HAT10 is a telescope unit from the HAT Network of Telescopes (HATNet), located at the Fred Lawrence Whipple Observatory (FLWO) of the Smithsonian Astrophysical Observatory (SAO). A HAT unit is a fully automated observatory using a CCD and a telephoto lens on a common mount, all within a small clamshell dome, which is equipped with a rain sensor and a photosensor that force the dome to close during rain or daytime. The unit is also connected to a weather sensor in a control building which measures clouds, lightning, and wind speed. All devices are controlled via a single Linux PC. Every night, if the sensors detect favorable conditions, the dome automatically opens, the mount tracks a certain field, and the camera continuously takes 3-minute frames of the field. At dawn, or when the weather deteriorates, the dome automatically closes, and the HAT goes to sleep.

The DSLR was attached to the HAT10 mount and was pointing in the same direction as the CCD. The mechanical installation was done in 2014 February with a ballhead and custom-made converters (Fig. 1). The DSLR camera is a Canon EOS 60D, a midrange DSLR often used for astrophotography. We used a Canon EF 135mm f/2L lens at the f/2 setting.
2.3. Canon 60D Camera Properties
A number of experiments were performed to characterize the DSLR camera. Additionally, we have tried to look for official documentation on these properties; unfortunately, none seems to be public. We have also searched for other measurements of camera properties, but the only measurements that exist were found on personal websites such as clarkvision111 http://www.clarkvision.com/photoinfo/evaluation-canon-7d/index.html. The information below is likely the most detailed publicly available description of the properties of the 60D.
2.3.1 General Properties
At full resolution, the Canon EOS 60D takes pixel images with its CMOS sensor, for a total of 18 megapixels. Each pixel has a physical size of 4.3 by 4.3 micrometers. With our Canon 135 f/2 lens, the camera has a field of view of , corresponding to a pixel scale of 13.3 . The camera has a Bayer filter on top of the CMOS sensor, laid out in the pattern indicated in Fig. 2. Each square in the Figure represents one pixel.
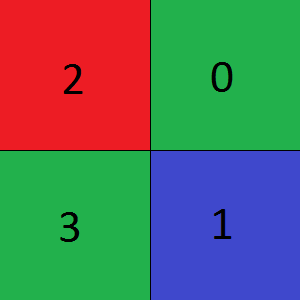
To break the ambiguity between the two green channels, we will refer to the channels by the numbers 0 (green), 1 (blue), 2 (red) and 3 (green), whose correspondence to the Bayer filter is shown in Fig. 2. These numbers are mostly arbitrary, and were originally chosen because they were the order in which dcraw, which we used to convert RAW files to FITS, writes the channels.
When shooting in RAW mode (as compared to producing compressed JPEG files), the camera outputs 4-channel data at 14 bits per pixel, each channel corresponding to a color. Pixel values have an offset of 2048, a value which represents zero light. This offset is non-zero to prevent clipping negative values to zero or dedicating an entire bit to indicate the sign of the value.
Not all of the chip pixels are sensitive to light. Based on our own measurements with this camera we produced the diagram shown in Fig. 3, describing the layout of the different regions on the chip. We have failed to find any public documentation describing this layout.
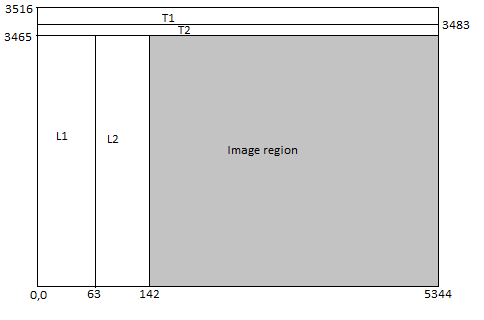
Significant effort was spent trying to determine the behavior of these dark regions in the hopes of exploiting them to remove offsets or fixed-pattern noise. We discovered that all regions except T1 are almost indistinguishable in bias frames. For dark frames, L2 and T2 are almost indistinguishable from the image region, while L1 and T1 are clearly distinct and less bright. For this reason we suspected that L1 is a bias region, where the pixels are exposed for 0 seconds, while L2 and T2 are dark regions, where the pixels are covered with a strip of metal and exposed for the same length as the image region. However, further research showed that this hypothesis is incorrect. Moreover, the non-image regions exhibit weird and unexplained behavior, such as channel-dependent mean intensity even though the region receives no light. The behavior of the image region is consistent and generally in accordance with expectations. Therefore, we simply crop out the image region in all of our processing and do not use the other regions. This is an area of further possible improvement.
2.4. Electronic properties
Table 1 shows the electronic properties of the 60D at ISO100, the setting we used. We measured all of these properties in our lab. Read noise, for example, was measured by taking pairs of very short exposures in a dark room. Gain was measured by taking pairs of exposures of a uniform white light at different exposure times and calculating the noise as a function of the mean intensity. Here we assumed that the noise consists of photon noise plus read noise. Saturation was measured by taking an image of a bright source.
2.4.1 Linearity
The Canon EOS 60D exhibits almost perfect linearity all the way to the saturation value in all channels, as shown in Fig. 4. This plot was produced by putting 3 pieces of paper on top of the lens of the lab camera, with the lab lights turned on. This setup yielded 1000 ADU/s intensity. We then took exposures of increasing duration, ranging from 1 to 15 seconds. The two small kinks in the lines in Fig. 4, at 4 s and 7 s, could be due to actual changes in lighting rather than camera properties.
To characterize the linearity, linear regression was used to fit the mean ADU as a function of exposure time. Points with means at the saturation value were rejected. The resulting (the percentage of variance not explained by the best-fit line) is for channel 0, for channel 1, for channel 2, and for channel 3.
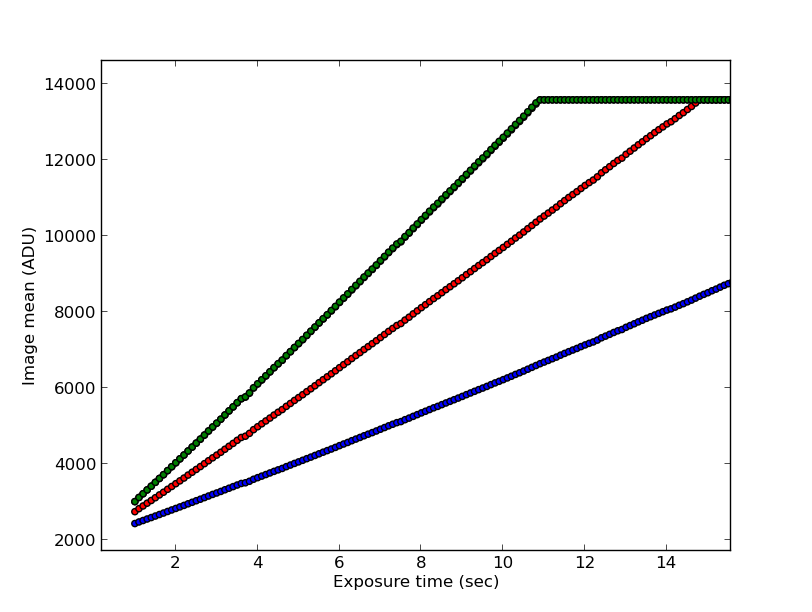
The linearity is less perfect at a few hundred ADUs from the saturation level, but as shown by the r values above, it is still nearly perfect for nearly the entire dynamic range.
2.4.2 Dark current
Dark current is caused by thermal electrons that jump the bandgap from the valence to the conduction band of the semiconductor. The general formula describing dark current is , where is the bandgap of silicon (the main material used in CMOS and CCD photodiodes) and is a chip-dependent constant.
For a CCD, the dark current causes an increase in pixel values as exposure time is increased. This does not happen for this particular DSLR (and probably is a general feature of DSLR cameras). We took test frames at ISO800 setting using exposures times of 1, 2, 4, 8, and 16 minutes, and saw only a 3 ADU increase in mean pixel values from 1 to 16 minutes. The increase is not linear. This is because the 60D have a built-in mechanism to suppress dark current, even when the “dark-noise suppression” option of the camera is turned off. We have not been able to find any documentation about how this suppression works.
To determine the dark current for the HAT10 camera, we look at the dark noise instead. We expect a Poisson noise characteristic. We plotted the image variance of every dark frame against the Boltzmann factor , where T is from the sensor temperature, as read out by our control software. The expected variance is given by:
where g is the gain, is the dark current in ADU per 180 seconds, R is the readout variance, and V is the total variance.
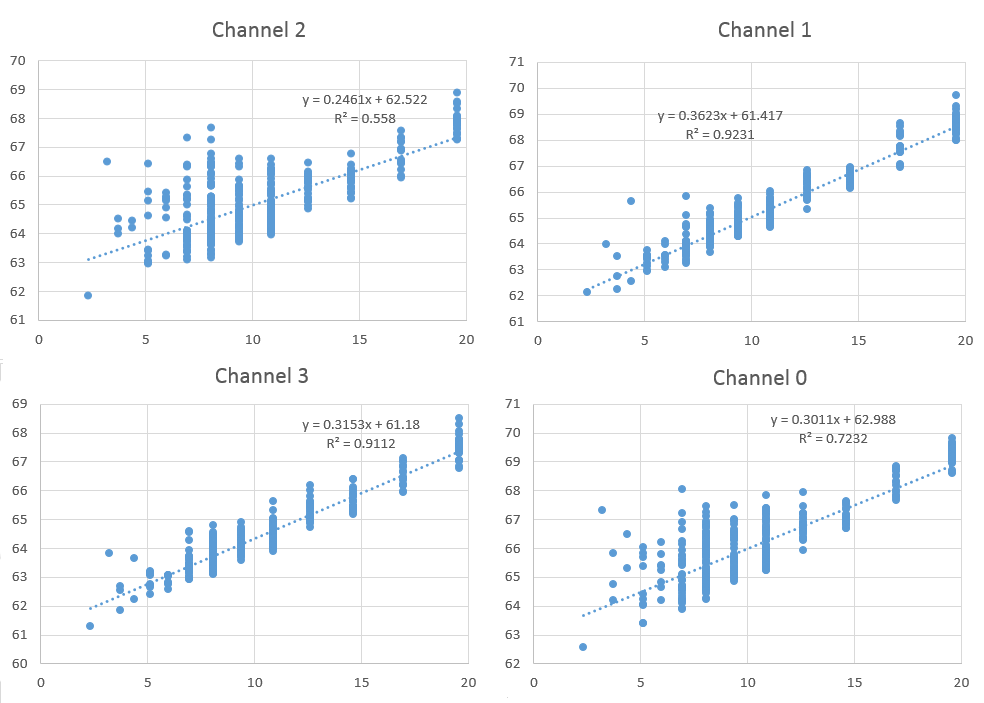
Fig. 5 shows the variance as a function of the Boltzmann factor. The best fit is:
corresponding to around 0.1 electrons per second at . Note that the dark current depends on channel: channel 0 and 2 have much larger dispersion with respect to the best-fit line than the other channels, even though these are dark frames. This is not consistent with light leakage, because the two green channels (0 and 3) are significantly different. This figure also shows that the dark noise due to dark current is low compared to readout noise for temperatures around and exposure times of a few minutes.
3. Observations
The hardware setup was described in more detail in Section 2.2. We carried out simultaneous observations with the Canon 60D plus Canon 135mm f/2 lens, and the Apogee U16m CCD plus its Canon 200mm f/1.8 FD lens with sloan filter (the default HATNet setup). The Canon 60D system was piggy-backed next to the Apogee CCD, and was taking simultaneous exposures of the same length. This allows a good comparison to be done between the CCD and the DSLR.
After a few days of debugging, the DSLR, under the control of a Linux computer, started taking useful data on February 22 and continued doing so until May 30. Shortly after sunset, if the weather was favorable, the dome opened and both the CCD and the DSLR began taking flat-fields. After the sky became dark, the mount pointed to a selected stellar field on the sky and the DSLR started taking three-minute exposures. Whenever the mount first points to a new field, it takes ‘pointing’ frames which are used to determine the true field center and correct for initial pointing errors. Following the pointing frames, the camera took 180-second science object frames. After every ninth exposure, it took a 30-second focus frame, and any deviations from the target focus were corrected. The focusing procedure is described in Section 3.4.
Once the field was near setting (below an altitude of 33 degrees, corresponding to an airmass of 1.8) or the Moon was too close to the field, the next highest-priority stellar field was chosen. Around sunrise, the camera took flat fields again before the dome closed and the HAT unit went to sleep for the day.
3.1. Camera settings
Certain camera settings are essential for scientific photometry. We shoot in RAW format to avoid additional noise due to the lossy compression to JPEG format. We set the image size to be the largest possible. We turn the long-exposure noise reduction feature of the camera off, since in this mode the camera would take a dark frame of the same length as our observation after each frame and would thus spend half the observing time without collecting photons. The camera is turned to Bulb mode and the lens is set to Autofocus, so that the computer can control both the exposure time and focus, respectively.
There are four camera parameters that can be changed to optimize photometry for a certain magnitude range: ISO (sensitivity), aperture, exposure time, and focus.
Increasing ISO decreases the gain. Since saturation ADU does not increase at ISOs higher than 100 (which is the lowest possible setting), this also decreases the number of electrons that can be represented before reaching the saturation limit, thus decreasing the magnitude range of stars whose brightness can be precisely measured. (Due to anti-blooming features implemented on the chip, charges are simply lost after saturation; they do not overflow to neighboring pixels, and thus can not be measured to provide precise photometry.) However, the electron-equivalent read noise is , where g is the gain, is the pre-amplifier noise component, and is the post-amplifier noise component. The read noise therefore decreases with the ISO setting and approaches at high ISO. Therefore, to optimize for any given star, it is always better to use the highest ISO possible without reaching saturation for a given exposure time. To survey the brightest stars optimally, it is best to use ISO100.
The considerations above indicate that ISO100 or 200 is probably the best ISO. The former is better for higher dynamic range, the latter is better for lower readout noise. While we were not fully aware of all of these considerations at the time of setup, the setting we have been using (ISO100) turned out to be the optimal choice.
3.2. Stellar Fields
The observed field during this test is named G180 in the HATNet nomenclature. It is centered at RA=144.6 degrees and Dec=37.4 deg. This field was selected because it is high above the horizon after sunset in February, and because it contains the transiting exoplanet KELT-3b. The field is in between the Lynx and Leo Minor constellations. G180 was also observed by the other HAT telescopes, and thus it is a good control field for comparing the results.
When field G180 was setting, the camera observed another field, called G113, until the dawn. This field was extremely dense in stars due to its proximity to the plane of the Milky Way, and is centered very close to the ‘head’ of Draco. Data for G113 have not been fully analyzed, and are not subject to this paper.
3.3. Calibration Frames
Astronomical CCDs can easily take dark frames, by simply exposing without opening the shutter. Usually, HATNet CCDs take dark frames at the end of every night. Unfortunately, the Canon 60D has no built-in ability to take frames without opening the shutter. We investigated whether firmware modifications such as Magic Lantern (http://magiclantern.fm) are capable of introducing this ability but found nothing relevant. For this reason, we only took 20 bias frames (on the night of March 6), by covering the lens, and taking very short exposures.
Darks were taken in two ways. First, whenever the weather was bad during night time, the dome remained closed, and the camera took 180-second exposures of the inside of the dome. Second, on the night of March 5, the lenscap was manually put on the lens, and the camera took dark frames the entire night. A total of 1040 darks were taken during bad weather, while 125 were taken on March 5 with the lens cap on.
Skyflats were taken during both evening and morning twilight, depending on weather. In the morning, flat-fields start with 180 s of exposure time and remain at that exposure until the average pixel value exceeds the target value of 2/3rd of the saturation value. After that, the exposure time is gradually reduced (based on the intensity values of all previous frames) in order to keep the image brightness constant, at 2/3rd of the saturation value. We stop taking flat fields when the sky becomes too bright, which corresponds to an exposure time of 1 second. In between flat fields, the mount points to slightly different areas of sky. This allows for stars to be removed from the master flat, which is derived by median averaging the individual skyflat frames.
3.4. Focusing
To obtain high precision photometry with a DSLR, most authors choose to defocus the lens, with the exception of Guyon & Martinache (2012). Defocusing increases the PSF width, thereby mitigating the effect of the subpixel structure and the Bayer filter on the results. However, defocusing has many problems that make it unsuitable for an automated photometric wide-field survey. Increasing the PSF makes stellar blending worse and increases the photon noise due to the sky background. It makes the PSF non-Gaussian, highly variable, and elongated at the edges, thus violating the assumptions made by most source finder and flux extractor software, including our own reduction pipeline of HATNet. If the PSF becomes donut-like, star detectors may spuriously detect multiple peaks and count them as multiple stars, which confuses autofocusing and astrometry algorithms. Instead of defocusing, we choose the opposite approach, i.e. to focus as perfectly as possible, and continuously monitor stellar PSFs to keep focus in the same position.
The Canon EF 135 mm lens has built-in focusing ability that can be controlled by a computer. We note that the built-in autofocusing capability of the Canon 60D camera does not work under low light conditions, and on stars. On February 18, shortly after the DSLR was installed, a focus series was taken during the night. Starting at focus position 45 (in arbitrary units), an image was taken at every other focus position until we reached 70. The focus position refers to the number of quanta of focus adjustments from the farthest possible focus, which is beyond infinity. The image taken at each focus position was split into the 4 channels, corresponding to the 4 colors. Each channel was, in turn, split into 9 regions: upper left, upper mid, upper right, middle left, center, etc. A star detector was run on every channel, and every star was fit with a four-parameter rotated elliptical Gaussian of the form:
Here, the star is assumed to be centered on (0,0); in reality, the center of the star is estimated by computing the centroid of the light. is related to the inverse of the square of standard deviation, and represents “sharpness”. represents ellipticity in the , direction, while represents the ellipticity in the diagonal directions.
The S, D, and K parameters were averaged over all stars in the same region and plotted against focus position. This process produces plots of S, D, and K for every region of every channel at every other focus position between 45 and 70. At perfect focus, S should be at its maximum while D and K should be at a zero crossing, meaning that stars are small and circular. In reality, due to optical aberrations and the imperfect perpendicularity of the detector to the optical axis, different regions of the image come into focus at different positions and D/K do not cross zero at exactly the same position as S reaches maximum. Additionally, due to chromatic aberration of the lens, optimal focus is different for the different channels. These effects can be seen in Fig. 6.
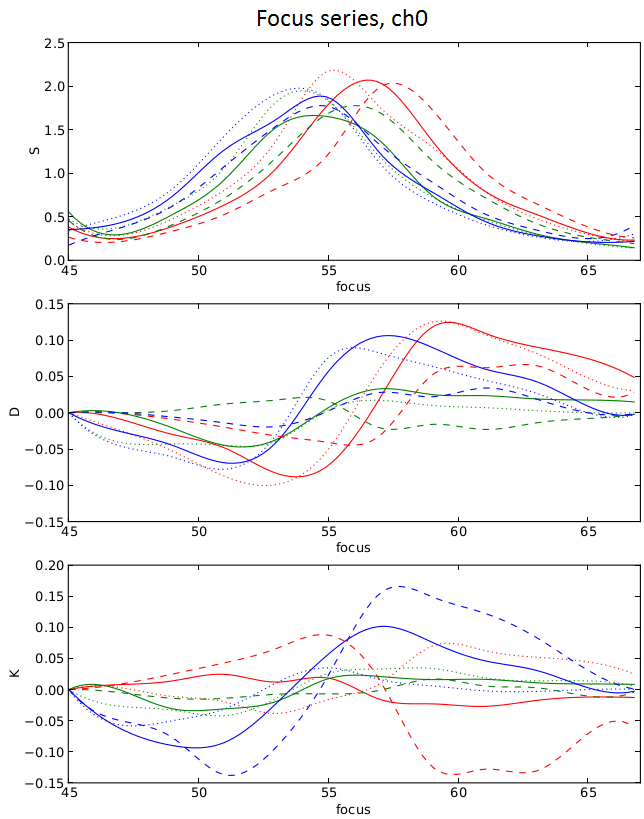
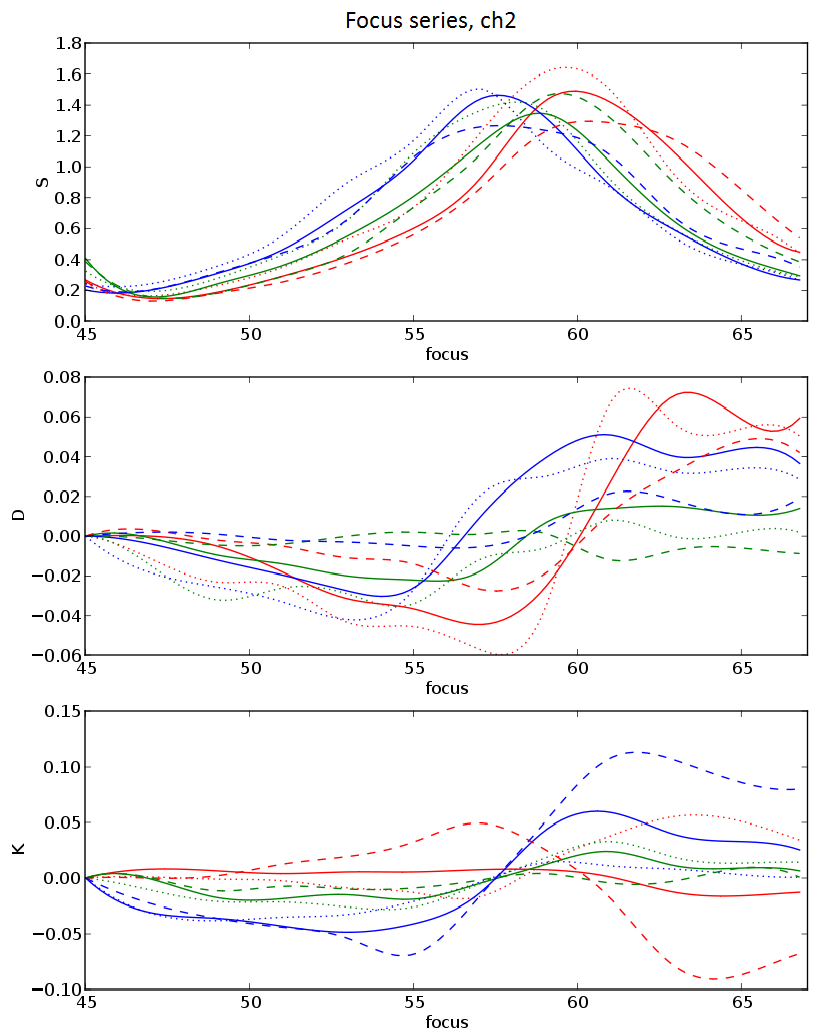
As a compromise between the different image regions and channels, we chose “58” as the target focus position. The actual focus position can change with time for a variety of reasons, including physical shrinking or expansion due to temperature changes or gravity pulling on the lens as it changes orientation. To compensate for these effects, an autofocus script monitors the incoming focus images every night. It detects stars in the images, finds the S, D, and K parameters for all regions and all channels, and determines the current focus position with respect to the focus series. The script then changes the focus by the appropriate amount to bring the actual focus close to that represented by position “58” on February 18.
Unfortunately, the autofocusing script had a software bug, and it did not run correctly during the first month. As a consequence, the focus position never changed between February 24 and April 20. Remarkably, the lens is so stable with respect to thermal changes that even a month and a half later, its full width at half maximum (FWHM) was still close to 2 pixels—the same value it had been since February 24. Even on the worst nights, it did not change by more than 0.3 pixels. Ellipticity is more variable from frame to frame and throughout the night, but seems to have remained around 0.1-0.2 across all nights of observation. This may be affected by tracking errors as well as focusing errors. The autofocus script was fixed on April 21. The fix did not seem to have a major impact on our results.
3.5. PSF broadening
While the absolute pointing of the HAT mounts is relatively poor (tens of arcminutes), the precision of tracking and fine motion of the HAT mount are very good, usually better than the angular scale of one pixel of the DSLR and the Apogee CCD on HAT10. The mount is also capable of deliberately introducing tiny tracking errors in order to broaden the PSF. In this mode, called “PSF-broadening” or “Drizzle” (Bakos et al., 2004), the sky around the field center is divided into a grid. The mount points to the center of one grid cell, lingers for a certain amount of time, moves to the center of the next grid cell, and repeats this process for the entire grid. The geometry of the grid, and the time that the mount spends at certain gridpoints is such that the stars are broadened into a wider, approximately Gaussian stellar profile.
This process enlarges the PSF by a tiny amount (by a factor of 1.5) close to homogeneously across the field, thus avoiding many of the problems associated with defocusing while decreasing the effects of subpixel structure and forcing the PSF to be more Gaussian than it would otherwise be. On HATNet CCDs, drizzle improves photometric precision substantially. As shown later, the same is true for the DSLR experiment.
Field G180 was observed in D (Drizzle mode) and T (Tracking, no drizzle) mode, alternating every frame. This is to determine the effect of drizzle on photometric precision, and whether high precision can be achieved without it.
3.6. Current data
All frames were separated by night of observation on the HAT10 control computer, and downlinked to a Princeton-based server on a regular basis. From February 22 to May 30 inclusive, we took 4645 object frames of field G180, 1162 dark frames, 337 pointing frames, 2140 flatfields, 1445 focus frames, and 20 biases.
4. Software
The HAT10 hardware (mount, dome, cameras) is controlled by a PC running Linux. An observer daemon, written in TCL, is the master process that controls observations. It communicates with the CCD server, which is responsible for communicating with the CCD and DSLR through drivers. After each exposure, other components of the control software append metadata to the FITS header and record the exposure in a database. An autofocus script checks stellar PSFs on focus frames to correct focus, while another script solves images astrometrically and uses the solutions to correct pointing errors.
To communicate with the camera, our CCD server uses the libgphoto2 library222http://www.gphoto.org/proj/libgphoto2/. This is an open-source C library, supporting a large number of DSLRs, that abstracts away the camera protocol to provide a simple API for camera control. Because the communication protocol with the Canon 60D DSLR is proprietary, and because Canon does not provide Linux drivers to control their cameras, libgphoto2 drivers were developed by reverse engineering the protocol. To decode the raw “CR2” files, we invoke the dcraw program333https://www.cybercom.net/~dcoffin/dcraw/ by David Coffin, which we modified to also extract the camera sensor temperature.
4.1. Focusing
HATNet lenses are focused by adjusting their focusing ring via a belt and a stepper motor, controlled by the instrument control computer. For the DSLR, we exploited the focusing capability built in to the DSLR, and with top-level control incorporated into our camera control server.
The libgphoto2 library does not allow retrieval of the actual focus position, nor does it allow focusing to an absolute position. Instead, it allows one to move the focus by a small, medium, or large amount in both directions. To overcome the limitations, we always move the lens by a small amount every time. Position 0 is defined as the farthest possible focus (hitting the end position), and position N is reached by moving the focusing nearer by N small steps from the farthest possible focus. The focus position was initialized by moving the focus outwards a large number of steps so as to hit the physical end position, then re-setting our internal counter to zero, and then keeping track of all the steps we moved. We assumed that there is no drift and backlash, e.g. moving -5 steps followed by +5 steps takes us back to the same exact position.
5. Image reduction
The reduction pipeline mostly, but not entirely, follows the pipeline used for HATNet and HATSouth (see, e.g. Bakos et al., 2010).
5.1. Calibration of Images
The first step in image reduction consists of bias subtraction, dark subtraction, and flat fielding.
To perform bias subtraction, we ignore overscan regions, reject outlier frames, and take a pixel-by-pixel median of the other frames.
To perform dark subtraction, we find groups of dark frames separated by less than 5 degrees centigrade. The largest such group is used to generate master dark 1, the second largest group is used to generate master dark 2, and so on, until no group exists with more than 10 frames. Each group of frames is then bias-subtracted and combined. As far as we can tell, the DSLR cannot take an exposure without opening the shutter. It therefore did not take nightly darks.
We produce master flats for every clear night by imaging the twilight sky. Cloudy frames are rejected, and the rest are median combined after smoothing (each color channel separately).
All science frames are then bias-subtracted, dark-subtracted, and divided by the master flat frame. We mark pixels above 13000 as saturated. Finally, the image is cropped, and we only keep the region of and , which excludes the border pixels (Fig. 3).
5.2. Astrometry
A pre-requisite of precise photometry is astrometry, which consist of finding the sources, identifying them with an external catalogue, including deriving the transformation between the pixel coordinates and the RA,DEC celestial coordinates. Optionally, the coordinates from the external catalogue are projected back on the frame to derive better centroid positions for the stars.
We did astrometry with solve-field from astrometry.net, an open-source and highly robust blind solver (Lang, 2009). Before solving any field, one needs index files, which describe quadrangles of catalogue stars. We used pre-generated index files for the 2MASS catalogue (Skrutskie et al., 2006).
We invoked solve-field twice. On the first pass, the program detects stars using the built-in star detector, simplexy, which assumes Gaussian PSFs. It finds a WCS transformation between image coordinates and RA/Dec, outputting several files, including an .axy, .corr, and .wcs file. The .axy file contains the measured positions and fluxes of detected stars. The .corr contains cross-matches between detected and catalogue stars, including the and positions for detected stars, RA and DEC coordinates, and the pixel positions, as transformed back from the RA and DEC coordinates of the external catalogue. Finally, the .wcs file contains polynomial coefficients for the transformation (and its inverse) from pixel coordinates to RA,Dec celestial coordinates.
On the first run, solve-field only tries to find where the field is, and does not attempt to optimize the WCS transformation. It only matches as many quadrangles as necessary to confirm this location, yielding a rough transformation. To derive a better transformation, we run: solve-field --continue -t 3 -q 0.01 -V filename.wcs filename.fits
This “verification” stage tries to correlate all stars from all index files with detected stars, and use the result to derive a better third-order WCS transformation (-t 3). We use a minimum quadrangle size of , as opposed to the default of , so that every index file is examined.
To decide which polynomial order to use for the spatial transformation (between the pixel and celestial coordinates), we plotted the difference between the detected star positions and the catalogue star positions, transformed back into using the derived fit. The standard deviation of this difference is 0.14 pix for , 0.18 for . There are a few extreme outliers, but when those are excluded, the standard deviation goes down to 0.12 pixels for both axes. We plotted and against , , , and , and found no dependence on any quantity for , but a clear dependence for , i.e. confirming that is adequate.
We then run solve-field on all object frames that were not aborted mid-exposure. Astrometry was run on each channel separately. Altogether, astrometry succeeded for more than 99% of the frames.
Those few frames where astrometry failed had extreme tracking errors due to temporary malfunctioning of the telescope mount.
5.3. Catalog projection
To decide which stars to do photometry on, we query the 2MASS catalogue down to an (extrapolated) V band magnitude of 14.
The celestial coordinates of the catalogue stars are transformed to pixel coordinates for every science frame using wcs-rd2xy, a tool provided by astrometry.net, and the .wcs file corresponding to the frame.
5.4. Aperture photometry
We used the standard aperture photometry routines of HATNet. The precision of aperture photometry depends heavily on the aperture radius used to measure total flux. For HATNet CCDs, for example, the RMS values of light curves exhibit oscillatory behavior as a function of radius at small radii, and start decreasing slowly but monotonically at large radii. On an RMS vs. aperture graph, the peaks and troughs at small radii differ by as much as a factor of two. This is probably due to a combination of not accounting properly for the non-uniform distribution of light across each pixel and subpixel sensitivity variations.
We use 3 apertures to perform photometry, because the optimal aperture depends on the brightness of the star; large apertures for bright stars, and small apertures for faint stars, where the sky background is high compared to the flux of the star. After testing 10 apertures from 1.2 to 3 pixels, we chose 1.4, 1.6, and 1.8 pixels as the final apertures.
5.5. Magnitude fitting
The raw magnitudes from aperture photometry for a selected star typically exhibit large variations, sometimes more than a magnitude as a function of time. This can be due to many factors, including atmospheric extinction and changing PSF shape.
Many other factors affect the raw magnitudes. For example, as a star drifts across the image, its center lands on different positions of the Bayer filter and changes the amount of light falling on the sensitive portion—an effect which our aperture photometry does not correct for. We employed ensemble magnitude fitting to correct for these effects.
To perform magnitude fitting, we chose a “reference” frame for each tracking mode (simple tracking and PSF broadening) and each channel. The “reference” frame is chosen to be extraordinarily good: low sky background, high S/N, field close to culmination, etc.
Every other frame is compared to the reference frame, and the difference in raw magnitudes is computed for every star. These differences, for each star, are fit by a polynomial that depends on position, catalog magnitude, catalog J-K color, and subpixel position. The contribution of the position to the polynomial is itself a fourth-order polynomial.
The contribution of catalog magnitude is of the form:
In other words, it is the product of a second-order polynomial in position and a second-order polynomial in magnitude. This is purely empirically motivated. Similarly, the J-K and subpixel position contributions, also empirically motivated, are both the product of a first-order polynomial in J-K (or subpixel position) and a second-order polynomial in position. Since the four channels and two tracking modes produce different images, we run magnitude fitting separately on all eight combinations of channel and tracking mode. The ensemble magnitude fitting is performed in an iterative way, by replacing the weights for each star in the fit with the derived r.m.s. of the light curves, and the magnitude of the stars with mean magnitude of the light curves.
5.6. Light curves
Light curves were derived from the magnitude-fitted photometry files. Light curves with fewer than 1000 measurements were discarded. These are usually stars very close to the border of the frame that accidentally wandered into the frame due to pointing jitter, esp. present at the first few exposures and initial pointing of the telescope.
Our light curves contain measurements for all 3 apertures used in aperture photometry. As expected, bright stars do better with larger apertures and dim stars do better with smaller apertures, with the lowest-deviation light curves having an optimal aperture of 1.8 pixels.
5.7. EPD, TFA
The final stages of noise reduction are External Parameter Decorrelation (EPD; Bakos et al., 2010) and the Trend-Filtering Algorithm (TFA; Kovács et al., 2005). We use vartools (Hartman et al., 2008) to perform both tasks.
EPD involves finding correlations between the magnitude and so-called external parameters. These correlations are then modeled using a simple function, and once the parameters are fitted, the function is subtracted from the light curve. External parameters include subpixel position, zenith angle, PSF parameters, and hour angle.
We examined the dependence of magnitude on all 7 external parameters mentioned above by plotting magnitude against the parameter for sample light curves, as well as by fitting functions between these parameters and stellar magnitudes to see how much the RMS error decreases. Out of all external parameters, subpixel position had the strongest influence. Even though subpixel position was a parameter in ensemble magnitude fitting, the parameter was only fit to first order. We found that a sinusoidal function with a period of 1 pixel is a better fit for this relationship than any polynomial of and up until fourth order. However, after subtracting the sinusoidal fit, there still remains a slight linear relationship between magnitude and subpixel y position. We therefore also subtract off a linear term proportional to the subpixel y position. We stress that this is done for each star, i.e. each light curve, separately.
Out of the remaining parameters, only the zenith angle (Z), PSF S parameter, and hour angle (h) had any non-negligible correlation with magnitude. We simply fit them with linear functions. The improvement in RMS error after introducing a quadratic term in addition to the linear for any of these parameters was negligible.
The final function we fit for is:
For every light curve we first reject outliers that are more than 5 standard deviations away from the mean. This process is repeated 3 times, after which we fit the function above to the magnitude, subtract off that function for every data point, and apply a constant zero-point, to match the standard magnitude of the star in the catalogue. Besides de-correlating for external parameters, this also transforms raw instrumental magnitudes to the standard system.
After EPD, we perform the trend-filtering algorithm (Kovács et al., 2005) to remove remaining systematic variations. We use the vartools implementation for this task. For every light curve, vartools retrieves the magnitudes for the template stars and fits a linear function, modeling the light curve as a linear combination of the template light curves. Template stars less than 25 pixels away from the target star are excluded from the fit. This prevents an artificially good fit between stars whose PSFs are blended together, and also prevents template stars from being fit to their own light-curves.
The template stars were selected by hand. First, the image region was divided horizontally and vertically into 3 equal portions, for a total of 9 regions. From each image region, 11 stars were selected, roughly 2 for each magnitude bin between . We picked the stars with the smallest median absolute deviations (MADs), and did not select any star that had a MAD of more than 5 percent for channel 0 in D20 mode.
For HATNet Apogee CCDs, TFA drastically reduces the RMS error, from a best-case accuracy of 8 mmag to 5 mmag. This is also true for the DSLR observations. Fig. 7 shows the effect of EPD and TFA on DSLR images. Notice that TFA makes a large difference to the precision of results, whereas EPD makes a small difference.
5.8. Transiting planet candidate search
All three months of data were searched for transit candidates, and four candidates were found in field G180. One of them is KELT-3b, the only known transiting exoplanet in the field, with a transit depth of 0.89%. Unfortunately, follow-up observations show that all three of the other candidates are false alarms. In two, the photometric signal (which was weak to begin with) proved to be an artifact; in the other, the star was a periodic variable.
6. Results
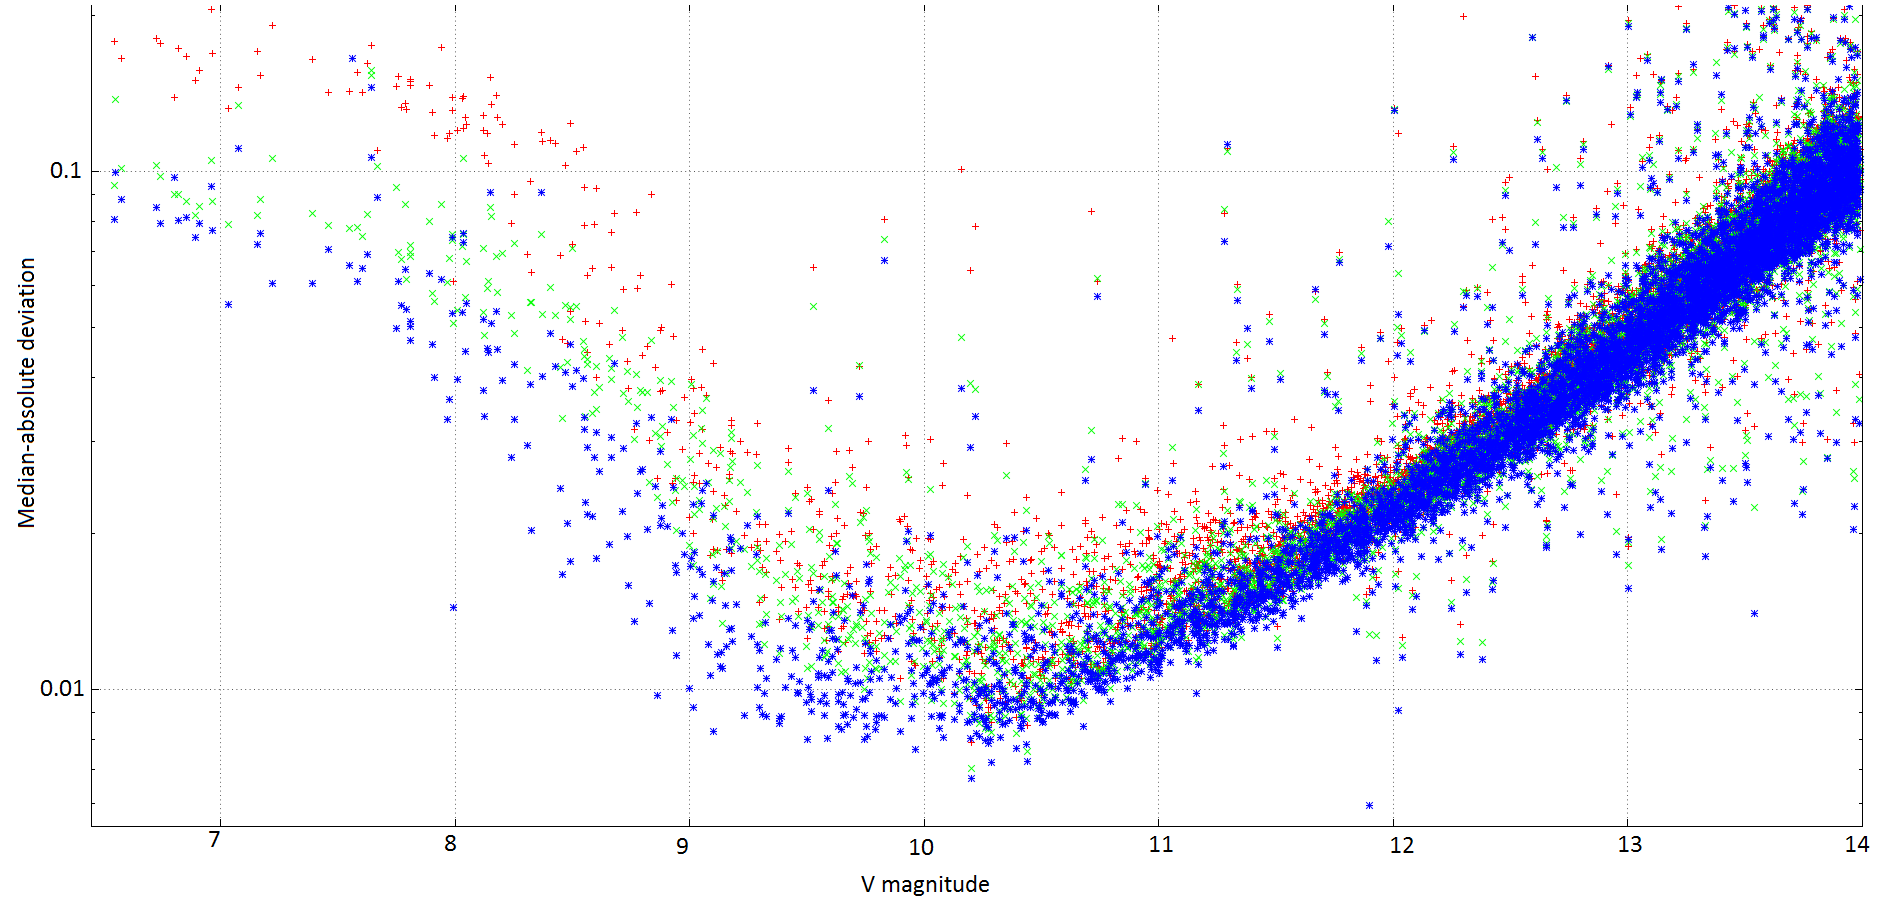
At the end of the reduction pipeline, light curves were derived for every catalogue star within the frame. To demonstrate the photometric precision we achieved, we plotted the MAD for every star against the appropriate catalogue magnitude for that star. MAD is the median of the absolute value of the difference from the median. This statistic is used because it is mostly insensitive to outliers, and we did not want the results to depend on which algorithm was used to detect and reject outliers. Note that MAD is smaller than the standard deviation by a factor of 1.48 for Gaussian distributions.
The results are shown in Fig. 8 for D20 tracking mode and Fig. 9 for T tracking mode. Fig. 10 shows the precision of all four channels combined. The combining was done by weighting every channel by the inverse square of the channel’s MAD, and adding the results. We have also tried combining the channels in the simplest possible way: by adding the four individual channel magnitudes and dividing by four, which is equivalent to taking the geometric mean of the fluxes. Surprisingly, the results from simple addition and from weighted addition are almost exactly the same: in a deviation vs. magnitude graph there is almost no discernible difference between the two.
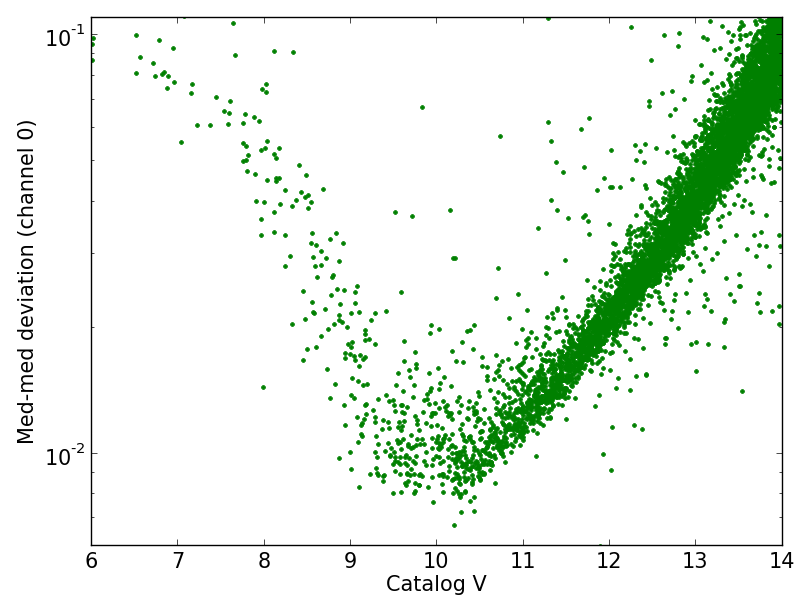
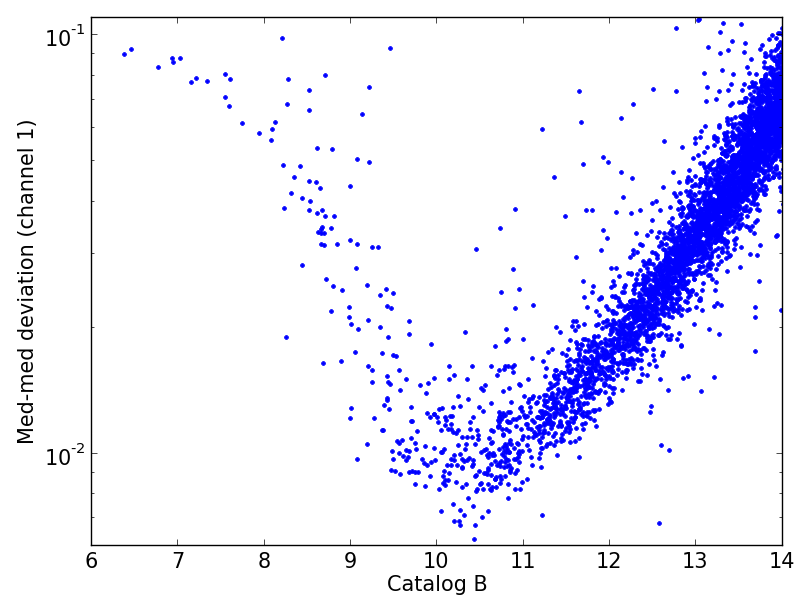
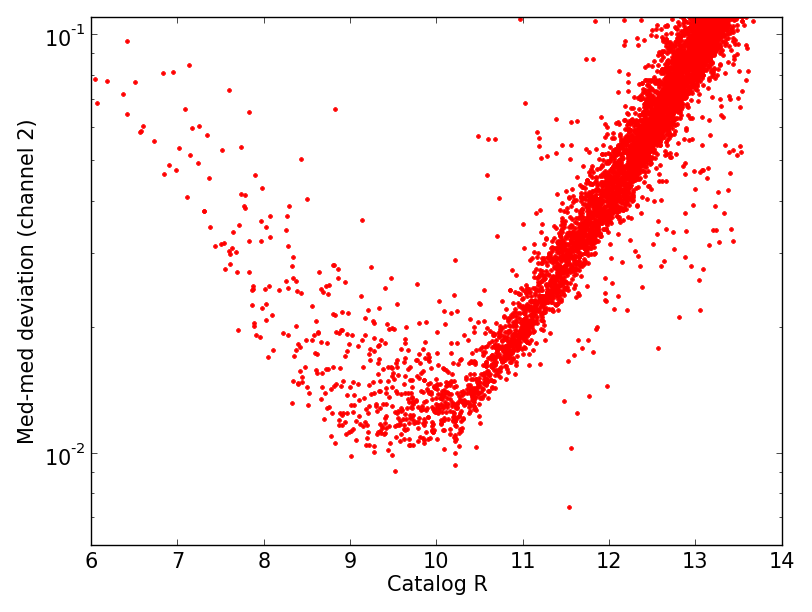
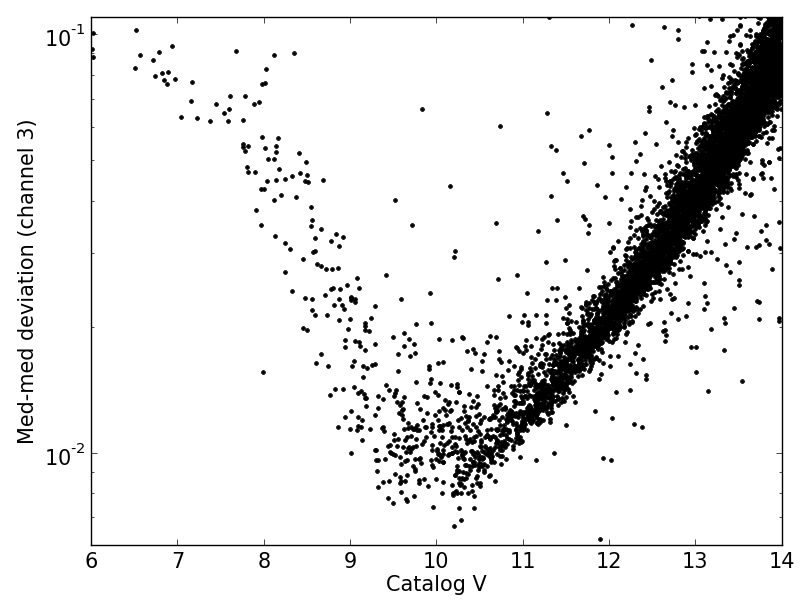
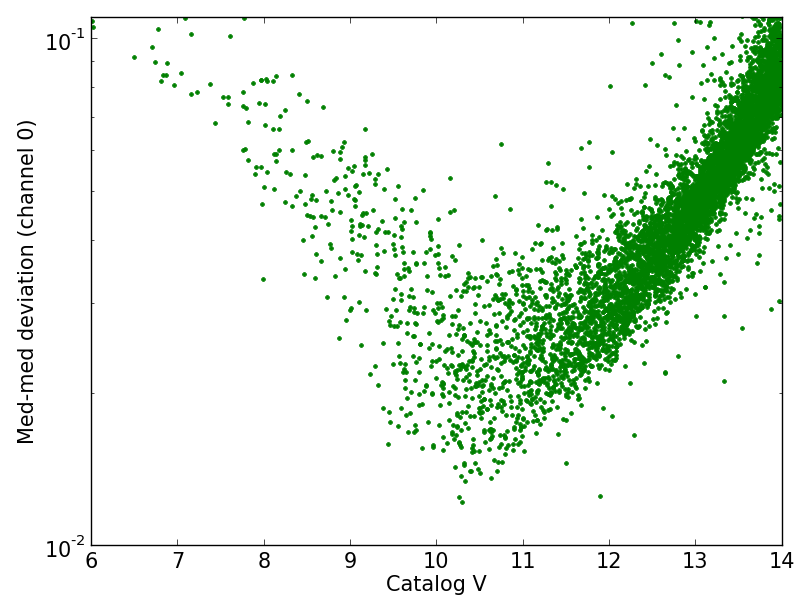
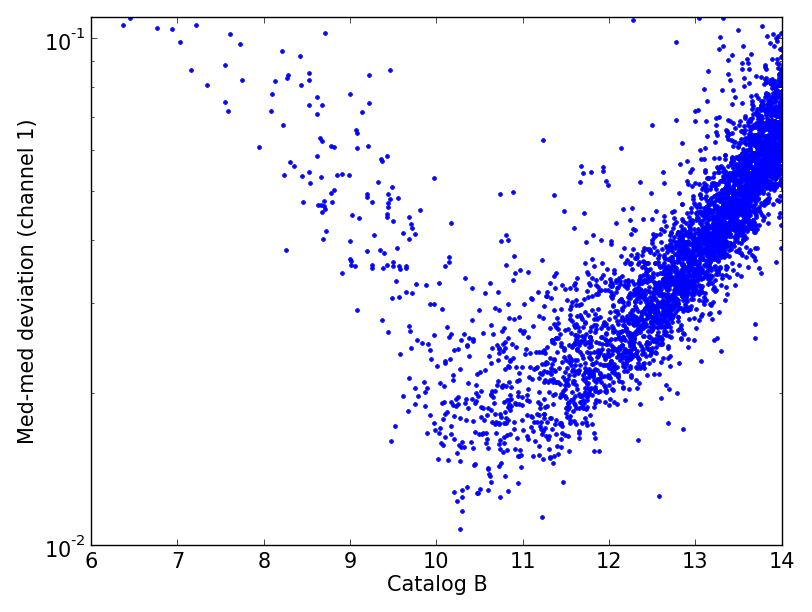
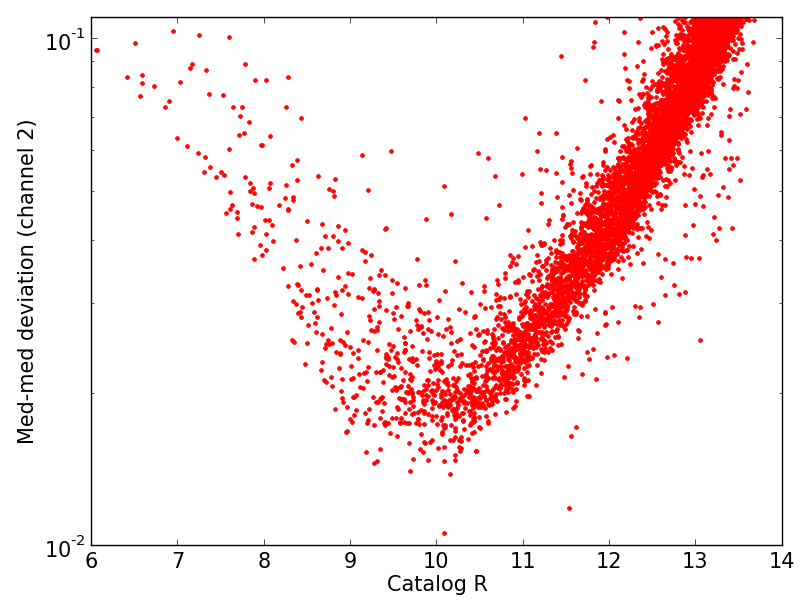
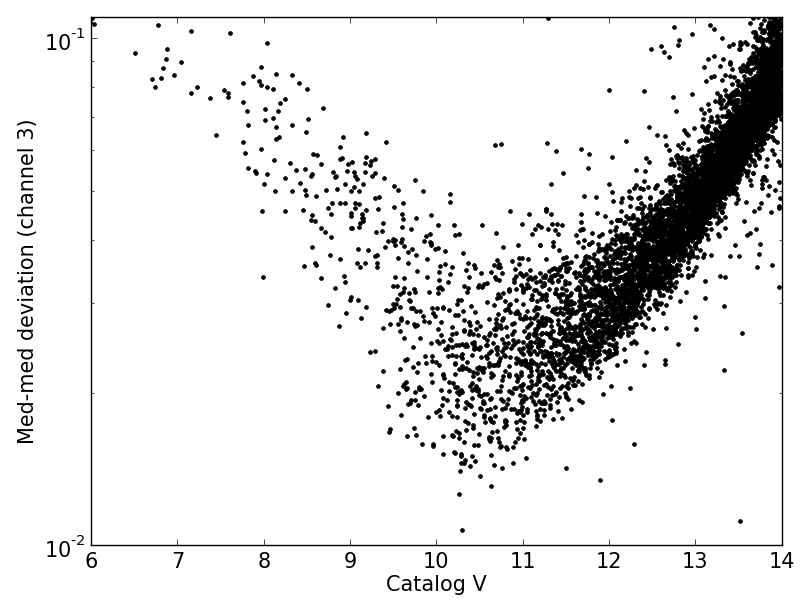
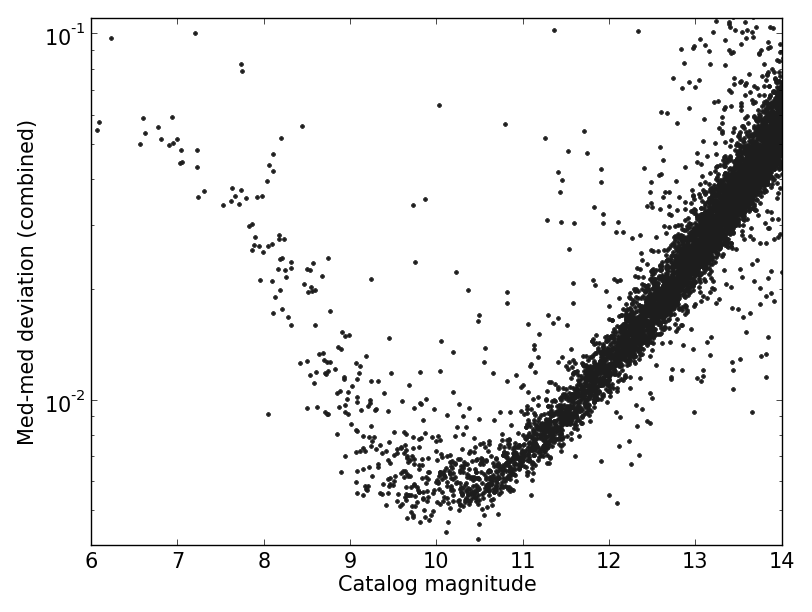
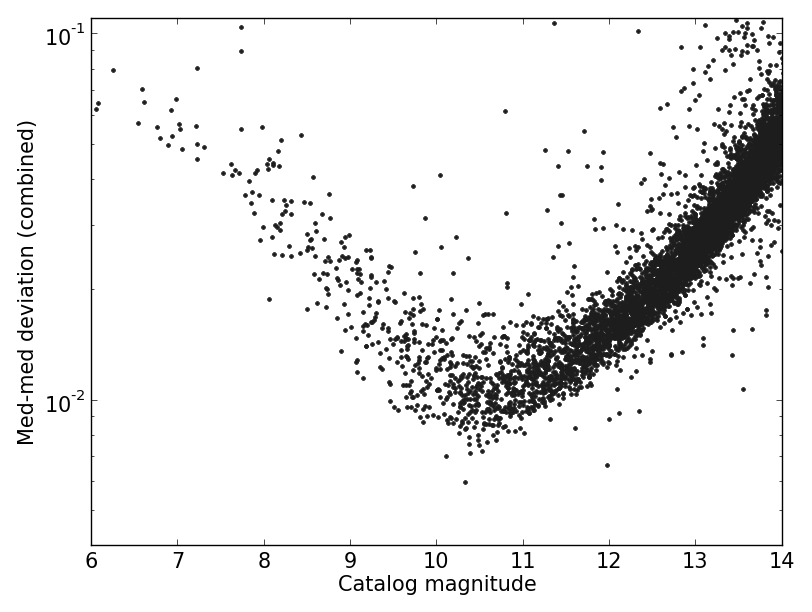
The shape of these graphs is very typical of photometric measurements. Faint stars have a high MAD because sky noise, photon noise, read noise, and dark noise all dominate over the signal. Very bright stars also have a high MAD because they saturate the sensor, making it impossible to precisely measure their flux. In between the two extremes is a minimum where photometric precision is the best.
As can be seen, D20 (PSF broadening) is far better than T (tracking) for all channels. In addition to having a lower minimum, the envelope is also narrower, resulting in more stars measured at a better precision.
The combined magnitudes for D20 tracking mode have a minimum med-med deviation of 4.6 mmag, and 1000 stars between magnitudes 9 and 11.5 are measured more accurately than 10 mmag. For T tracking mode, the combined magnitudes have a minimum deviation of 8 mmag, with far fewer stars lower than 10 mmag. For the individual channels, 0, 1, and 3 have a minimum deviation of 7-8 mmag for D20, and roughly 15 mmag for T mode. Channel 2 is substantially worse than the others, with a minimum deviation of 10 mmag for D20 and 17 mmag for T. This is not surprising, considering that the red channel has a lower quantum efficiency than the others.
6.1. Sample light curves
To further demonstrate the precision of our photometry, we analyzed the light curves for selected variable stars.
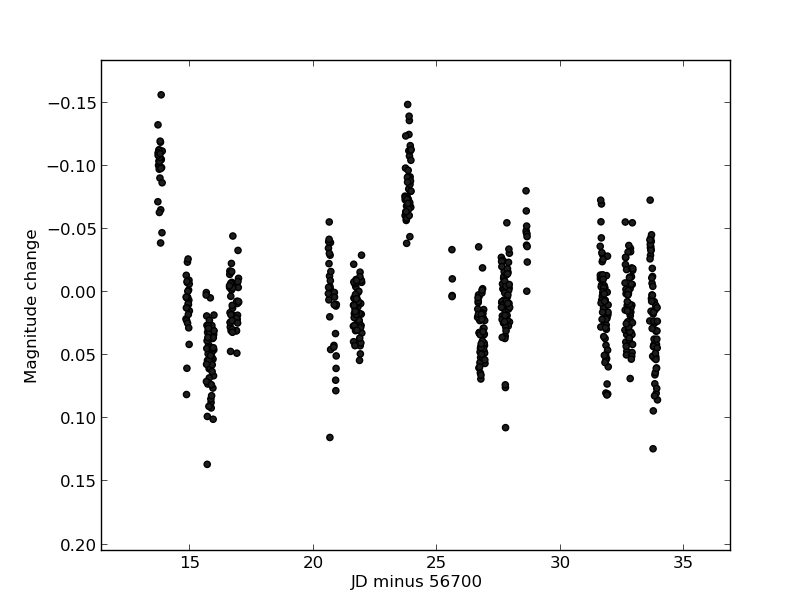
In Fig. 11, we plot the magnitude difference from median magnitude against time for two variable stars. On the left is ZZ LMi, an RS Canum Venaticorum-type variable, characterized by strong chromospheric activity. Like solar activity, there is no strong periodicity to the light output of this variable. According to the General Catalog of Variable Stars, this star varies between magnitude 10.8 and 12.1. However, the amplitude of variations may change over the years, due to cycles similar to the solar cycles.
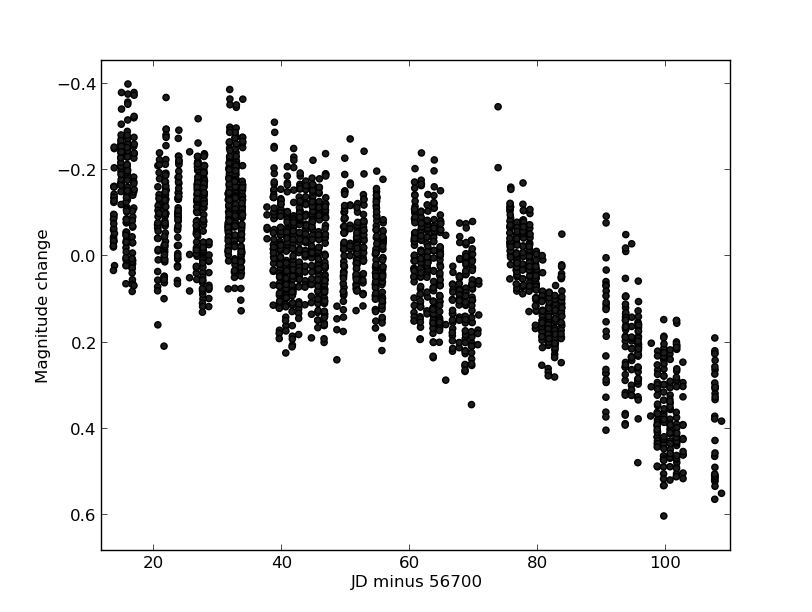
In the right panel of Fig. 11 is U LMi, a semiregular late-type giant, similar to Mira but with smaller variations. This star varies between magnitude 10 and 13.3 with a 272.2-day period, but we only see a secular upwards trend over our observations.
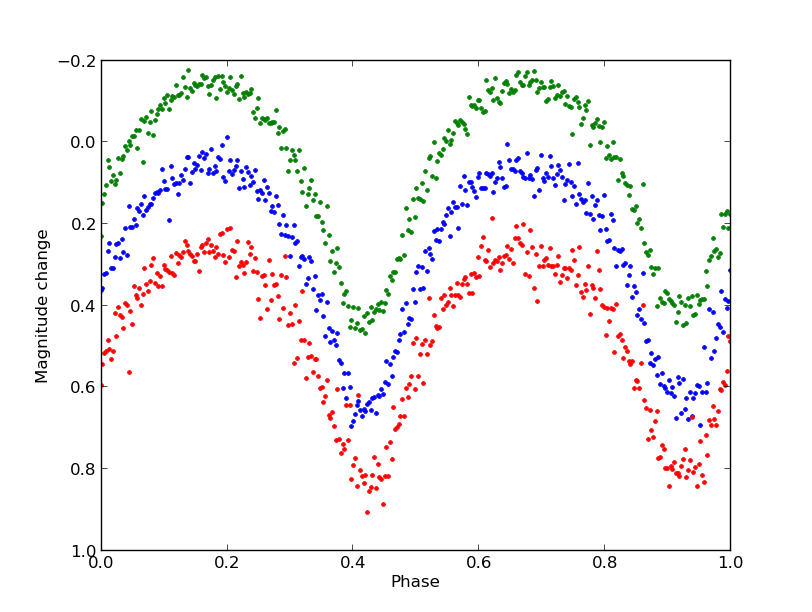
Fig. 12 shows the light curve for RT LMi, an eclipsing contact binary with a period of 0.3749 days and a range of magnitude variation of 11.4–11.7.
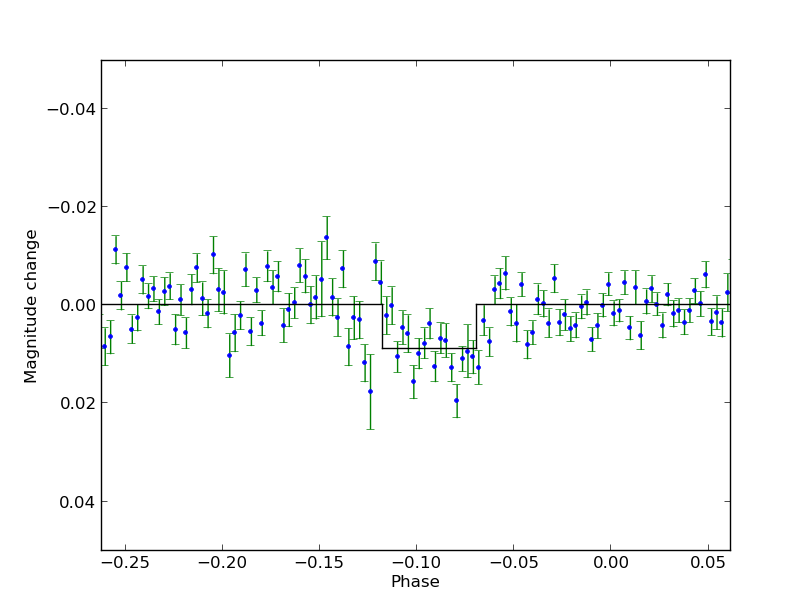
Our automatic search pipeline detected KELT-3b, a known transiting extrasolar planet (Pepper et al., 2013). KELT-3b has a period of 2.7 days, a transit duration of 189 minutes, and a transit depth of 8.8 mmag. The light curve is shown in Fig. 13, where it is phase-folded and phase-binned into one-degree bins. The transit signal can clearly be seen. Note that this result is still suboptimal because KELT-3b is only 20 pixels away from the image edge, leading to a distorted PSF shape.
7. Comparison with the CCD
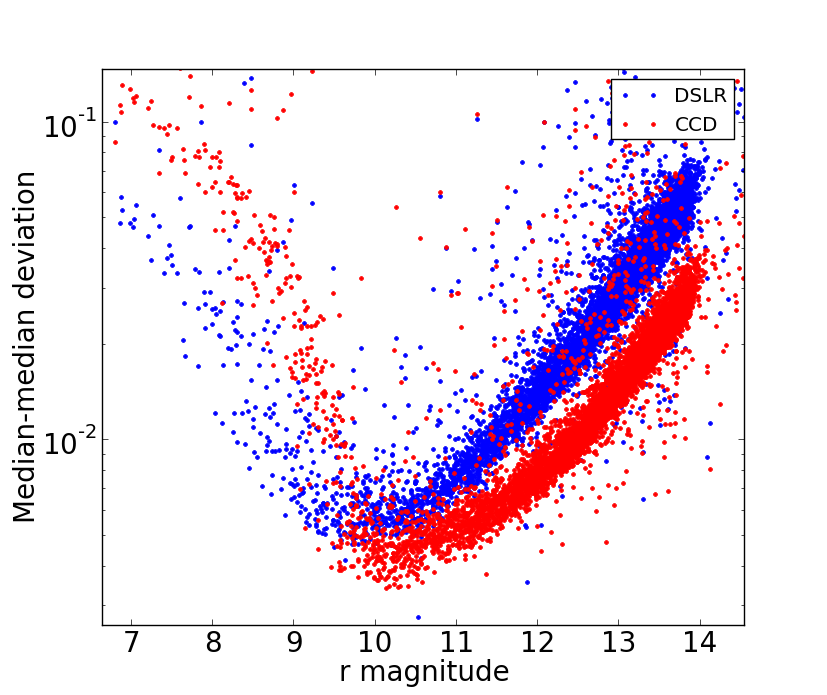
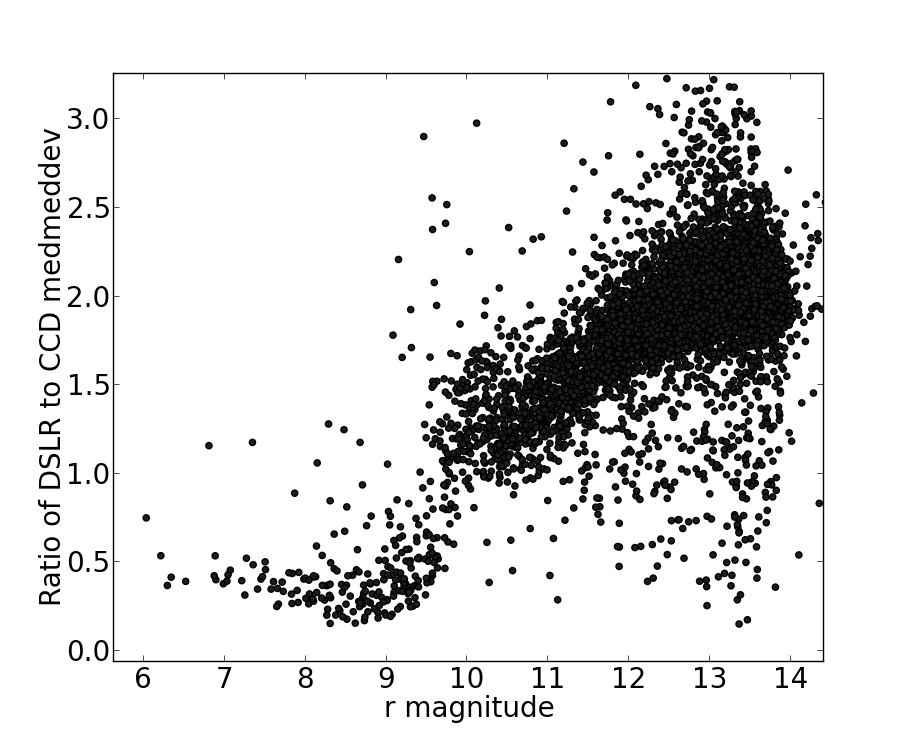
To compare the DSLR with the CCD, we did a parallel reduction of the HAT10 CCD data for exactly the same time instances, i.e. under the same exact observing conditions. Fig. 14 compares the MAD of both the DSLR and the CCD, and in the same figure, we also show the ratio of the deviations. The CCD achieves a minimum deviation of 3.4 mmag, with 3377 stars measured more accurately than 10 mmag. As mentioned before, these numbers are 4.6 mmag and 1000 stars for the DSLR, respectively. The spread of the magnitude-deviation relationship is very similar for both devices. Notice also that the CCD becomes imprecise very quickly at magnitudes lower than the saturation limit, whereas the DSLR becomes imprecise more gradually. This partially explains the knee in Fig. 14, the other part of the explanation being the difference in saturation magnitude between the devices.
Time-correlated (“red”) noise is also very important in the detection of signals. Notably, red noise decreases the transiting planet detection efficiency, and often leads to catching false signals. To estimate the variance due to time-correlated noise, we measured the autocorrelation of the light curves and modeled it using a function of the form:
where t is the lag and A is the fraction of the variance caused by red noise, so that . To compute A, we derived the auto-correlation function for all light curves in Drizzle mode, for lags between 0 and 0.1 days at intervals of 5 minutes. The sequence of autocorrelations for each light curve is normalized to 1 for lag 0. Autocorrelations are then divided into bins according to the V magnitude of the star, and merged. The bins are one magnitude wide and cover the magnitude range of 8 to 13.
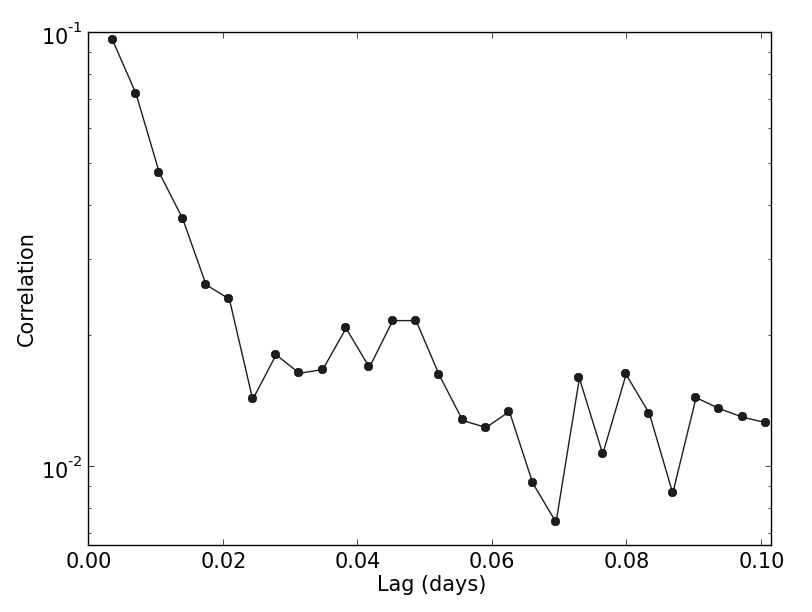
Fig. 15 shows the merged autocorrelations for magnitude 10-11, but the other autocorrelations look similar. At small lags, the correlation decreases rapidly in a relation very close to exponential. At around 0.025 days, the relation changes to one that decreases much more slowly, and is much farther from a perfect exponential. To calculate the red noise () we take the first 6 points (the ones with lag 0.025 d) from the combined autocorrelation, and fit them to this exponential form. Table 2 shows the results, compared with the results of a similar analysis on the CCD. As expected, red noise is a greater proportion of total noise for brighter stars.
| Magnitude | (d) | (d) | ||
|---|---|---|---|---|
| 8-9 | 0.38 | 0.089 | 0.60 | 0.24 |
| 9-10 | 0.17 | 0.033 | 0.12 | 0.38 |
| 10-11 | 0.12 | 0.028 | 0.068 | 0.32 |
| 11-12 | 0.11 | 0.024 | 0.057 | 0.33 |
| 12-13 | 0.08 | 0.022 | 0.045 | 0.42 |
8. Conclusion
In this paper, we demonstrated the capability of DSLRs for precision photometry. With D20 tracking mode and a 1.4-1.8 pixel aperture, we achieved a best-case median absolute deviation of 7-8 mmag for channels 0, 1, and 3 (representing green, blue, and green respectively) and 10 mmag for channel 2. When these channels are combined by weighted or simple addition, the deviation is around 4.6 mmag. Unfortunately, it is also true that this level of precision depends crucially on the PSF-broadening observing technique, whereby the stellar PSFs are broadened by a small fraction of the original PSF width. In tracking mode, it is only possible to achieve 10 mmag photometry or better for a tiny fraction of stars, even at the optimal magnitude and aperture. To our knowledge, this is the first time that a precision significantly better than 10 mmag has been achieved with a DSLR without extreme defocusing, over an extended duration, and over a large field-of-view, for a large number of stars.
This level of precision allows for DSLRs to be used in exoplanet detection, and certainly in studying variable stars. Our result of 4.6 mmag is not drastically worse than the 3-4 mmag of the Apogee CCDs that HATNet currently uses. This loss of precision is partly compensated by the low cost of the DSLR (it is over an order of magnitude cheaper than the CCDs), and its capability for simultaneous multiband photometry. Additionally, DSLRs, like most consumer electronics, are improving at a rapid pace. A newer DSLR may perform much better than the 60D, with the downside of being less tested and less well-supported by existing software.
Acknowledgements
HATNet operations have been funded by NASA grants NNG04GN74G and NNX13AJ15G. Follow-up of HATNet targets has been partially supported through NSF grant AST-1108686. K.P. acknowledges support from NASA grant NNX13AQ62G. Data presented in this paper are based on observations obtained at the HAT station at the Fred Lawrence Whipple Observatory of SAO. We wish to thank M. Calkins, P. Berlind and G. Esquerdo at FLWO for their dedicated help in operating the HAT telescopes. We also thank Princeton University for coordinated turning off of the stadion lights next to Peyton hall to facilitate initial observations.
References
- Bakos et al. (2002) Bakos, G. Á., Lázár, J., Papp, I., Sári, P., & Green, E. M. 2002, PASP, 114, 974
- Bakos et al. (2004) Bakos, G. A., Noyes, R. W., Kovács, G., et al. 2004, PASP, 116, 266
- Bakos et al. (2010) Bakos, G. Á., Torres, G., Pál, A., et al. 2010, ApJ, 710, 1724
- Bakos et al. (2013) Bakos, G. Á., Csubry, Z., Penev, K., et al. 2013, PASP, 125, 154
- Greiner et al. (2008) Greiner, J., Bornemann, W., Clemens, C., et al. 2008, PASP, 120, 405
- Guyon & Martinache (2012) Guyon, O., & Martinache, F. 2012, in Society of Photo-Optical Instrumentation Engineers (SPIE) Conference Series, Vol. 8444, Society of Photo-Optical Instrumentation Engineers (SPIE) Conference Series
- Hartman et al. (2008) Hartman, J. D., Gaudi, B. S., Holman, M. J., et al. 2008, ApJ, 675, 1254
- Hartman et al. (2011) Hartman, J. D., Bakos, G. Á., Kipping, D. M., et al. 2011, ApJ, 728, 138
- Hartman et al. (2015) Hartman, J. D., Bayliss, D., Brahm, R., et al. 2015, AJ, 149, 166
- Hoot (2007) Hoot, J. E. 2007, Society for Astronomical Sciences Annual Symposium, 26, 67
- Kloppenborg et al. (2012) Kloppenborg, B. K., Pieri, R., Eggenstein, H.-B., Maravelias, G., & Pearson, T. 2012, Journal of the American Association of Variable Star Observers (JAAVSO), 40, 815
- Kovács et al. (2005) Kovács, G., Bakos, G., & Noyes, R. W. 2005, MNRAS, 356, 557
- Lang (2009) Lang, D. 2009, PhD thesis, University of Toronto, Canada
- Littlefield (2010) Littlefield, C. 2010, Journal of the American Association of Variable Star Observers (JAAVSO), 38, 212
- Pepper et al. (2007) Pepper, J., Pogge, R. W., DePoy, D. L., et al. 2007, PASP, 119, 923
- Pepper et al. (2013) Pepper, J., Siverd, R. J., Beatty, T. G., et al. 2013, ApJ, 773, 64
- Skrutskie et al. (2006) Skrutskie, M. F., Cutri, R. M., Stiening, R., et al. 2006, AJ, 131, 1163
- Street & SuperWASP Consortium (2004) Street, R. A., & SuperWASP Consortium. 2004, Baltic Astronomy, 13, 707