An automated multiscale ensemble simulation approach for vascular blood flow
Abstract
Cerebrovascular diseases such as brain aneurysms are a primary cause of adult disability. The flow dynamics in brain arteries, both during periods of rest and increased activity, are known to be a major factor in the risk of aneurysm formation and rupture. The precise relation is however still an open field of investigation. We present an automated ensemble simulation method for modelling cerebrovascular blood flow under a range of flow regimes. By automatically constructing and performing an ensemble of multiscale simulations, where we unidirectionally couple a 1D solver with a 3D lattice-Boltzmann code, we are able to model the blood flow in a patient artery over a range of flow regimes. We apply the method to a model of a middle cerebral artery, and find that this approach helps us to fine-tune our modelling techniques, and opens up new ways to investigate cerebrovascular flow properties.
keywords:
multiscale modelling, blood flow, ensemble simulation, parallel programming, high-performance computing0.1 Introduction
Stroke is a major cause of death and morbidity in the developed world. Subarachnoid haemorrhage (SAH) is a type of stroke characterised by bleeding into the fluid around the brain, for example due to the rupture of an intracranial aneurysm. An aneurysm is a congenital weakness in a blood vessel wall which gradually bulges out to form a balloon which can eventually burst. SAHs represent 5% of cases of stroke, but is relatively more important, as the mortality rate for these events is about 50%. Overall, approximately 5-10 people per 100,000 are affected by SAH due to bleeding in the intracranial arterial wall. [1] The mean age of the victims is 50 years and 10-15% fail to reach hospital. Unruptured aneurysms are much more prevalent, estimated to affect 1-5% of the population of the UK [2]. Indeed, unruptured / asymptomatic cerebral aneurysms are a relatively common finding when scanning the brain for other reasons [1]. Current methods of determining which aneurysms have a significant risk of subsequent rupture are based on crude measures such as aneurysm size and shape, and there is a clear need for a non-invasive tool to stratify risk more effectively in this large patient group.
Computational fluid dynamics (CFD) techniques may provide means to help quantification of the rupture risk, if they can incorporate the key conditions affecting brain aneurysms. Particularly high or low wall shear stress is believed to increase the risk of aneurysm rupture [3]. Researchers increasingly apply computational fluid dynamics to investigate these problems [4, 5, 6], and in particular Shojima et al. concluded that both a very high and a very low wall shear stress increases the chance of aneurysm growth and rupture in MCA aneurysms [7]. In alignment with these research efforts, we seek to establish computational diagnosis and prediction techniques, which may lead to major health benefits and reduce the costs of health care in the long term.
An essential driver for these CFD calculations is the flow solver, and over the last decade several sophisticated and scalable solvers have emerged. Within this work we rely on HemeLB (described in Section 0.2.1), which is highly optimized for modelling sparse geometries and has unique optimizations which allow it to achieve excellent load balance in the presence of complex boundary and in- and outflow conditions [8]. There are several other scalable flow solvers that are worth mentioning as well. These include the Nektar finite element package [9, 10, 11], the Palabos package [12, 13, 14], the Musubi environment [15, 16], MuPhy [17] and WaLBerla [18]. Although the aforementioned works have provided valuable insight into the haemodynamic environment of brain aneurysms, little is known about how the intrinsic variablity of blood flow throughout the day affects aneurysm growth and rupture.
The purpose of this paper is to present a tool which automatically creates an ensemble of multiscale blood flow simulations based on a set of clinically measurable patient parameters, and runs these simulations using supercomputing resources. The tool allows us to automate the study of the blood flow in a vascular geometry under varying patient-specific conditions. In addition, an automated data processing component extracts velocity and wall shear stress (WSS) values, and generates plots and animations which allow us to visualize these properties in the vascular geometry. This paper builds on previous works where we simulated flow in arterial networks using a single flow configuration [19, 20, 21].
To showcase our approach, we construct and execute a range of multiscale simulations of a middle cerebral artery (MCA). We present the results of these simulations, and compare our approach to related efforts as an initial validation of our 1D-3D multiscale scheme. This work is organised as follows. In Section 2, we present the tools we developed to perform our multiscale ensemble simulations and how we integrate them in an automated workflow. We describe the setup of our simulation in Section 3, our results in Section 4 and provide a brief discussion in Section 5.
0.2 Automated multiscale ensemble simulations
Our automated workflow combines three existing components. These include the HemeLB and pyNS simulation environments, and the FabHemeLB automation environment. In this section we describe these three components, and how they interoperate in our automated multiscale ensemble simulation (MES) environment.
0.2.1 HemeLB
HemeLB is a 3 dimensional lattice-Boltzmann simulation environment developed to simulate fluid flow in complex systems. It is a MPI parallelised C++ code with world-class scalability for sparse geometries. It can efficiently model flows in sparse cerebral arteries using up to 32,768 cores [22, 23] and utilises a weighted domain decomposition approach to minimize the overhead introduced by compute-intensive boundary and in-/outflow conditions [8]. HemeLB allows users to obtain key flow properties such as velocity, pressure and wall shear at predefined intervals of time, using a property-extraction framework.
HemeLB has previously been applied to simulate blood flow in healthy brain vasculature as well as in the presence of brain aneurysms [20, 24]. Segmented angiographic data from patients is read in by the HemeLB Setup Tool, which allows the user to visually indicate the geometric domain to be simulated. The geometry is then discretized into a regular unstructured grid, which is used as the simulation domain for HemeLB. HemeLB supports predefined velocity profiles at the inlets of the simulation domain, which we generate using pyNS in this work.
0.2.2 pyNS: Python Network Solver
pyNS is a discontinuous Galerkin solver developed in Python, which simulates haemodynamic behaviour in vascular networks [25]. pyNS uses aortic blood flow input based on a set of patient-specific parameters, and combines one-dimensional wave propagation elements to model arterial vasculature with zero-dimensional resistance elements to model veins. The solver requires two XML files as input data, one with a definition of the vasculature and one containing the simulation parameters. Simulation parameters include mean blood pressure, cardiac output, blood dynamic viscosity and heart rate. pyNS has been used in several studies, e.g. to try to inform treatment decisions on haemodialysis patients [26] and as a large-scale model for distributed multiscale simulations of cerebral arteries [19].
0.2.3 FabHemeLB
FabHemeLB is a Python tool which helps automate the construction and management of ensemble simulation workflows. FabHemeLB is an extended version of FabSim [27] configured to handle HemeLB operations. Both FabSim and FabHemeLB help to automate application deployment, execution and data analysis on remote resources. FabHemeLB can be used to compile and build HemeLB on any remote resource, to reuse machine-specific configurations, and to organize and curate simulation data. It can also submit HemeLB jobs to a remote resource specifying the number of cores and the wall clock time limit for completing a simulation. The tool is also able to monitor the queue status on remote resources, fetch results of completed jobs, and can conveniently combine functionalities into single one-line commands. In general, the FabHemeLB commands have the following structure:
fab <target machine> <command>:<parameter>=<value>,...
For example:
fab archer ensemble:config=/path/to/config,cores=1536,wall_time=05:00:00
| command name | brief description |
|---|---|
| cold | Copy HemeLB source to remote resource, compile and build everything. |
| run_pyNS | Execute instances of pyNS to generate a range of flow output files. |
| generate_LB | Convert pyNS output to HemeLB input. |
| submit_LB | Given a set of velocity profiles, submits the corresponding HemeLB jobs to the remote (supercomputer) resource. |
| fetch_results | Fetch all the simulation results from the remote resource and save them locally. |
| analyze | Performs data-analysis that allows for easy visualization of the results. |
| ensemble | Do all of the above, except cold. |
In table 1 we present a number of commands typically executed with FabHemeLB in the scope of this work. The commands are customised to run on local machines, continuous integration servers, regional, national or international supercomputing resources. The workflow is presented in the diagram of Figure 1. Specifically, the analyze command processes the compressed output files to generate human readable files and visualisations. It also generates an image file showing the whole geometry, wall shear stress within the geometry, and velocity measurements on pre-selected planes inside the geometry over time as an animation.

0.3 Setup
To apply our automated ensemble simulation tool, we employ patient-specific parameters measured by Sugawara et al. during a study to assess cardiac output during exercise [28]. They measured the blood pressure, cardiac output and heart rate of 16 young patients (9 male and 7 female) at different exercise intensities, being at rest or at 70%, 90%, 110% and 130% of the ventilatory threshold (VT). The VT is the point during exercise training at which pulmonary ventilation becomes disproportionately high with respect to oxygen consumption. This is believed to reflect onset of anaerobiosis and lactate accumulation. We add two more sets of values at 30% and 50% VT, linearly extrapolating the other parameters. The resulting seven sets of parameters are used in our automated workflow, resulting in seven HemeLB simulations being run. We present the seven sets of parameters in Table 2.
| Configuration | Exercise | Blood Pressure | Cardiac | Heart | mean flow |
| intensity | Mean | output | rate | velocity | |
| [mmHg] | [L/min] | [bpm] | [] | ||
| 1 | Rest | 80 | 4.8 | 68 | 0.460 |
| 2 | 30% VT | 87 | 6.2 | 79 | 0.451 |
| 3 | 50% VT | 94 | 7.6 | 90 | 0.428 |
| 4 | 70% VT | 100 | 9 | 101 | 0.393 |
| 5 | 90% VT | 112 | 10.7 | 113 | 0.371 |
| 6 | 110% VT | 116 | 11.9 | 120 | 0.351 |
| 7 | 130% VT | 122 | 13.2 | 134 | 0.339 |
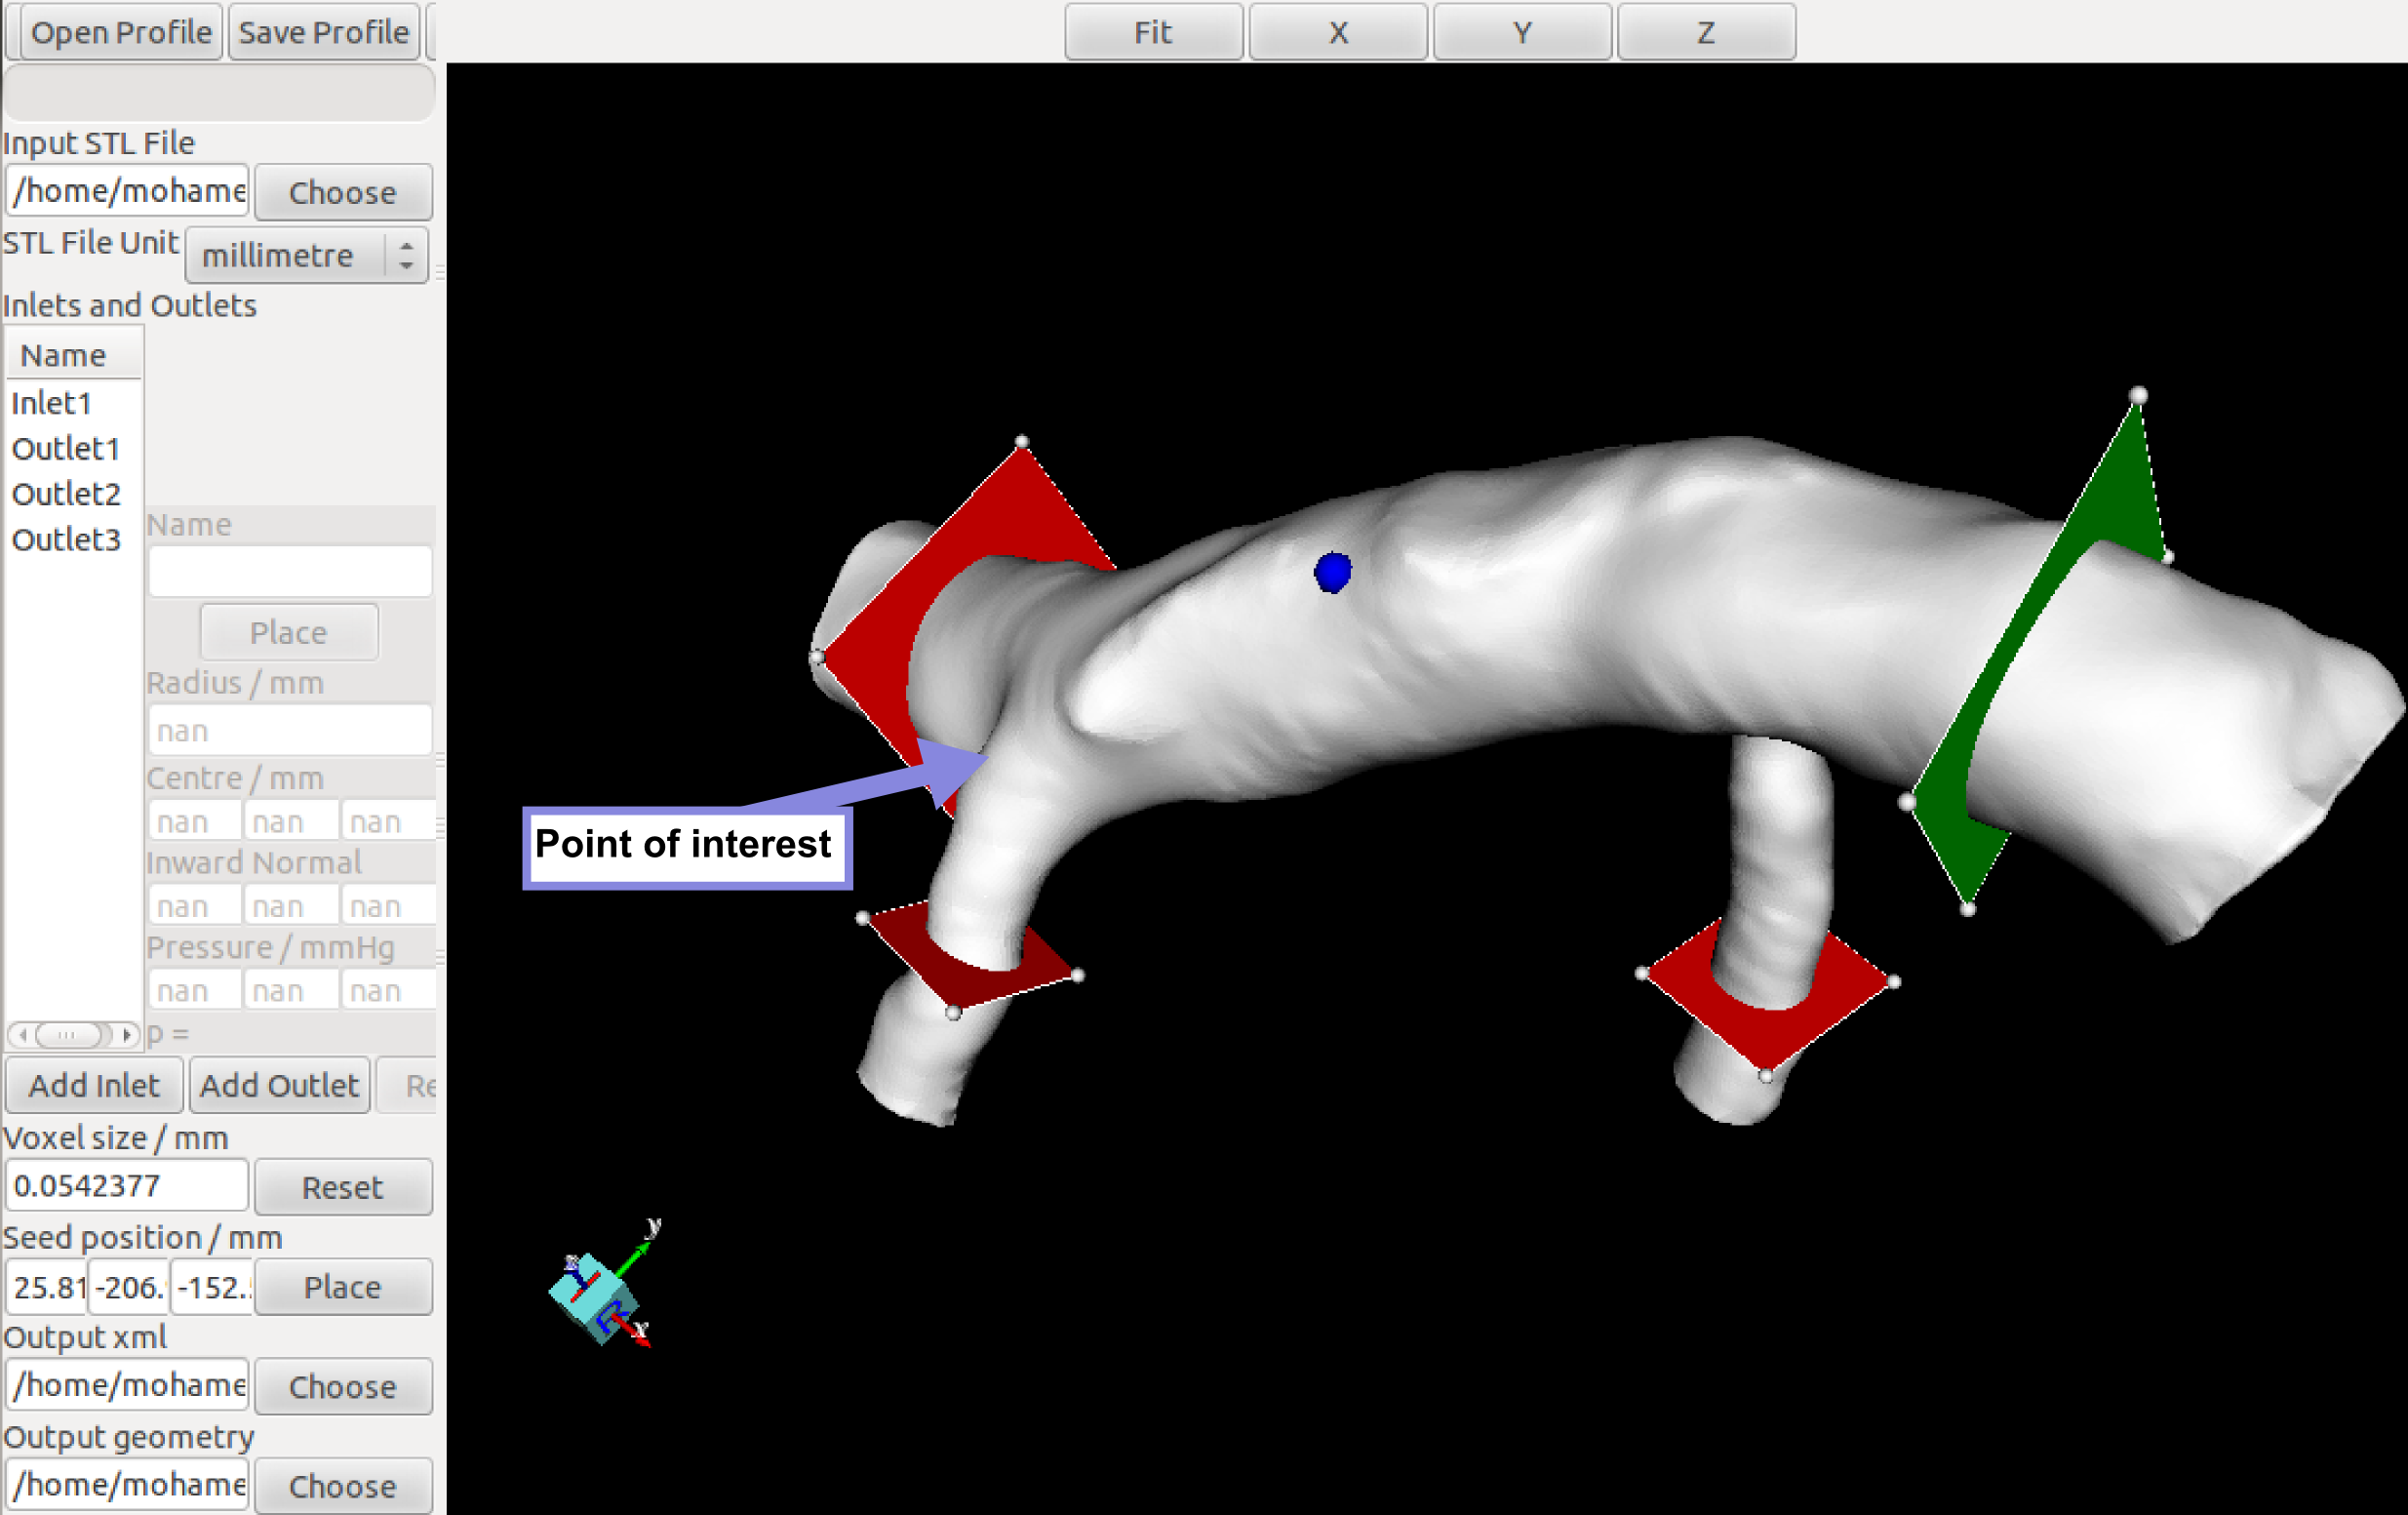
For our pyNS simulations, which we ran for 10 cardiac cycles, we set the blood density to 1050 , Poisson’s ratio of transverse to axial strain to 0.5 and the time step to 5 ms. For our HemeLB runs we use a model derived from a patient-specific angiographic 3D geometry of a middle cerebral artery, supplied by the Lysholm Department of Neuroradiology, University College Hospital, London and segmented using the GIMIAS tool [29]. We use a voxel size of , which results in a geometry containing 13,179,961 lattice sites. In Figure 2 we show the setup tool interface with the MCA geometry. Here the inlet is given by the green plane and the outlets by the red planes. The location of interest for our WSS analysis is highlighted. For simulations of this particular voxelized simulation domain, we specify a time-step of and run each simulation for 7.9 million steps, or 4 seconds of simulated time.
During our HemeLB runs, we store the WSS throughout the geometry for every 50,000 time steps. In addition, we define an output plane close to the outlet, at 49mm from the ear, 2mm away from the outflow boundary (or outlet), to record velocity and pressure data every 50,000 steps. In all our runs we use interpolated Bouzidi wall boundary conditions [30] and zero-pressure outlet conditions, (for details see [22]). Using the ensemble command, we run an ensemble of 7 simulations on the ARCHER supercomputer. In total, we used 10,752 (7 1536) cores for a duration of approximately 3.5 hours.
0.4 Results
We present the time series of the maximum velocity in the measurement plane in Figures 3 and 4 for the parameters listed in Table 2. The curves demonstrate that the frequency of the 1D cardiac cycles generated by pyNS are accurately reproduced in the 3D high-resolution HemeLB simulations. The peak velocity in the measurement plane is higher than the input velocity because the measurement plane has a lower area but the total flux remains constant throughout the MCA due to the incompressible flow.
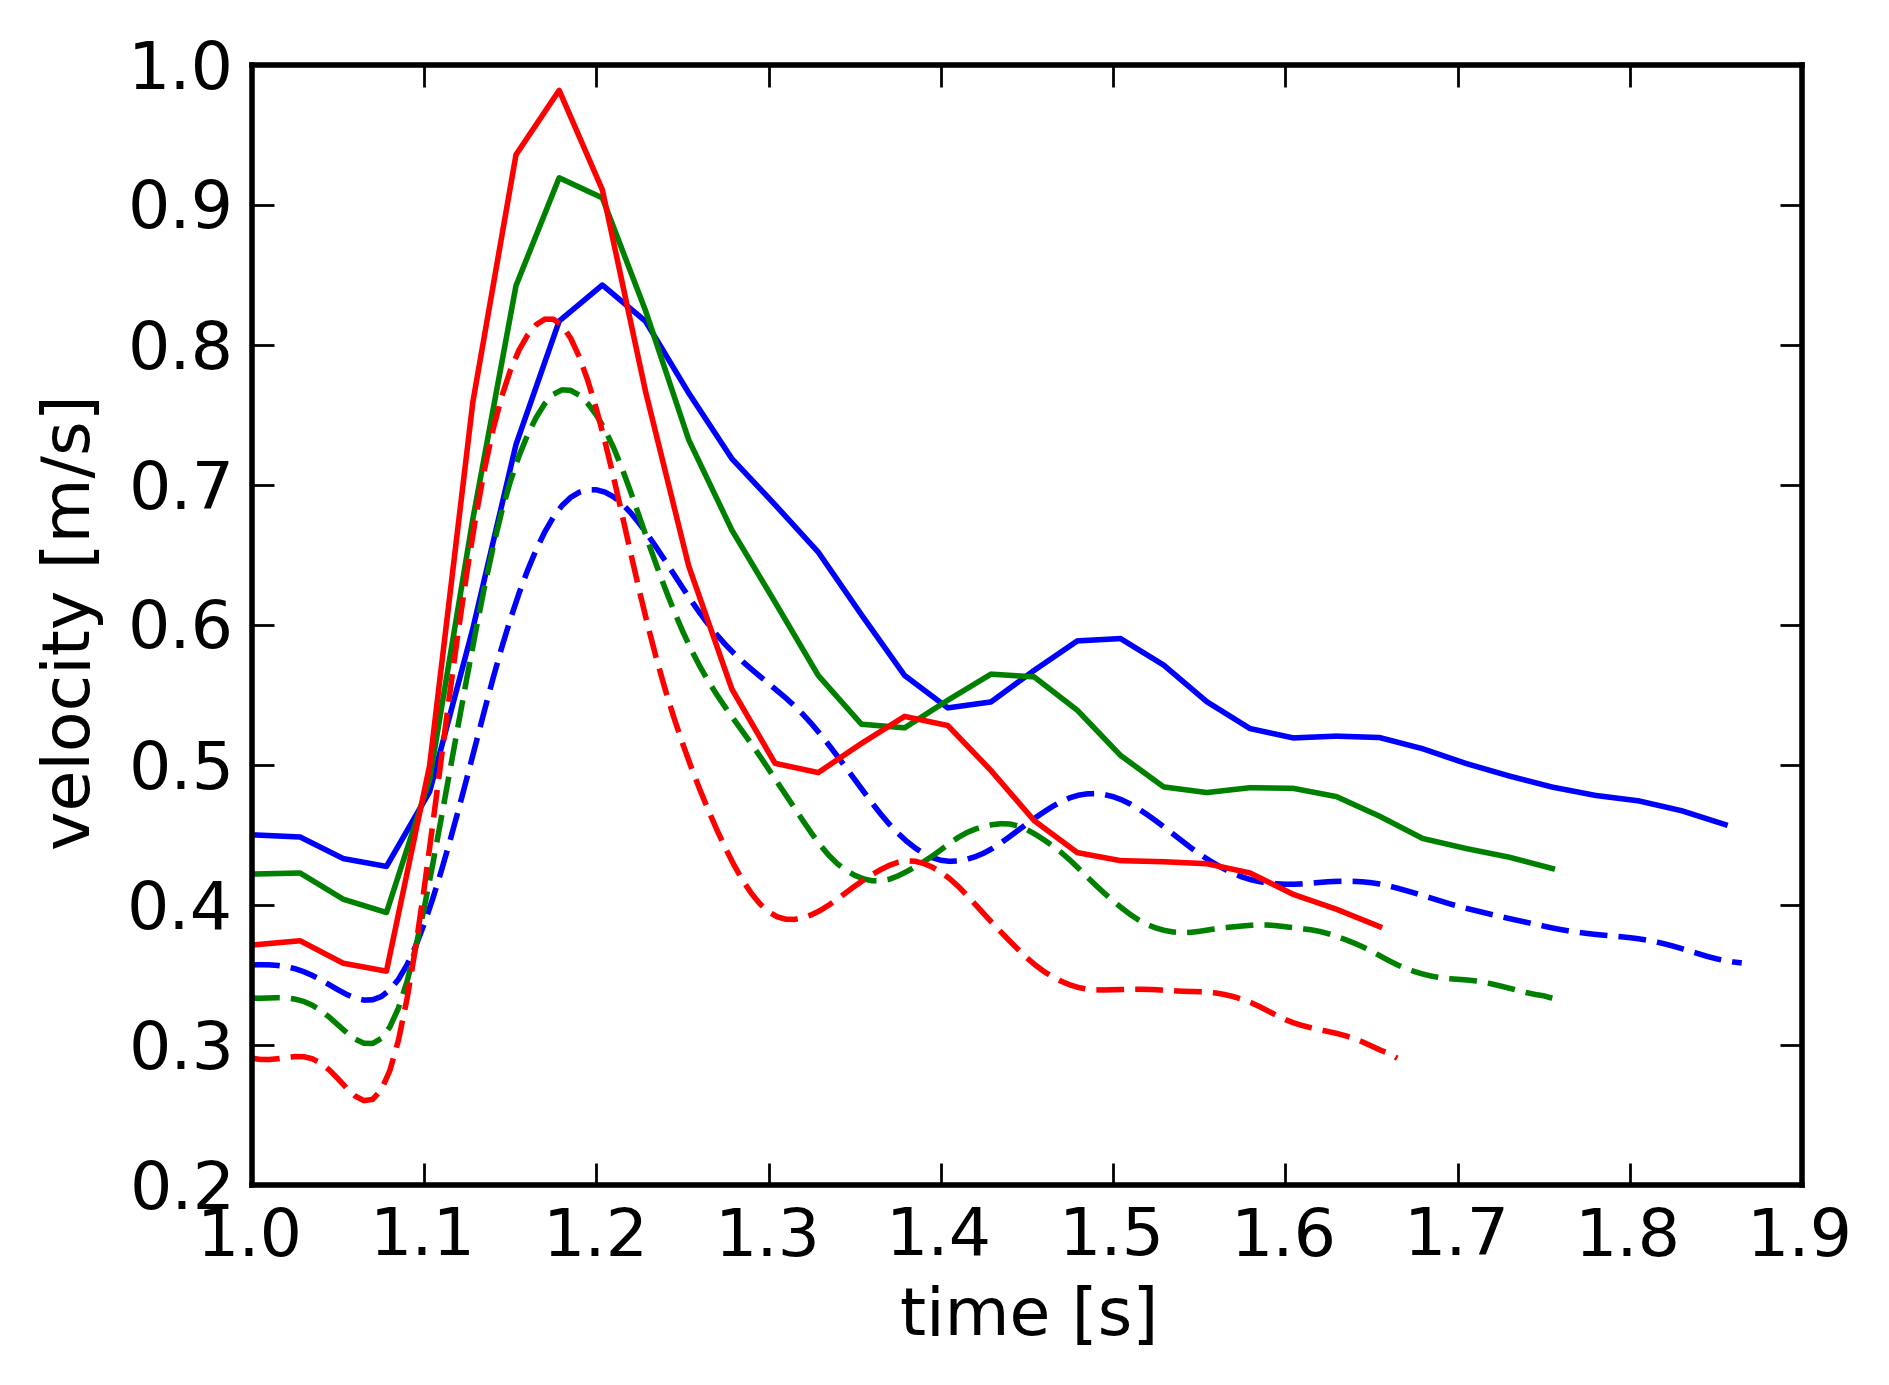
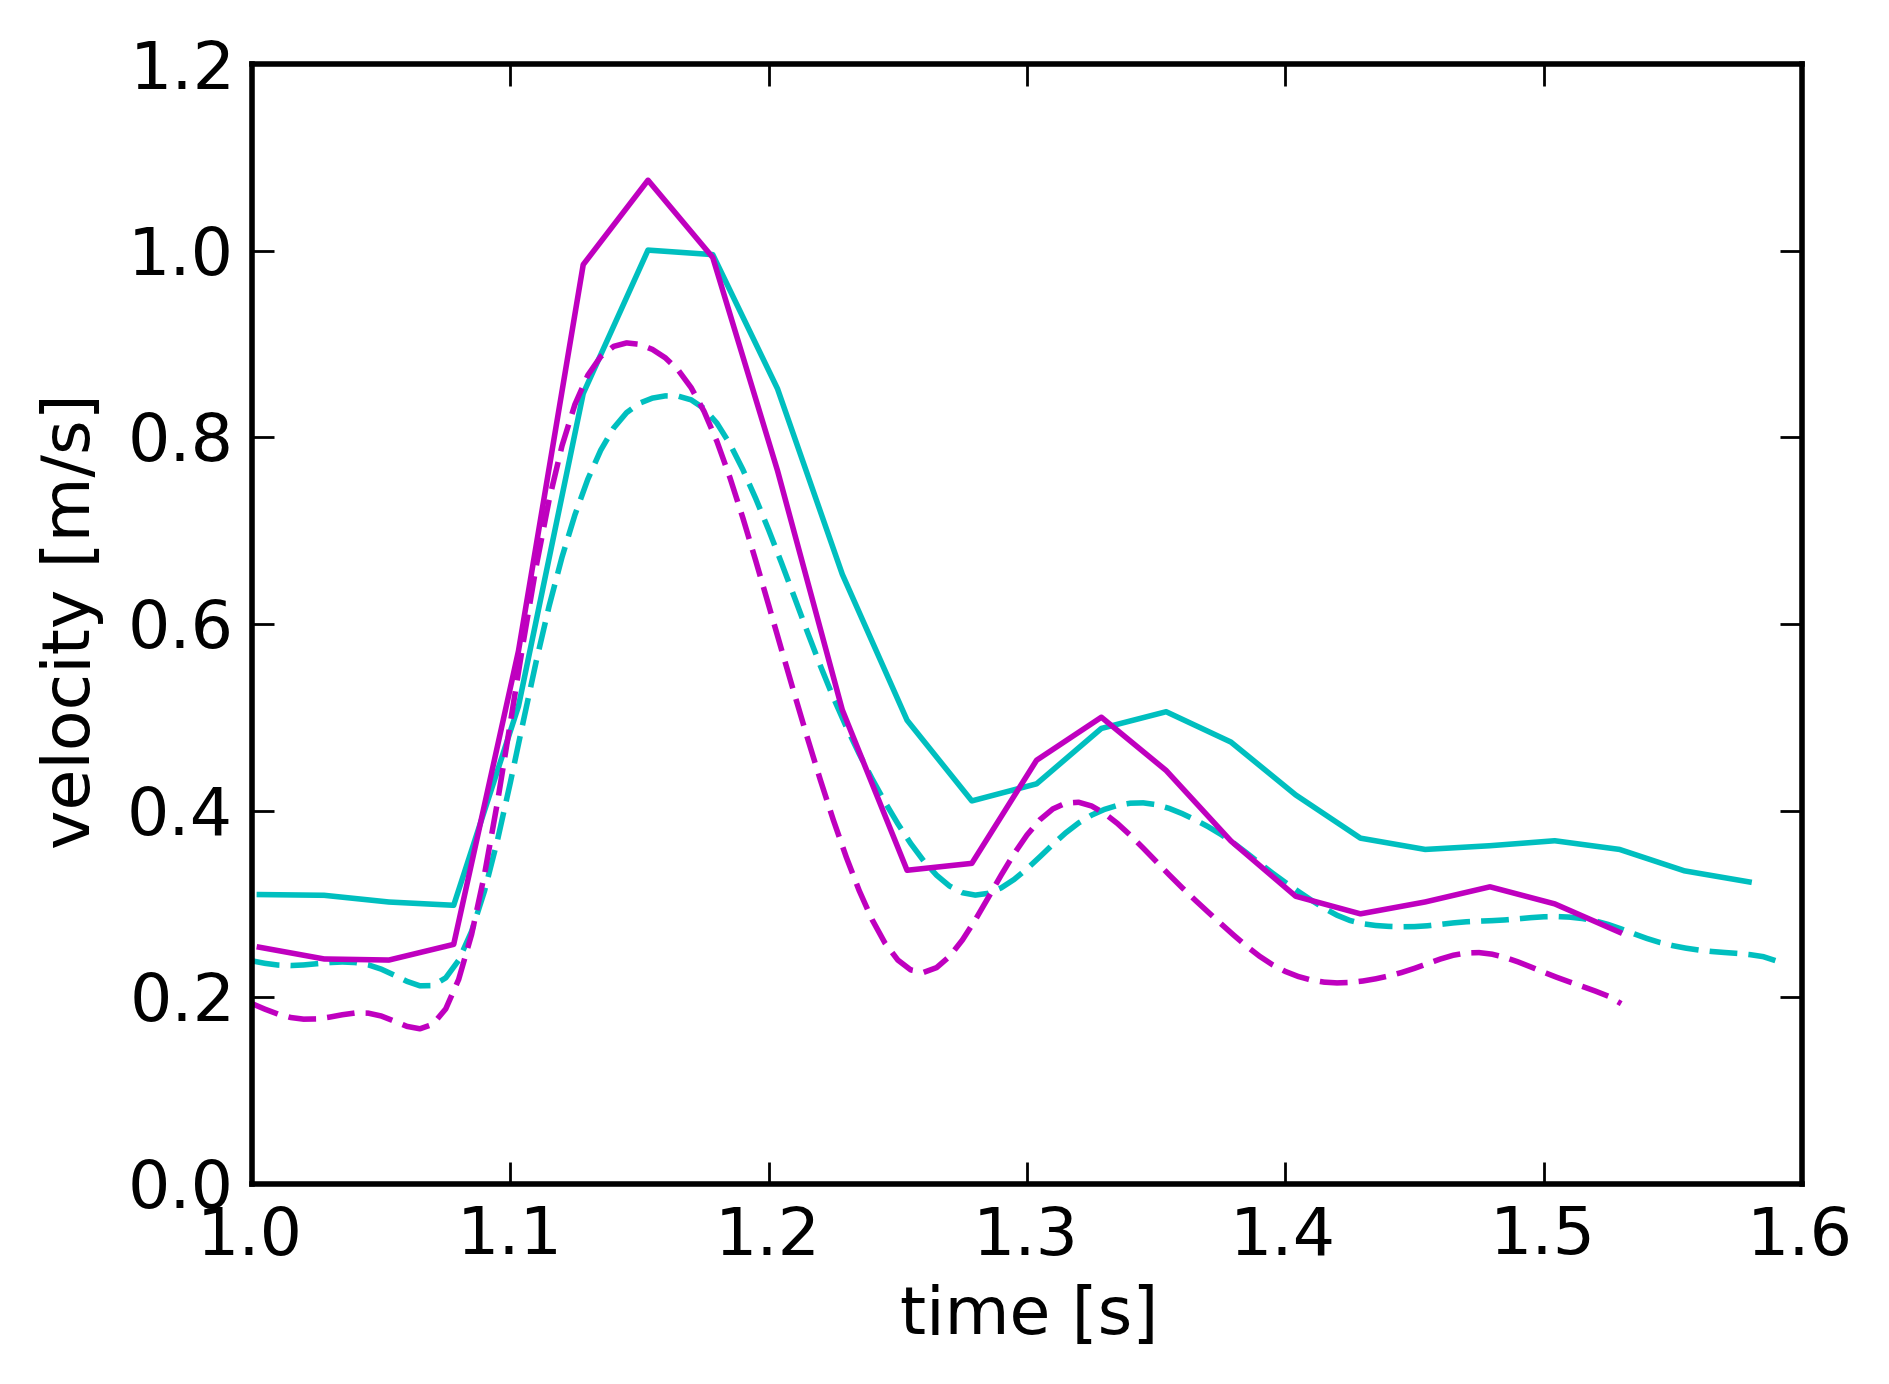
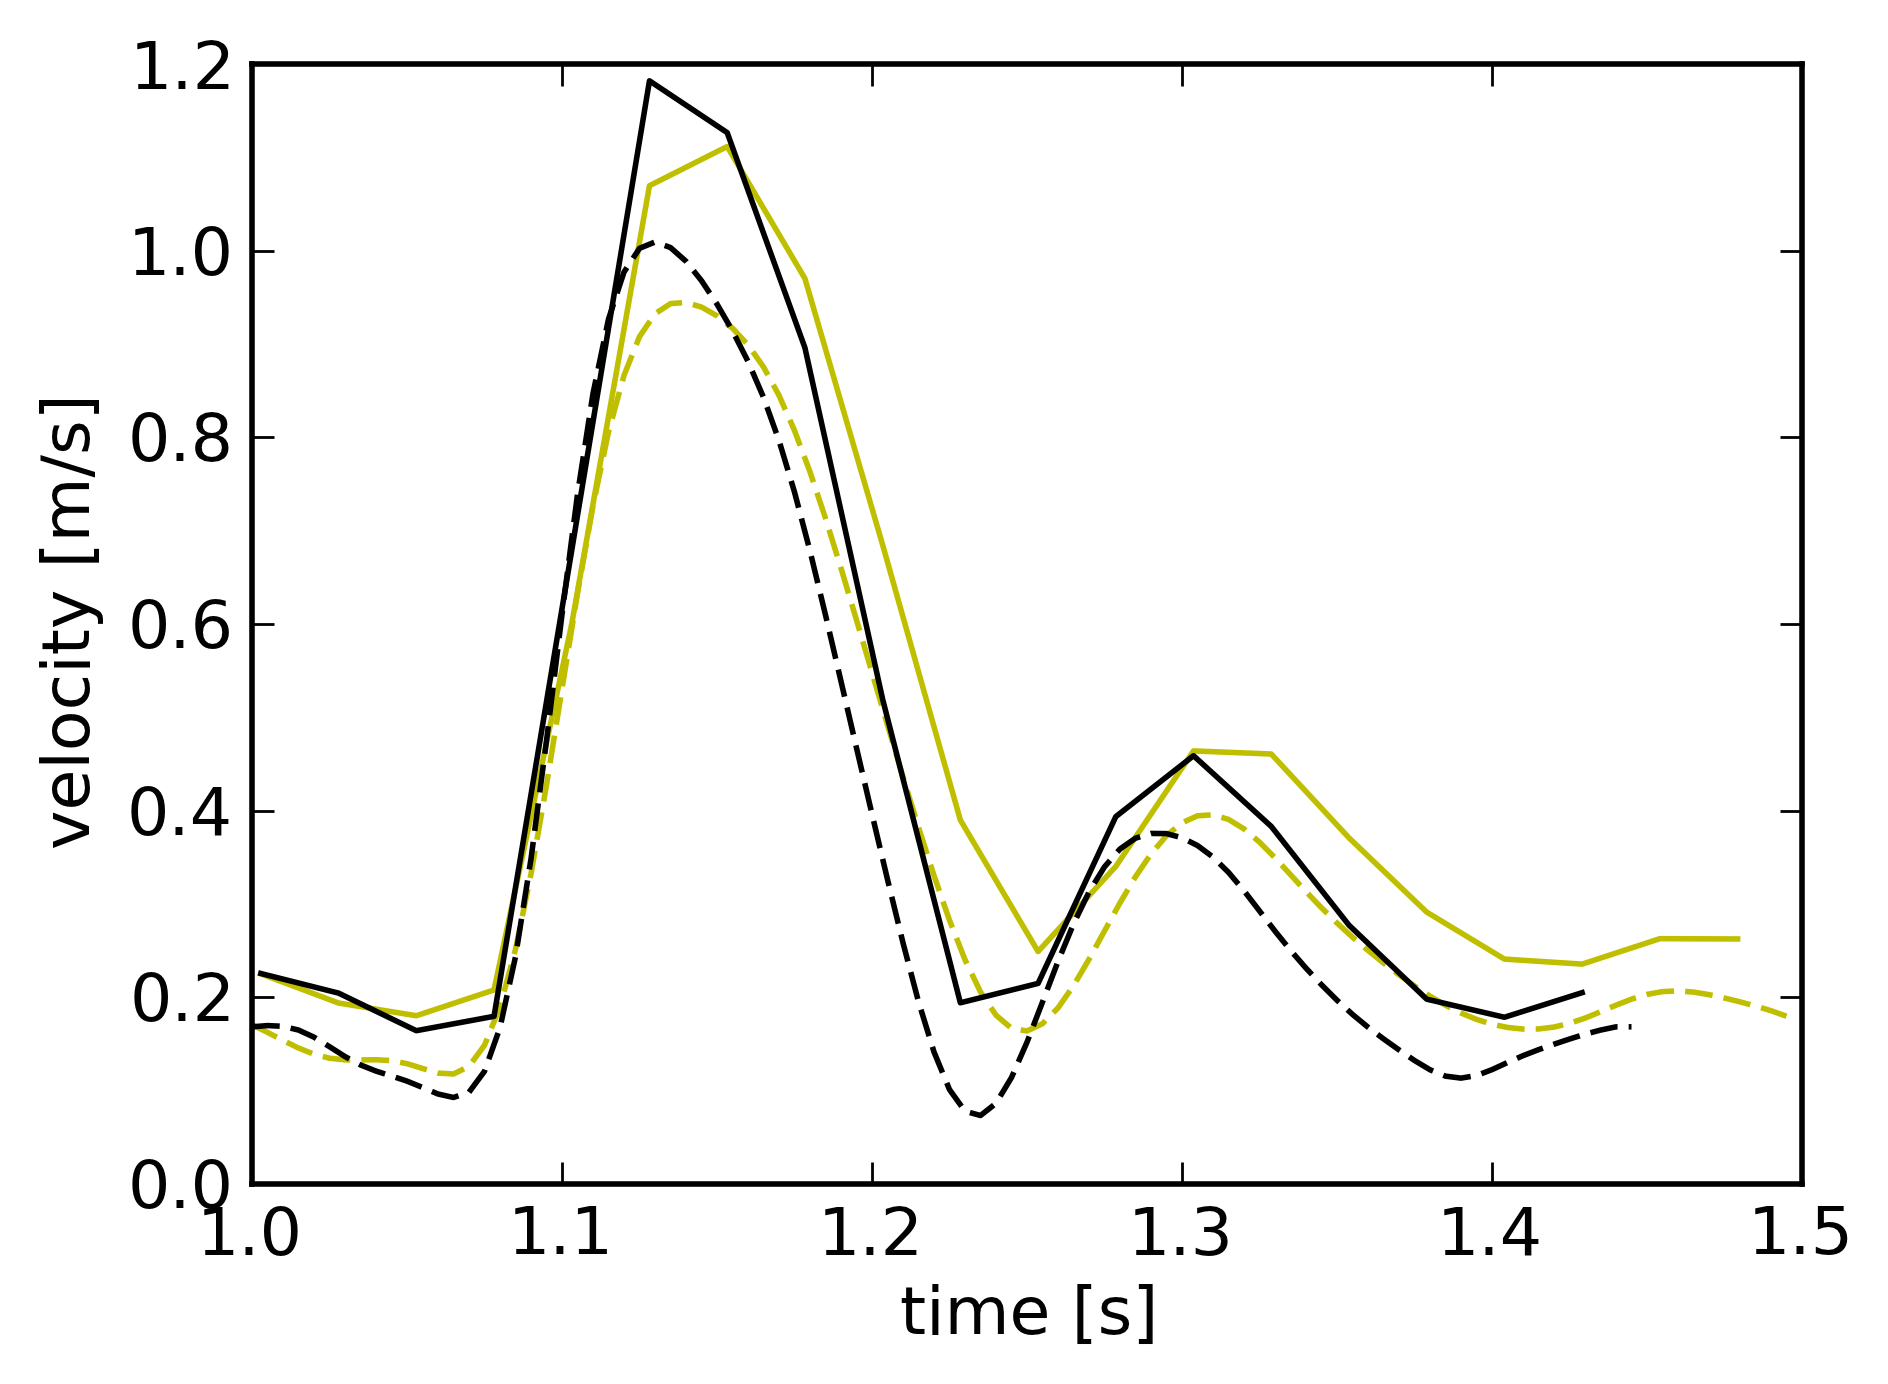
Within the ensemble, the frequency of the cardiac cycles increases with exercise intensity as the heart rate increases. While this seems trivial, it indicates that the time-resolution chosen to couple pyNS and HemeLB is sufficient to reproduce this effect. The good match between the input and the measurement gives confidence that the LB simulations have converged and the cardiac cycles are stable.
0.4.1 Wall shear stress
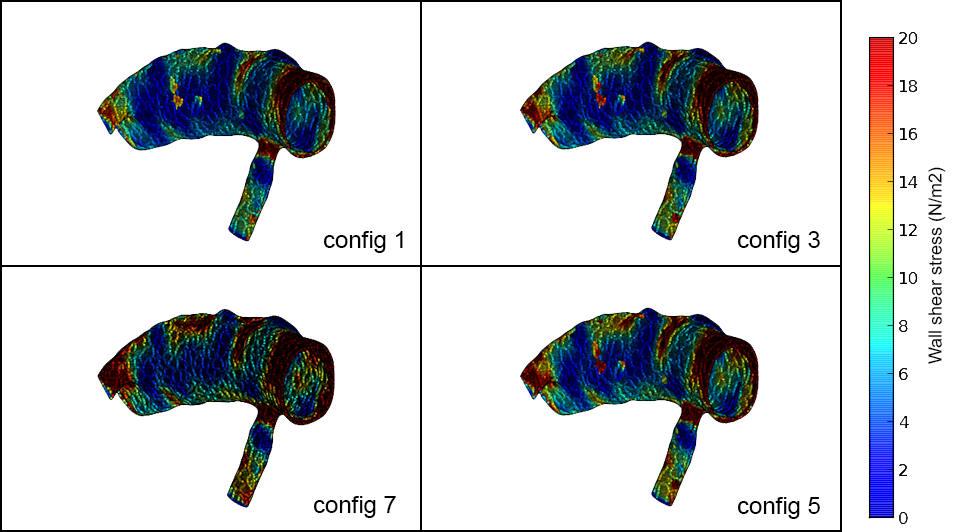
Figure 5 shows snapshots of the WSS for four configurations of the ensemble at the peak systole, when the flow velocity is highest. The colour scale allows us to identify regions of high WSS which are located predominantly at constrictions of the MCA and around the inlet in an assymetric pattern. Based on the WSS values near the inlet, we conclude that the standard circular-shaped Poisseuille velocity profile used in HemeLB is ill suited for patient-specific geometries, as they usually feature non-circular inlets. As a result, we are now developing a method for a modified velocity profile which takes non-circular inlet shapes into account.
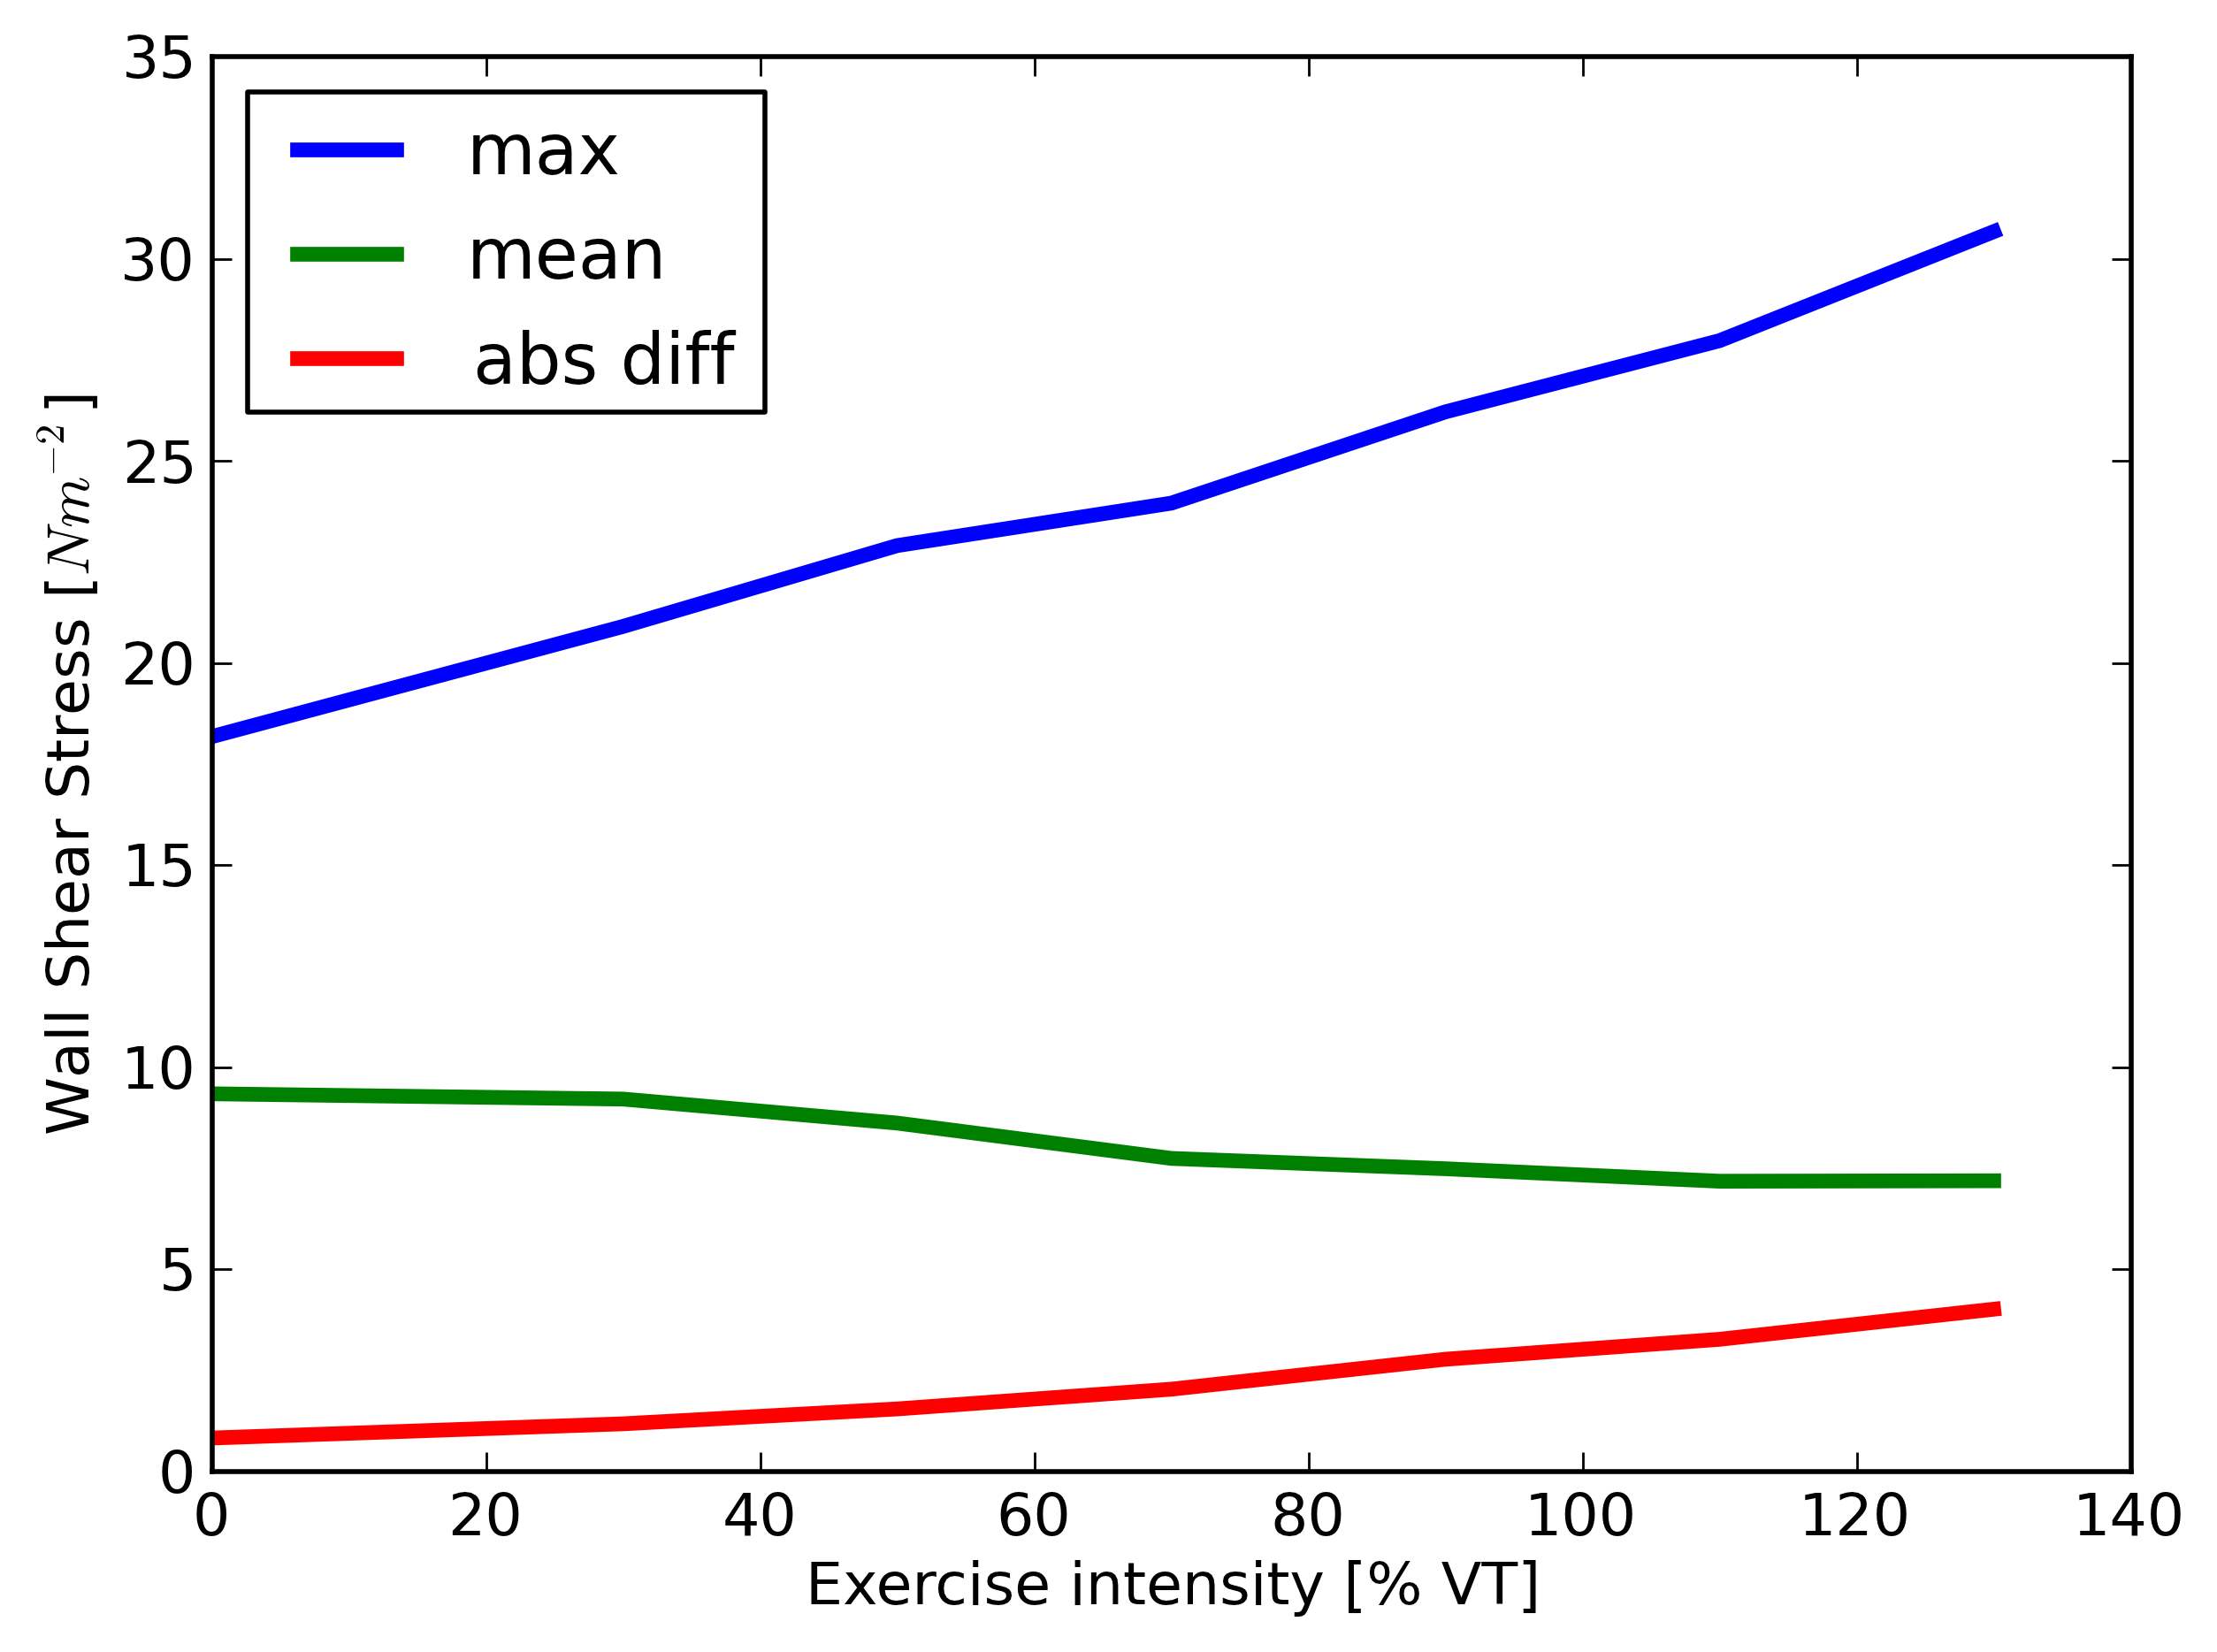
At the point of interest indicated in Fig. 2, we observe much higher wall shear stress at higher exercise intensity. We present a cross-instance analysis of the WSS at this point in Fig. 6. Here we provide for instance the mean WSS, which decreases linearly with the mean velocity at the inlet (see Table 2, both values are reduced to 0.75 times the magnitude at rest, when measured at 130% VT exercise intensity). This matches the theoretically expected linear scaling of the WSS with the velocity parallel to the wall. This parallel velocity is expected to be proportional to the velocity at the inlet for simple geometries and flow regimes. Our WSS results are in line with related literature, which report maximum values in MCAs in the range of 14 to 40 for unruptured aneurysm geometries [7, 31].
We also present the maximum WSS in time, which is for the run at rest, with a heart rate of 68 bpm and a maximum velocity of . At full exercise intensity, the maximum WSS is much higher, at for a heart rate of 134 bpm and a maximum velocity of . Here, while the mean WSS and velocity decrease with exercise intensity, the maximum WSS and velocity increase. Between these two cases, the difference in maximum WSS (a factor of 1.77) cannot be justified solely by the difference in maximum velocity (a factor of 1.45). Indeed, the (much larger) difference in heart rate (a factor of 1.97) may be an important contributor to the magnitude of the maximum WSS. Further investigations are required to explore the exact nature of these relations. The variability of the WSS, here measured as the averaged absolute difference between consecutive extractions at a 0.025 s interval, increases as expected with higher exercise intensity.
0.5 Discussion and conclusions
We present an automated ensemble simulation framework and its application to model blood flow in the middle cerebral artery under a range of patient-specific cardiac parameters, using a multiscale ensemble approach. We show good agreement of velocity profiles at the inlet with those close to the outlet, and that our non-lattice aligned inflow conditions require further enhancement. FabHemeLB allows us to run the whole workflow for the relatively complicated setup in one tool, including the execution and analysis of the ensemble simulations. It reduces the human effort required for doing these tasks, and by automatically scheduling the ensemble instances in parallel it also allows for efficient use of large core counts and a reduced time to solution. The systematic execution and analysis patterns offered by FabHemeLB allow us to easily identify shortcomings in our existing approach. Not only does this feature in FabHemeLB boost our ongoing research, it also provides the level of data curation required to do future, more extensive, validation studies.
In our case study, we investigate the wall shear stress (WSS) properties in a middle cerebral artery at a location of interest close to the outlet. We find that the mean WSS correlates as expected linearly with the average flow velocity at the inlet. However, in addition we find evidence that the maximum WSS is dependent on the heart rate as well as the average flow velocity. This implies that these relations are non-trivial, and that a comprehensive analysis of flow dynamics in cerebral arteries should not only include the presence of pulsatile flow, but also the presence of these flows over a range of heart rates.
0.6 Acknowledgements
We are grateful to Rupert Nash for his efforts on enabling property extraction for HemeLB, and to Aditya Jitta for performing the segmentation. This work has received funding from the CRESTA project within the EC-FP7 (ICT-2011.9.13) under Grant Agreements no. 287703, and from EPSRC Grants EP/I017909/1 (www.2020science.net) and EP/I034602/1. This work made use of the ARCHER supercomputer at EPCC in Edinburgh, via EPSRC and the UK Consortium on Mesoscopic Engineering Sciences (EP/L00030X/1). We have also used the Oppenheimer cluster, administered at the Chemistry Department at University College London.
References
- [1] T. Becske and G. I. Jallo. Subarachnoid Hemorrhage, eMedicine: http://emedicine.medscape.com/article/1164341-overview, 2010.
- [2] Brain Aneurysm - NHS choices: http://www.nhs.uk/conditions/aneurysm/Pages/Introduction.aspx, 2014.
- [3] P. Marques-Sanches, E. Spagnuolo, F. Martínez, P. Pereda, A. Tarigo, and V. Verdier. Aneurysms of the middle cerebral artery proximal segment (M1). Anatomical and therapeutic considerations. Revision of a series. Analysis of a series of the pre bifurcation segment aneurysms. Asian Journal of Neurosurgery, 2010.
- [4] L. Grinberg, E. Cheever, T. Anor, J. Madsen, and G. Karniadakis. Modeling blood flow circulation in intracranial arterial networks: A comparative 3d/1d simulation study. Annals of Biomedical Engineering, 39(1), 2011.
- [5] L. Formaggia, D. Lamponi, and A. Quarteroni. One dimensional models for blood flow in arteries. Journal of Engineering Mathematics, 47(3-4):251–276, 2003.
- [6] D. Fedosov, H. Noguchi, and G. Gompper. Multiscale modeling of blood flow: from single cells to blood rheology. Biomechanics and Modeling in Mechanobiology, 2014.
- [7] M. Shojima, M. Oshima, K. Takagi, R. Torii, M. Hayakawa, K. Katada, A. Morita, and T. Kirino. Magnitude and role of wall shear stress on cerebral aneurysm. Stroke, 2004.
- [8] D. Groen, D. Abou Chacra, R. W. Nash, J. Jaros, M. O. Bernabeu, and P. V. Coveney. Weighted decomposition in high-performance lattice-Boltzmann simulations: are some lattice sites more equal than others? Accepted for EASC 2014, ArXiv:1410.4713, October 2014.
- [9] Nektar: http://www.nektar.info/wiki.
- [10] H. Baek, M. Jayaraman, and G. Karniadakis. Wall shear stress and pressure distribution on aneurysms and infundibulae in the posterior communicating artery bifurcation. Annals of Biomedical Engineering, 37(12):2469–2487, 2009.
- [11] L. Grinberg, J.A. Insley, D.A. Fedosov, V. Morozov, M.E. Papka, and G.E. Karniadakis. Tightly coupled atomistic-continuum simulations of brain blood flow on petaflop supercomputers. Computing in Science Engineering, 14(6):58–67, 2012.
- [12] Palabos: http://www.palabos.org/.
- [13] H. Anzai, M. Ohta, J.-L. Falcone, and B. Chopard. Optimization of flow diverters for cerebral aneurysms. Journal of Computational Science, 3(1):1–7, 2012.
- [14] J. Borgdorff, M. Ben Belgacem, C. Bona-Casas, L. Fazendeiro, D. Groen, O. Hoenen, A. Mizeranschi, J. L. Suter, D. Coster, P. V. Coveney, W. Dubitzky, A. G. Hoekstra, P. Strand, and B. Chopard. Performance of distributed multiscale simulations. Philosophical Transactions of the Royal Society A: Mathematical, Physical and Engineering Sciences, 372(2021), 2014.
- [15] MUSUBI: https://bitbucket.org/apesteam/musubi.
- [16] M. Hasert, K. Masilamani, S. Zimnya, H. Klimachb, J. Qi, J. Bernsdorf, and Roller S. Complex fluid simulations with the parallel tree-based lattice boltzmann solver musubi. Journal of Computational Science, 5(5):784–794, 2014.
- [17] M. Bernaschi, S. Melchionna, S. Succi, M. Fyta, E. Kaxiras, and J.K. Sircar. Muphy: A parallel multi physics/scale code for high performance bio-fluidic simulations. Computer Physics Communications, 180(9):1495–1502, 2009.
- [18] B. Gmeiner, H. Köstler, M. Stürmer, and U. Rüde. Parallel multigrid on hierarchical hybrid grids: a performance study on current high performance computing clusters. Concurrency and Computation: Practice and Experience, 26(1):217–240, 2014.
- [19] D. Groen, J. Borgdorff, C. Bona-Casas, J. Hetherington, R.W. Nash, S.J. Zasada, I. Saverchenko, M. Mamonski, K. Kurowski, M.O. Bernabeu, A.J. Hoekstra, and P.V. Coveney. Flexible composition and execution of high performance, high fidelity multiscale biomedical simulations. Interface Focus, 3(2):20120087, 2013.
- [20] M.O. Bernabeu, R.W. Nash, D. Groen, H.B. Carver, J. Hetherington, T. Krüger, and P.V. Coveney. Impact of blood rheology on wall shear stress in a model of the middle cerebral artery. Interface Focus, 3(2):20120094, 2013.
- [21] D. Groen, S. Rieder, and S. Portegies Zwart. Mpwide: a light-weight library for efficient message passing over wide area networks. Journal of Open Research Software, 1(1), 2013.
- [22] HemeLB: http://ccs.chem.ucl.ac.uk/hemelb.
- [23] D. Groen, J. Hetherington, H. B. Carver, R. W. Nash, M. O. Bernabeu, and P. V. Coveney. Analyzing and modeling the performance of the HemeLB lattice-Boltzmann simulation environment. Journal of Computational Science, 4(5):412 – 422, 2013.
- [24] M. Mazzeo, S. Manos, and P.V. Coveney. In situ ray tracing and computational steering for interactive blood flow simulation. Computer Physics Communications, 181(2):355–370, 2010.
- [25] S. Manini, L. Antiga, L. Botti, and A. Remuzzi. pyNS: An open-source framework for 0d haemodynamic modelling. Annals of Biomedical Engineering, pages 1–13, 2014.
- [26] A. Caroli, S. Manini, L. Antiga, K. Passera, B. Ene-Iordache, S. Rota, G. Remuzzi, A. Bode, J. Leermakers, F. van de Vosse, R. Vanholder, M. Malovrh, J. Tordoir, and A. Remuzzi. Validation of a patient-specific hemodynamic computational model for surgical planning of vascular access in hemodialysis patients. Kidney International, 84:1237–1245, 2013.
- [27] FabSim: http://www.github.com/djgroen/FabSim.
- [28] J. Sugawara, M. Tanabe, T. Miyachi, K. Yamamoto, K. Takahashi, M. Iemitsu, T. Otsuki, S. Homma, S. Maeda, R. Ajisaka, and M. Matsuda. Non-invasive assessment of cardiac output during exercise in healthy young humans: comparison between modelflow method and doppler echocardiography method. Acta Physiol. Scand., 179(4):361–366, 2003.
- [29] Gimias: http://www.gimias.org/.
- [30] M. Bouzidi, M. Firdaouss, and P. Lallemand. Momentum transfer of a Boltzmann-lattice fluid with boundaries. Physics of Fluids, 13(11):3452–3459, 2001.
- [31] J. R. Cebral, F. Mut, J. Weir, and C. Putman. Quantitative characterization of the hemodynamic environment in ruptured and unruptured brain aneurysms. American Journal of Neuroradiology, 32(1):145–151, 2011.