OmegaWINGS: OmegaCAM@VST observations of WINGS galaxy clusters††thanks: Based on observations made with VST at ESO Paranal Observatory under program ID 88.A-4005, 089.A-0023, 090.A-0074, 091.A-0059, and 093.A-0041.
Abstract
Context. Wide-field observations targeting galaxy clusters at low redshift are complementary to field surveys and provide the local benchmark for detailed studies of the most massive haloes in the local Universe. The Wide-field Nearby Galaxy-cluster Survey (WINGS) is a wide-field multi-wavelength survey of X-ray selected clusters at 0.04-0.07. The original WINGS field-of-view has now been extended to cover a 1 deg2 field with both photometry and spectroscopy.
Aims. In this paper we present the Johnson and -band OmegaCAM/VST observations of 46 WINGS clusters, together with the data reduction, data quality and Sextractor photometric catalogs.
Methods. The data reduction was carried out with a modified version of the ESO-MVM (a.k.a. ”ALAMBIC”) reduction package, adding a cross-talk correction, the gain harmonisation and a control procedure for problematic CCDs. The stray-light component has been corrected by employing our own observations of populated stellar fields.
Results. With a median seeing of in both bands, our 25-minutes exposures in each band typically reach the 50% completeness level at mag. The quality of the astrometric and photometric accuracy has been verified by comparison with the 2MASS as well as with SDSS astrometry, and SDSS and previous WINGS imaging. Star/galaxy separation and sky-subtraction procedure have been tested comparing with previous WINGS data.
Conclusions. The Sextractor photometric catalogues are publicly available at the CDS, and will be included in the next release of the WINGS database on the VO together with the OmegaCAM reduced images. These data form the basis for a large ongoing spectroscopic campaign with AAOmega/AAT and is being employed for a variety of studies.
Key Words.:
Methods: observational – Catalogs – Galaxies: clusters: general – Galaxies: photometry – Galaxies: fundamental parameters1 Introduction
Galaxy clusters, the most massive collapsed structures in the Universe, play an important role for both cosmology and galaxy evolution studies. They are the tail of a continuum distribution of halo masses, and the most extreme environments where galaxy formation has proceeded at an accelerated rate compared to the rest of the Universe. Clusters have been a testbed for studies of galaxy formation and evolution, uncovering trends that several years later have been found also in the field (Butcher & Oemler 1978; Couch & Sharples 1987; Dressler et al. 1997). They are a repository for galaxies that have been shaped in lower halo-mass environments (Wilman et al. 2009), but also the sites where essentially all environmental effects are thought to take place, from strangulation to ram pressure stripping, and even mergers (De Lucia et al. 2010). As peaks in the matter distribution, they host those galaxies that have formed first and in the most extreme primordial conditions, and at the same time where the hierarchical growth is most evident, like brightest cluster galaxies. There is no better place than rich clusters in the low-z universe to find and study the descendants of the most massive galaxies observed at high-z (Poggianti et al. 2013).
The WIde-field Nearby Galaxy-cluster Survey (WINGS) is a wide-field and multiwavelength survey of 76 galaxy clusters in the local Universe (Fasano et al. 2006). The sample consists of all clusters at in both hemispheres at Galactic latitude selected from the ROSAT X-ray-Brightest Abell-type Cluster Sample, the Brightest Cluster Sample and its extension (Ebeling et al. 1996, 1998, 2000).
The original WINGS survey is based on and imaging for the 76 clusters over a field-of-view (FOV) taken with the Wide Field Cameras on the INT and the 2.2MPG/ESO telescopes (Varela et al. 2009). - and -band Wide Field Camera imaging at UKIRT (Valentinuzzi et al. 2009) and -band with the INT, LBT and BOK telescopes (Omizzolo et al. 2014) were secured for a subset of clusters. Spectroscopy was obtained over the FOV with 2dF/AAT ( usable spectra) and WYFFOS/WHT ( spectra) (Cava et al. 2009). These data allowed us to derive galaxy morphologies (Fasano et al. 2012), surface photometry and sizes (D’Onofrio et al. 2014), stellar masses, star formation histories, and spectral types (Fritz et al. 2011, 2014; Vulcani et al. 2011), as well as characterise the cluster substructure and dynamics (Ramella et al. 2007, Cava et al. submitted), and conduct a number of studies on galaxy properties and evolution (a full publication list can be found at the WINGS website111http://web.oapd.inaf.it/wings). The WINGS data and data products are publicly available through the Virtual Observatory (VO), as explained in Moretti et al. (2014).
The WINGS optical images, together with the photometry and source classification, were used to calibrate the photometry presented in this paper and for other purposes, as described in the following sections.
The WINGS dataset is unique, as none of the other low-z surveys investigate a large sample of clusters and cluster galaxies in such detail. GAMA offers an exquisite sampling down to low-mass haloes, but it lacks a large number of massive clusters at redshifts comparable to WINGS (Robotham et al. 2011). The SDSS (York et al. 2000) provides large cluster catalogues, but has a much lower imaging quality (for seeing, depth, pixel scale, see below), and is 1.5 magnitudes shallower than WINGS spectroscopy, yielding a smaller dynamic range of galaxy magnitudes and masses at the WINGS redshifts.
The main limitation of the original WINGS data is that they cover only the cluster cores: the maximum clustercentric distance reached in (almost) all clusters by the INT+2.2m imaging is only 0.6 times the virial radius. Crucially, what was missing is the coverage out to at least the virial radius and into the outer regions. This would be of primary importance, as it would link clusters with the surrounding populations and the field.
Clusters accrete individual galaxies and larger subclumps from their outskirts. The outer regions of clusters are the transition regions between the cores, with their dense and hot intracluster medium, and the filaments (and/or groups) feeding the cluster, at the point where galaxies are subject to a dramatic change of environment. Indeed, observations have proved that the cluster outskirts are essential to understand galaxy transformations (Lewis et al. 2002; Pimbblet et al. 2002; Treu et al. 2003; Moran et al. 2007). Moreover, the projected clustercentric radius of galaxies statistically retains memory of the epoch when the galaxy first became part of a massive structure and became a satellite (Smith et al. 2012; De Lucia et al. 2012). Cosmological hydrodynamical simulations predict a depletion of both hot and cold gas and a decline in the star-forming fraction of galaxies as far out as 5 cluster virial radii (Bahé et al. 2013). With the exception of a few single clusters and superclusters (Merluzzi et al. 2010, 2015; Mahajan et al. 2011; Smith et al. 2012; Haines et al. 2011, e.g.), this very important transition region between clusters and the surrounding field remains largely unexplored.
With the aim to cover the virial region and extend out into the infall region, we have obtained GTO OmegaCAM/VST imaging in the , and bands over for 45 fields covering 46 WINGS clusters. A large spectroscopic campaign to follow up the clusters observed with OmegaCAM is ongoing with AAOmega/AAT (Moretti et al. in prep.). This imaging+spectroscopic dataset is from now on named OmegaWINGS.
This paper presents the OmegaCAM/VST and imaging, the observations (Sect. 2), data reduction (Sect. 3), the release of photometric catalogs (Sect. 4) and data quality (Sect. 5). The -band campaign is still ongoing and will be presented in a subsequent paper.
In the following, we use , , .
2 Observations
The VLT Survey Telescope (VST, Capaccioli & Schipani 2011) is a 2.6-m wide field optical telescope placed at Cerro Paranal, Chile. The telescope is equipped with OmegaCAM (Kuijken 2011), a camera that samples the 1 deg2 VST unvignetted field of view with a mosaic of 32 4k 2k CCDs at /pix. The layout of the OmegaCAM mosaic is shown in Fig. 1; the ESO identification name is superimposed to each CCD.

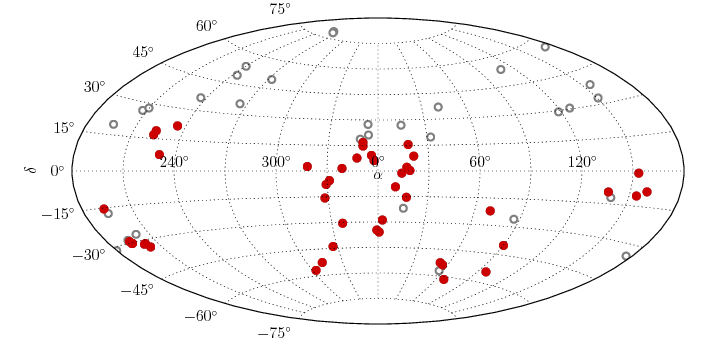
OmegaWINGS target clusters were randomly selected from the 57 WINGS clusters that can be observed from VST (). We obtained service-mode and -band imaging for 46 of them with 45 OmegaCAM pointings. Two WINGS clusters –A3528a and A3528b– were observed with a single VST pointing; hereafter this will be referred to as A3528. The position of the target clusters observed by the OmegaWINGS survey are shown in Fig. 2. The choice of filters was taken for consistency with the original WINGS survey, despite the problems related with the segmentation of OmegaCAM Johnson’s filters that are discussed at the end of this section.
Observations started in October 2011 and were concluded in September 2013. The first observations were carried out during ESO period P88 with the OmegaCAM STARE-mode, splitting the total exposure time in observations with no offsets. We adopted this observing mode to obtain a constant signal to noise ratio across the field of view, as in the original WINGS survey. Starting from period P89 we optimised our observing strategy, taking exposures in DITHER-mode, with and offsets in horizontal and vertical direction, respectively. This observing strategy offers two major advantages: it allows to dither out the gaps between the CCDs and to estimate the contribution of the background light (see next section for details). The log of our observations is summarised in Table 2.
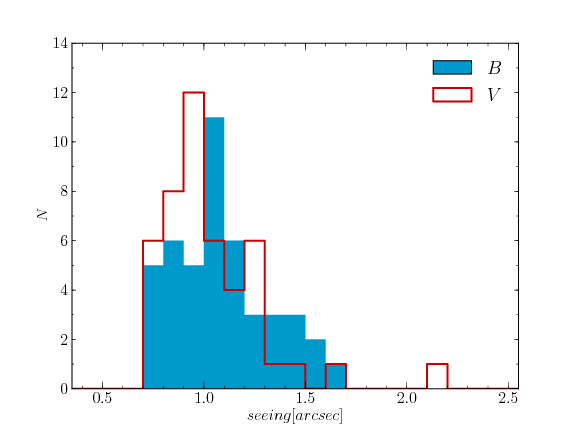
On average, observing conditions were better in -band than in -band. We measured the seeing on each OmegaWINGS image as the mean value of the FWHM of stars profiles. The values are listed in Table 2 and shown in Fig. 3. The seeing is lower than in 80% of -band images, and lower than in 80% of -band ones. The median values of seeing are in both - and -band.
Since OmegaCAM and filters are segmented and composed by 4 quadrants, the interface of the quadrants casts a slight shadow in the form of a cross onto the image plane. This central vignetting cross is wide in both directions. Figure 1 shows a raw flat-field image in the -band, where the vignetting is clearly visible. To remove it from the final stacked images, the OmegaCAM User Manual222 http://www.eso.org/sci/facilities/paranal/instruments/omegacam/doc.html suggests a dithering pattern with steps that should be in both and direction. Such wide steps would reduce the field of view covered by 5 exposures. Considering that the central region of each target cluster is covered by WINGS data, we decided to use smaller dithering steps. However, in this way the vignetting cross can not be entirely removed, and our final images have a vertical stripe wide that is strongly affected by vignetting and that was therefore masked out. The horizontal component of the vignetting cross was instead perfectly removed.
| cluster | DATEOBSB | DATEOBSV | src | ||
|---|---|---|---|---|---|
| A85 | 2013-09-03 | 2013-08-03 | SDSS | ||
| A119 | 2011-12-17 | 2011-10-23 | SDSS | ||
| A147 | 2013-07-15 | 2013-08-05 | SDSS | ||
| A151 | 2012-11-17 | 2012-11-04 | 2MASS | ||
| A160 | 2011-10-21 | 2011-10-21 | SDSS | ||
| A168 | 2013-07-18 | 2013-08-03 | SDSS | ||
| A193 | 2011-10-21 | 2011-10-21 | SDSS | ||
| A500 | 2011-11-28 | 2011-12-02 | 2MASS | ||
| A754 | 2011-11-30 | 2011-11-22 | 2MASS | ||
| A957x | 2012-03-26 | 2011-11-23 | SDSS | ||
| A970 | 2011-12-23 | 2011-11-24 | 2MASS | ||
| A1069 | 2013-04-13 | 2013-05-07 | 2MASS | ||
| A1631a | 2013-03-22 | 2013-02-10 | 2MASS | ||
| A1983 | 2012-05-18 | 2012-03-31 | SDSS | ||
| A1991 | 2013-04-15 | 2013-04-14 | SDSS | ||
| A2107 | 2013-04-08 | 2013-04-10 | SDSS | ||
| A2382 | 2012-07-20 | 2012-06-26 | 2MASS | ||
| A2399 | 2012-06-16 | 2012-05-29 | SDSS | ||
| A2415 | 2012-07-26 | 2012-07-22 | SDSS | ||
| A2457 | 2012-06-16 | 2012-07-15 | SDSS | ||
| A2589 | 2013-07-16 | 2013-07-13 | SDSS | ||
| A2593 | 2012-10-08 | 2012-10-08 | SDSS | ||
| A2657 | 2013-07-17 | 2013-07-11 | SDSS | ||
| A2665 | 2013-07-12 | 2013-07-12 | SDSS | ||
| A2717 | 2013-08-01 | 2013-06-11 | 2MASS | ||
| A2734 | 2013-06-20 | 2013-07-07 | 2MASS | ||
| A3128 | 2011-12-20 | 2011-12-18 | 2MASS | ||
| A3158 | 2011-12-18 | 2011-12-20 | 2MASS | ||
| A3266 | 2012-10-15 | 2012-10-15 | 2MASS | ||
| A3376 | 2013-01-04 | 2012-11-17 | 2MASS | ||
| A3395 | 2013-03-05 | 2013-03-02 | 2MASS | ||
| A3528 | 2013-06-02 | 2013-06-05 | 2MASS | ||
| A3530 | 2013-06-03 | 2013-06-06 | 2MASS | ||
| A3532 | 2013-06-03 | 2013-06-07 | 2MASS | ||
| A3556 | 2012-06-17 | 2012-05-24 | 2MASS | ||
| A3558 | 2013-06-11 | 2013-06-28 | 2MASS | ||
| A3560 | 2012-06-18 | 2012-05-24 | 2MASS | ||
| A3667 | 2013-04-13 | 2013-05-14 | 2MASS | ||
| A3716 | 2013-05-20 | 2013-05-20 | 2MASS | ||
| A3809 | 2012-07-22 | 2012-04-18 | 2MASS | ||
| A3880 | 2013-06-11 | 2013-06-20 | 2MASS | ||
| A4059 | 2013-08-04 | 2013-07-03 | 2MASS | ||
| IIZW108 | 2013-06-06 | 2013-06-06 | SDSS | ||
| MKW3s | 2012-04-20 | 2012-04-19 | SDSS | ||
| Z8852 | 2012-11-10 | 2012-10-12 | SDSS |
3 Data reduction
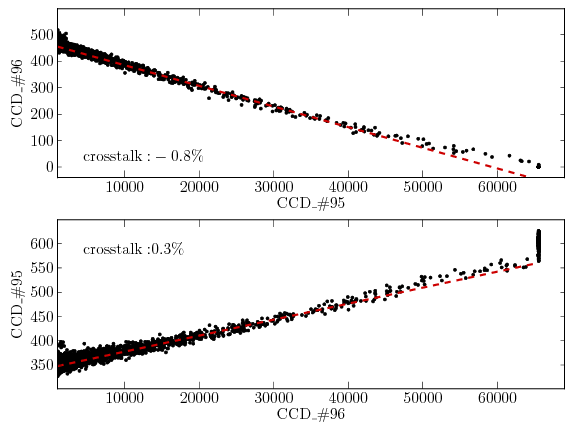
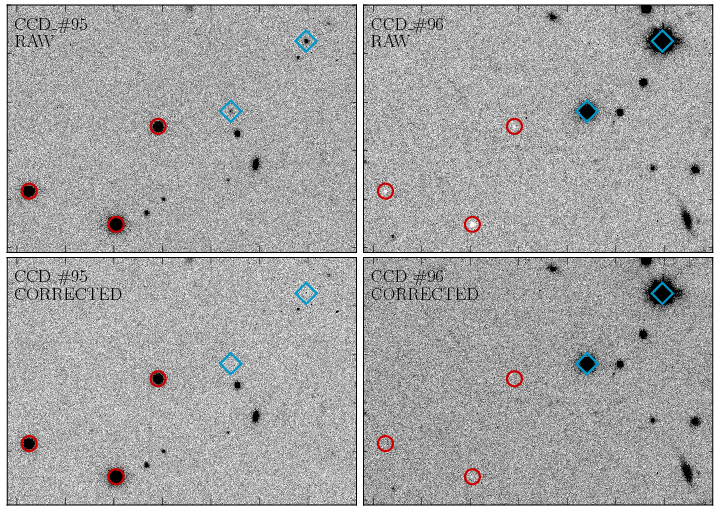
Image reduction and calibration are mainly based on ESO-MVM -also known as alambic- reduction package. This is a multi-instrument reduction tool originally developed for the ESO/EIS survey (Mignano et al. 2007). It has been extensively used also in the production of ESO Advanced Data Products, see for instance the 30 Doradus/WFI Data Release333http://archive.eso.org/archive/adp/ADP/30_Doradus/, or the GOODS/ISAAC Final Data Release (Retzlaff et al. 2010). The detailed description of the package and the documentation of the algorithm structure implemented in ESO/MVM are given in Vandame (2004). This section presents a summary of the main reduction steps and our add-ons to the original pipeline. The latest version of the alambic code and User Manual can be downloaded at the ESO webpage444 http://archive.eso.org/cms/eso-data/data-packages/eso-mvm-software-package.html. Here we used a modified version of the code (kindly provided by H. Bouy and B. Vandame, see Bouy et al. 2015) that has been partially rewritten to take advantages of the most recent hardware and recent Linux libraries. There are configuration files for many optical and near-infrared ESO instruments, but OmegaCAM is not officially supported so far. We therefore created a new configuration file for OmegaCAM, using the instrument description given in the VST user manual.
The following subsections will describe the main reduction steps. The only steps for which we had to develop integrations to alambic are: the cross-talk correction, the gain-harmonisation and the control procedure to check the quality of CCD #82.
We will call Data Block (DB) the complete set of data taken in each photometric band for a single pointing. A DB consists of 5 science, 5 twilight flat-field and 10 bias frames. Each DB has been reduced independently. This may slightly increase the computational time, because some targets have been observed during the same night and therefore it would have been possible to compute the master bias and flat-field frames only once. However, we prefer to reduce each DB independently because in this way the implementation of the reduction pipeline is much easier and linear. The calibration stacking process is not very time consuming, therefore our choice has a negligible influence on the overall computational efficiency of the reduction process. A typical reduction run for a DB takes about 40 minutes on a Intel i7 3.4GHz computer with 16 Gb of RAM.
3.1 Data organisation
First of all the multi-extension raw image files are splitted, resulting in 32 single-extension files, corresponding to the 32 OmegaCAM detectors. Images are then classified and grouped together using the information stored in the file headers. alambic creates lists of images corresponding to consecutive observations of the same field taken with the same filter, called observation blocks. These are used to produce the calibration blocks, i.e. lists used to create the calibration images –bias, flats, illumination maps– and the reduction blocks, i.e. lists of science observations of each scientific target with the same filter.
3.2 Cross-talk
According to the OmegaCAM User Manual, four detectors (CCDs #93-96, see Fig. 1) suffer electronic cross-talk. The strongest effect, of the order of a few percents, is between CCDs #95 and #96, while it is much lower for all the other CCDs. After a few tests we confirmed the cross-talk for CCDs #95 and #96 and we found that it is negligible in all other cases. The cross talk has been estimated by cross-correlating the signal registered on the same pixel in each pair of CCDs. As an example, Fig. 4 shows the effect in a raw image of one of our science frames. The mean background level for this image is ADUs in CCD #96 and ADUs in CCD #95. When a bright source increases the signal in CCD #96, a signal above the background is registered in CCD #95 (see lowest panel in Fig. 4); the difference between the registered signal and the average background in one detector is proportional to the signal in the other one. Figure 4 shows deviations from the linear relation when the signal is above ADUs. This is mainly due to non-linearity of the detectors. This non-linearity can be safely ignored, since it affects only a few pixels in each image. We also note that the cross-talk effect of saturated stars in CCD #95 inversely saturates CCD #96 at 0 ADU. To avoid this problem, on September 2012 the bias level of CCD #96 was increased to 650 ADU.
Since alambic does not include any cross-talk analysis, we developed a fast and easy procedure to calculate and correct for cross-talk. We assumed that the observed image is equal to
| (1) |
where and are the observed and the real –i.e. if no cross-talk were present– signal in the receiver, and is the observed image in the emitter detector. is the cross-talk coefficient between the receiver and the emitter CCDs. The coefficient has been obtained by fitting a linear relations to the data-points in Fig. 4. In all our images the coefficients for CCDs #95 and #96 are very similar, and . These values are then used to correct the images, inverting eq. 1. Figure 5 shows the very good results obtained with our procedure.
3.3 Stacking of calibration frames
During this phase of the reduction process, all calibration images of a given science reduction block are stacked together and the corresponding master bias and twilight flat images are produced. During this step, a bad-pixel detection procedure is applied and weight maps for flat field images are computed. Details about the algorithm are given in the alambic User Manual.
3.4 Gain harmonisation
The electronic converters of each detector are different, and each CCD may have a different efficiency. Therefore, each detector has its own effective gain and, as a consequence, its own photometric zero-point. The chip-to-chip gain variation quoted in the OmegaCAM User Manual is of the order of , resulting in a chip-to-chip zero-point scatter of mag. The procedure adopted by alambic to correct for this is to apply a multiplicative calibration constant to the master flats. The calibration is based on the analysis of a scientific image. The chip background is computed for each of the four borders of each chip in a narrow stripe. Then the chip-to-chip gain variations are calculated by comparing the values of each pair of adjacent stripes on different chips. As an example, in the case of a camera with CCDs –as the WFI@ESO2.2m instrument–, the total number of equations, one for each pair of stripes, is 10, and the unknown parameters are the seven unknown flux-scales (this is a relative calibration). In this way it is possible to obtain a robust calibration even if the sky-background is not constant and presents, for example, some gradients.
The central vignetting cross does not allow to use the standard alambic procedure for gain harmonisation. Given the high flux loss in a wide cross-shaped region at the centre of the field of view of the camera it is not possible to easily connect the background values of adjacent regions of different CCDs affected by the central vignetting. We therefore developed a variation of the original alambic procedure optimised for our specific OmegaCAM observations. First of all we note that the background level in our raw images does not show any significant gradient within each single detector. We can therefore assume a constant sky background across the whole FoV. We took one of the detectors as a reference and scaled the master flat field image of the other 31 according to the ratio of the mean background values for each CCD on a science image. We recall that the reduction process is done independently for each DB, and hence also this process is repeated for each OmegaWINGS field in each filter. This procedure can be used since all our science images are not extremely crowded. The background estimation, and consequently the gain-harmonisation, would not have been possible otherwise, as in the case of observations of e.g. giant nearby galaxies with sizes of the order of one OmegaCAM CCD, or observations of the central regions of galactic globular clusters, nearby resolved galaxies or other crowded stellar fields. In such cases it would be difficult –if not impossible– to estimate the sky background in each detector.
When the re-scaled master flat-field images are used to calibrate scientific images, the chip-to-chip gain variation is corrected and the resulting calibrated images therefore have a uniform background value. The quality of this procedure will be discussed in the following sections, in the context of the discussion of the overall photometric performances of our reduction pipeline.
To conclude this section, we add an important note about CCD #82 (its location on OmegaCAM mosaic is shown in Fig. 1). The OmegaCAM User Manual report day-to-day gain variations of a few percent, since the start of OmegaCAM operations. We note that for many observations there are serious problems on CCD #82. The background value is not constant, showing strong discontinuities in the form of horizontal stripes with different background values. The position and the extension of these stripes are in general different from one image to the other, even for consecutive observations within the same DB. For this reason, we decided to discard all CCD #82 data when one scientific image in the DB is affected by this problem. We implemented in the pipeline a simple script to test whether CCD #82 background is stable. If this is not the case, all CCD’s pixels are assigned a null weight. On June 2012 ESO changed the video board connected to CCD #82 to fix this issue.
3.5 Illumination correction
A well known problem affecting in particular wide field cameras is the sky-concentration, i.e. stray-light component centrally concentrated. This mostly affects observations with extremely bright background. In particular, flat-field frames are the most exposed to this effect. The net result, when flat-field exposures are applied without any correction, is an erroneous apparent trend of photometric zero point with distance from the centre of the camera field of view.
A common technique used to correct for this effect is to compute an illumination map to be applied to the flat-field frames, in order to obtain photometrically flat reduced science frames. alambic implements an algorithm to compute and apply the illumination map, which is based on a sequence of dithered observations of the same stellar field. Basically, these images are reduced using the normal flat field and photometric catalogs are extracted for each image. Since each star will be placed at a different position in each image, it is possible to map the zero-point variations as a function of the position on the focal plane. This is done using a least square estimator with rejection approximating the illumination map with a 2D polynomial function. This map is finally multiplied by the flat-field frame. A detailed description of the algorithms is given in Vandame (2002).
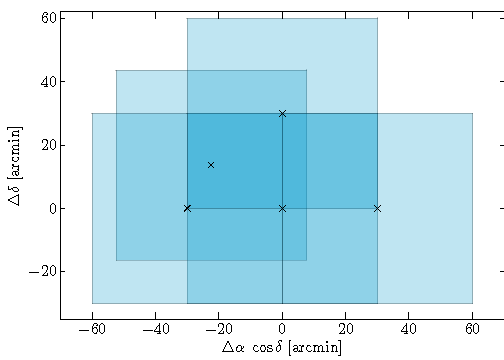
To compute the illumination map we observed a well populated stellar field, namely the Landolt SA107. We obtained 5 images in both the and -bands, using a dithering path wide enough to obtain observations of the same stars in different positions in the OmegaCAM focal plane. An outline of the dithering pattern is shown in Fig. 6. These observations were used to compute the illumination map, using a 4th order polynomial function. This illumination-correction map has then been applied to the flat-field frames used to calibrate all science frames.
In wide-field instruments, the illumination variation pattern across the large detector block can vary with time, telescope position, etc. The OmegaCAM consortium reported a dependence of the OmegaCAM illumination map on the telescope rotator angle555http://www.eso.org/sci/facilities/paranal/instruments/omegacam/doc/OCAM_illum.pdf. It has been however pointed out that to achieve a photometric accuracy at the 1% level, the illumination map can be considered “stable on a timescale of at least 7 months”. Our illumination map was computed from observations taken on July 2012, 1 year after the first OmegaWING observation and 1 year before the last one. To check the stability of our illumination correction, we compared OmegaWINGS photometry with WINGS and SDSS one and found no relevant variation of the photometric zero point across our images (see Sect. 5).
3.6 Stacking of science frames
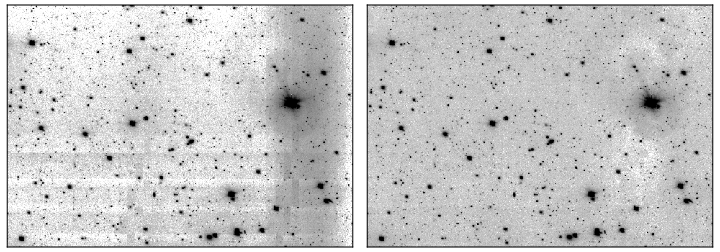
During this stage the pipeline finally operates on the science frames, using the calibration frames obtained from the previous steps. As part of this reduction stage, our pipeline computes and subtracts from the images the additive sky-background contribution. This must be done since there are stray-light components mainly due to reflections due to the segmented filters. This effect can be seen in the left panel of Fig. 7, where a -band image obtained stacking all observations of A2415 is shown. Only bias-subtraction and flat-field correction has been applied to these images, which are then stacked together without any further processing. For the sake of clarity, only a pixels region is displayed. It nearly corresponds to the upper-left quadrant of the mosaic (CCDs #82,#83,#84,#90,#91,#92, see Fig. 1) An excess of light due to light scattered by the filter support is clearly visible on the right side of the image on the left panel. In addition, in the lower half of the images there are small discontinuities. These are the footprints of the borders of individual detectors on the five stacked images. These discontinuities are likely due to a non perfect flat-field correction. It is worth noticing, however, that the image in Fig. 7 is displayed using a power-law gamma correction that strongly enhances the low-brightness details. These discontinuities are of the order of the standard deviation of the background signal. If these discontinuities were due to small uncertainties in the flat fielding, they should have been corrected as a multiplicative component. This is not the case; in fact our sky-subtraction procedure eliminates them from the final stacks (as can be seen in the right panel of Fig. 7). This means that they are considered as additive contribution. This possible mis-interpretation would introduce a minor bias in the photometric zero-point in the regions of the mosaic corresponding to the CCDs borders. Considering their limited extension, and the fact that they are present only in a few images –the reason for this is not completely clear–, they can be ignored, as they will not affect the quality of the photometric calibration at levels higher that a few percent, that is the requirement for our scientific programme.
The presence of the additive stray-light component would not be an issue for stellar photometry, but we must correct for it since we are interested in surface photometry of extended sources. First of all, a standard calibration of the science frames is performed. Over- and pre-scan regions are trimmed from raw images, these are then bias-subtracted and flat-field corrected.
Then, the sky-background is computed assuming that it is constant for the five consecutive images belonging to the same DB. Under this assumption it can be computed with an algorithm similar to the one commonly used to remove the background from infrared observations or to correct for fringing patterns; indeed we used the alambic fringing map estimator, fully described in the alambic User Manual. Further details of the algorithms are also given by Vandame (2004).
The astrometric calibration is performed for all frames using as reference the 2MASS catalog (Skrutskie et al. 2006) or the SDSS DR8 (Aihara et al. 2011), when available. Astrometric distortions are mapped using a polynomial function of order four. The absolute accuracy –measured on the final stacked mosaic– is of the order of and when the calibration is based on 2MASS and SDSS, respectively.
Satellite tracks are detected using a Hough-transform algorithm to search for straight lines in raw images. These are masked and flagged as bad pixels.
All images are then warped using the astrometric solution and projected in an user-defined common grid. We defined a distortion-free grid with a constant pixel scale equal to the average OmegaCAM pixels scale, i.e . The grid is centred at the target cluster centre. All warped images are finally stacked together, using the single weight maps. The output is the final stacked mosaic and the corresponding weight map. We note that since we used the same reference grid for - and -band images, the two output mosaics for each cluster are already aligned.
4 Photometric catalogs
4.1 Source extraction
The source extraction and measure of photometric and structural parameters has been performed using sextractor (Bertin & Arnouts 1996). -band photometry has been carried out with Sextractor dual-mode, using -band image as reference. The catalogues extracted from - and -band images were then matched together using a searching radius of . In the following we list the parameters we measured. For a detailed description of the algorithm used to derive them we refer to Sextractor User Manual666http://www.astromatic.net/software/sextractor.
- RA, DEC:
-
equatorial coordinates of the barycentre of the source emission profile;
- RA_PEAK, DEC_PEAK:
-
equatorial coordinates of the source emission peak;
- X, Y,X_PEAK, Y_PEAK:
-
coordinates on the image, in pixels, of source barycentre and emission peak;
- ISOAREA_IMAGE:
-
isophotal area;
- KRON_RADIUS:
-
Kron radius;
- FWHM_IMAGE:
-
full width at half maximum;
- A_IMAGE, B_IMAGE:
-
semi-major and semi-minor axes. This has been used to compute the axial ratio ;
- THETA_IMAGE:
-
position angle with respect to the North and measured counter-clockwise;
- CLASS_STAR:
-
stellarity index;
- MU_MAX:
-
surface brightness of the brightest pixel;
- MAG_ISO:
-
isophotal magnitude, defined using the detection threshold as the lowest isophote;
- MAG_ISOCOR:
-
Isophotal magnitude corrected to retrieve the fraction of flux lost by isophotal magnitudes by assuming Gaussian intensity profiles. As reported in the Sextractor user manual, ”this correction works best with stars; and although it is shown to give tolerably accurate results with most disk galaxies, it fails with ellipticals because of the broader wings of their profiles”;
- MAG_AUTO:
-
Kron-like aperture magnitude. This is the most precise estimate of total magnitudes for galaxies;
- MAG_APER:
-
Aperture magnitude. We used apertures with diameter 5, 10, 15, and 20 pixels; , , and ; 4, 10 and 20 kpc. To calculate the last three apertures we used the cluster distance listed in the WINGS database (Moretti et al. 2014).
4.2 Photometric calibration
Photometric calibration has been done using WINGS stars as local standards. We fitted the equations
| (2) | |||||
| (3) |
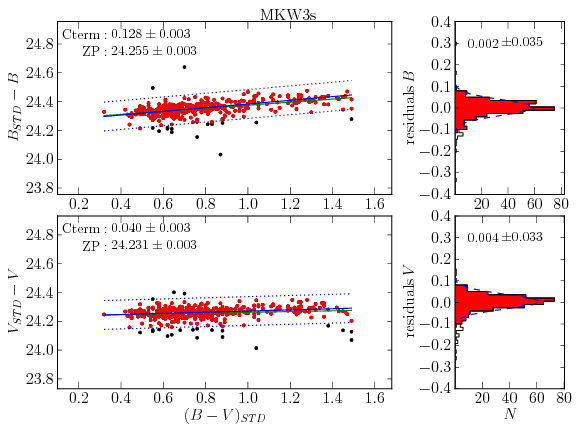
The data have been fitted imposing the condition that the colour-term ( and ) is constant within each ESO observing semester. As an example, Fig. 8 shows the calibration relation fitted to MKW3s data. The results for all OmegaWINGS clusters are listed in Table A in the Appendix. Colour terms variations are within 0.015 mags.
4.3 Star-galaxy classification
The classification of OmegaWINGS sources was done following the method and criteria used for the original WINGS survey, as described in Varela et al. (2009). As a starting point, we classified objects on the basis of the Sextractor CLASS_STAR parameter:
- stars
-
: CLASS_STAR
- galaxies
-
: CLASS_STAR
- unknown
-
: CLASS_STAR
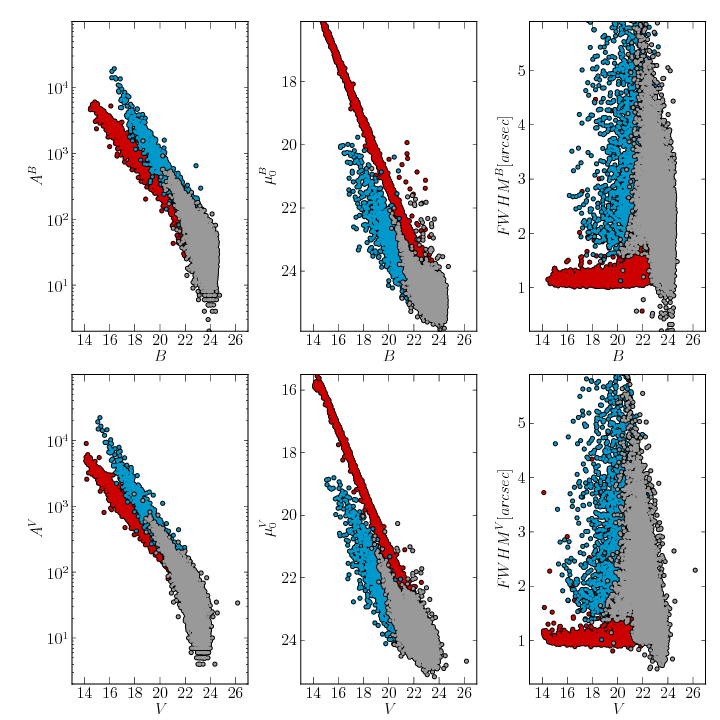
We then used a set of diagnostic plots, using different combinations of Sextractor parameters to check the result and eventually correct any misclassification. As an example, in Fig. 9 the isophotal area (), the central surface brightness and the FWHM of sources in the A3809 field are plotted as a function of the total magnitude in both the - and -bands. Other parameters used for the diagnostic plots include the ellipticity and the difference between aperture photometry at 5 and 15 pixels. We visually checked all clusters looking for outliers in the diagnostic plots, i.e. sources mis-classified on the basis of the automatic classification based on CLASS_STAR. For some of them we could safely redefine the star/galaxy classification, after a careful visual inspection of their - and -band images. In some cases –faint and/or compact sources– - and -band photometry provided a different classification; in these cases we based our classification on the results provided in the band observed under the best seeing conditions. For some of the faintest objects, with properties between those of stars and galaxies, the classification remains unknown. The reliability of our classification will be analysed in Sect. 5.
4.4 Data retrieval
All sextractor measurements for all galaxies are publicly available at CDS as a single table; a unique ID is assigned to each galaxy. To this end we cross-matched the OmegaWINGS catalogue with the WINGS database (Moretti et al. 2014). For galaxies already in the WINGS database we took the WINGS-ID, while we defined a new ID for all other galaxies. A list of the columns of the catalogue is given in Table 3. The full OmegaWINGS catalogue will be included in the next release of the WINGS database. This is planned at the end of our AAOmega spectroscopic survey. We note however that the OmegaWINGS catalogue at CDS, as any other CDS table, is already part of the VO and can therefore be easily cross-matched with the WINGS database using any VO tool, e.g. STILTS.
5 Data reduction quality checks
5.1 Astrometry
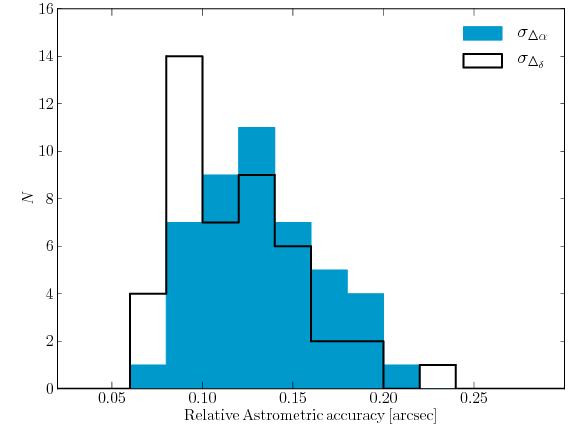
The astrometric accuracy of our catalogs has been tested against the 2MASS and SDSS DR8 -when available- stellar catalogs. By comparing the difference in the source positions, we verified that no residual distortions are present in the final mosaics. The absolute astrometric accuracy is well within the precision required for the purposes of our scientific project. For each cluster in our sample, we compared OmegaWINGS sky coordinates of all stars in the field of view with 2MASS or SDSS (depending on the catalogue used as the astrometric reference) ones. The distributions of the differences in and coordinates have always negligible mean values, and typical dispersions of (2MASS) and (SDSS). As a further tests of the astrometric calibration accuracy, we compared the sky-coordinates of all stars in OmegaWINGS and WINGS catalogs. The dispersion of the and distributions is a robust indicator of the accuracy of our astrometric calibration, as WINGS was calibrated independently. Results are shown in Fig. 10 and confirm that the astrometry internal calibration is accurate at a level always better than 777The internal accuracy of WINGS astrometry is (Fasano et al. 2006); values in Fig. 10 are therefore upper limits of the OmegaWINGS astrometric calibration uncertainties. . The mean values of the distributions are for both right ascension and declination.
We finally note that the internal accuracies of the catalogs used as reference in this section are very close to the measured dispersions, i.e. , and when comparing OmegaWINGS astrometry with to 2MASS, WINGS and SDSS, respectively. We can therefore conclude that our astrometric calibration has an internal accuracy at the level of at least .
5.2 Photometry
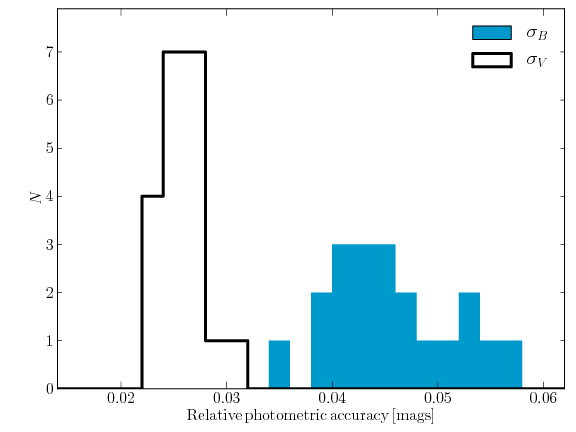
The relative accuracy of OmegaWINGS photometry across the OmegaCAM FoV was tested by comparing OmegaWINGS photometry with SDSS one. We adopted the linear colour equations proposed by Jordi et al. (2006) to transform SDSS photometry into standard magnitudes. For each of the 20 OmegaWINGS field observed by SDSS, we calculated the dispersion of the differences between OmegaWINGS and (transformed) SDSS magnitudes for all stars with mag and mag. Results are shown in Figure 11. In the -band the relative photometric accuracy is mag for all clusters. The dispersions of are 0.04–0.06 mags. The systematically higher dispersion in the - band are due to non-linear colour terms in the transformations from SDSS to photometric systems and/or a dependence of the transformations on stars metallicity/colour (Jordi et al. 2006). In Sect. 4.2 in fact we found no high-order colour term in the comparison of OmegaWINGS photometry with WINGS one. A detailed discussion of this issue is beyond the aim of this paper.
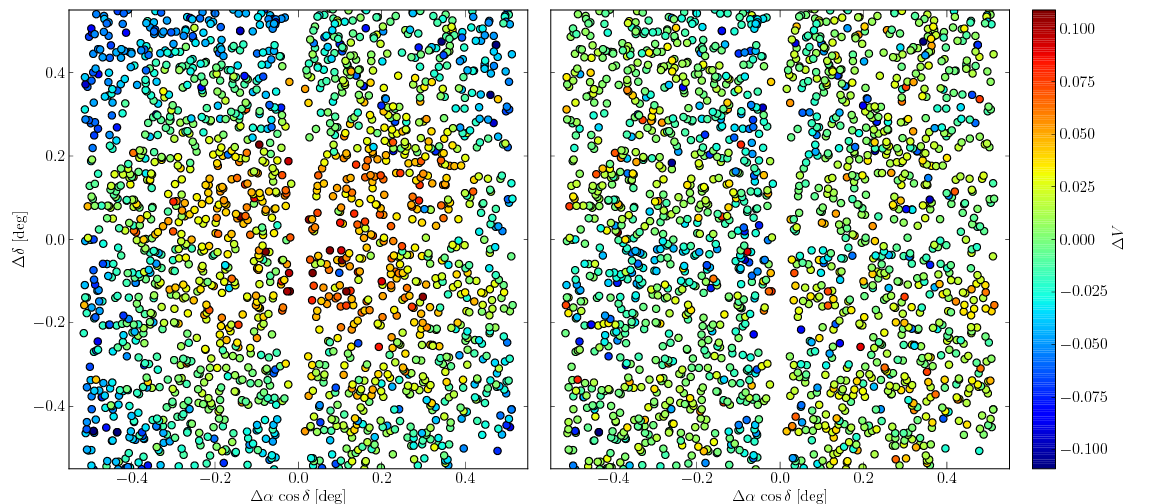
To check the spatial stability of OmegaWINGS calibration, we analysed the magnitude difference between OmegaWINGS and (transformed) SDSS photometry as a function of the position on the mosaic. As an example, the magnitude difference of all stars with in Z8852 are shown in the right panel of Fig. 12. For comparison, the same comparison when no illumination correction is applied (see Sect. 3) is shown in the left panel of Fig. 12. The maximum effect of the illumination correction, from the edge to the centre of the mosaic, is mag. We analysed the same maps as the one shown in Fig. 12 for all 20 OmegaWINGS fields with available SDSS photometry in both and -band and we conclude that the photometric zero point in all calibrated catalogs is constant across the whole mosaic, and that there are no residual systematic effects of neither the illumination correction nor the gain harmonisation.
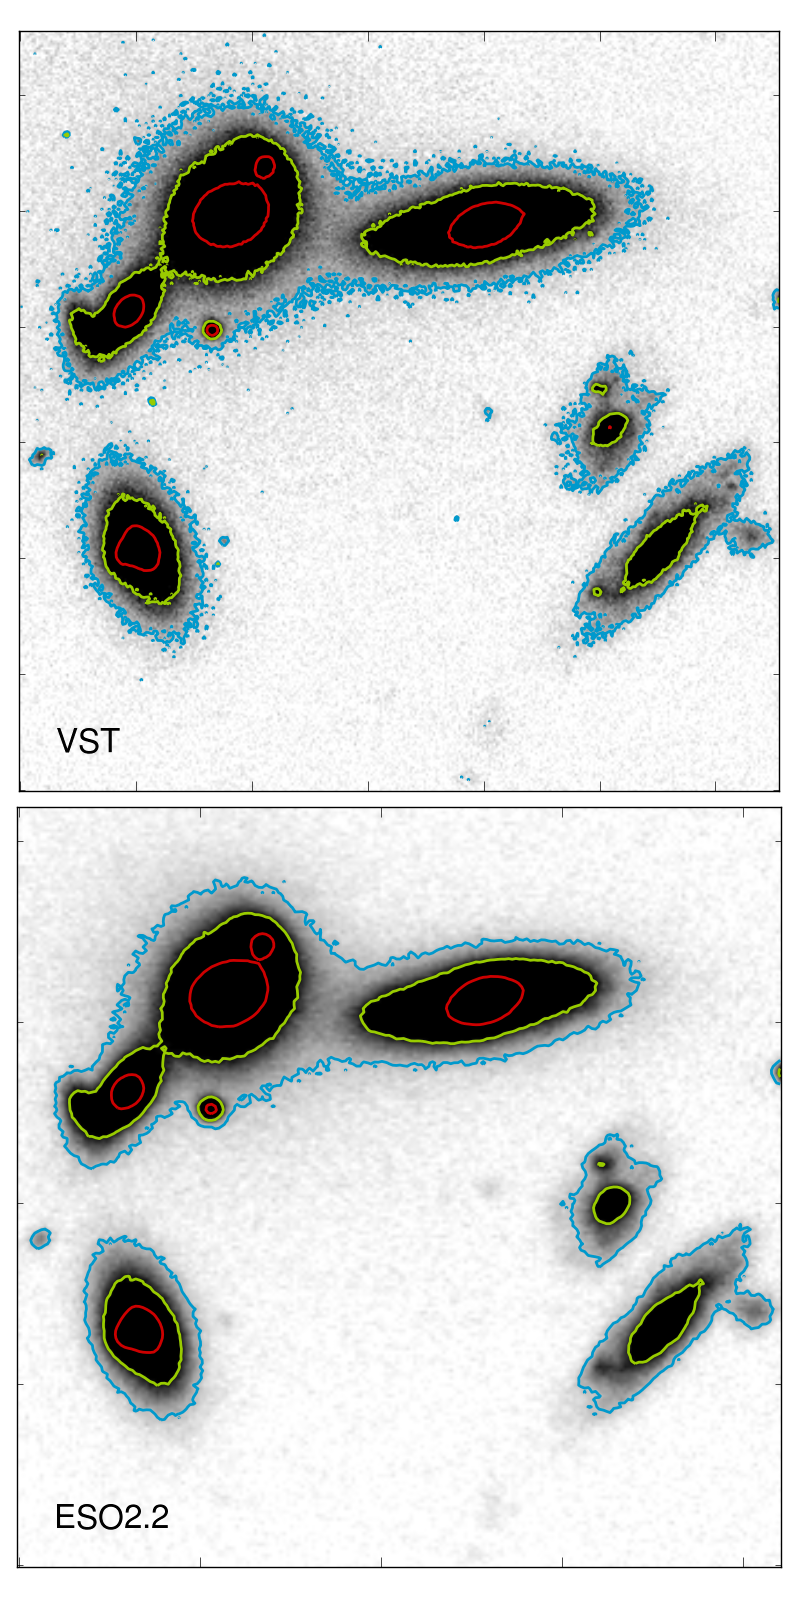
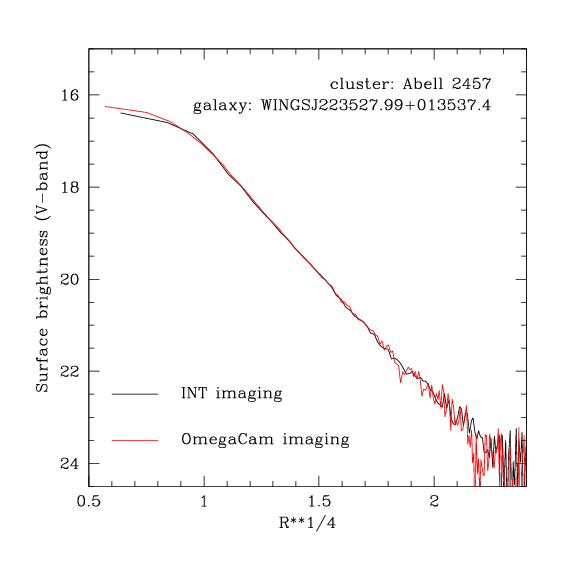
Finally, the sky-subtraction procedure has been tested by performing a detailed analysis of the radial profiles of a few extended bright galaxies, and comparing the results obtained from the final OmegaCAM stacked mosaics with data from the WINGS survey. As an example, in Fig 13 the comparison of OmegaWINGS and WINGS images of a region populated by several galaxies shows that the structure of the galactic haloes is the same in the two images. This is a clear indication that the sky-subtraction procedure did remove all large-scale artefacts from the images (see Fig. 7), but it did not alter the galaxy profiles. A more quantitative analysis of this point can be derived from the direct comparison of radial profiles of the same galaxy obtained from OmegaWINGS and WINGS images, as the one presented in Fig. 14. The profile obtained from OmegaCAM image is in perfect agreement with the one obtained at the INT telescope, out to the detection limit, corresponding to a radius of , i.e. 75 pixels in OmegaCAM. The minor differences in the central regions are due to the fact that OmegaWINGS -band observations of A2457 were carried out under better seeing conditions () than WINGS ones ().
5.3 Photometric completeness
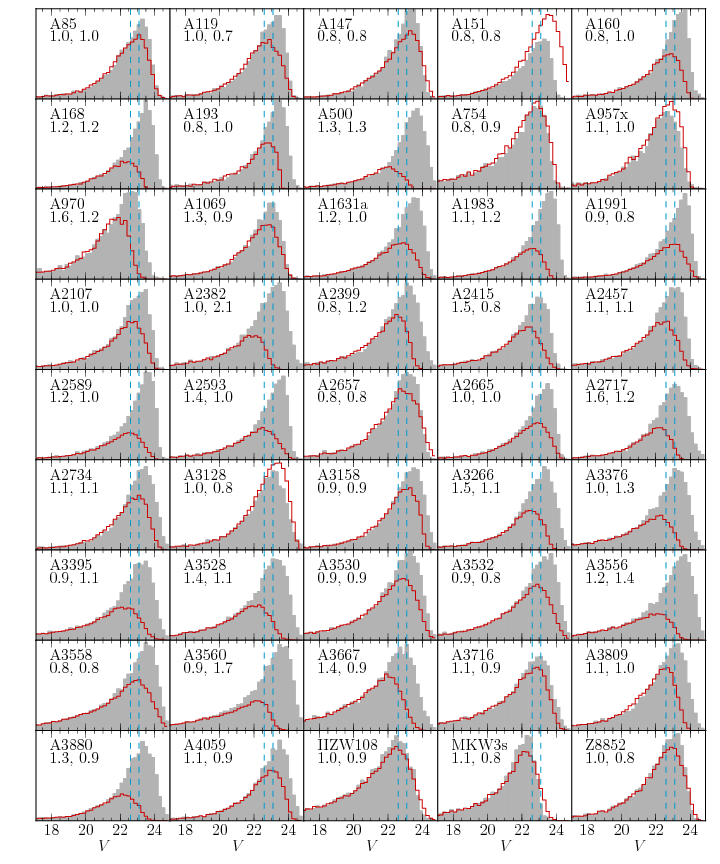
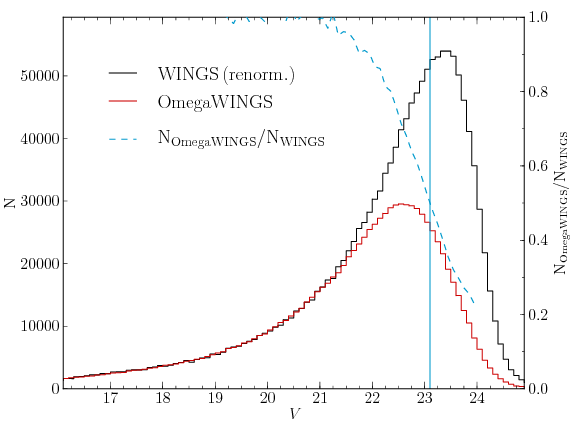
The overall OmegaWINGS photometric completeness factor was estimated by comparing the magnitude distributions (MD) of all sources in OmegaWINGS and WINGS catalogs. To perform the comparison, the WINGS distribution was re-normalised to match the total number of OmegaWINGS sources with mag. The MDs obtained for all 45 OmegaWINGS fields are shown in Fig. 18 in the appendix (available only on the online version of this paper). The photometric depth depends on the seeing conditions during observations, but OmegaWINGS photometry is in general 0.5–1.0 mag shallower than WINGS one. However, when OmegaWINGS observations were carried out with seeing , OmegaWINGS is as deep as (and in some cases deeper than) WINGS (see Fig.18). The overall photometric depth of OmegaWINGS was estimated by stacking together all 45 MDs. Figure 15 shows that OmegaWINGS MD peaks at mag and WINGS one at . The OmegaWINGS completeness can be estimated from as the ratio of OmegaWINGS to WINGS MDs. The 50% completeness level is reached at mag, the 80% level at mag (see Fig. 15). This results is based on the assumption that WINGS photometry is complete at least up to mag. We therefore performed a further test by fitting an exponential relation to the bright tail of the histogram in Fig. 15. The completeness factor was obtained as the ratio of the observed MD to the best-fit exponential model. Following this approach, 50% and 80% completeness are found at and 22.7 mag, respectively, confirming –within reasonable uncertainties– our previous results.
5.4 Star-galaxy classification
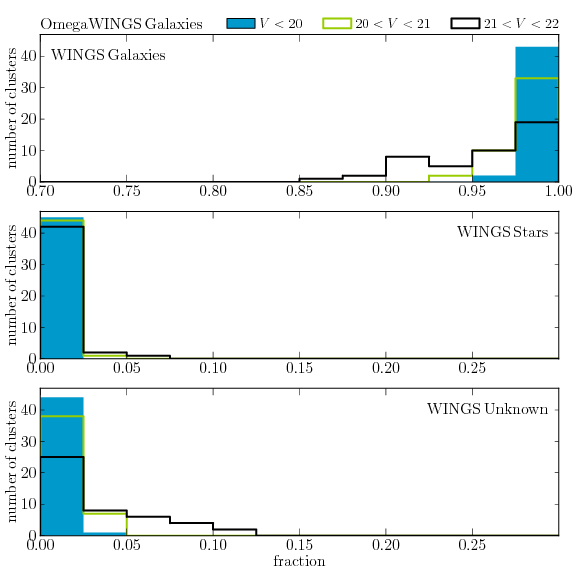
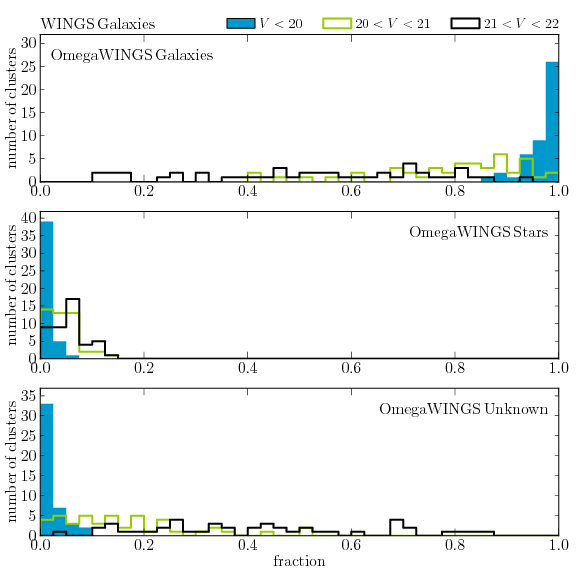
To check the reliability of OmegaWINGS source classification, we compared it with the WINGS one. For each cluster we divided the sources classified as galaxies in OmegaWINGS in three magnitude bins: mag, mag, and mag. We then calculated how many OmegaWINGS galaxies are classified as galaxy, star, and unknown in WINGS. The histograms of these fractions are presented in Fig. 16. In all but two clusters the fraction of bright ( mag) OmegaWINGS galaxies classified as galaxies in WINGS are . In more than of the clusters the number of faint OmegaWINGS galaxies with unknown classification in WINGS is negligible; in all other clusters, this fraction is still smaller than 10% (see lower panel of Fig. 16). In all clusters there are no OmegaWINGS galaxies with mag classified as stars in WINGS. The fraction of galaxies misclassified as stars in WINGS is negligible () also for fainter galaxies ). To summarise, we can conclude that the classification of galaxies in OmegaWINGS is highly reliable.
The other question we addressed with this analysis is about the completeness of our classification, i.e. how many galaxies are missed by our classification? Clues on this issues can be provided by studying OmegaWINGS classification of WINGS galaxies, shown in Fig. 17. In most clusters, all WINGS galaxies with mag are classified as galaxies also in OmegaWINGS, just in a few clusters there are bright WINGS galaxies otherwise classified in OmegaWINGS; their fraction is however always low (). The number of WINGS galaxies with mag with unknown OmegaWINGS classification is not negligible in a significant number of clusters. Nonetheless, in of the clusters the number of WINGS galaxies misclassified as stars in OmegaWINGS is . The reliability of the source classification is strongly dependent on seeing conditions during the observations, and in fact the clusters with the most relevant discrepancies between OmegaWINGS and WINGS classification are those where there are relevant seeing differences between the WINGS and OmegaWINGS observations.
To summarise, we conclude that OmegaWINGS source classification is highly reliable for all objects with mag. This is the magnitude range used to select the targets for our AAOmega spectroscopic follow-up survey. At faintest magnitudes, in clusters observed under non-optimal seeing conditions, the OmegaWINGS galaxy selection is not complete, i.e. a significant number of galaxies could likely be assigned an unknown classification. On the other hand, the classification of galaxies in OmegaWINGS is very robust, i.e. it is very unlikely that a OmegaWINGS galaxy is actually a star.
6 Summary
This paper is the first of a series presenting OmegaWINGS, the wider-field extension of the WINGS database for X-ray selected galaxy clusters at 0.04-0.07. The - and -band observations of the 46 WINGS clusters observed with OmegaCAM/VST are presented here, while the ongoing -band OmegaCAM/VST and spectroscopic AAOmega/AAT follow-ups will be presented in subsequent papers.
All clusters have been observed for 25 min in each band, with a median seeing of in both and -band, and and in 80% of the - and -band images, respectively. The data have been reduced with a modified version of the ESO-MVM alambic reduction package, developing ad hoc cross-talk, gain harmonisation and CCD control procedures. Special care has been taken for illumination correction, using purposely obtained OmegaCAM observations of standard stellar fields.
Sextractor photometric catalogues have been produced and are released with this paper at CDS. Catalogs and reduced images will also be part of the next release version of the WINGS database.
The quality of the astrometry, photometric accuracy, star-galaxy separation and sky-subtraction have been tested in various ways and show that results are generally of the same or even better quality than the previous WINGS results. The absolute astrometric accuracy is and when the calibration is based on 2MASS and SDSS, respectively. The photometric catalogues are 50% complete at mag and 80% complete at mag.
The - and -band OmegaCAM images have provided the AAOmega spectroscopic targets, and have been employed to identify jellyfish candidate galaxies subject to ram pressure stripping (Poggianti et al. submitted). Ongoing analysis of these images include surface brightness analysis with GASPHOT (D’Onofrio et al. 2014) and morphological classification with MORPHOT (Fasano et al. 2012). Together with the spectroscopy, taking advantage of the large OmegaCAM field of view and, consequently, of the large clustercentric radii reached, this dataset is used to study the effects of the environment on galaxy properties out to large distances from the cluster centre and for a number of studies on the dynamical status and light distribution of the clusters.
Acknowledgements.
We would like to warmly thank Hervé Bouy and Benoit Vandame for sharing their code and for the useful discussion. We acknowledge financial support from the PRIN-INAF 2010 and 2014. BV was supported by the World Premier International Research Center Initiative (WPI), MEXT, Japan and the Kakenhi Grant-in-Aid for Young Scientists (B)(26870140) from the Japan Society for the Promotion of Science (JSPS). This publication makes use of data products from the Two Micron All Sky Survey, which is a joint project of the University of Massachusetts and the Infrared Processing and Analysis Center/California Institute of Technology, funded by the National Aeronautics and Space Administration and the National Science Foundation. SDSS-III is managed by the Astrophysical Research Consortium for the Participating Institutions of the SDSS-III Collaboration including the University of Arizona, the Brazilian Participation Group, Brookhaven National Laboratory, Carnegie Mellon University, University of Florida, the French Participation Group, the German Participation Group, Harvard University, the Instituto de Astrofisica de Canarias, the Michigan State/Notre Dame/JINA Participation Group, Johns Hopkins University, Lawrence Berkeley National Laboratory, Max Planck Institute for Astrophysics, Max Planck Institute for Extraterrestrial Physics, New Mexico State University, New York University, Ohio State University, Pennsylvania State University, University of Portsmouth, Princeton University, the Spanish Participation Group, University of Tokyo, University of Utah, Vanderbilt University, University of Virginia, University of Washington, and Yale University.References
- Aihara et al. (2011) Aihara, H., Allende Prieto, C., An, D., et al. 2011, ApJS, 193, 29
- Bahé et al. (2013) Bahé, Y. M., McCarthy, I. G., Balogh, M. L., & Font, A. S. 2013, MNRAS, 430, 3017
- Bertin & Arnouts (1996) Bertin, E. & Arnouts, S. 1996, A&AS, 117, 393
- Bouy et al. (2015) Bouy, H., Bertin, E., Barrado, D., et al. 2015, A&Aaccepted. ArXiv: 1501.04416
- Butcher & Oemler (1978) Butcher, H. & Oemler, Jr., A. 1978, ApJ, 219, 18
- Capaccioli & Schipani (2011) Capaccioli, M. & Schipani, P. 2011, The Messenger, 146, 2
- Cava et al. (2009) Cava, A., Bettoni, D., Poggianti, B. M., et al. 2009, A&A, 495, 707
- Couch & Sharples (1987) Couch, W. J. & Sharples, R. M. 1987, MNRAS, 229, 423
- De Lucia et al. (2010) De Lucia, G., Boylan-Kolchin, M., Benson, A. J., Fontanot, F., & Monaco, P. 2010, MNRAS, 406, 1533
- De Lucia et al. (2012) De Lucia, G., Weinmann, S., Poggianti, B. M., Aragón-Salamanca, A., & Zaritsky, D. 2012, MNRAS, 423, 1277
- D’Onofrio et al. (2014) D’Onofrio, M., Bindoni, D., Fasano, G., et al. 2014, A&A, 572, A87
- Dressler et al. (1997) Dressler, A., Oemler, Jr., A., Couch, W. J., et al. 1997, ApJ, 490, 577
- Ebeling et al. (2000) Ebeling, H., Edge, A. C., Allen, S. W., et al. 2000, MNRAS, 318, 333
- Ebeling et al. (1998) Ebeling, H., Edge, A. C., Bohringer, H., et al. 1998, MNRAS, 301, 881
- Ebeling et al. (1996) Ebeling, H., Voges, W., Bohringer, H., et al. 1996, MNRAS, 281, 799
- Fasano et al. (2006) Fasano, G., Marmo, C., Varela, J., et al. 2006, A&A, 445, 805
- Fasano et al. (2012) Fasano, G., Vanzella, E., Dressler, A., et al. 2012, MNRAS, 420, 926
- Fritz et al. (2014) Fritz, J., Poggianti, B. M., Cava, A., et al. 2014, A&A, 566, A32
- Fritz et al. (2011) Fritz, J., Poggianti, B. M., Cava, A., et al. 2011, A&A, 526, A45
- Haines et al. (2011) Haines, C. P., Merluzzi, P., Busarello, G., et al. 2011, MNRAS, 417, 2831
- Jordi et al. (2006) Jordi, K., Grebel, E. K., & Ammon, K. 2006, A&A, 460, 339
- Kuijken (2011) Kuijken, K. 2011, The Messenger, 146, 8
- Lewis et al. (2002) Lewis, I., Balogh, M., De Propris, R., et al. 2002, MNRAS, 334, 673
- Mahajan et al. (2011) Mahajan, S., Mamon, G. A., & Raychaudhury, S. 2011, MNRAS, 416, 2882
- Merluzzi et al. (2015) Merluzzi, P., Busarello, G., Haines, C. P., et al. 2015, MNRAS, 446, 803
- Merluzzi et al. (2010) Merluzzi, P., Mercurio, A., Haines, C. P., et al. 2010, MNRAS, 402, 753
- Mignano et al. (2007) Mignano, A., Miralles, J.-M., da Costa, L., et al. 2007, A&A, 462, 553
- Moran et al. (2007) Moran, S. M., Ellis, R. S., Treu, T., et al. 2007, ApJ, 671, 1503
- Moretti et al. (2014) Moretti, A., Poggianti, B. M., Fasano, G., et al. 2014, ArXiv e-prints
- Omizzolo et al. (2014) Omizzolo, A., Fasano, G., Reverte Paya, D., et al. 2014, A&A, 561, A111
- Pimbblet et al. (2002) Pimbblet, K. A., Smail, I., Kodama, T., et al. 2002, MNRAS, 331, 333
- Poggianti et al. (2013) Poggianti, B. M., Calvi, R., Bindoni, D., et al. 2013, ApJ, 762, 77
- Ramella et al. (2007) Ramella, M., Biviano, A., Pisani, A., et al. 2007, A&A, 470, 39
- Retzlaff et al. (2010) Retzlaff, J., Rosati, P., Dickinson, M., et al. 2010, A&A, 511, A50
- Robotham et al. (2011) Robotham, A. S. G., Norberg, P., Driver, S. P., et al. 2011, MNRAS, 416, 2640
- Skrutskie et al. (2006) Skrutskie, M. F., Cutri, R. M., Stiening, R., et al. 2006, AJ, 131, 1163
- Smith et al. (2012) Smith, R. J., Lucey, J. R., Price, J., Hudson, M. J., & Phillipps, S. 2012, MNRAS, 419, 3167
- Treu et al. (2003) Treu, T., Ellis, R. S., Kneib, J.-P., et al. 2003, ApJ, 591, 53
- Valentinuzzi et al. (2009) Valentinuzzi, T., Woods, D., Fasano, G., et al. 2009, A&A, 501, 851
- Vandame (2002) Vandame, B. 2002, in Society of Photo-Optical Instrumentation Engineers (SPIE) Conference Series, Vol. 4847, Society of Photo-Optical Instrumentation Engineers (SPIE) Conference Series, ed. J.-L. Starck & F. D. Murtagh, 123–134
- Vandame (2004) Vandame, B. 2004, PhD thesis, Université de Nice
- Varela et al. (2009) Varela, J., D’Onofrio, M., Marmo, C., et al. 2009, A&A, 497, 667
- Vulcani et al. (2011) Vulcani, B., Poggianti, B. M., Aragón-Salamanca, A., et al. 2011, MNRAS, 412, 246
- Wilman et al. (2009) Wilman, D. J., Oemler, Jr., A., Mulchaey, J. S., et al. 2009, ApJ, 692, 298
- York et al. (2000) York, D. G., Adelman, J., Anderson, Jr., J. E., et al. 2000, AJ, 120, 1579
Appendix A Supplementary tables and figures
| cluster | P | ||||
|---|---|---|---|---|---|
| A119 | P88 | ||||
| A160 | P88 | ||||
| A193 | P88 | ||||
| A3128 | P88 | ||||
| A3158 | P88 | ||||
| A500 | P88 | ||||
| A754 | P88 | ||||
| A957x | P88 | ||||
| A970 | P88 | ||||
| A1983 | P89 | ||||
| A2382 | P89 | ||||
| A2399 | P89 | ||||
| A2415 | P89 | ||||
| A2457 | P89 | ||||
| A3556 | P89 | ||||
| A3560 | P89 | ||||
| A3809 | P89 | ||||
| MKW3s | P89 | ||||
| A151 | P90 | ||||
| A1631a | P90 | ||||
| A2593 | P90 | ||||
| A3266 | P90 | ||||
| A3395 | P90 | ||||
| A3376 | P90 | ||||
| Z8852 | P90 | ||||
| A1069 | P91 | ||||
| A147 | P91 | ||||
| A168 | P91 | ||||
| A1991 | P91 | ||||
| A2107 | P91 | ||||
| A2589 | P91 | ||||
| A2657 | P91 | ||||
| A2665 | P91 | ||||
| A2717 | P91 | ||||
| A2734 | P91 | ||||
| A3528 | P91 | ||||
| A3530 | P91 | ||||
| A3532 | P91 | ||||
| A3558 | P91 | ||||
| A3667 | P91 | ||||
| A3716 | P91 | ||||
| A3880 | P91 | ||||
| A4059 | P91 | ||||
| A85 | P91 | ||||
| IIZW108 | P91 |
| column | units | description |
| WINGS-ID | unique identificator | |
| cluster name | name of host cluster | |
| RA(J2000) | deg | Right Ascension of emission peak |
| DEC(J2000) | deg | Declination of emission peak |
| Area | arcsec2 | Isophotal area |
| KronRad | arcsec | Kron radius |
| FWHM | arcsec | Full width at half maximum along major axis |
| axial ratio | ||
| PA | deg | [-90/90] Position angle (North=0, Eastwards) |
| mag arcsec-2 | -band surface brightness of the emission peak | |
| mag arcsec-2 | -band surface brightness of the emission peak | |
| mag | -band SExtractor’s MAG_ISO | |
| mag | -band SExtractor’s MAG_ISO | |
| mag | -band SExtractor’s MAG_ISOC | |
| mag | -band SExtractor’s MAG_ISOC | |
| mag | -band SExtractor’s MAG_AUTO | |
| mag | -band SExtractor’s MAG_AUTO | |
| mag | -band magnitude in aperture of 2 pixels | |
| mag | -band magnitude in aperture of 2 pixels | |
| mag | -band magnitude in aperture of 5 pixels | |
| mag | -band magnitude in aperture of 5 pixels | |
| mag | -band magnitude in aperture of 10 pixels | |
| mag | -band magnitude in aperture of 10 pixels | |
| mag | -band magnitude in aperture of 5 pixels | |
| mag | -band magnitude in aperture of 5 pixels | |
| mag | -band magnitude in aperture of 10 pixels | |
| mag | -band magnitude in aperture of 10 pixels | |
| mag | -band magnitude in aperture of 4 kpc | |
| mag | -band magnitude in aperture of 4 kpc | |
| mag | -band magnitude in aperture of 10 kpc | |
| mag | -band magnitude in aperture of 10 kpc | |
| mag | -band magnitude in aperture of 20 kpc | |
| mag | -band magnitude in aperture of 20 kpc | |
| mag | -band magnitude in aperture of | |
| mag | -band magnitude in aperture of | |
| mag | -band magnitude in aperture of | |
| mag | -band magnitude in aperture of | |
| mag | -band magnitude in aperture of | |
| mag | -band magnitude in aperture of |
