Understanding Image Virality
Abstract
Virality of online content on social networking websites is an important but esoteric phenomenon often studied in fields like marketing, psychology and data mining. In this paper we study viral images from a computer vision perspective. We introduce three new image datasets from Reddit111www.reddit.com, Reddit is considered the main engine of virality around the world, and is ranked among the top sites on the web by Alexa (www.alexa.com) as of March 2015 and define a virality score using Reddit metadata. We train classifiers with state-of-the-art image features to predict virality of individual images, relative virality in pairs of images, and the dominant topic of a viral image. We also compare machine performance to human performance on these tasks. We find that computers perform poorly with low level features, and high level information is critical for predicting virality. We encode semantic information through relative attributes. We identify the 5 key visual attributes that correlate with virality. We create an attribute-based characterization of images that can predict relative virality with accuracy (SVM+Deep Relative Attributes) –better than humans at . Finally, we study how human prediction of image virality varies with different “contexts” in which the images are viewed, such as the influence of neighbouring images, images recently viewed, as well as the image title or caption. This work is a first step in understanding the complex but important phenomenon of image virality. Our datasets and annotations will be made publicly available.
1 Introduction
What graphic should I use to make a new startup more eye-catching than Instagram? Which image caption will help spread an under-represented shocking news? Should I put an image of a cat in my YouTube video if I want millions of views? These questions plague professionals and regular internet users on a daily basis. Impact of advertisements, marketing strategies, political campaigns, non-profit organizations, social causes, authors and photographers, to name a few, hinges on their ability to reach and be noticed by a large number of people. Understanding what makes content viral has thus been studied extensively by marketing researchers [7, 4, 11, 5].


Many factors such as the time of day and day of week when the image was uploaded, the title used with the image, etc. affect whether an image goes viral or not [26]. To what extent is virality dependent on these external factors, and how much of the virality depends on the image content itself? How well can state-of-the-art computer vision image features and humans predict virality? Which visual attributes correlate with image virality?
In this paper, we address these questions. We introduce three image databases collected from Reddit and a virality score. Our work identifies several interesting directions for deeper investigation where computer vision techniques can be brought to bear on this complex problem of understanding and predicting image virality.
2 Related Work
Most existing works [27, 2, 32] study how people share content on social networking sites after it has been posted. They use the network dynamics soon after the content has been posted to detect an oncoming snowballing effect and predict whether the content will go viral or not. We argue that predicting virality after the content has already been posted is too late in some applications. It is not feasible for graphics designers to “try out” various designs to see if they become viral or not. In this paper, we are interested in understanding the relations between the content itself (even before it is posted online) and its potential to be viral222In fact, if the machine understands what makes an image viral, one could use “machine teaching” [21] to train humans (e.g., novice graphic designers) what viral images look like..
There exist several qualitative theories of the kinds of content that are likely to go viral [4, 5]. Only a few works have quantitatively analyzed content, for instance Tweets [34] and New York Times articles [6] to predict their virality. However, in spite of them being a large part of our online experience, the connections between content in visual media and their virality has not been analyzed. This forms the focus of our work.
Virality of text data such as Tweets has been studied in [28, 34]. The diffusion properties were found to be dependent on their content and features like embedded URL’s and hashtags. Generally, diffusion of content over networks has been studied more than the causes [32]. The work of Leskovec et al. [27] models propagation of recommendations over a network of individuals through a stochastic model, while Beutel et al. [8] approach viral diffusion as an epidemiological problem.
Qualitative theories about what makes people share content have been proposed in marketing research. Berger et al. [4, 6, 5] for instance postulate a set of STEPPS that suggests that social currency, triggers, ease of emotion, public (publicity), practical value, and stories make people share.
Analyzing viral images has received very little attention. Guerini et al. [18] have provided correlations between low-level visual data and popularity on a non-anonymous social network (Google+), as well as the links between emotion and virality [17] . Khosla et al. [24] recently studied image popularity measured as the number of views a photograph has on Flickr. However, both previous works [18, 24] have only extracted image statistics for natural photographs (Google+, Flickr). Images and the social interactions on Reddit are qualitatively different (e.g. many Reddit images are edited). In this sense, the quality of images that is most similar to ours is the concurrently introduced viral meme generator of Wang et al., that combines NLP and Computer Vision (low level features) [39]. However, our work delves deep into the role of intrinsic visual content (such as high-level image attributes), visual context surrounding an image, temporal contex and textual context in image virality. Lakkaraju et al. [26] analyzed the effects of time of day, day of the week, number of resubmissions, captions, category, etc. on the virality of an image on Reddit. However, they do not analyze the content of the image itself.
Several works in computer vision have studied complex meta-phenomenon (as opposed to understanding the “literal” content in the image such as objects, scenes, 3D layout, etc.). Isola et al. [20] found that some images are consistently more memorable than others across subjects and analyzed the image content that makes images memorable [19]. Image aesthetics was studied in [14], image emotion in [10], and object recognition in art in [12]. Importance of objects [33], attributes [38] as well as scenes [3] as defined by the likelihood that people mention them first in descriptions of the images has also been studied. We study a distinct complex phenomenon of image virality.
3 Datasets and Ground Truth Virality
3.1 Virality Score
Reddit is the main engine of viral content around the world. Last month, it had over 170M unique visitors representing every single country. It has over 353K categories (subreddits) on an enormous variety of topics. We focus only on the image content. These images are sometimes rare photographs, or photos depicting comical or absurd situations, or Redditors sharing a personal emotional moment through the photo, or expressing their political or social views through the image, and so on. Each image can be upvoted or downvoted by a user. Viral content tends to be resubmitted multiple times as it spreads across the network of users333These statistics are available through Reddit’s API.. Viral images are thus the ones that have many upvotes, few downvotes, and have been resubmitted often by different users. The latter is what differentiates virality from popularity. Previously, Guerini et al. defined multiple virality metrics as upvotes, shares or comments, Khosla et al. define popularity as number of views and Lakkaraju et al. define popularity as number of upvotes. We found that the the correlation between popularity as defined by the number of upvotes and virality that also accounts for resubmissions (detailed definition next) is -0.02. This quantitatively demonstrates the distinction between these two phenomenon. See Fig. 2 for qualitative examples. The focus of this paper is to study image virality (as opposed to popularity).

Let score be the difference between the number of upvotes and downvotes an image received at its resubmission to a category. Let be the time of the resubmission of the image and be the category (subreddit) to which it was submitted. is the average score of all submissions to category at time . We define to be the ratio of the score of the image at resubmission to the average score of all images posted to the category in that hour [26].
| (1) |
We add an offset to so that the smallest score is 0. We define the overall (across all categories) virality score for image as
| (2) |
where is the number of times image was resubmitted, and is the average number of times any image has been resubmitted. If an image is resubmitted often, its virality score will be high. This ensures that images that became popular when they were posted, but were not reposted, are not considered to be viral (Fig. 2). These often involve images where the content itself is less relevant, but current events draw attention to the image such as a recent tragedy, a news flash, or a personal success story e.g. “Omg, I lost 40 pounds in 2 weeks”. On the other hand, images with multiple submissions seem more “flexible” for different titles about multiple situations and are arguably, intrinsically viral. Examples are shown in Fig. 1(a).
3.2 Viral Images Dataset
We use images from Reddit data collected in [26] to create our dataset. Lakkaraju et al. [26] crawled 132k entries from Reddit over a period of 4 years. The entries often correspond to multiple submissions of the same image. We only include in our dataset images from categories (subreddits) that had at least 100 submissions so we have an accurate measure for in Equation 5. We discarded animated GIFs. This left us with a total of 10078 images from 20 categories, with submissions per image.
We decided to use images from Reddit instead of other social networking sites such as Facebook and Google+ [18] because users post images on Reddit “4thelulz” (i.e. just for fun) rather than personal social popularity [6]. We also prefer using Reddit instead of Flickr [24] because images in Reddit are posted anonymously, hence they breed the purest form of “internet trolling”.
3.3 Viral and Non-Viral Images Dataset
Next, we create a dataset of 500 images containing the 250 most and least viral images each using Equation 5. This stark contrast in the virality score of the two sets of images gives us a clean dichotomy to explore as a first step in studying this complex phenomenon. Recall that non-viral images include both – images that did not get enough upvotes, and those that may have had many upvotes on one submission, but were not reposted multiple times.
3.3.1 Random Pairs Dataset
In contrast with the clean dichotomy represented in the dataset above, we also create a dataset of pairs of images where the difference in the virality of the two images in a pair is less stark. We pair a random image from the 250 most viral images with a random image from images with virality lower than the median virality. Similarly, we pair a random image from the 250 least viral images with a random image with higher than median virality. We collect 500 such pairs. Removing pairs that happen to have both images from top/bottom 250 viral images leaves us with 489 pairs. We report our final human and computer results on this dataset, and refer to it as in Table 2. Training was done on the other 4550 pairs that can be formed from the remaining 10k images by pairing above-median viral images with below-median viral images.
3.4 Viral Categories Dataset
For our last dataset, we work with the five most viral categories: funny, WTF, aww, atheism and gaming. We identify images that are viral only in one of the categories and not others. To do so, we compute the ratio between an image’s virality scores with respect to the category that gave it the highest score among all categories that it was submitted to, and category that gave it the second highest score. That is,
| (3) |
where is the virality score image received on the category that gave it the highest score among all categories.
| (4) |
where is as defined in Equation 1 for the categories that gave it the highest score among all categories that image was submitted to, is the percentile rank of , is the number of times image was submitted to that category, and is the average number of times image was submitted to all categories. We take the percentile rank instead of the actual value to avoid negative values in the ratio in Equation 3.
To form our dataset, we only considered the top 5000 ranked viral images in our Viral Images dataset (Section 3.2). These contained 1809 funny, 522 WTF, 234 aww, 123 atheism and 95 gaming images. Of these, we selected 85 images per category that had the highest score in Equation 3 to form our Viral Categories Dataset.
4 Understanding Image Virality

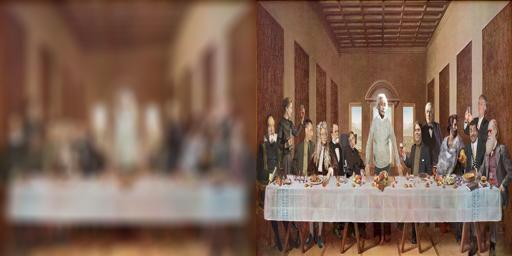
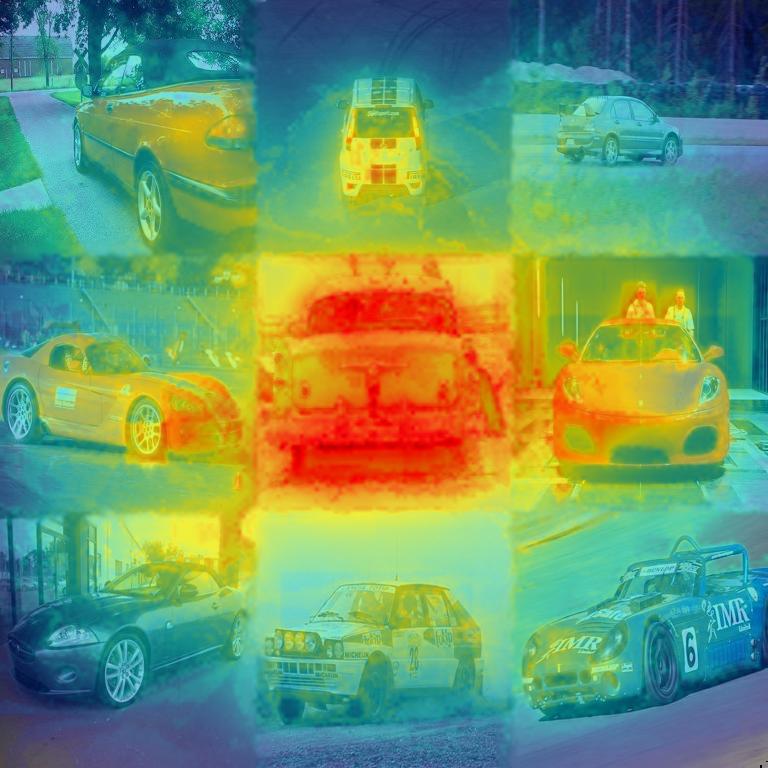
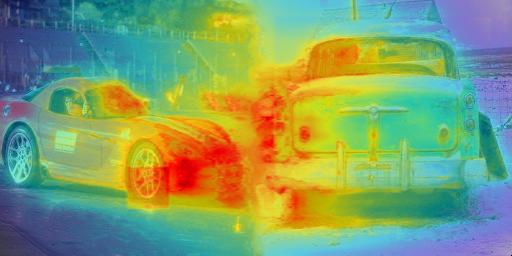
Consider the viral images of Fig. 3, where face swapping [9], contextual priming [35], and scene gist [29] make the images quite different from what we might expect at a first glance. An analogous scenario researched in NLP is understanding the semantics of “That’s what she said!” jokes [25]. We hypothesize that perhaps images that do not present such a visual challenge or contradiction – where semantic perception of an image does not change significantly on closer examination of the image – are “boring” [27, 6] and less likely to be viral. This contradiction need not stem from the objects or attributes within the image, but may also rise from the context of the image: be it the images surrounding an image, or the images viewed before the image, or the title of the image, and so on. Perhaps an interplay between these different contexts and resultant inconsistent interpretations of the image is necessary to simulate a visual double entendre leading to image virality. With this in mind, we define four forms of context that we will study to explore image virality.
-
1.
Intrinsic context: This refers to visual content that is intrinsic to the pixels of the image.
-
2.
Vicinity context: This refers to the visual content of images surrounding the image (spatial vicinity).
-
3.
Temporal context: This refers to the visual content of images seen before the image (temporal vicinity).
-
4.
Textual context: This non-visual context refers to the title or caption of the image. These titles can sometimes manifest themselves as visual content (e.g. if it is photoshopped). A word graffiti has both textual and intrinsic context, and will require NLP and Computer Vision for understanding.
4.1 Intrinsic context
We first examine whether humans and machines can predict just by looking at an image, whether it is a viral image or not, and what the dominant topic (most suitable category) for the image is. For machine experiments, we use state-of-the-art image features such as DECAF6 deep features [15], gist [29], HOG [13], tiny images [37], etc. using the implementation of [40]. We conduct our human studies on Amazon Mechanical Turk (AMT). We suspected that workers familiar with Reddit may have different performance at recognizing virality and categories than those unfamiliar with Reddit. So we created a qualification test that every worker had to take before doing any of our tasks. The test included questions about widely spread Reddit memes and jargon so that anyone familiar with Reddit can easily get a high score, but workers who are not would get a very poor score. We thresholded this score to identify a worker as familiar with Reddit or not. Every task was done by 20 workers. Images were shown at 360 360.
Machine accuracies were computed on the same test set as human studies. Human accuracies are computed using a majority vote across workers. As a result (1) accuracies reported for different subsets of workers (e.g. those familiar with Reddit and those not) can each be lower than the overall accuracy, and (2) we can not report error bars on our results. We found that accuracies across workers on our tasks varied by . On average, 73% of the worker responses matched the majority vote response per image.
4.1.1 Predicting Topics
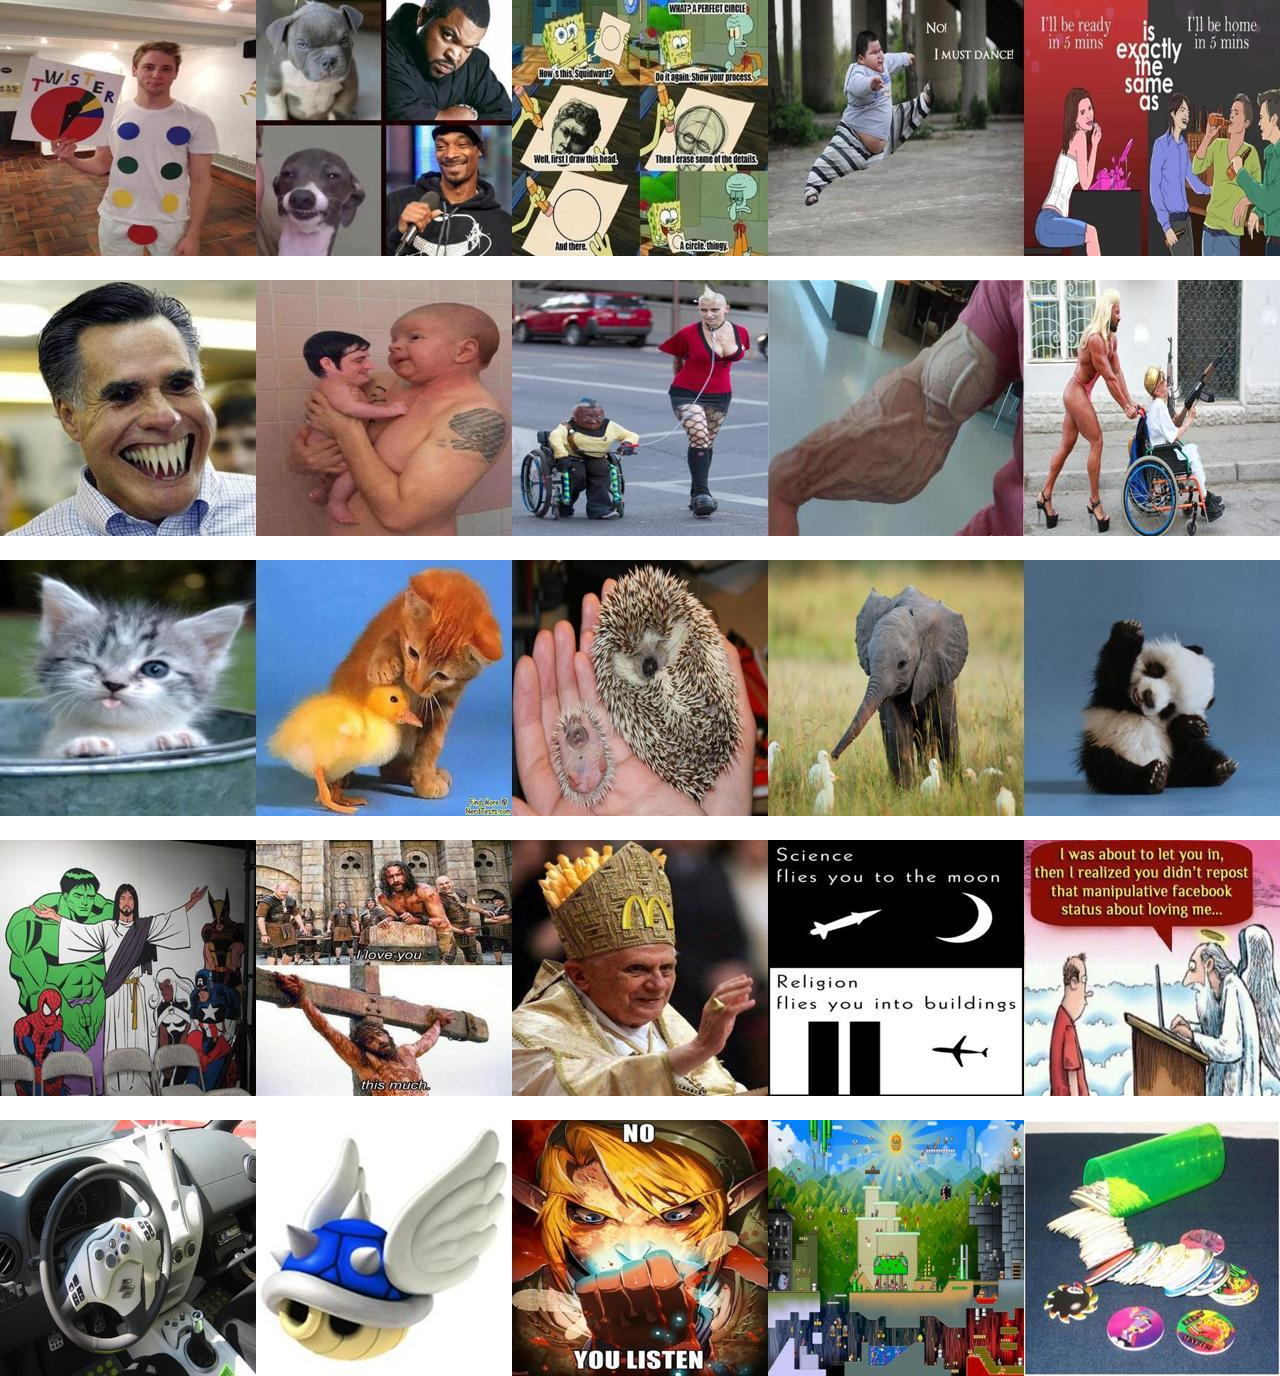
We start with our topic classification experiment, where a practical application is to help a user determine which category to submit his image to. We use our Viral Categories Dataset (Section 3.4). See Fig. 11 in Appendix. The images do generally seem distinct from one category to another. For instance, images that belong to the aww category seem to contain cute baby animals in the center of the image, images in atheism seem to have text or religious symbols, images in WTF are often explicit and tend to provoke feelings of disgust, fear and surprise.
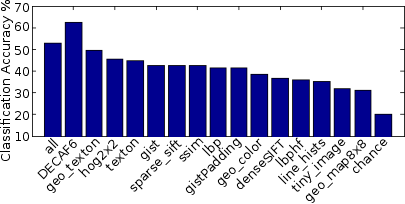
After training the 20 qualified workers with a sample montage of 55 images per category, they achieved a category identification accuracy of on 25 test images, where most of the confusion was between funny and gaming images. Prior familiarity with Reddit did not influence the accuracies because of the training phase. The machine performance using a variety of features can be seen in Fig. 4(a). A performance of was obtained by using DECAF6 [1] (chance accuracy would be 20%). Machine and human confusion matrices can be found in Appendix II.
4.1.2 Predicting Virality
Now, we consider the more challenging task of predicting whether an image is viral or not by looking at its content, by using our Viral and Non-Viral Images Dataset (Section 3.3). We asked subjects on AMT whether they think a given image would be viral (i.e. “become very viral on social networking websites like Facebook, Twitter, Reddit, Imgur, etc. with a lot of people liking, re-tweeting, sharing or upvoting the image?”). Classification accuracy was , where chance is .
In each of these tasks, we also asked workers if they had seen the image before, to get a sense for their bias based on familiarity with the image. We found that 9%, 1.5% and 3% of the images had been seen before by the Reddit workers, non-Reddit workers and all workers. While a small sample set, classification accuracies for this subset were high: , and . Note that viral images are likely to be seen even by non-Reddit users through other social networks. Moreover, we found that workers who were familiar with Reddit in general had about the same accuracy as workers who were not ( and respectively). They did however have different classification strategies. Reddit workers had a hit rate of , while non-Reddit workers had a hit rate of . This means that Reddit workers were more likely to recognize an image as viral when they saw one (but may misclassify other non-viral images as viral). Non-Reddit workers were more conservative in calling images viral. Both hit rates under indicate a general bias towards labeling images as non-viral. This may be because of the unnaturally uniform prior over viral and non-viral images in the dataset used for this experiment. Overall, workers who have never seen the image before and are not familiar with Reddit, can predict virality of an image better than chance. This shows that intrinsic image content is indicative of virality, and that image virality on communities like Reddit is not just a consequence of snowballing effects instigated by chance.

Machine performance using our metric for virality is shown in Fig. 5. Other metrics can be found in Appendix I. We see that current vision models have a hard time differentiating between these viral and non-viral images, under any criteria. The SVM was trained with both linear and non linear kernels on 5 random splits of our dataset of 10k images, using 250, 500, 1000, 2000, 4000 images for training, and 1039 images of each class for testing.
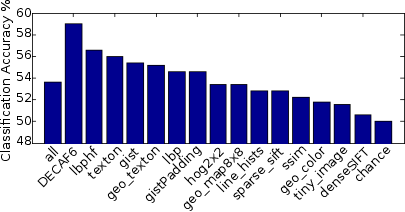
The performance of the machine on the same set of images as used in the human studies using a variety of features to predict virality is shown in Fig. 4(b). Training was performed on the top and bottom 2000 images, excluding the top and bottom 250 images used for testing. DECAF features achieve highest accuracy at 59%; This is above chance, but lower than human performance (65.4%). The wide variability of images on Reddit (seen throughout the paper) and the poor performance of state-of-the-art image features indicates that automatic prediction of image virality will require advanced image understanding techniques.
4.1.3 Predicting Relative Virality
Predicting the virality of indivual images is a challenging task for both humans and machines. We therefore consider making relative predictions of virality. That is, given a pair of images, is it easier to predict which of the two images is more likely to be viral? In psychophysics, this setup is called a two-alternative forced choice (2AFC) task.
We created image pairs consisting of a random viral image and a random non-viral image from our Viral and Non-Viral Images dataset (Section 3.3). We asked workers which of the two images is more likely to go viral. Accuracies were all workers44462.12% of AMT Workers were Reddit workers.: , Reddit workers: and non-Reddit workers: , noticeably higher than on the absolute task, and 50% chance. A SVM using DECAF6 image features got an accuracy of 61.60%, similar to the SVM classification accuracy on the absolute task (Fig. 4(b)).
4.1.4 Relative Attributes and Virality
Now that we’ve established that a non-trivial portion of virality does depend on the image content, we wish to understand what kinds of images tend to be viral i.e. what properties of images are correlated with virality. We had subjects on AMT annotate the same pairs of images used in the experiment above, with relative attribute annotations [31]. In other words, for each pair of images, we asked them which image has more of an attribute presence than the other. Each image pair thus has a relative attribute annotation indicating whether the first image has a stronger, equal or weaker presence of the attribute than the second image. In addition, each image pair has a virality annotation based on our ground truth virality score indicating whether the first image is more viral or the second. We can thus compute the correlation between each relative attribute and relative virality.
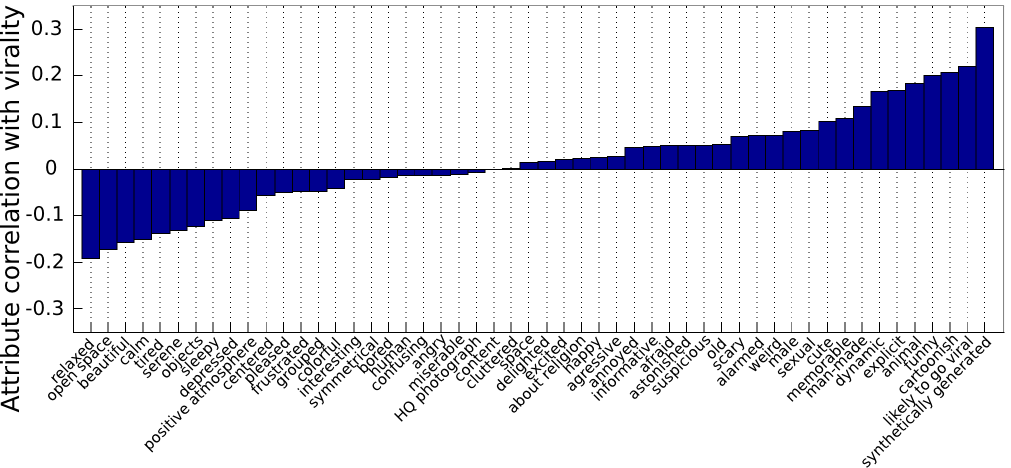
We selected 52 attributes that capture the spatial layout of the scene, the aesthetics of the image, the subject of the image, how it made viewers feel, whether it was photoshopped, explicit, funny, etc. Inspirations for these attributes came from familiarity with Reddit, work on understanding image memorability [19], and representative emotions on the valence/arousal circumplex [4, 17]. See Fig. 6(a) for the entire list of attributes we used. As seen in Fig. 6(a), synthetically generated (Photoshopped), cartoonish and funny images are most likely to be viral, while beautiful images that make people feel calm, relaxed and sleepy (low arousal emotions [4]) are least likely to be viral. Overall, correlation values between any individual attribute and virality is low, due to the wide variation in the kinds of images found on communities like Reddit.
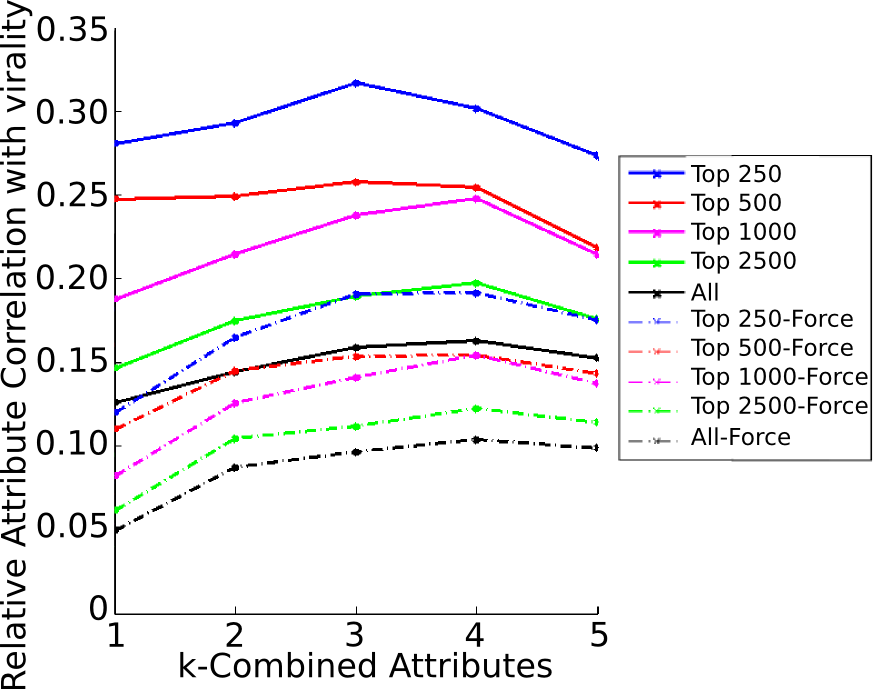
We further studied virality prediction with combinations of attributes. We start by identifying the single (relative) attribute with the highest (positive or negative) correlation with (relative) virality. We then greedily find the second attribute that when added to the first one, increases virality prediction the most. For instance, funny images tend to be viral, and images with animals tend to be viral. But images that are funny and have animals may be even more likely to be viral. The attribute to be added can be the attribute itself (), or its negation (). This helps deal with attributes that are negatively correlated with virality. For instance, synthetically generated images that are not beautiful are more likely to be viral than images that are either synthetically generated or not beautiful. In this way, we greedily add attributes. Table 1 shows the attributes that collaborate to correlate well with virality. We exclude “likely to go viral” and “memorable” from this analysis because those are high-level concepts in themselves, and would not add to our understanding of virality.
A combination of 38 attributes leads to a virality predictor that achieves an accuracy of . This can be viewed as a hybrid human-machine predictor of virality. The attributes have been annotated by humans, but the attributes have been selected via statistical analysis. We see that this significantly outperforms humans alone () and the machine alone (, see Table 2). One could train a classifier on top of the attribute predictors to further boost performance, but the semantic interpretability provided by Table 1 would be lost. Our analysis begins to give us an indication of which image properties need to be reliably predicted to automatically predict virality.
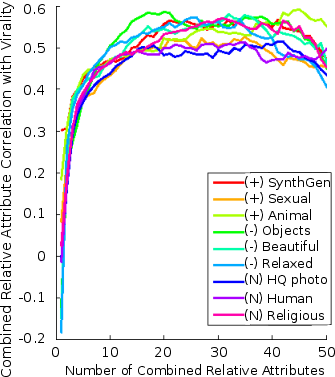
We also explore the effects of “attribute priming”: if the first attribute in the combination is one that is negatively correlated with virality, how easy is it to recover from that to make the image viral? Consider the scenario where an image is very “relaxed” (inversely correlated with virality). Is it possible for a graphics designer to induce virality by altering other attributes of the image to make it viral? Fig. 6(c) shows the correlation trajectories as more attributes are greedily added to a “seed” attribute that is positively , negatively , or neutrally correlated with virality. We see that in all these scenarios, an image can be made viral by adding just a few attributes. Table 1 lists which attributes are selected for 3 different “seed” attributes. Interestingly, while sexual is positively correlated with virality, when seeded with animal, not sexual increases the correlation with virality. As a result, when we select our five attributes greedily, the combination that correlates best with virality is: animals, synthetically generated, not beautiful, explicit” and not sexual.
4.1.5 Automated Relative Virality Prediction
To create an automated relative virality prediction classifier, we start by using our complete 10k image dataset and have AMT workers do the same task as in Section 4.1.4, by dividing them into viral (top half in rank) vs non viral (lower half in rank), and randomly pairing them up for relative attribute annotation for the top 5555Tagging all 52 relative attributes accurately for all image pairs in the dataset is expensive. performing attributes from our greedy search in Fig. 6(c): Animal, Synthetically Generated(SynthGen), Beautiful, Explicit and Sexual. Note that all of our top-5 attributes are visual. Correlation trajectories of combined attributes for all our dataset in a hybrid human-machine virality predictor can be seen at Fig. 6(b).
| 1 | 2 | 3 | 4 | 5 | |
| Attribute (+) | synth. gen. | animal | beautiful | explicit | sexual |
| Virality Correlation | 0.3036 | 0.3067 | 0.3813 | 0.3998 | 0.4236 |
| Attribute (-) | beautiful | synth. gen. | animal | dynamic | annoyed |
| Virality Correlation | -0.1510 | 0.2383 | 0.3747 | 0.3963 | 0.4097 |
| Attribute (N) | religious | synth. gen. | animal | beautiful | dynamic |
| Virality Correlation | 0.0231 | 0.1875 | 0.3012 | 0.3644 | 0.3913 |
| Dataset | Classification Method | Performance |
| Chance | ||
| All images | SVM + image features | |
| Human (500) | ||
| Top/Bottom | SVM + image features | |
| 250 viral | Human annotated Atts.-1 | |
| (Section 3.3) | Human annotated Atts.-3 | |
| Human annotated Atts.-5 | ||
| Human annotated Atts.-11 | ||
| Human annotated Atts.-38 | ||
| Top/Bottom | Khosla et al. Popularity API [24] | |
| 250 viral | SVM + image features | |
| paired with | Human | |
| random imgs. | Human annotated Atts.-5 | |
| (Section 3.3.1) | SVM + Deep Attributes-5 |
With all the annotations, we then train relative attribute predictors for each of these attributes with DECAF6 deep features [15] and an SVM classifier through 10-fold cross validation to obtain relative attribute predictions on all image pairs (Section 3.3.1). The relative attribute prediction accuracies we obtain are: Animal: , Synthgen: , Beautiful: , Explicit: , Sexual: (Chance: ), by including neutral pairs. Futhermore, we get Animal: , Synthgen: , Beautiful: , Explicit: , Sexual: for relative labels, excluding neutral (tied) pairs (Chance: ). Combining these automatic attribute predictions to inturn (automatically) predicted virality, we get an accuracy of . If we use ground truth relative attribute annotations for these 5 attributes we achieve () accuracy, better than human performance () at predicting relative virality directly from images. Using our deep relative attributes, machines can predict relative virality more accurately than humans! This is because (1) humans do not fully understand what makes an image viral (hence the need for a study like this and automatic approaches to predicting virality) and (2) the attribute classifiers trained by the machine may have latched on to biases of viral content. The resultant learned notion of attributes may be different from human perception of these attributes.
Although our predictor works well above chance, notice that extracting attributes from these images is non-trivial, given the diversity of images in the dataset. While detecting faces and animals is typically considered to work reliably enough [16], recall that images in Reddit are challenging due to their non-photorealism, embedded textual content and image composition. To quantify the qualitative difference in the images in typical vision datasets and our dataset, we trained a classifier to classify an image as belonging to our Virality Dataset or the SUN dataset [40, 36]. We extracted DECAF6 features from our dataset and similar number of images from the SUN dataset. The resultant classifier was able to classify a new image as coming from one of the two datasets with accuracy, confirming qualitative differences. Moreover, the metric developed for popularity [24] applied to our dataset outputs chance like results (Table 2). Thus, our datasets provide a new regime to study image understanding problems.
4.2 Vicinity context
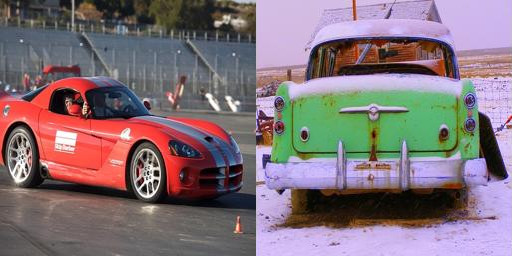
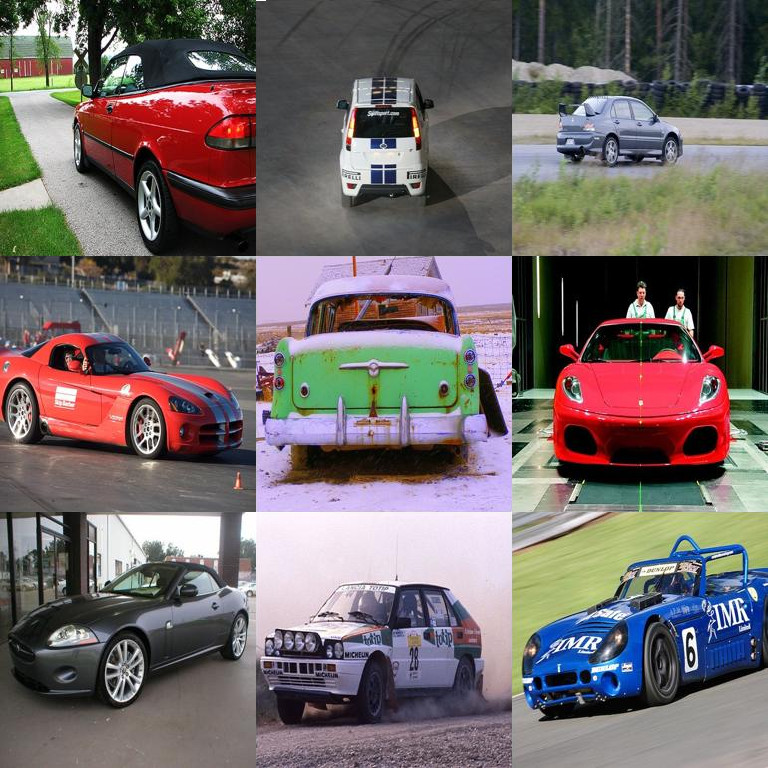
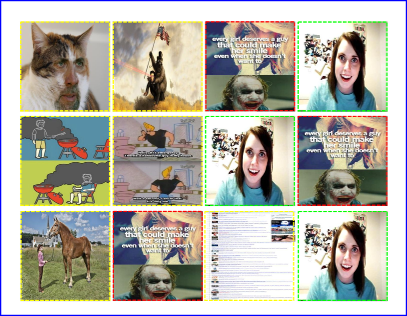
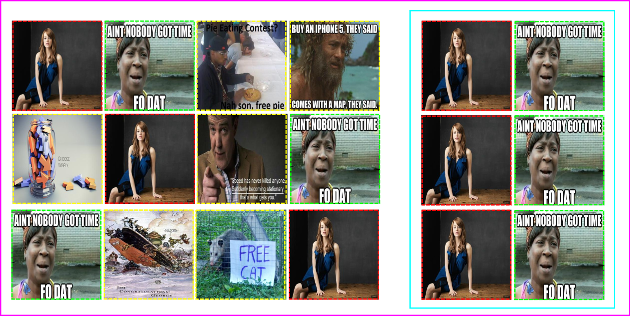
Reasoning about pairs of images as we did with relative virality above, leads to the question of the impact of images in the vicinity of an image on human perception of its virality. We designed an AMT experiment to explore this (Fig. 7). Recall that in the previous experiment involving relative virality prediction, we formed pairs of images, where each pair contained a viral and non-viral image. We now append these pairs with two “proxy” images. These proxies are selected to be either similar to the viral image, or to the non-viral image, or randomly. Similarity is measured using the gist descriptor [29]. The and most similar images are selected from our Viral Images dataset (Section 3.2). We do not select the two closest images to avoid near identical matches and to ensure that the task did not seem like a “find-the-odd-one-out” task. We study these three conditions in two different experimental settings. The first is where workers are asked to sort all four images from what they believe is the least viral to the most viral. In the second experimental design, workers were still shown all four images, but were asked to only annotate which one of the two images from the original pair is more viral than the other. Maybe the mere presence of the “proxy” images affects perception of virality? For both cases, we only check the relative ranking of the viral and non viral image.
| Sort 4 | Sort 2 | |
| Viral-NN | ||
| Non viral-NN | ||
| Random |
Worker accuracy in each of the six scenarios is shown in Table 3. We see that when asked to sort all four images, identifying the true viral images is harder with the presence of random proxies, as they tend to confuse workers and their performance at predicting virality drops to nearly chance. The presence of carefully selected proxies can still make the target viral image salient. When asked to sort just the two images of interest, performance is overall higher (because the task is less cumbersome). But more importantly, performance is very similar across the three conditions (Sort 2). This suggests that perhaps the mere presence of the proxy images does not impact virality prediction.
Developing group-level image features that can reason about such higher-order phenomenon has not been well studied in the vision community. Visual search or saliency has been studied to identify which images or image regions pop out. But models of change in relative orderings of the same set of images based on presence of other images have not been explored. Such models may allow us to select the ideal set of images to surround an image by to increase its chances of going viral.
4.3 Temporal context
Having examined the effect of images in the spatial vicinity on image virality, we now study the effects of temporal aspects. In particular, we show users the same pairs of images used in the relative virality experiment in Section 4.1.3 at 4 different resolutions one after the other: , , , (original). We choose blurring to simulate first impression judgements at thumbnail sizes when images are ‘previewed’. At each stage, we asked them which image they think is more likely to be viral. Virality prediction performance was , , and . Virality prediction is reduced to chance even in images, where humans have been shown to recognize semantic content in images very reliably [37]. Subjects reported being surprised for 65% of the images. We found a -0.04 correlation between true virality and surprise, and a -0.07 correlation between predicted virality and surpise. Perhaps people are bad at estimating whether they were truly surprised or not, and asking them may not be effective; or surprise truly is not correlated with virality.
4.4 Textual context
As a first experiment to evaluate the role of the title of the image, we show workers pairs of images and ask them which one they think is more likely to be viral. We then reveal the title of the image, and ask them the same question again. We found that access to the title barely improved virality prediction ( vs. ). This suggests that perhaps the title does not sway subjects after they have already judged the content.
Our second experiment had the reverse set up. We first showed workers the title alone, and asked them which title is more likely to make an image be viral. We then showed them the image (along with the title), and asked them the same question. Workers’ prediction of relative virality was worse than chance using the title alone (). Interestingly, having been primed by the title, even with access to the image performance did not improve significantly above chance () and is significantly lower than their performance when viewing an image without being primed by the title (). This suggests that image content seems to be the prime signal in human perception of image virality. However, note that these experiments do not analyze the role of text that may be embedded in the image (memes!).
5 Conclusions
We studied viral images from a computer vision perspective. We introduced three new image datasets from Reddit, the main engine of viral content around the world. We defined a virality score using Reddit metadata. We found that virality can be predicted more accurately as a relative concept. While humans can predict relative virality from image content, machines are unable to do so using low-level features. High-level image understanding is key. We identified five key visual attributes that correlate with virality: Animal, Synthetically Generated, (Not) Beautiful, Explicit and Sexual. We predict these relative attributes using deep image features. Using these deep relative attribute predictions as features, machines (SVM) can predict virality with an accuracy of (higher than human performance: ). Finally, we study how human prediction of image virality varies with different “contexts” – intrinsic, spatial (vicinity), temporal and textual. This work is a first step in understanding the complex but important phenomenon of image virality. We have demonstrated the need for advanced image understanding to predict virality, as well as the qualitative difference between our datasets and typical vision datasets. This opens up new opportunities for the vision community. Our datasets and annotations will be made publicly available.
6 Acknowledgements
This work was supported in part by ARO YIP 65359NSYIP to D.P. and NSF IIS-1115719. We would also like to thank Stanislaw Antol, Michael Cogswell, Harsh Agrawal, and Arjun Chandrasekaran for their feedback and support.
Appendix I: Virality Metrics


Machine performance using different metrics for virality are shown in Fig. 8. We see that current vision models have a hard time differentiating between these viral and non-viral images, under any criteria. The SVM was trained with both linear and non linear kernels on 5 random splits of our dataset of 10k images, using 250, 500, 1000, 2000, 4000 images for training, and 1039 images of each class for testing.
Recall that we define our virality score for image across all resubmissions as
| (5) |
where is the number of times image was resubmitted, and is the average number of times any image has been resubmitted. is a normalized score based on the metric of [26]. The other metrics we experimented with included maximum upvotes (Fig. 8(b)) across submissions and number of resubmissions (Fig. 8(c)).
Appendix II: Category Prediction Confusion Matrices
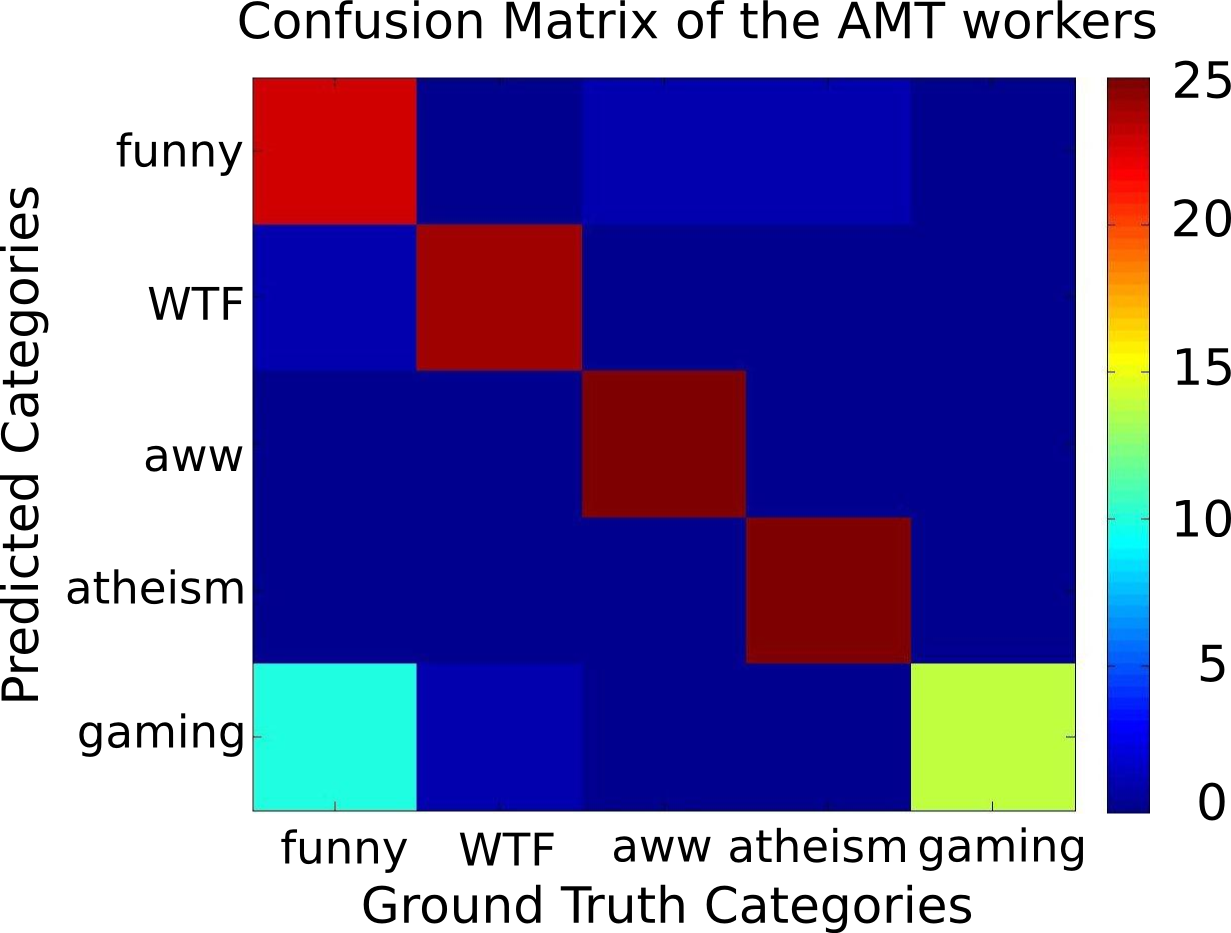
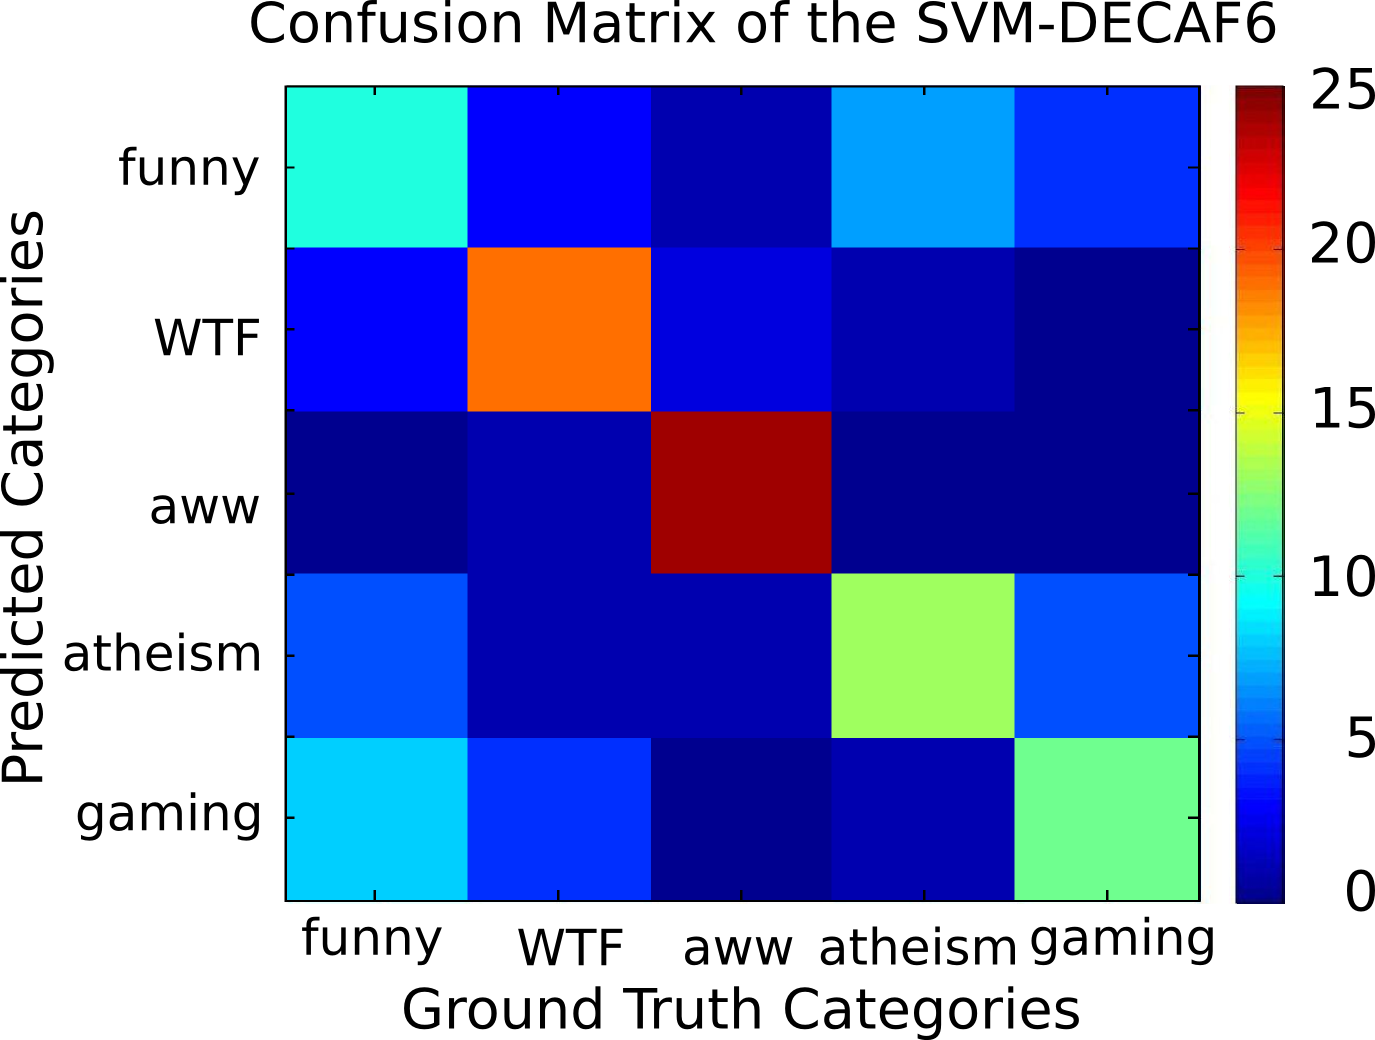
The confusion matrices in Figure 9 depict how a human and computer perform at identifying categories/topics (subreddits) in viral images (Section 4.1.1). A computer achieves accuracy using SVM + DECAF6 after training on 60 images, while a human achieves on the same test images (chance is ). Recall that this group of AMT workers had to undergo training to learn how to identify the categories just like the computer, with the same exemplars (55 on training + 5 for validating that the workers paid attention during training). Both humans and machines tend to confuse gaming images with funny ones. They are also both remarkabely good at identifying the aww category. While for a human it might be trivial, we suspect that it is also easy for the machine, since texture (animal fur, feathers, skin) plays an important role that DECAF6 is encoding. Atheism on the other hand is very simple for a human, but complex for a machine. We are inclined to believe that since identifying whether an image contains religious content or not involves high-level semantics and often text, the task of detecting atheism is challenging for a machine. The machine as a result tends to confuse it with funny or gaming, as some of these images also contain text. Examples from all 5 categories are shown in Fig 11.


Potential applications for subreddit classification include a recomendation system for a human to know to what category to submit his image for marketing/personal purposes. Automatically identifying a subreddit (or topic) of the image can also provide context when generating image descriptions [30, 23].
Appendix III: Dataset Comparison
Viral images are very different from standard images analyzed in different computer vision datasets. In Figure 10(a), we see how the SUN dataset images favors open spaces in outdoor and indoor environments. Images from Flickr (Figure 10(b)) have more variation than SUN images, yet the images still follow many traditional and photographic rules: rule of the third, principal subject(s) in picture, all co-occurring objects are in context, and they are colorful just like the SUN dataset. Recall that Flickr has become an online platform for photographers and amateurs to share their most beautiful pictures, an attribute that correlates inversely with virality.
Viral images, on the other hand, seem non-sensical, chaotic, and very unpredictable. They do not follow photographic rules. They can have cartoons, text, and (non)photorealistic content embedded separately or together, yet they still express an idea that is easily understandable for humans. We hope that the vision community will study automatic image understanding in these kinds of images (Figure 10(c)).
References
- [1] H. Agrawal, N. Chavali, M. C., Y. Goyal, A. Alfadda, , P. Banik., and D. Batra. Cloudcv: Large-scale distributed computer vision as a cloud service, 2013.
- [2] A.-L. Barabasi. The origin of bursts and heavy tails in human dynamics. Nature, 2005.
- [3] A. Berg, T. Berg, H. Daume, J. Dodge, A. Goyal, X. Han, A. Mensch, M. Mitchell, A. Sood, K. Stratos, et al. Understanding and predicting importance in images. In CVPR, 2012.
- [4] J. Berger. Arousal increases social transmission of information. Psychological science, 2011.
- [5] J. Berger. Contagious: Why Things Catch On. Simon & Schuster, 2013.
- [6] J. Berger and K. L. Milkman. What makes online content viral? Journal of Marketing Research, 2012.
- [7] J. Berger and E. M. Schwartz. What drives immediate and ongoing word of mouth? Journal of Marketing Research, 2011.
- [8] A. Beutel, B. A. Prakash, R. Rosenfeld, and C. Faloutsos. Interacting viruses in networks: can both survive? In SIGKDD, 2012.
- [9] D. Bitouk, N. Kumar, S. Dhillon, P. Belhumeur, and S. K. Nayar. Face swapping: automatically replacing faces in photographs. In Transactions on Graphics (TOG), 2008.
- [10] D. Borth, R. Ji, T. Chen, T. Breuel, and S.-F. Chang. Large-scale visual sentiment ontology and detectors using adjective noun pairs. In Proceedings of the 21st ACM international conference on Multimedia, pages 223–232. ACM, 2013.
- [11] Z. Chen and J. Berger. When, why, and how controversy causes conversation. The Wharton School Research Paper, 2012.
- [12] E. J. Crowley and A. Zisserman. In search of art. In Workshop on Computer Vision for Art Analysis, ECCV, 2014.
- [13] N. Dalal and B. Triggs. Histograms of oriented gradients for human detection. In CVPR, 2005.
- [14] S. Dhar, V. Ordonez, and T. L. Berg. High level describable attributes for predicting aesthetics and interestingness. In CVPR, 2011.
- [15] J. Donahue, Y. Jia, O. Vinyals, J. Hoffman, N. Zhang, E. Tzeng, and T. Darrell. Decaf: A deep convolutional activation feature for generic visual recognition. arXiv preprint arXiv:1310.1531, 2013.
- [16] R. Girshick, J. Donahue, T. Darrell, and J. Malik. Rich feature hierarchies for accurate object detection and semantic segmentation. arXiv preprint arXiv:1311.2524, 2013.
- [17] M. Guerini and J. Staiano. Deep feelings: A massive cross-lingual study on the relation between emotions and virality. arXiv preprint arXiv:1503.04723, 2015.
- [18] M. Guerini, J. Staiano, and D. Albanese. Exploring image virality in google plus. In Social Computing (SocialCom), 2013 International Conference on, pages 671–678. IEEE, 2013.
- [19] P. Isola, D. Parikh, A. Torralba, and A. Oliva. Understanding the intrinsic memorability of images. In NIPS, 2011.
- [20] P. Isola, J. Xiao, A. Torralba, and A. Oliva. What makes an image memorable? In CVPR, 2011.
- [21] E. Johns, O. Mac Aodha, and G. J. Brostow. Becoming the Expert - Interactive Multi-Class Machine Teaching. In CVPR, 2015.
- [22] T. Judd, K. Ehinger, F. Durand, and A. Torralba. Learning to predict where humans look. In Computer Vision, 2009 IEEE 12th international conference on, pages 2106–2113. IEEE, 2009.
- [23] A. Karpathy, A. Joulin, and L. Fei-Fei. Deep fragment embeddings for bidirectional image sentence mapping. arXiv preprint arXiv:1406.5679, 2014.
- [24] A. Khosla, A. D. Sarma, and R. Hamid. What makes an image popular? In International World Wide Web Conference (WWW), Seoul, Korea, April 2014.
- [25] C. Kiddon and Y. Brun. That’s what she said: Double entendre identification. In ACL (Short Papers), 2011.
- [26] H. Lakkaraju, J. McAuley, and J. Leskovec. What’s in a name? understanding the interplay between titles, content, and communities in social media. ICWSM, 2013.
- [27] J. Leskovec, L. A. Adamic, and B. A. Huberman. The dynamics of viral marketing. Transactions on the Web, 2007.
- [28] M. Nagarajan, H. Purohit, and A. P. Sheth. A qualitative examination of topical tweet and retweet practices. In ICWSM, 2010.
- [29] A. Oliva and A. Torralba. Modeling the shape of the scene: A holistic representation of the spatial envelope. IJCV, 2001.
- [30] V. Ordonez, G. Kulkarni, and T. L. Berg. Im2text: Describing images using 1 million captioned photographs. In Neural Information Processing Systems (NIPS), 2011.
- [31] D. Parikh and K. Grauman. Relative attributes. In ICCV, 2011.
- [32] P. Shakarian, S. Eyre, and D. Paulo. A scalable heuristic for viral marketing under the tipping model, 2013.
- [33] M. Spain and P. Perona. Measuring and predicting object importance. IJCV, 2011.
- [34] B. Suh, L. Hong, P. Pirolli, and E. H. Chi. Want to be retweeted? large scale analytics on factors impacting retweet in twitter network. In Social Computing, 2010.
- [35] A. Torralba. Contextual priming for object detection. IJCV, 2003.
- [36] A. Torralba and A. A. Efros. Unbiased look at dataset bias. In Computer Vision and Pattern Recognition (CVPR), 2011 IEEE Conference on, pages 1521–1528. IEEE, 2011.
- [37] A. Torralba, R. Fergus, and W. T. Freeman. 80 million tiny images: A large data set for nonparametric object and scene recognition. TPAMI, 2008.
- [38] N. Turakhia and D. Parikh. Attribute dominance: What pops out? In ICCV, 2013.
- [39] W. Y. Wang and M. Wen. I can has cheezburger? a nonparanormal approach to combining textual and visual information for predicting and generating popular meme descriptions. In Proceedings of the 2015 Conference of the North American Chapter of the Association for Computational Linguistics: Human Language Technologies, 2015.
- [40] J. Xiao, J. Hays, K. A. Ehinger, A. Oliva, and A. Torralba. Sun database: Large-scale scene recognition from abbey to zoo. In CVPR, 2010.