OPTICAL - NEAR INFRARED PHOTOMETRIC CALIBRATION OF M-DWARF METALLICITY AND ITS APPLICATION
Abstract
Based on a carefully constructed sample of dwarf stars, a new optical-near infrared photometric calibration to estimate the metallicity of late-type K and early-to-mid-type M dwarfs is presented. The calibration sample has two parts; the first part includes 18 M dwarfs with metallicities determined by high-resolution spectroscopy and the second part contains 49 dwarfs with metallicities obtained through moderate-resolution spectra. By applying this calibration to a large sample of around 1.3 million M dwarfs from the Sloan Digital Sky Survey and the Two-Micron All Sky Survey, the metallicity distribution of this sample is determined and compared with those of previous studies. Using photometric parallaxes, the Galactic heights of M dwarfs in the large sample are also estimated. Our results show that stars farther from the Galactic plane, on average, have lower metallicity, which can be attributed to the age-metallicity relation. A scarcity of metal-poor dwarf stars in the metallicity distribution relative to the Simple Closed Box Model indicates the existence of the “M dwarf problem,” similar to the previously known G and K dwarf problems. Several more complicated Galactic chemical evolution models which have been proposed to resolve the G and K dwarf problems are tested and it is shown that these models could, to some extent, mitigate the M dwarf problem as well.
1 INTRODUCTION
M dwarfs are the most numerous stars in the Galaxy, contributing about 70 of all stars by number (Reid & Gizis 1997, hereafter RG97). Their main-sequence (MS) lifetimes are much longer than the current age of the Universe and they can therefore be used as excellent tracers of Galactic structure and population as well as Galactic chemical, kinematical and dynamical evolution. Since the advent of deep, advanced surveys such as the Sloan Digital Sky Survey (SDSS, York et al. 2000) and the Two-Micron All Sky Survey (2MASS, Skrutskie et al. 2006), M dwarfs have been investigated in photometric and spectroscopic samples of unprecedented size, revolutionizing this area of astronomy.
Clearly, a complete understanding of Galactic astronomy requires accurate knowledge of fundamental properties such as mass, radius, metallicity and temperature of these dwarfs. These, especially metallicity, however, have proven challenging to calibrate. Although accurate values of metallicity for M dwarfs can directly be obtained by analyzing high-resolution spectra (e.g., Woolf & Wallerstein 2005, hereafter WW05), the development of alternative methods is needed. Since M dwarfs are among the intrinsically faintest stars , only a limited number of these stars are close enough for high-resolution spectroscopy (Woolf and Wallerstein 2006). For this reason, efforts have been made to estimate the metallicity of M dwarfs based on spectral band indices through low-to-moderate-resolution spectra (Lépine et al. 2007, hereafter L07; Rojas-Ayala et al. 2010 2012; Terrien et al. 2012; Mann et al. 2013a, hereafter M13a; Mann et al. 2013b, hereafter M13b; Newton et al. 2014, hereafter N14; Mann et al. 2014, hereafter M14).
Despite the significant progress in deriving empirical metallicity calibrations using moderate-resolution spectra within the last few years, there is still a need for simpler approaches to determine the metallicity of large numbers of M dwarfs. There have been Several attempts to do this using photometric properties. By employing a calibration sample of M dwarfs in M+FGK CPMSs, Bonfils et al. (2005, hereafter B05) derived an M-dwarf metallicity relation in terms of the K-band absolute magnitude () and color with a dispersion of 0.2 dex. Johnson and Apps (2009, hereafter JA09) showed that while the relation of B05 could reasonably reproduce the metallicity of metal-poor M dwarfs, it underestimated the metallicities of their high metallicity stars by an average of 0.32 dex. They established an empirical model in which the distance of an M dwarf from the mean MS along in the - plane was an indicator of its metallicity. Schlaufman & Laughlin (2010, hereafter SL10) suggested that the empirical photometric calibrations of B05 and JA09 systematically underestimated or overestimated metallicity at the extremes of their ranges. They improved upon those calibrations and determined the metallicity of an M dwarf using its distance from the mean MS along the color (rather than ) in the - plane. By applying a new sample of M dwarfs in M+FGK CPMSs, Neves et al. (2012, hereafter N12) showed that the calibration of SL10 had a lower dispersion than those of B05 and AJ09, and slightly modified this relation by readjusting its coefficients using their own calibration sample.
In order to use the photometric calibrations described above, the distances of M dwarfs are required; this limits their applications only to samples of stars whose parallaxes are available. A color-color diagram could provide a more efficient technique for determining the metallicity of M dwarfs, even those with unknown parallaxes. Several empirically determined metallicity calibrations through color-color diagrams have been derived in the last few years. Using their large spectroscopic sample of M dwarfs, West et al. (2011, hereafter W11) obtained a two-dimensional fit which related a metallicity parameter (, L07) to the and colors, with typical uncertainties of 10 - 20%. Bochanski et al. (2013) pointed out that the relation of W11 is limited only to near-solar metallicity M dwarfs. They introduced a quantity, which measures the difference in between a subdwarf and its solar metallicity counterpart as a function of color. Most recently, West et al. (2014) used more than 20,000 M dwarfs with metallicities determined by the optimized spectroscopic calibration of M13b (tested using a sample of wide, low-mass binaries for which both components have an SDSS spectrum) and derived relations between the metallicity and the SDSS griz colors of M dwarfs. By employing an M-dwarf calibration sample in M+FGK CPMSs, Johnson et al. (2012, hereafter J12) developed a calibration which correlated the metallicity of an M dwarf with its distance to the MS along the color in the - plane, with an RMSE = 0.15 dex. N14 assembled a sample of 447 M dwarfs with metallicities calculated by their own spectroscopic calibration and found that the color of an M dwarf is the best single-color diagnostic of its metallicity. They then derived a metallicity relation as a function of the distance of an M dwarf to the MS along color in the - color-color diagram, with a multiple correlation coefficient () of 0.92.
Our main goal in this study is to derive an optical-NIR photometric metallicity calibration which can readily be applied to large numbers of stars without the need for parallaxes, moderate-to-high resolution spectra or time-intensive calculations. This will allow us to study statistically the metallicity distribution of the local Galactic disk and test models of Galactic chemical evolution (GCE). The observations, sampling process and M-dwarf selection are briefly described in section 2. Our metallicity calibration sample and the best-fit relation for estimating M-dwarf metallicity are presented in Section 3. The Galactic height (z - height) distribution is investigated in Section 4. Section 5 is devoted to the application of the metallicity relation to our large sample and the comparison of the resulting metallicity distribution with those from other studies. The statistical relation between the metallicity and z - height of M dwarfs is also discussed in this Section. In Section 6, the Simple Closed Box Model (SCBM, Schmidt 1963) as well as a few more realistic GCE models are compared with our M-dwarf metallicity distribution.
2 OBSERVATIONS AND M DWARF SAMPLING
2.1 Matched SDSS And 2MASS Data
The SDSS is one of the most extensive surveys in astronomy. During its operations, it obtained multi-color images which covered more than a quarter of the sky. Multi-band photometry was collected using a 2.5-m wide-angle optical telescope at Apache Point Observatory, in New Mexico. The camera included thirty CCD chips each with 20482048 pixels (with a total of 120 Megapixels). These chips were organized in five columns of six chips per column. Each column had a different optical filter bandpass, designated u, g, r, i, z (Fukugita et al. 1996), with average wavelengths of 355.1, 468.6, 616.5, 748.1 and 893.1 nm and with 95% completeness of point sources in typical seeing to magnitudes of 22.0, 22.2, 22.2, 21.3, and 20.5, respectively (Gunn et al. 1998). The SDSS imaging covers several thousand square degrees of sky, and over this region, photometric calibrations achieved an accuracy of 0.01 - 0.03 mag in ugriz (Ivezić al. 2004, 2007; Adelman-McCarthy et al. 2006; Tucker et al. 2006; Padmanabhan et al. 2008).
Our calibration uses both optical (the SDSS g) and NIR (the 2MASS JHK) broadband filter and we cross-matched the SDSS and 2MASS data for collecting our sample. The 2MASS was a survey of the whole sky in the three IR broad-band filters J, H and K, with average wavelengths of 1.25 m, 1.65 m and 2.17 m, respectively. The measurements were made from 1997 to 2001 using two highly-automated 1.3-m telescopes, one at Mt. Hopkins, Arizona for the Northern Hemisphere observations and one at Cerro Tololo Inter-American Observatory, Chile for the southern hemisphere data. Each telescope had a three-channel camera, each containing a 256 256 array of infrared detectors to scan the sky simultaneously in the three filters. Point sources brighter than about 1 mJy, with S/N greater than 10 in each band were characterized and compiled in a separate catalog, the 2MASS Point Source Catalog (2MASS-PSC, Cutri et al. 2003). These bright sources ( 13 mag) generally have 1-sigma photometric uncertainty of mag (Skrutskie et al. 2006).
We used the SQL Search tool in the SkyServer DR9 to collect an M-dwarf sample suitable for our study. The stars were taken from the SDSS DR9 photometric catalog (identified by PhotoObj, Ahn et al. 2012) with the object class specified by Type = 6 (for stars). Each object in the SDSS DR9 catalog has a unique SDSS identifier, called ObjID, which is also included in the 2MASS-PSC for objects in the regions that overlapped with the SDSS. We therefore selected those stars with the same ObjIDs in the two catalogs.
2.2 Extinction Correction
To minimize extinction, we chose stars with high Galactic latitude . It has long been shown that, on average, extinction decreases at higher latitudes, due to the low column densities found along these lines of sight (Zagury 2006;Larson and Whittet 2005).
We employed the dust maps of Schlegel et al. (1998, hereafter S98) to correct the stellar photometry for Galactic extinction. Currently, these maps provide the most comprehensive dust data of the Milky Way on a large scale, including two two-dimensional full-sky maps (one for the northern and one for the southern Galactic hemisphere) with total line-of-sight dust column densities determined from far-infrared (100 and 240 m) emission data. These maps have a resolution of 6.1 arcmin and are shown to predict reddening within 16% (S98). We also used the relative extinctions given in Table 6 of S98 to convert the extinction corrections in the -band magnitude to SDSS-2MASS filter bands. While the maps mentioned above provide an efficient tool for estimating dust extinction, they refer to the total Galactic extinction along the line of sight and so may overestimate the true extinction to nearby stars (Covey et al. 2007 hereafter C07, Jones et al. 2011 hereafter J11). Most of objects in the Galaxy lie behind only a portion of the Milky Way’s total dust column and thus are likely attenuated and reddened by only a fraction of the total dust column.
Using spectra of more than 56,000 M dwarfs from the SDSS, J11 created a high-latitude, three-dimensional extinction map of the local Galaxy. In their technique, spectra from stars in the SDSS DR7 dwarf sample along low-extinction lines-of-sight were compared with other SDSS M-dwarf spectra for deriving distances and accurate lines-of-sight extinction. The three-dimensional map is most appropriate for stars within around 500 pc from the Galactic plane (z pc). As mentioned in J11, it can safely be assumed that stars with z - heights greater than 500 pc are essentially behind the entire dust column and the maps of S98 are more useful for such stars.
2.3 Clean Photometry
Due to partial overlaps between neighboring SDSS images, an object might be observed more than once. The best observation of an object is called PRIMARY detection and the other observations, if any, are assigned as SECONDARY detections. To avoid duplication, we chose only PRIMARY observations by setting the variable “mode” to 1. We also used point-spread function (PSF) magnitudes for SDSS data since these optimally measure the total fluxes for stars in this study.
By equating the flag CLEAN to 1, we selected those stars whose SDSS magnitudes has passed appropriate standards of clean photometry (the flags: NOPROFILE, PEAKCENTER, NOTCHECKED, PSF-FLUX-INTERP, SATURATED, BAD-COUNTS-ERROR, DEBLEND-NOPEAK and INTERP-CENTER are not set). We also set the 2MASS read flag to “222”, blend flag to “111”, and contamination/confusion flag to “000” to select only those stars which have unsaturated, unblended and uncontaminated photometry in the three IR bands (J, H , and K).
2.4 Dwarf-Giant Separation
We selected stars which fall within typical color ranges for late-type K and M dwarfs, and (W11). There possibly may be contamination by giants in any color-selected sample of M dwarfs, however, which needs to be addressed in statistical studies of the Galaxy. Bessell & Brett (1988, hereafter BB88) found in the JHK, there is a clear bifurcation between M giants and M dwarfs, beginning where TiO bands appear or the M-dwarf sequence starts. By applying the NIR color ranges typical of M giants (BB88; C07), we found that around 1% of stars in our SDSS-2MASS sample are giants, consistent with other studies such as Covey et al. (2008, hereafter C08) with less than 2% and W11 with around 0.5% giant contamination.
It should be mentioned that this approach for separating giants from dwarfs is not accurate for K-type stars (BB88) as they overlap in JHK color space. A better way to remove giants employs reduced proper motions of stars as described in M13b. By using a sample of stars with available proper motions, giants could be separated from dwarfs with higher accuracy.
2.5 Photometric Parallax
The distance and z - height of our stars were estimated by means of a photometric parallax technique developed by Bochanski et al. (2010, hereafter B10). More specifically, the absolute magnitude in the band, Mr, of low-mass stars can be obtained from a Mr relation (the first equation of Table 4 in B10) which is valid for the color range . We therefore selected only those stars which fall in this color range.
After meeting all the criteria above, as well as the color cuts applicable to our metallicity calibration outlined in Section 3, a sample of 1,330,179 M dwarfs was selected.
3 METALLICITY CALIBRATION
To calibrate metallicity using photometry, we collected a calibration sample of M dwarfs with reliable metallicity and photometry. Since the dust maps of S98 were used to remove Galactic extinction for our large sample, the metallicity calibrations to be used for this sample must be based on calibrators with photometry corrected in the same way. For this reason, we corrected the photometry of all stars in our calibration sample using these maps111A dust map may make an offset in the extinction value of stars, specifically for each filter band. To minimize this effect on metallicity, the same offset must be included in the extinction of stars in both the calibration sample and large sample. For this reason, the same dust maps were applied for both samples..
There are nearby M dwarfs which are members of binary systems, having FGK-dwarf primaries with metallicities determined through high-resolution spectra. We identified 14 such M dwarfs with unsaturated SDSS and unsaturated 2MASS JHK magnitudes while for most of these stars the photometry in the r, i or z bands are saturated. We used the SDSSPhot Flag to check the saturation status of stars; the magnitude in a SDSS filter band is unsaturated if the SATURATED flag for this band is not set. To be certain of unsaturated JHK photometry, we chose only those stars whose 2MASS read flag is “222”.
In order to add more stars with reliable metallicities to our calibration sample, we refer to the work of Dahab & Strauss222Unpublished undergraduate Honor’s thesis of W.E. Dahab under supervision of M.A. Strauss, Princeton University. (personal communication) who showed that by filtering the saturated objects in SDSS that have certain flags set, the photometry of remaining saturated objects are usable. The stellar locus on a color-color diagram can be identified by the locations at which photometrically clean stars appear. By comparing color-color diagrams of stars with unsaturated and saturated photometry, Dahab & Strauss demonstrated that the saturated PSF magnitudes in the ugri bands for which none of the flags EDGE, INTERP-CENTER and PSF-FLUX-INTERP are set leave the color-color diagrams with almost no oulier. They also pointed out that the g magnitudes of these saturated stars have a minimum of about 13.4 mag and the number of stars fainter than this minimum increases exponentially. This indicates that saturated stars with g 13.4 mag are problematic and must be excluded from photometric studies.
An object which is too close to the edge of an image is flagged EDGE in the SDSS photometry. Among PRIMARY objects, only large extended objects should be flagged EDGE. Therefore, for point sources, there is no need for concern about the PRIMARY objects having the EDGE flag set. As a result, rather reliable photometry is possible after filtering out the saturated objects in the SDSS whose INTERP-CENTER and PSF-FLUX-INTERP flags are set. In this way, we found three M dwarfs in M+FGK CPMSs, which have unsaturated photometry in the JHK bands but whose g magnitudes are saturated while none of the two flags are set. Moreover, the g magnitudes of these three stars are fainter (by around 4 mag) than the lower limit mentioned above, and we thus call them “weakly saturated” magnitudes. According to Dahab & Strauss, we can be certain that these magnitudes are reliable enough for our study.
The sample of M dwarfs in CPMPs now includes 17 (14+3) stars having metallicities determined through high-resolution spectra. Moreover, we found the measeured photometry and metallicity of LHS 3084 reliable and added this to the sample, increasing the number of stars to 18. Although LHS 3084 is not in a CPMP, its metallicity was determined by direct measurements on its high-resolution spectrum, not that of a primary. The astrometry, extinction-corrected photometry and saturation status in the g band for the 18 M dwarfs are shown in Table 1. The spectral type of these M dwarfs as well as the spectral type and metallicity of the primaries are given in Table 2. This Table also includes the references from which the metallicities and spectral types are taken.
The 18 M dwarfs described above form the foundation of our metallicity calibration. We investigated the relation between the metallicities and all possible colors involving g, J, H and K magnitudes for these stars. It was found that the JK color is the best metallicity indicator which is in agreement with the previous studies of J12 and N14. There are deep potassium (K) and iron hydride (FeH) absorption features as well as dozens of shallower metal lines in the J band spectra of M dwarfs. Consequently (as J12 suggested), M dwarfs with higher metallicity have preferentially suppressed J band fluxes as compared to K-band spectra where there are only a few relatively shallow Na and Ca lines as the prominent absorption features. This causes the color of the metal-rich M dwarfs to be redder.
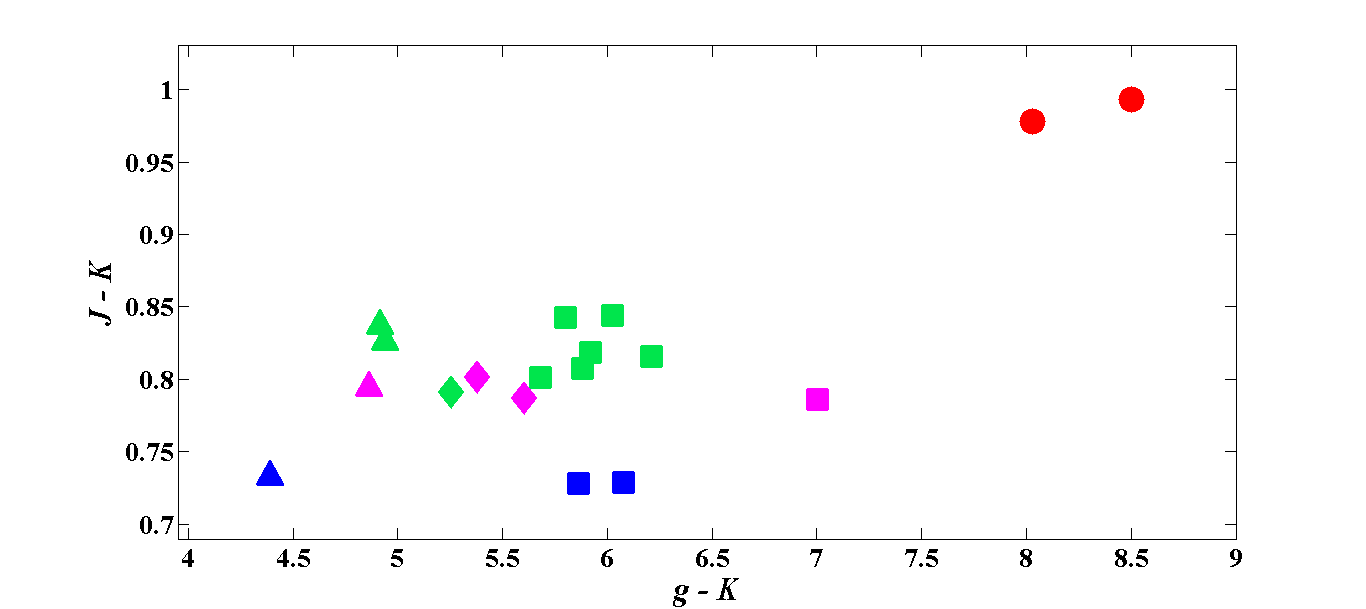
In addition, we found that among all possible color-color diagrams, the - diagram can reliably separate metal-poor from metal-rich M dwarfs. Figure 1 shows such a diagram for the 18 M dwarfs. The metallicity values are coded by colors and the spectral types are coded by symbols provided in the caption. Overall, for a given spectral type range, metal-poor stars have bluer than metal-rich ones, and clearly the color is a better diagnostic for metallicity than . It can also be seen that the color is a better indicator for spectral type than , and for a given metallicity range, earlier-type M dwarfs have bluer than stars of later spectral type. The location of a star in a color-color diagram theoretically depends on its fundamental properties such as metallicity, spectral type (or temperature) and surface gravity333These are the three main properties which play important roles in constructing model atmospheres and synthetic spectra of stars.. However, as an approximation, we assumed is constant for all M dwarfs ( 5) and has the same effect on the colors of these dwarf stars. Generally, different colors have different sensitivities to metallicity and spectral type. In our case, while the could be a measure of metallicity, the is not sensitive enough to metallicity to separate metal-rich from metal-poor M dwarfs adequately. On the other hand, the color can distinguish different spectral types more effectively than the color.
Although the 18 M dwarfs provided us with a sample of robust calibrators, these stars by themselves are insufficient for covering the entire - plane, however, as evidenced by gaps, particularly for values between 7 and 8. If we could add more dwarfs with trustworthy photometry and metallicity, there would be the same trends as those of the 18 M dwarfs: for a given spectral type range, more metal-poor stars should have smaller values of , and for a given metallicity range, earlier-type stars should have smaller values of 444Similar to this can, to some extent, be perceived from the work of N14 (see Figure 21 of their paper) on the - diagram.. This defines a rule for selecting the rest of stars in our calibration sample. we collected 55 early-to-mid-type M dwarfs and late-type K dwarfs with spectroscopically determined metallicities from moderate-resolution spectra. Their selection initially was by eye, based on their locations on the - diagram with respect to the original 18 M dwarfs. We chose those dwarfs which approximately followed the rule described above and this enabled us to exclude some outliers from the sample in the first step of the selection. Assuming accurate photometry, large uncertainties in metallicity and spectral type could show a star in a metallicity-spectral type category different from its real one, causing it to significantly deviate from the rule.
We then obtained the best fit of a low-order polynomial between metallicity and and colors for the whole sample (18+55=73 stars) as follows:
| (1) |
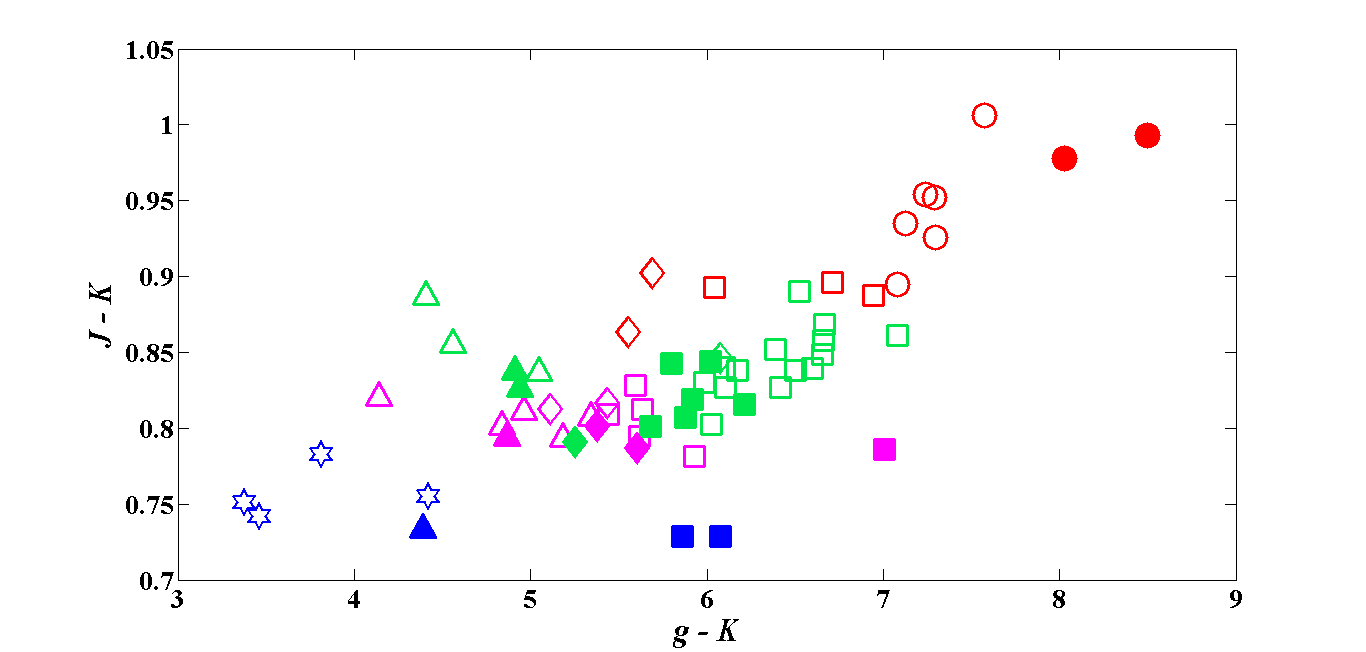
where are constant coefficients. This relation is of the same order (second order) as that of J12 who used an optical-NIR calibration with a filter set similar to ours. The only difference is that we employed the magnitude instead of the magnitude which was used in the calibration of J12. We rejected 6 outliers for lying more than 2.5-sigma from the relation, leaving a final calibration sample of 67 stars. The astrometry, photometry, saturation status in the g band, spectral type, metallicity and related references for the rest of our calibrators are listed in Tables 3 and 4. The - color-color diagram of the whole sample is presented in Figure 2.
The coefficients of the final best fit for the 68 dwarfs in the calibration sample are:
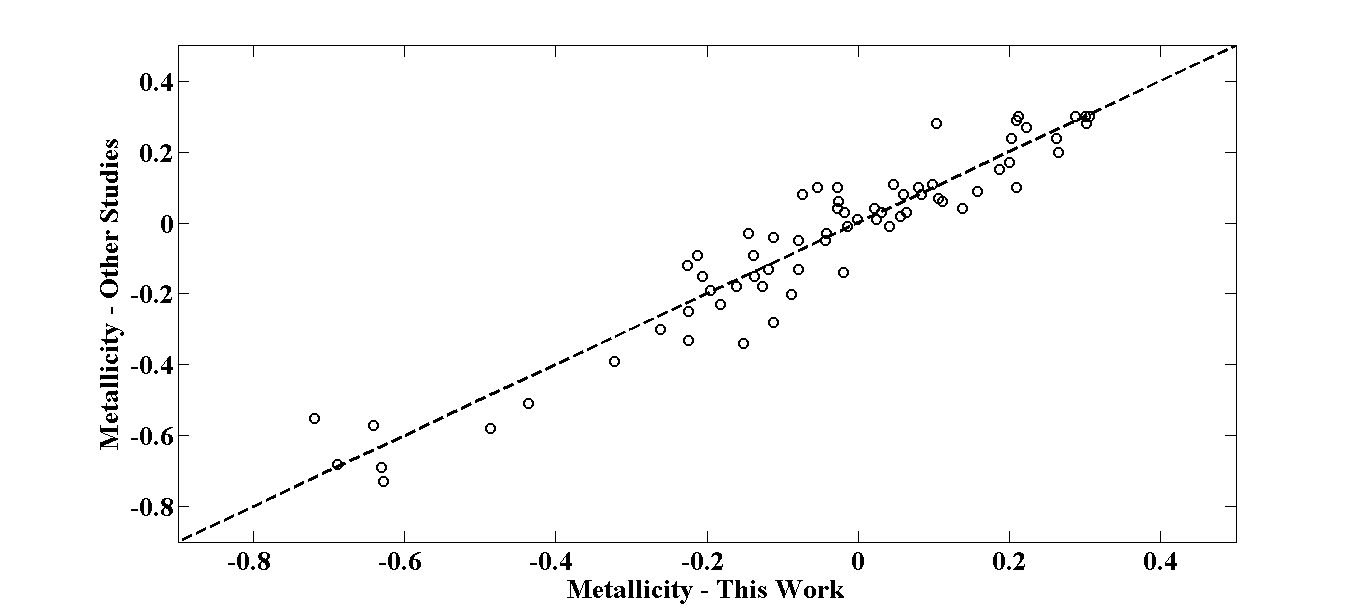
with an RMSE 0.077 dex and 0.90 (which are an improvement upon the values for the sample of the original 18 M dwarfs: RMSE=0.090 dex and 0.086), yielding elliptical isometallicity contours. It should be remarked that this metallicity calibration is applicable for stars of spectral types between K6 and M6.5 with [Fe/H] +0.3 dex, 3.37 8.46 and 0.71 1.01. Figure 3 shows a comparison between the values of metallicity obtained by Equation (1) with coefficients above and those taken from other studies for the same 67 calibrators. We should mention that to have a more accurate metallicity calibration, a careful investigation of surface gravity is also required.
In the following sections, this metallicity calibration is applied to our large sample and the resulting metallicity distribution is studied in more detail.
4 z - HEIGHT DISTRIBUTION
To study the relation between metallicity and z - height, it is necessary to estimate the distance of stars in our sample. We applied Equation (1) to the sample of 1,330,179 M dwarfs described in Section 2, accepting only those stars with the metallicity range within which this equation is valid. This left a sample of 1,298,972 stars: only % of stars have metallicities outside this range; the rest satisfy all requirements outlined in Section 2. We also limited our study to stars with z 2000 pc, leading to a final sample of 1,298,721 M dwarfs (hereafter, “SampleMetal”, or briefly “SM”), having a median extinction in the r band of mag.
We estimated the z - height of stars in SM using the photometric parallax described above (Subsection 2.5). It should be remarked that these z - heights are the vertical distances from the plane passing through the Sun. Since all the selected M dwarfs lie above this plane (), we added the z - height of the Sun, z☼ = 20 pc (Juri et al. 2008), to those derived from the photometric parallax to obtain the distances from the central plane of the disk.
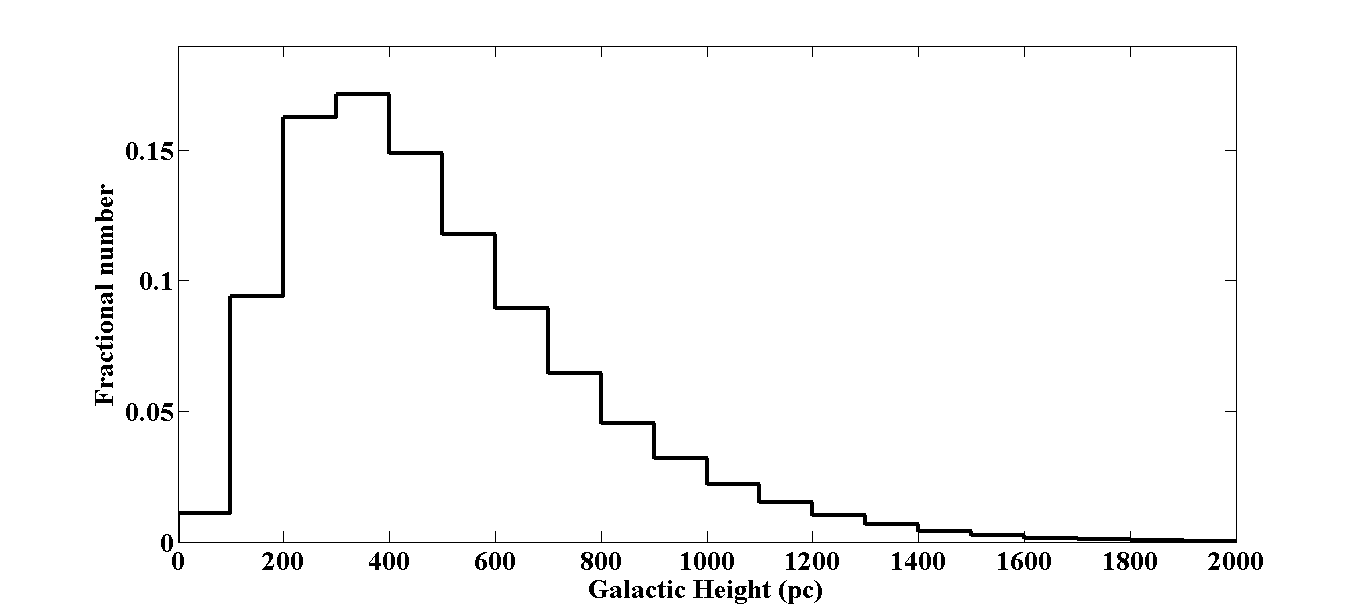
The z - height distribution of the sample (Figure 4) shows a peak at z 350 pc, indicating that around 94% of the stars are within the Galactic thin disk, i.e., z pc (Gilmore & Reid 1983).
5 METALLICITY DISTRIBUTION
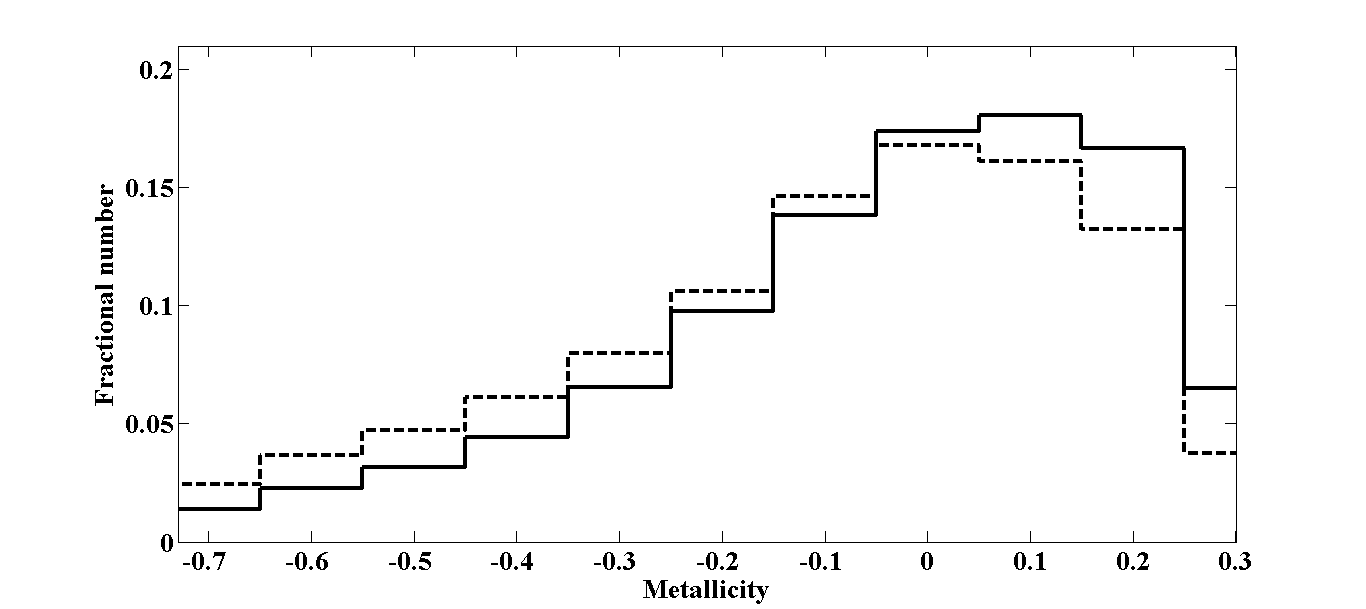
The metallicity distribution of stars from SM having [Fe/H] is shown as a dashed histogram in Figure 5. As mentioned above, only those stars with were selected. This means that stars outside an imaginary cone, perpendicular to the Galactic plane with an opening angle of and apex at Earth, were excluded. As a result, stars with higher vertical distances are distributed through larger volumes of space. In order to remove the effect of this bias on metallicity distribution, it is necessary to perform a volume correction. To this end, the stars in SM were divided into 20 bins of 100 pc in z - height and the weighting factor proportional to the inverse of the volume of each bin was calculated. The metallicity distributions of these bins were obtained separately and multiplied by the corresponding weighting factors. All these weighted distributions were then added together as the total volume-corrected distribution, illustrated in Figure 5 (the solid histogram). This distribution shows a maximum at around +0.1 dex, and a mean metallicity [Fe/H] dex. Note that this mean metallicity is not expected to represent the true mean value of the local Galactic disk since those stars with metallicity outside the metallicity range of our calibration were removed from the sample. In order to obtain a more meaningful mean metallicity, a calibration valid over a wider range of metallicity is necessary.
5.1 Metallicity and z - height Relation
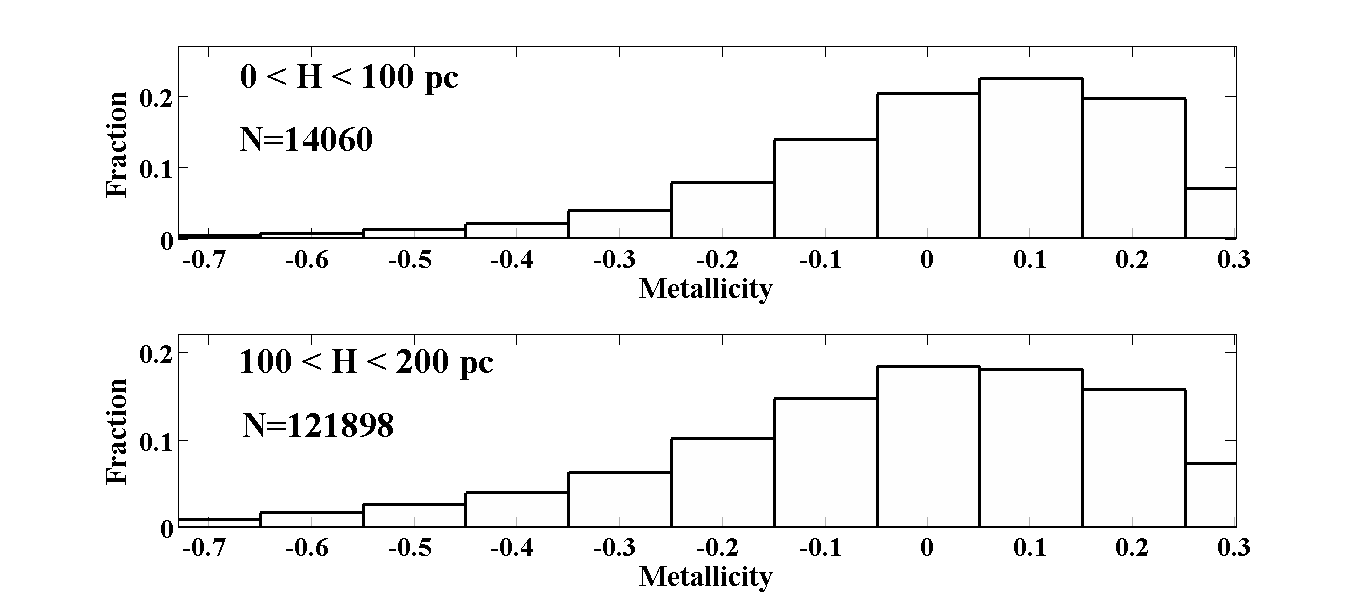
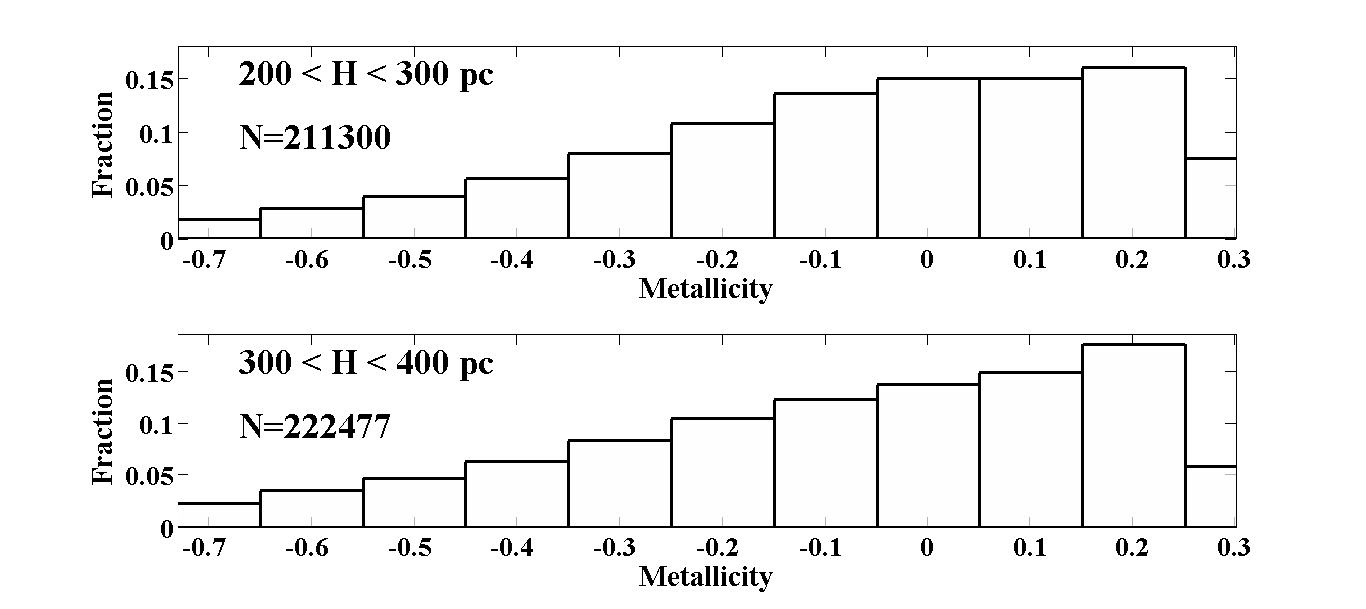
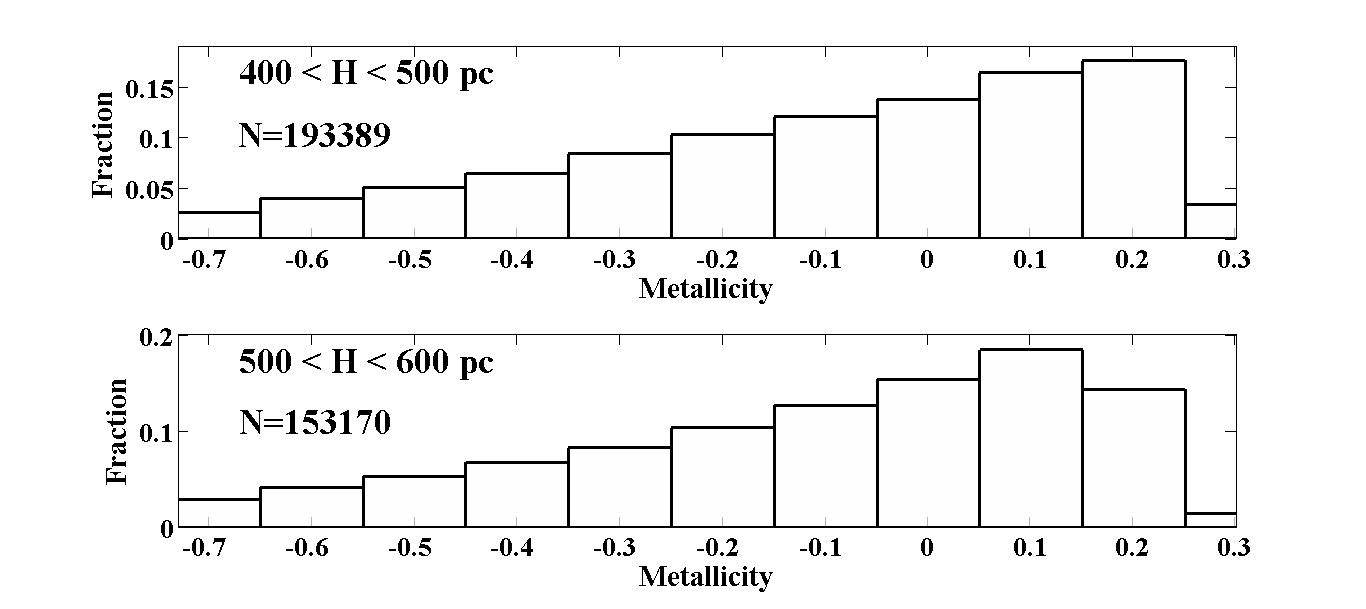
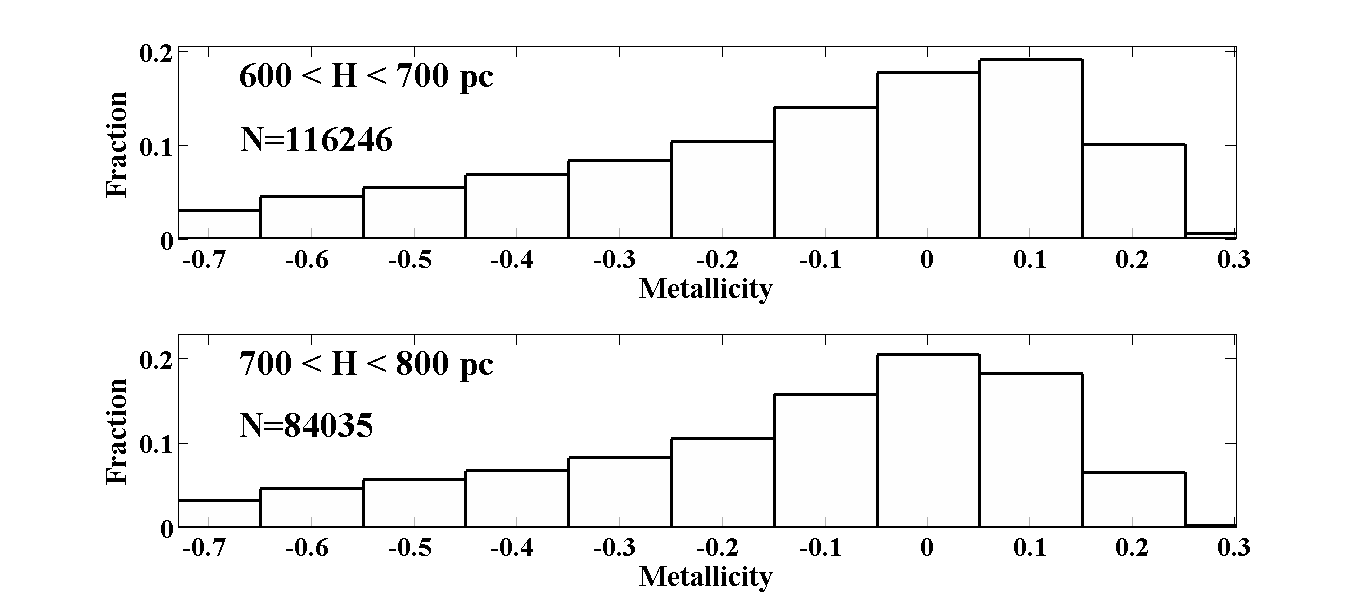
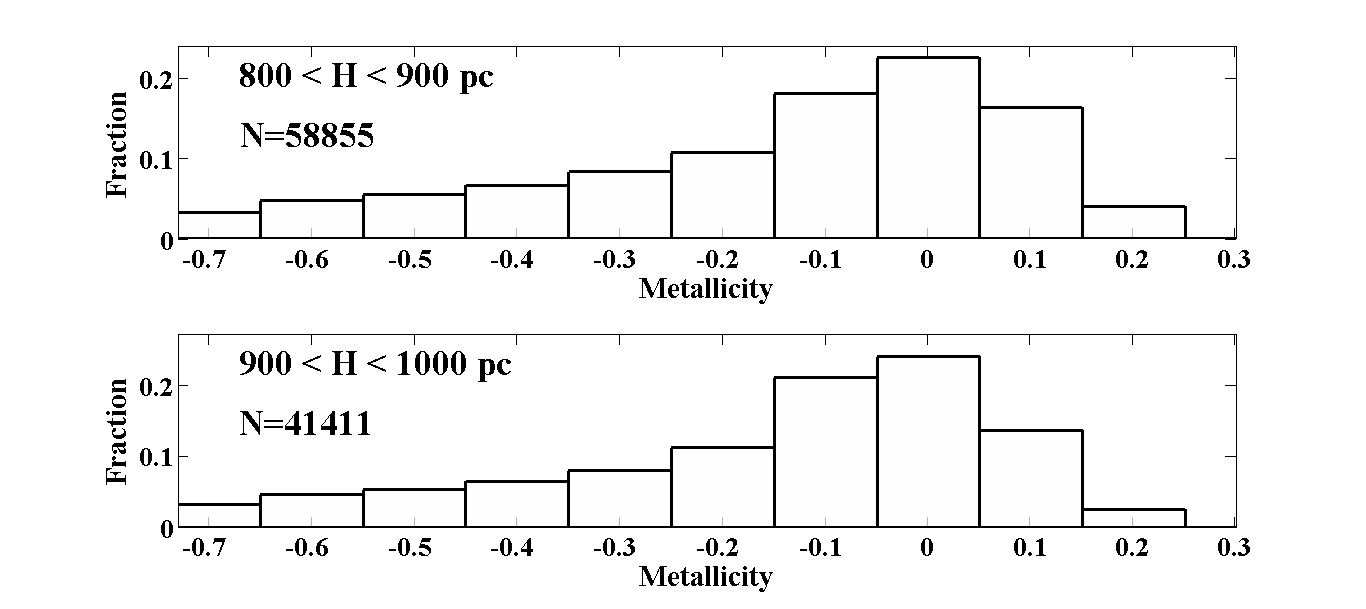
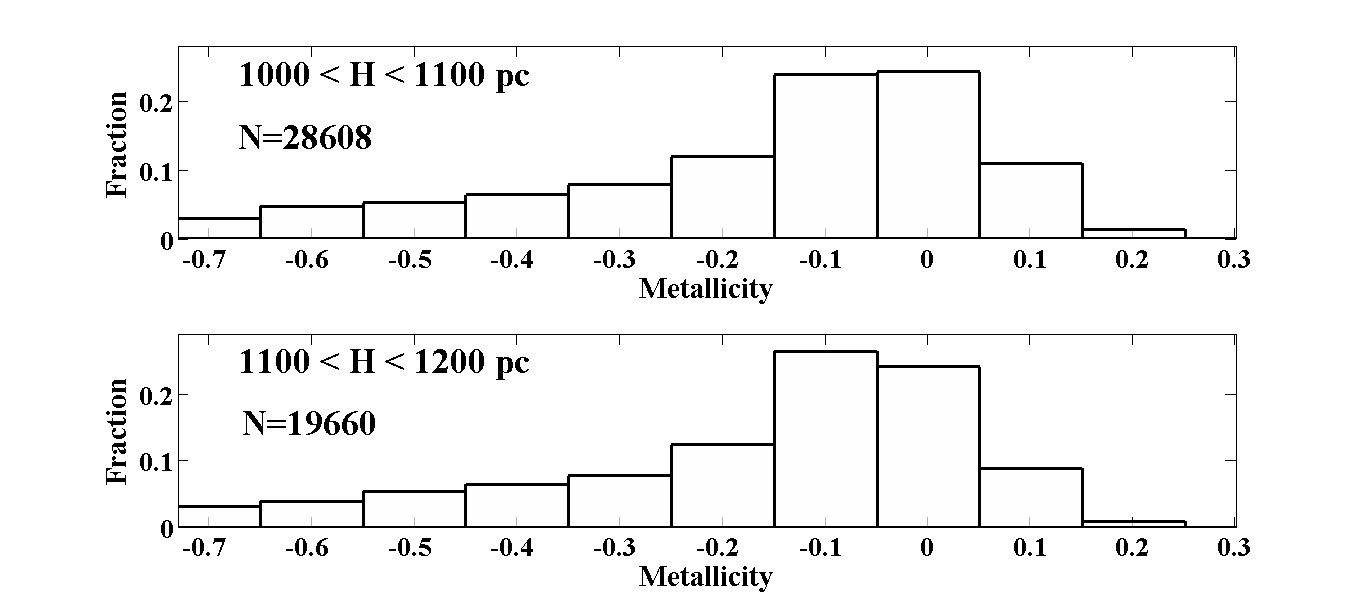
The relation between metallicity and distance z above the Galactic plane can be investigated by determining the metallicity distribution of stars as a function of z - height. We divided a subsample of our stars with z 1200 pc into 12 bins of equal z = 100 pc. The metallicity distribution associated with each bin is shown in Figures 6 and 7. There is a clear shift towards lower metallicities as z - height increases.; the fraction of metal-rich stars slowly decrease and the distributions become more metal-poor with increasing height. The mean metallicity decreases (by around 0.19 dex) from 0 to 1200 pc which is consistent with the age-metallicity-height relation. Studies of Galactic evolution have demonstrated that stars which formed at earlier times in the Galaxy’s history generally have lower metallicities in general and are, on average, farther from the Galactic plane. Stellar systems are formed from interstellar gas and, at the end of their lifetimes, they may return a substantial fraction of their initial masses enriched with metals to the interstellar medium. As a result, succeeding generations of stars become more metal-rich than their predecessors, leading to an age-metallicity relation. The pioneering work on this was done by Twarog (1980a, 1980b) who derived the age-metallicity relation for the disk in the neighborhood of the sun using a large sample of southern F dwarfs. They found that the mean metallicity of the Galactic disk increased by about a factor of five between 12 and 5 billion years ago and has changed only slightly since then. A recent evidence of this kind was offered by Casagrande et al. (2011, hereafter C11) who determined the metallicity distributions of three samples of solar-type stars with different ranges of age (Figure 16 of their paper). They showed that young stars (ages Gyr) have a quite narrow distribution around higher values of metallicity, whereas intermediate-age (between 1 and 5 Gyr) and old-age ( Gyr) stars present broader distributions, significantly extending to lower metallicities.
In addition to the age-metallicity relation, there is also a relation between age and velocity dispersion. Observations have demonstrated that old stellar populations in the disk have larger velocity dispersions. Based on the sample of Twarog above, Carlberg et al. (1985) examined the age-velocity dispersion relation for stars in the solar neighborhood. They found an increase in velocity dispersion to a maximum at about 6 Gyr, thereafter, the trend remained roughly constant555This behavior is consistent with a simple model for the local-disk formation and evolution in which growth occurs at a uniform rate with no initial disk, and the random velocities of stars are increased by a mechanism which depends on the total surface density of the disk, such as spiral waves.. The term “dynamical heating” is commonly applied to all processes that cause an increase in velocity dispersion with age. Different mechanisms are responsible for vertical dynamical heating (e.g., Nordström 2008). Whatever the mechanism(s), stars dissipate from the Galactic plane, increasing their vertical distance from the plane in the course of time. One therefore expects that older, more dynamically heated stars should be found, on average, at larger z - heights than the younger stars. As a consequence, stars farther from the Galactic plane should be, on average, more metal-poor than those closer to the plane.
Using a metal-sensitive ratio, (CaH2 + CaH3)/TiO5, from Lépine et al. 2003 as a proxy for M-dwarf metallicity, West et al. (2008) demonstrated a decrease in metallicity as a function of z - height (up to 1000 pc) which implies that stars more distant from the Galactic plane have lower metallicities. In a simulation by West et al. (2006; 2008), a simple one-dimensional model of the thin disk was applied to investigate the vertical motions and positions of M dwarfs over the Galaxy’s lifetime. The model also showed a decrease in activity fractions (as traced by H emission) as a function of z - height for all M-dwarf spectral types, suggesting a decline in the magnetic activity of older M dwarfs. All results from this 1D dynamical simulation are consistent with observed activity and velocity trends.
5.2 Comparison With Previous Studies
Figure 8 indicates a comparison between the metallicity distribution (volume-corrected) from this work (solid line) and that from WW12 who fobtained the metallicity distribution of 4141 M dwarfs in the spectroscopic SDSS catalog (dashed line). As shown in the Figure, there is a slight offset between the peaks of the two M-dwarf distributions. It appears, however, that our sample includes a larger fraction of metal-poor stars than that of WW12. Moreover, the distribution of WW12 has a steeper slope towards lower metallicities than ours.
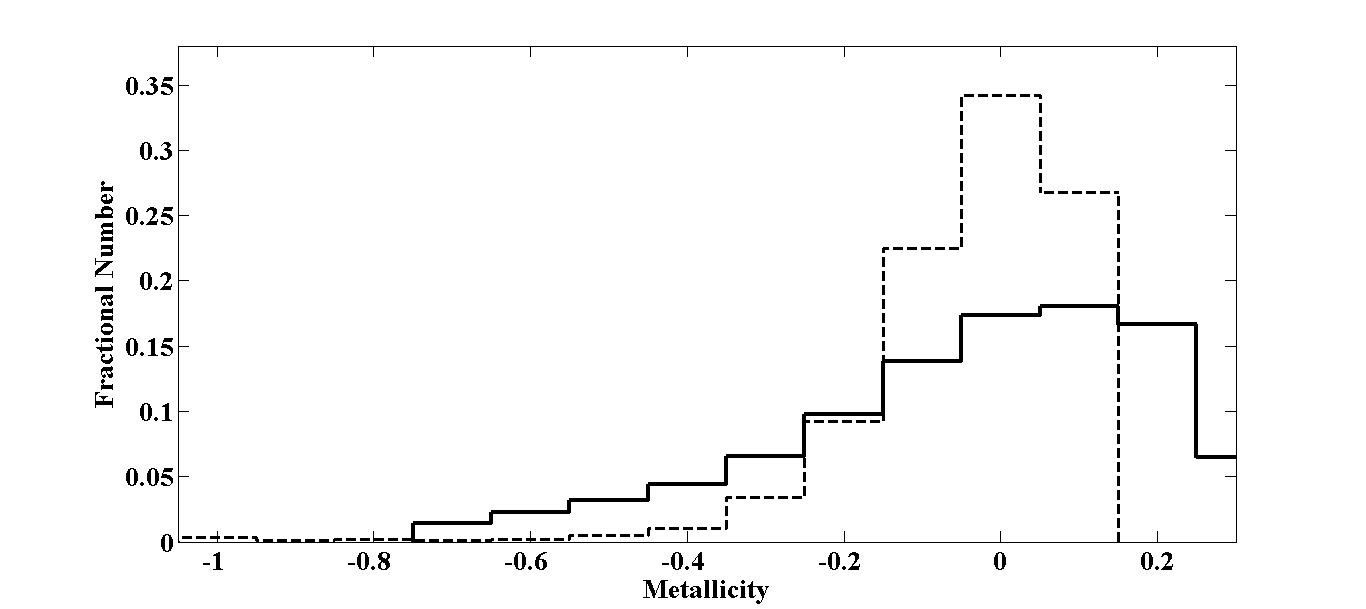
Possible reasons for the discrepancy between these two distributions are as follows. First, the distributions were obtained by different methods. To estimate the metallicity of their sample, WW12 derived a linear relation (Equation (1) in their paper) between [Fe/H] and the metallicity-sensitive parameter defined in L07. This relation was applicable to M dwarfs with 3500 T 4000 K and [Fe/H] +0.05 dex. Dhital et al. (2012) recalibrated the definition of and showed that this new could be a significantly better indicator of metallicity for early M-type dwarfs (between M0 and M3). M13a tested the parameter defined in L07 using their own sample and found that it is not only sensitive to metallicity (and temperature) but also to some other stellar characteristics such as activity and surface gravity. This could lead to an incorrect identification of some metal-poor stars as near-solar metallicity stars. They pointed out that although correlates well with [Fe/H] for supersolar metallicities, it does not always diagnose metal-poor M dwarfs correctly and may identify such stars as more metal-rich than they are. Further, Lépine et al. (2013) remarked that the parameter defined in L07 overestimated the metallicities of early-type M dwarfs while the parameter defined in Dhital et al. (2012) underestimated the metallicities of these stars, leading them to the redefinition of the index . Due to the overestimation of the metallicity of metal-poor M dwarfs by the parameter from L07, we could expect a bias toward metal-rich stars in the metallicity distribution of WW12, as seen in Figure 8.
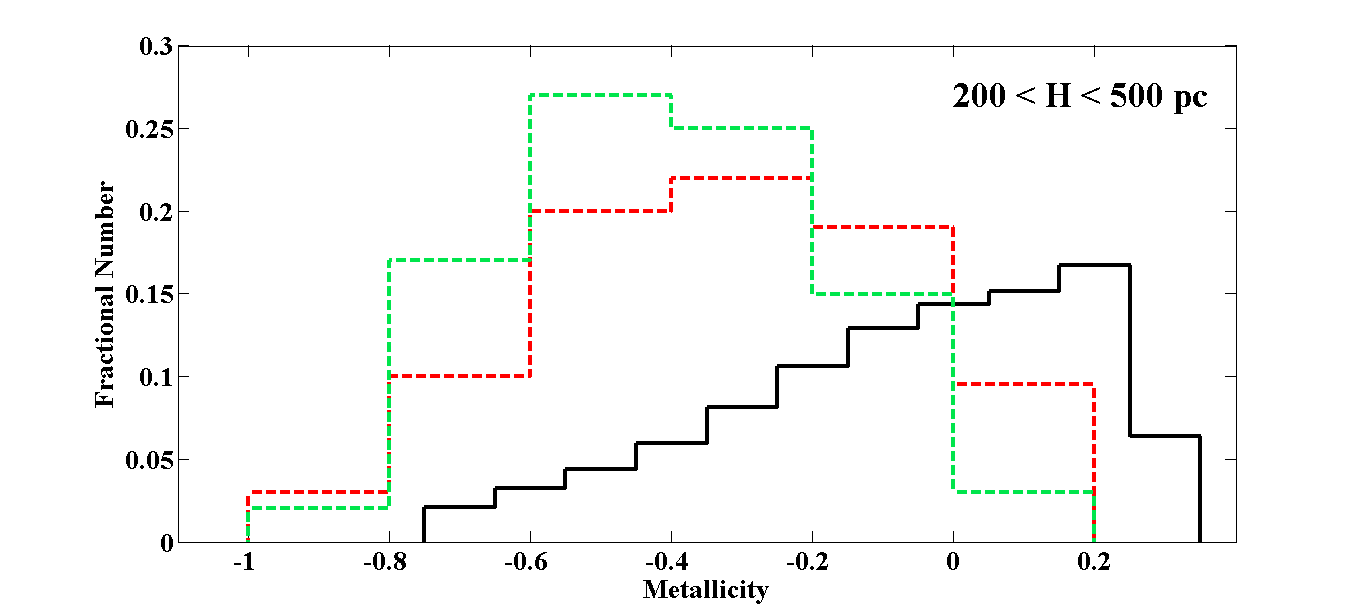
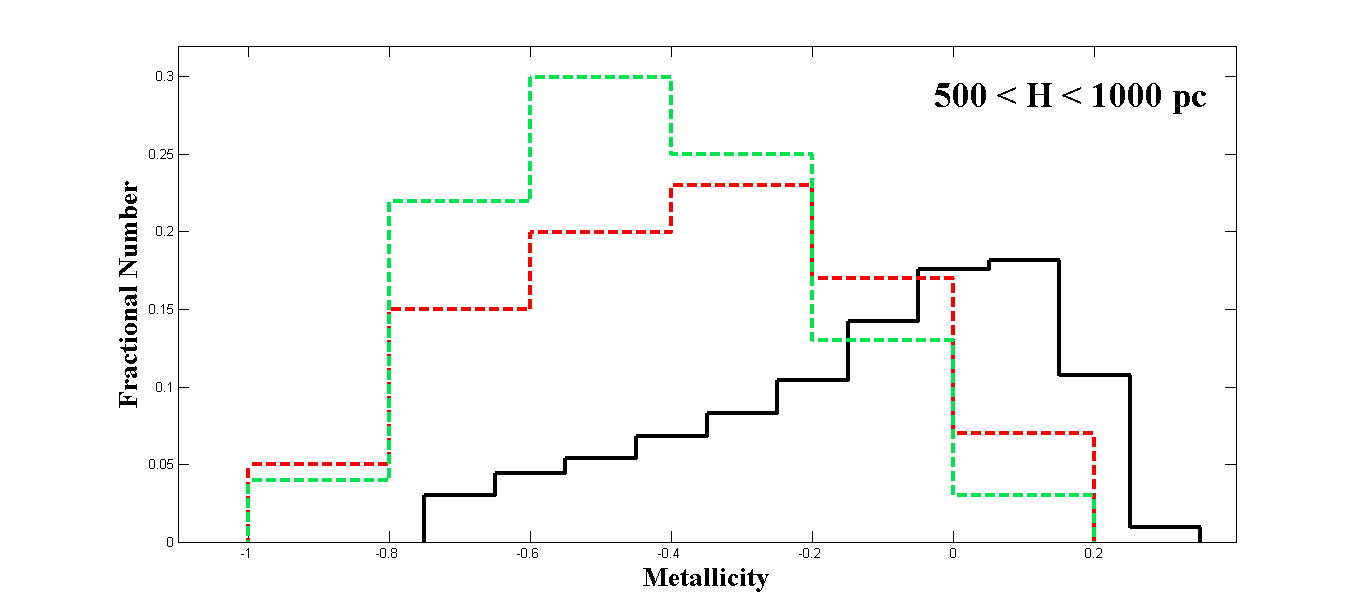
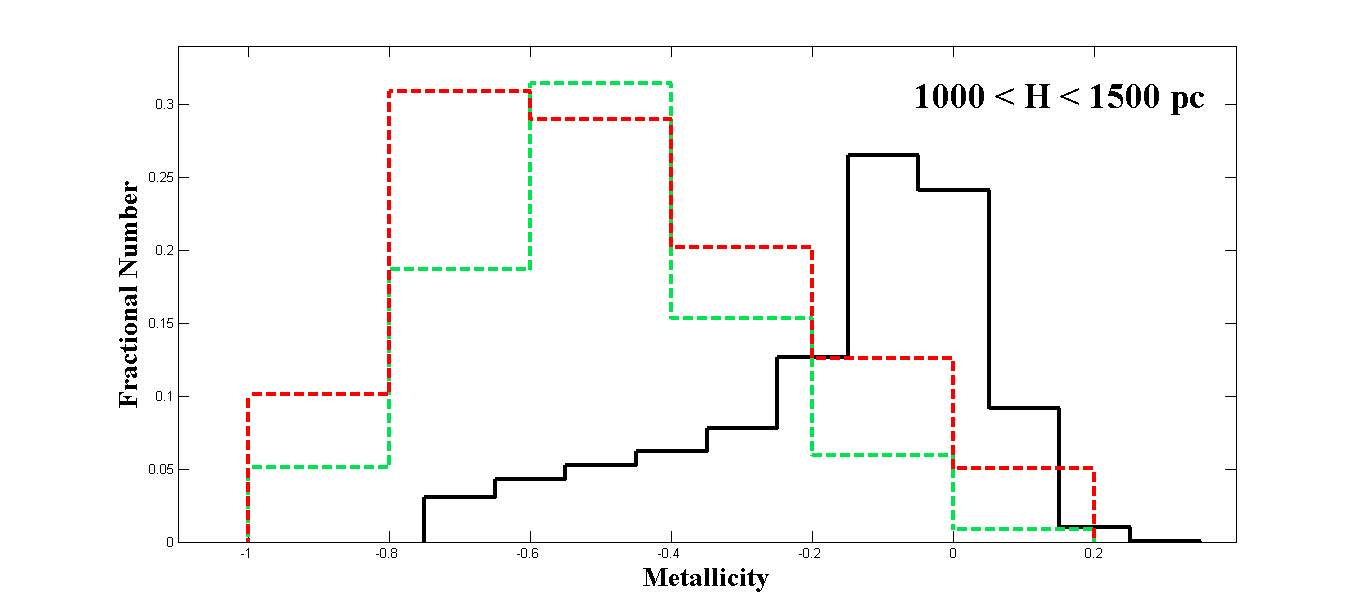
Second, there is an important difference between our sample and that of WW12. As shown in Section 4, our sample is taken mostly from the Galactic thin disk, and a large fraction of its stars are in the solar neighborhood with z pc. On the other hand, a significant portion of stars in the sample of WW12 lies outside the thin disk and is not representative of the local neighborhood: the WW12’s sample is expected to have more low-metallicity stars than ours, but that is not what is seen in Figure 7.
It should be noted that the distribution of WW12 in Figure 8 is volume-corrected due to the metallicity-dependent volume coverage. It should be mentioned that this is different from the volume correction (owing to only volume effects) which we made above. WW12 argued that since low-metallicity main sequence stars (subdwarfs) are less luminous than higher-metallicity stars of the same temperature or spectral type, higher metallicity stars should be overrepresented in magnitude-limited samples. In other words, metal-poor M dwarfs must be, on average, closer than the metal-rich ones in such samples. Using a sample of stars from Woolf et al. (2009) for which parallax data were available, WW12 determined the luminosity variation with metallicity for M dwarfs in the temperature range 3500 T 4000 K. Based on this variation, they calculated volume-correction factors for different values of [Fe/H] (Table 1 in their paper) and implemented a volume correction for their metallicity distribution. Accordingly, to have a more reliable metallicity distribution, we need to determine the metallicity-dependent correction factors appropriate to our magnitude-limited sample. Nevertheless, we would not expect these corrections to change the location of the peak and the slope of the low-metallicity tail significantly (Figure 2 of WW12). Therefore, the uncorrected metallicity distribution can give us, to some extent, important information about the local Galactic disk.
Figure 9 compares our M-dwarf metallicity distributions with those of G and K dwarfs in the SEGUE survey from Schlesinger et al. (2012, hereafter S12) for three different Galactic height ranges. As noted in S12, the G- and K- dwarf metallicity distributions have more metal-poor stars as height increases. It can be seen that the M-dwarf distribution exhibits the same trend, which implies a similar star formation history as G and K dwarfs. There is also a discrepancy between the distributions of different spectral types; the cooler spectral type, the more metal rich the distribution includes.
JA09 argued that the M and FGK dwarfs in the local Galactic thin disk should have the same metallicity distributions and that there should not be a systematic offset between M- and FGK-dwarf metallicity distributions. They related the offset between the metallicity distributions of M dwarfs and FGK dwarfs in some published papers to the reliability of the methods by which the metallicity of M dwarfs were determined. Accordingly, they adopted the mean M dwarf metallicity of their sample to be the same as the mean metallicity of a volume-limited sample of FGK dwarfs ( dex) from VF05. SL10 improved upon JA09 and remarked that for a fair comparison between samples of M dwarfs and FGK dwarfs in the local Galactic disk, the samples must not only be volume corrected but also have equivalent kinematics. By selecting two volume-completed, kinematically-matched samples of FG and M dwarfs, SL10 derived a mean metallicity of around dex for M dwarfs in the solar neighborhood. It should be mentioned that we compared our distribution to those of previous works without any consideration of kinematics of the samples under study. To make proper comparisons between the metallicity distributions of dwarf stars with different spectral types, volume-corrected samples with equivalent kinematics have to be considered.
On the other hand, the offset between FGK- and M-dwarf distributions might be explained in other ways. For example, similar to S12, one may expect that since M dwarfs have longer lifetimes than G and K dwarfs, there is a possibility that more metal-rich G and K dwarfs have evolved off the main sequence, causing a metallicity bias in G- and K-dwarf distributions against high-metallicity values which has not happened for cooler M dwarfs. Furthermore, if more lower-mass dwarfs are born than higher-mass stars as the metallicity of interstellar gas increases, there should be fewer metal-poor M dwarfs than G and K dwarfs.
While there have been discrepancies between the metallicity distributions of different spectral types from various studies and some effort has been made to explain them, we can mention the work of C11 whose metallicity distribution of solar type stars (obtained by a photometric method) has a peak around [Fe/H] 0, close to those of the M-dwarf distributions shown in Figure 8. This is in agreement with the statement of JA09 who pointed out there should not be any offset of different metallicity distributions. To reach an accurate conclusion, more careful investigations are needed.
6 THE Galactic Chemical Evolution (GCE) MODELS
6.1 The Simple Closed Box Model (SCBM)
The simplest model of GCE, the SCBM, is based on three assumptions:
-
1.
The system is isolated and there is no mass inflow or outflow,
-
2.
There are two types of stars; those that live forever and those that die right after their birth, indicating instantaneous recycling,
-
3.
The system initially starts off with entirely metal-free gas and eventually ends up full of stars.
Studies of the chemical evolution of local G dwarfs (e.g., van den Bergh 1962; Pagel & Patchett 1975; Wyse & Gilmore 1995) have shown the existence of the “G dwarf problem”, which indicates that the SCBM predicts many more low metallicity G dwarfs than are observed. Similarly, the “K-dwarf problem”, a paucity of metal-poor K dwarfs relative to the prediction of the SCBM, has also been observed (e.g., Casuso & Beckman 2004, hereafter CB04). WW12 were the first to recognize the “M-dwarf problem” (as shown in Figure 2 of their paper); the number of low metallicity M dwarfs is insufficient to match the SCBM, as G and K dwarfs.
To test the SCBM, we compare our metallicity distribution with that predicted by the model. It can be shown (e.g., Pagel 2009 hereafter P09; Mo et al. 2010) that the mass in stars () with metallicities between Z and Z + dZ is given by
| (2) |
where p is the metal yield, defined as the mass of newly synthesized and ejected metals per unit mass permanently locked up in the stars. Considering [Fe/H] [M/H] log(), the mass of stars with metal abundances between [Fe/H] and [Fe/H]+d[Fe/H] can be estimated as
| (3) |
which can be rewritten as
| (4) |
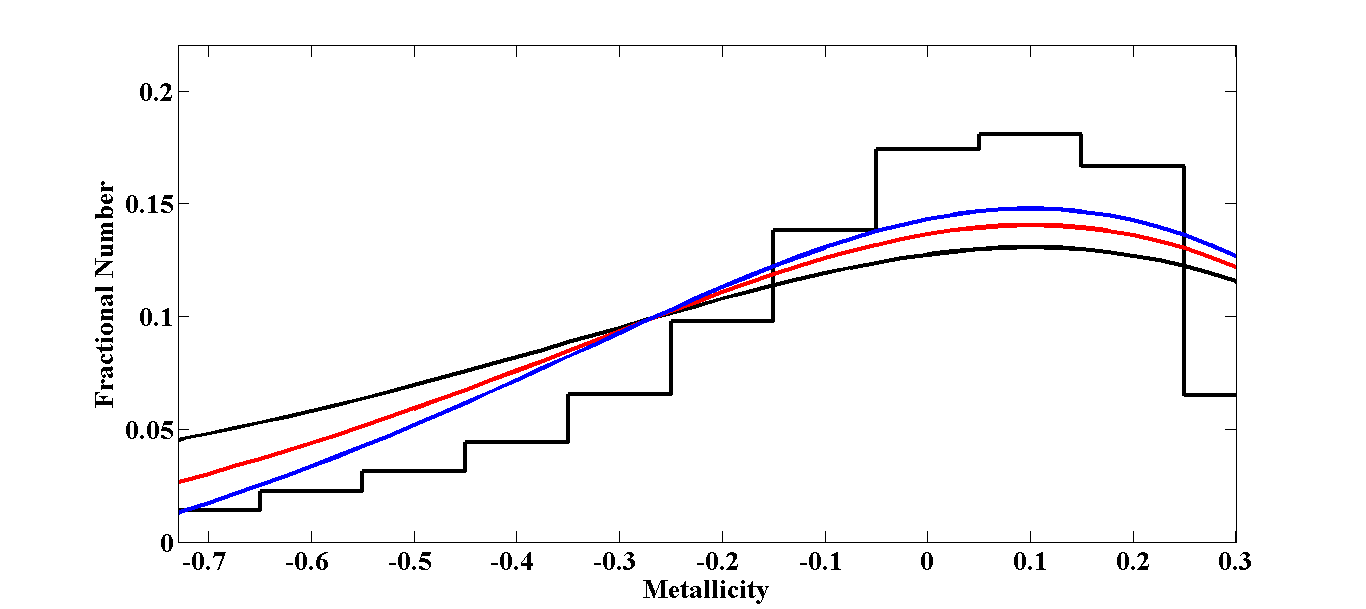
The proportionality (4) is the metallicity distribution function predicted by the SCBM. The histogram in Figure 10 depicts our volume-corrected metallicity distribution. The black curve in this Figure shows the normalized distribution from the SCBM with p=0.025 which has a maximum at the same metallicity ([Fe/H]=+0.1 dex) as our histogram.
Obviously, the SCBM cannot reproduce the low metallicity tail of the distribution, suggesting the M dwarf Problem. It is clear that one or more of the assumptions in the SCBM, such as instantaneous recycling, the system’s isolation without gas flow or the assumption of a zero initial metallicity are unrealistic. The G and K dwarf problems have motivated a generation of more complicated GCE models. We will examine a few such models and test them using our M-dwarf metallicity distribution in the following subsections.
6.2 The SCBM With Pre-enrichment
One of the solutions proposed for the G dwarf problem is to assume an initial metallicity of (Samland & Hensler 1996). If, for some reason, there is a finite initial abundance of order [Fe/H] dex, a good fit to the distribution is obtained at the expense of rejecting some stars with low metallicity. In this case, all metallicities (Z) in Equation (4) are replaced by yielding:
| (5) |
The normalized distributions calculated by the SCBM with two selected initial metal abundances of = 0.002 (the red curve) and 0.003 (the blue curve) are shown in Figure 10. We set the yields for the red and blue curves to p = 0.023 and 0.022, respectively, to have a maximum at [Fe/H]=+0.1 (the same as our distribution). As can be seen, the distributions of the SCBM with a pre-enrichment give a better fit to our measured metallicity distribution than that without any initial abundances (the black curve).
There have been several hypotheses to justify such a pre-enrichment. For example, this might arise from prior star formation activity in the halo (Ostriker & Thuan 1975) or the bulge. It was argued (Prantzos 2007), however, that while the Galactic halo reached a maximum metallicity of Z 0.002 ( 0.1 ), its mean metallicity is Z 0.0006 ( 0.03 ) and its total mass (2 ) is 20 times less than that of the disk (4.5 ). Köppen & Arimoto (1990) suggested a model in which the bulge evolves with a large yield (p 0.034) and ends star formation by ejecting 1/10 of its mass as highly enriched gas with an abundance of 0.05 ( 2.5 ) in a terminal wind which is captured by the proto-disk. Assuming that the proto-disk has a mass equal to that of the bulge, this mass transfer results in an initial disk abundance of 0.005 ( 0.25 ) after mixing. Such a model is consistent with the metallicity distribution functions of both the bulge and disk (for more discussions, see P09).
On the other hand, the p values derived from these models above are larger than the estimated value in the solar neighborhood: 0.7 = 0.014 (P09). We therefore need to establish models which not only match the metallicity distributions of the solar neighborhood but also give yields more consistent with observational data.
6.3 Inflow Models With Declining Rates
In more realistic models, the disk does not evolve as a closed box and gas inflow or outflow (or both) is present. Inflow models have been attractive because of their capacity to reduce the number of low-metallicity stars born at early times, providing an elegant solution of the G dwarf problem, especially in view of the fact that gas accretion is expected to be a common phenomenon in the Universe (e.g., Prantzos 2007). There is indirect observational evidence for gas infall into the Galactic disk. The star-formation rate in the disk is about a few solar masses per year, while the total gas mass therein is . Thus, if there were no accretion of new material, our disk would run out of gas in a fraction of the Hubble time (Mo et al. 2010).
The inflowing gas could originate from the gaseous halo, the bulge, the outer parts of the disk, or the accretion of small satellite galaxies. The disk itself may be considered as having formed completely from such inflowing gas or as having an initial mass (usually small compared to its final mass) with or without metals. Still more physically realistic models assume gas inflow with variable rates, and those with declining rates appear especially to provide in better agreement with recent observations (P09). In this section, two inflow models will be considered and the resulting metallicity distributions will be compared with that from this study.
6.3.1 The Exponential Inflow Model (EIM)
Some studies have shown that an exponentially decreasing infall rate with a long characteristic time scale 7 Gyr can provide a reasonably good fit to the data. For example, CB04 demonstrated that such a model seems to reproduced the observed metallicity distributions of G and K dwarfs in the disk.
For simplicity, some inflow models are based on a specific star formation rate given by
| (6) |
where t is time, (t) is the gas mass as a function of time and is a constant. By defining a time-like variable u by
| (7) |
Sommer-Larsen (1991) constructed a dynamical model with the assumption
| (8) |
in which F is the accretion rate of material from outside the system and A is a constant. If the initial mass and metallicity of the system are assumed to be zero and if the inflow gas has no metal content ( = 0) then, as u becomes very large, the expression for Z and /dlog(Z) can simply be written as (P09):
| (9) |
| (10) |
The expression on the right side of the proportionality (10) is essentially the square of that corresponding to the SCBM. The normalized distribution from the EIM for p = 0.025, which peaks at [Fe/H] = +0.1, is shown in Figure 11 (the red curve); it presents the metallicity distributions from this work (the histogram) and from the SCBM (the black curve) as well. Evidently, the EIM predicts fewer metal-poor M dwarfs and a steeper slope in the low metallicity tail than the SCBM, and is therefore in better agreement with the data. There is, however, an inconsistency between the value of p from this model and , which is somewhat problematic. It should be remarked here that if our distribution had a peak at a lower metallicity, say, [Fe/H] dex, the model would result in a more reasonable yield. Accordingly, the accuracy of the metallicity distribution is critical for a comparison of GCE models.
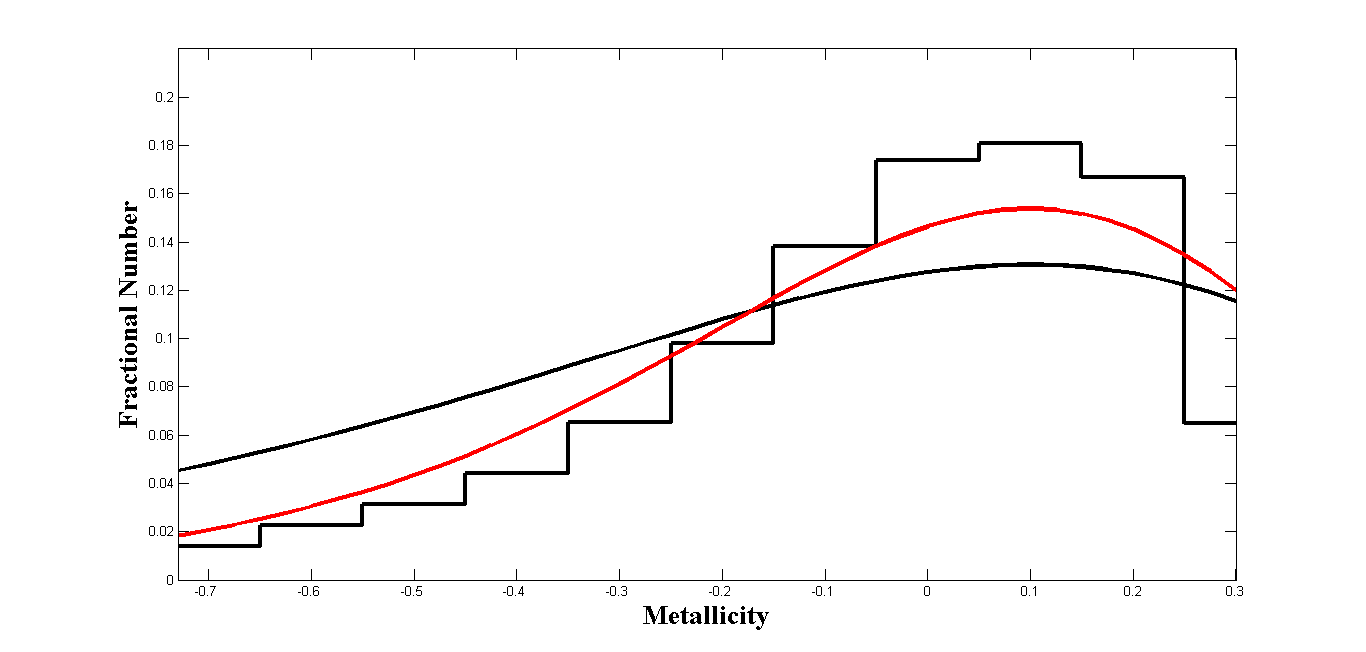
6.3.2 Clayton’s Models
Clayton (1985; 1987; 1988) has derived a series of models in which the inflow rate is parameterized by
| (11) |
where k is an integer and (or ) is arbitrary. By considering Equations (6) and (7), and assuming , expressions for Z and in terms of u can be derived (Equations (8.38) and (8.39) in P09). The red curve in Figure 12 shows a distribution of this kind with k = 7 and p = 0.017, having a peak at [Fe/H] = +0.1 dex. The P value in this case is in better agreement with . Although the model fits the low-metallicity tail of our distribution (the histogram) well compared with the SCBM (the black curve), it underestimates the number of supersolar-metallicity stars, and a modification of this model for the high-metallicity tail is needed.
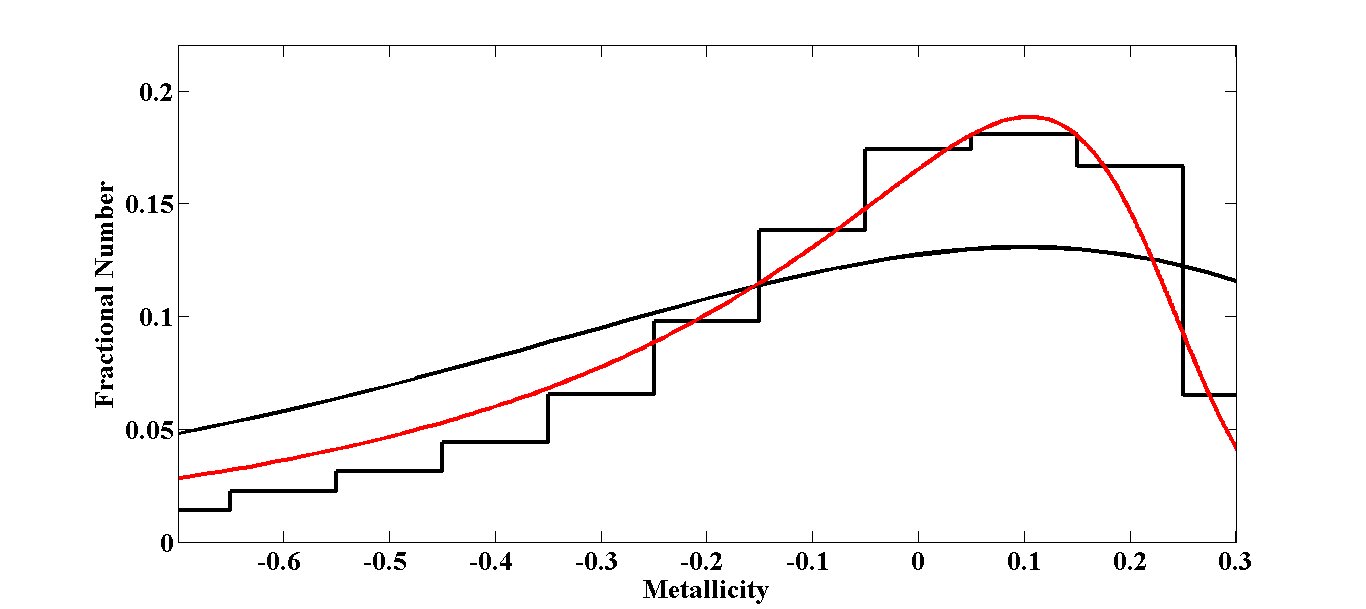
There have been other models such as merger models (Nagashima & Okamoto 2006) which resolve the G and K dwarf problems and can be tested using M-dwarf metallicity distributions in future. However, larger, more accurate data sets are required in order to discriminate among these models and find the more realistic one.
The metallicity distribution of long-lived stars (i.e., G, K and M dwarfs) as well as the age-metallicity relation traced by the metallicity of these dwarfs are the most important observational constraints for GCE. These low-mass stars belong to stellar populations of different ages and their metallicity distribution provides a fairly complete record of the evolutionary history of the Galaxy. However, CB04 pointed out that G dwarfs are sufficiently massive that they have begun to evolve away from the main sequence, and consequently, K dwarfs would make a cleaner sample for the local metal abundance distribution. For the same reason, we can expect that M dwarfs would provide an even better sample to represent the local metallicity distribution. M dwarfs are numerous, making up around half the total stellar mass of the Galaxy (RG97), and their metallicity distribution therefore offers a robust tool for studying the chemical evolution of the Milky Way. However, more precise metallicity calibrations are essential.
7 SUMMARY
Using a sample of 67 carefully selected dwarfs, we developed an optical-NIR photometric method to determine the metallicity of dwarf stars with spectral types between K6 to M6.5 in the metallicity range to +0.3 dex. The calibration sample has two parts; the first part includes 18 M dwarfs in common proper pairs with an FGK star or early-type M dwarf of known metallicity and the second part contains 49 dwarfs with metallicities obtained through an analysis of moderate-resolution spectra. Although the method may not be as accurate as moderate-to-high resolution spectroscopic techniques, they can be consistently applied to large numbers of stars, facilitating statistical investigations on metallicity distributions efficiently.
We selected a large sample of around 1.3 million M dwarfs from the merged SDSS and 2MASS catalogs and corrected their gJK photometry for Galactic extinction based on a widely used dust map of the northern Galactic hemisphere. These stars meet the requirements for clean photometry and fall in color ranges necessary for removing possible giants as well as those ranges required for our metallicity calibration. We also applied a color cut needed for a photometric parallax to estimate stellar distances. Using the z - height distribution, we found that the majority of M dwarfs in this large sample are found in the Galactic thin disk. By applying our calibration to these M dwarfs, the metallicity distribution of the local thin disk was determined and investigated. The metallicity distributions of subsamples with different z - heights recovers the well known observation that there is a decrease in mean metallicity with z - height, confirming yet again that older stars have on average lower metallicity and are farther from the Galactic plane.
We examined the SCBM of GCE by comparing the distribution expected from this model with our M-dwarf distribution. A significant discrepancy between the model and our results in the low-metallicity tail leads to the “M dwarf problem,” similar to the previously known G and K dwarf problems. More realistic models advanced to resolve the G and K dwarf problems may also be solutions to the M dwarf problem as well. We explored a few of these models such as the SCBM with pre-enrichment and two kinds of infall gas models with declining rates, and showed that these could more or less mitigate the M dwarf problem.
In order to improve significantly these results and to determine a more reliable M-dwarf metallicity distribution, a more accurate calibration over a broader range of metallicities is required. The photometry of many M dwarfs of known metallicity is unusable because the images are saturated in SDSS images which accounts for their exclusion from our calibration sample and why only the band was employed in the optical region. The acquisition of high-quality photometric data for a sample of M dwarfs with a variety of well-determined metallicities is already in progress.
ACKNOWLEDGMENTS
We would like to thank the anonymous referee for many thoughtful suggestions that improved our manuscript. We are also indebted to Patrick Hall for his helpful discussions involving the M-dwarf calibration sample and for his guidance in the statistical analysis of the large sample. We kindly thank Andrew Mann, John Bochanski, Andrew West, Sébastian Lépine, Ryan Terrien, Vincent Woolf, Rohit Deshpande, Chad Bender, and Zeljko Ivezić for their helpful suggestions. We are grateful for assistance provided by Xiaoyi Dong while the work was being undertaken.
Funding for SDSS-III has been provided by the Alfred P. Sloan Foundation, the Participating Institutions, the National Science Foundation, and the U.S. Department of Energy Office of Science. The SDSS-III web site is httpwww.sdss3.org. SDSS-III is managed by the Astrophysical Research Consortium for the Participating Institutions of the SDSS-III Collaboration including the University of Arizona, the Brazilian Participation Group, Brookhaven National Laboratory, Carnegie Mellon University, University of Florida, the French Participation Group, the German Participation Group, Harvard University, the Instituto de Astrofisica de Canarias, the Michigan StateNotre DameJINA Participation Group, Johns Hopkins University, Lawrence Berkeley National Laboratory, Max Planck Institute for Astrophysics, Max Planck Institute for Extraterrestrial Physics, New Mexico State University, New York University, Ohio State University, Pennsylvania State University, University of Portsmouth, Princeton University, the Spanish Participation Group, University of Tokyo, University of Utah, Vanderbilt University, University of Virginia, University of Washington, and Yale University.
This research has made use of data products from the Two Micron All Sky Survey, which is a joint project of the University of Massachusetts and the Infrared Processing and Analysis Center/California Institute of Technology, funded by the National Aeronautics and Space Administration and the National Science Foundation.
MMDR gratefully acknowledges the support of Natural Sciences and Engineering Research Council in carrying out this research.
| Name | RA (deg)aaThe astrometry is taken from 2MASS observations. | DEC (deg)aaThe astrometry is taken from 2MASS observations. | g | g.stat.errbbThe statistical photometric uncertainty in the g-band photometry, the systematic errors (, Ivezić et al. 2004 ) are not included. | g-SaturccThe saturation state of g band, un.sat = unsaturated and w.sat = weakly saturated | J | J.tot.errddThe total photometric uncertainty, including the corrected band photometric uncertainty, the nightly photometric zero-point uncertainty and the flat-fielding residual error | H | H.tot.errddThe total photometric uncertainty, including the corrected band photometric uncertainty, the nightly photometric zero-point uncertainty and the flat-fielding residual error | K | K.tot.errddThe total photometric uncertainty, including the corrected band photometric uncertainty, the nightly photometric zero-point uncertainty and the flat-fielding residual error |
|---|---|---|---|---|---|---|---|---|---|---|---|
| LJ1210+1858E | 182.5412 | 18.9690 | 21.234 | 0.059 | un.sat | 13.691 | 0.027 | 13.052 | 0.033 | 12.692 | 0.024 |
| LJ1000+3155 | 150.2096 | 31.9294 | 17.352 | 0.039 | w.sat | 10.261 | 0.018 | 9.643 | 0.016 | 9.275 | 0.018 |
| LJ1248+1204 | 192.2227 | 12.0757 | 16.871 | 0.028 | un.sat | 11.400 | 0.021 | 10.871 | 0.024 | 10.570 | 0.023 |
| LJ1604+3909W | 241.2122 | 39.1600 | 15.122 | 0.015 | un.sat | 9.903 | 0.021 | 9.453 | 0.021 | 9.159 | 0.017 |
| LJ1425+2035W | 216.3579 | 20.5960 | 17.898 | 0.240 | w.sat | 12.462 | 0.029 | 12.006 | 0.030 | 11.716 | 0.023 |
| 2M 1743+2136 | 265.8142 | 21.6028 | 17.867 | 0.213 | w.sat | 11.511 | 0.025 | 11.016 | 0.021 | 10.700 | 0.019 |
| GJ 3628 B | 162.65939 | 51.75045 | 14.931 | 0.019 | un.sat | 9.828 | 0.022 | 9.247 | 0.021 | 9.015 | 0.018 |
| NLTT 40692 | 233.8569 | 60.0855 | 14.311 | 0.019 | un.sat | 9.270 | 0.022 | 8.700 | 0.021 | 8.412 | 0.018 |
| LJ0849+0329W | 132.2594 | 3.4964 | 15.997 | 0.018 | un.sat | 10.756 | 0.024 | 10.176 | 0.021 | 9.911 | 0.023 |
| NLTT 2478 | 11.3066 | 0.2642 | 15.323 | 0.024 | un.sat | 10.114 | 0.027 | 9.561 | 0.023 | 9.264 | 0.021 |
| NLTT 57675 | 355.4381 | 15.314 | 0.027 | un.sat | 10.392 | 0.024 | 9.809 | 0.021 | 9.583 | 0.021 | |
| NLTT 42396 | 243.7207 | 60.6411 | 14.680 | 0.017 | un.sat | 9.818 | 0.020 | 9.295 | 0.019 | 9.023 | 0.014 |
| Gl173.1B | 69.9303 | 9.8630 | 15.056 | 0.013 | un.sat | 10.263 | 0.022 | 9.715 | 0.028 | 9.421 | 0.024 |
| NLTT 39578 | 227.96436 | 39.5507 | 14.409 | 0.013 | un.sat | 9.873 | 0.021 | 9.276 | 0.016 | 9.069 | 0.018 |
| LJ1237+3549 | 189.3145 | 35.8216 | 15.511 | 0.024 | un.sat | 11.353 | 0.019 | 10.757 | 0.017 | 10.519 | 0.019 |
| NLTT 36190 | 211.2326 | 1.9564 | 14.330 | 0.016 | un.sat | 10.130 | 0.026 | 9.483 | 0.023 | 9.269 | 0.019 |
| NLTT 28180 | 175.0868 | 9.5126 | 14.252 | 0.018 | un.sat | 10.115 | 0.023 | 9.544 | 0.025 | 9.309 | 0.021 |
| LHS 3084 | 233.66708 | 2.20412 | 14.279 | 0.017 | un.sat | 10.532 | 0.023 | 9.989 | 0.025 | 9.783 | 0.023 |
Note. — Name abbreviation: LJ=LSPM J
Note. — In all uncertainties above, the errors due to extinction corrections are not considered.
| Name | Sp.Type | Sp.Type Ref. | Primary | Sp.Type | Sp.TypeRef. | [Fe/H] | [Fe/H]Ref. |
|---|---|---|---|---|---|---|---|
| LJ1210+1858E | M6.5 | M14 | HIP 59310 | K3 | M14 | +0.30 0.03 | M13a-Calib.Sample |
| LJ1000+3155 | M6 | M13a | HIP 49081 | G3 | Simbad | +0.20 0.03 | VF05 |
| LJ1248+1204 | M5 | N14 | HD 111398 | G5 | Simbad | +0.08 0.03 | VF05 |
| LJ1604+3909W | M5 | N14 | HD 144579 | G8 | Simbad | 0.03 | VF05 |
| LJ1425+2035W | M5 | M14 | HIP 70520 | F9 | M14 | 0.05 | Ram07 |
| 2M 1743+2136 | M4.5 | M14 | HIP 86722 | K0 | M14 | 0.05 | F08 |
| GJ 3628 B | M4.1 | M13a | HIP 53008 | G5 | Simbad | 0.10 | SOP |
| NLTT 40692 | M4.1 | M13a | HIP 76315 | K3 | Simbad | +0.11 0.03 | VF05 |
| LJ0849+0329W | M4 | N14 | HD 75302 | G5 | Simbad | +0.10 0.03 | VF05 |
| NLTT 2478 | M3.8 | M13a | HIP 3540 | F8 | Simbad | +0.02 0.03 | VF05 |
| NLTT 57675 | M3.6 | M13a | HIP 116906 | G5 | Simbad | 0.03 | VF05 |
| NLTT 42396 | M3.5 | M13a | HIP 79629 | G5 | Simbad | 0.04 | M13a-Calib.Sample |
| Gl173.1B | M3.2 | M13a | HIP 21710 | K2 | Simbad | 0.03 | N12 |
| NLTT 39578 | M2.8 | M13a | HIP 74396 | G5 | Simbad | 0.03 | M13a-Calib.Sample |
| LJ1237+3549 | M1.8 | M13a | HIP 61589 | G0 | Simbad | 0.03 | M13a-Calib.Sample |
| NLTT 36190 | M1.8 | M13a | HIP 68799 | K0 | Simbad | 0.03 | M13a-Calib.Sample |
| NLTT 28180 | M1.6 | M13a | HIP 56930 | K0 | Simbad | 0.03 | M13a-Calib.Sample |
| LHS 3084 | M0 | WW05/R10-13 | 0.05aaThis metallicity was determined by direct measurements on the high-resolution spectrum of LHS 3084. | WW05 |
Note. — Source of Spectral types: M13a=Mann et al. (2013a); M14=Mann et al. (2014); N14=Newton et al. (2014);Simbad=SIMBAD Astronomical Database; WW05/R1013 = Temperature taken from WW05 and spectral type estimated by the temperature-spectral relations of Rajpurohit (2010, hereafter R10; 2013, hereafter R13) Source of [Fe/H]: VF05=Valenti & Fischer (2005) using the software package SME (Spectroscopy Made Easy analysis, Valenti & Piskunov 1996) with an adopted uncertainty of 0.03 dex for [Fe/H] and [M/H] through high-resolution observed spectra; SOP=Bouchy & The Sophie Team (2006), Metallicity taken from spectra of the SOPHIE Spectrograph through high-resolution observed spectra; N12=Neves et al. (2012), based on the method of Santos et al. (2002;2004) through high-resolution observed spectra; F08=Fuhrmann (2008) through high-resolution observed spectra; Ram07=Ramrez et al. (2007) through high-resolution observed spectra; M13a-Calib.Sample=Mann et al. (2013a) in their calibration sample, based on the software package SME as mentioned above and a set of tuned lines from the SPOCS catalog (Valenti & Fischer 2005) through high-resolution observed spectra; WW05=Woolf and Wallerstein (2005) through high-resolution observed spectra
| Name | RA (deg) | DEC (deg) | g | g.stat.errbbThe statistical photometric uncertainty in the g-band photometry, the systematic errors (, Ivezić et al. 2004 ) are not included. | g-SaturccThe saturation state of g band, un.sat = unsaturated and weak.sat = weakly saturated | J | J.tot.errddThe total photometric uncertainty, including the corrected band photometric uncertainty, the nightly photometric zero-point uncertainty and the flat-fielding residual error | H | H.tot.errddThe total photometric uncertainty, including the corrected band photometric uncertainty, the nightly photometric zero-point uncertainty and the flat-fielding residual error | K | K.tot.errddThe total photometric uncertainty, including the corrected band photometric uncertainty, the nightly photometric zero-point uncertainty and the flat-fielding residual error |
|---|---|---|---|---|---|---|---|---|---|---|---|
| LJ0856+1239 | 134.0815 | 12.6639 | 15.269 | 0.028 | un.sat | 9.555 | 0.021 | 9.014 | 0.022 | 8.696 | 0.017 |
| LJ1005+1703 | 151.3184 | 17.057 | 16.786 | 0.024 | un.sat | 11.106 | 0.021 | 10.547 | 0.021 | 10.246 | 0.016 |
| LJ1530+0926 | 232.6264 | 9.4337 | 15.941 | 0.014 | un.sat | 9.534 | 0.025 | 8.984 | 0.025 | 8.647 | 0.025 |
| LJ2012+0112 | 303.2498 | 1.2162 | 16.062 | 0.038 | un.sat | 10.363 | 0.026 | 9.809 | 0.024 | 9.535 | 0.019 |
| LJ0738+1829 | 114.7117 | 18.4890 | 17.023 | 0.012 | un.sat | 10.740 | 0.022 | 10.115 | 0.023 | 9.7861 | 0.018 |
| LJ1002+4827 | 150.7057 | 48.4593 | 16.293 | 0.024 | un.sat | 9.953 | 0.019 | 9.327 | 0.016 | 9.001 | 0.015 |
| LJ1432+0811 | 218.0354 | 8.1920 | 16.451 | 0.015 | un.sat | 10.081 | 0.024 | 9.512 | 0.022 | 9.155 | 0.021 |
| LJ1631+4051 | 247.8283 | 40.8643 | 15.620 | 0.014 | un.sat | 9.427 | 0.023 | 8.847 | 0.023 | 8.492 | 0.016 |
| LJ0738+4925 | 114.6967 | 49.4242 | 16.754 | 0.014 | un.sat | 10.571 | 0.024 | 9.957 | 0.030 | 9.676 | 0.021 |
| LJ1239+0410 | 189.9447 | 4.1798 | 17.602 | 0.023 | un.sat | 11.036 | 0.023 | 10.417 | 0.023 | 10.030 | 0.019 |
| LJ1309+2859 | 197.3956 | 28.9852 | 14.993 | 0.023 | un.sat | 9.455 | 0.027 | 8.899 | 0.031 | 8.604 | 0.019 |
| LJ1021+0804 | 155.3295 | 8.0741 | 16.332 | 0.019 | un.sat | 10.742 | 0.022 | 10.203 | 0.022 | 9.915 | 0.021 |
| LJ1352+6649 | 208.2108 | 66.8185 | 16.587 | 0.023 | un.sat | 10.532 | 0.020 | 9.950 | 0.015 | 9.644 | 0.019 |
| LJ0918+6037W | 139.5959 | 60.6253 | 16.620 | 0.020 | un.sat | 10.983 | 0.025 | 10.379 | 0.022 | 10.093 | 0.019 |
| LJ0001+0659 | 0.3158 | 6.9932 | 17.492 | 0.018 | un.sat | 11.274 | 0.022 | 10.733 | 0.028 | 10.413 | 0.021 |
| LJ0237+0021 | 39.3738 | 0.3576 | 15.848 | 0.019 | un.sat | 10.513 | 0.026 | 9.945 | 0.022 | 9.675 | 0.021 |
| LJ0917+5825 | 139.4417 | 58.4229 | 16.050 | 0.031 | un.sat | 10.243 | 0.022 | 9.686 | 0.023 | 9.395 | 0.020 |
| LJ1031+5705 | 157.8782 | 57.0883 | 15.472 | 0.015 | un.sat | 9.716 | 0.024 | 9.176 | 0.028 | 8.876 | 0.020 |
| LJ1112+0338 | 168.1610 | 3.6460 | 16.734 | 0.020 | un.sat | 11.070 | 0.024 | 10.533 | 0.022 | 10.232 | 0.019 |
| LJ1419+0254 | 214.8733 | 2.9101 | 15.732 | 0.014 | un.sat | 9.932 | 0.024 | 9.3477 | 0.021 | 9.063 | 0.021 |
| LJ0024+2626 | 6.0157 | 26.4417 | 15.322 | 0.017 | un.sat | 10.171 | 0.020 | 9.559 | 0.019 | 9.278 | 0.017 |
| LJ1348+0429 | 207.0382 | 4.4880 | 16.544 | 0.021 | un.sat | 10.728 | 0.027 | 10.164 | 0.022 | 9.832 | 0.019 |
| LJ1101+0300 | 165.3319 | 3.0048 | 14.821 | 0.015 | un.sat | 9.6744 | 0.027 | 9.209 | 0.026 | 8.893 | 0.021 |
| NLTT 8870 | 41.4216 | 44.9509 | 16.813 | 0.011 | w.sat | 11.012 | 0.021 | 10.490 | 0.023 | 10.154 | 0.018 |
| LJ0959+4712 | 149.9415 | 47.2032 | 14.903 | 0.018 | un.sat | 9.750 | 0.025 | 9.195 | 0.021 | 8.920 | 0.016 |
| LJ1148+5305 | 177.1970 | 53.0860 | 15.376 | 0.023 | un.sat | 10.118 | 0.023 | 9.548 | 0.027 | 9.278 | 0.024 |
| LJ1110+4757 | 167.7146 | 47.9506 | 15.292 | 0.020 | un.sat | 10.068 | 0.024 | 9.524 | 0.032 | 9.265 | 0.020 |
| LJ0958+0558 | 149.7354 | 5.9667 | 15.093 | 0.015 | un.sat | 9.817 | 0.023 | 9.317 | 0.027 | 8.990 | 0.021 |
| LJ1316+2752 | 199.1368 | 27.8749 | 14.071 | 0.022 | un.sat | 9.249 | 0.019 | 8.717 | 0.029 | 8.437 | 0.020 |
| LJ1709+3909 | 257.3584 | 39.1607 | 14.640 | 0.014 | un.sat | 9.819 | 0.022 | 9.276 | 0.020 | 9.025 | 0.019 |
| LJ1240+1946 | 190.0783 | 19.7699 | 15.301 | 0.019 | un.sat | 10.534 | 0.026 | 9.936 | 0.032 | 9.706 | 0.021 |
| LJ0920+0322 | 140.2414 | 3.3684 | 13.938 | 0.021 | un.sat | 9.306 | 0.023 | 8.761 | 0.046 | 8.497 | 0.025 |
| LJ1345+2852 | 206.2960 | 28.8670 | 14.483 | 0.018 | un.sat | 9.862 | 0.022 | 9.298 | 0.021 | 9.046 | 0.016 |
| LP 65523 | 67.7168 | 15.055 | 0.023 | un.sat | 9.824 | 0.024 | 9.266 | 0.022 | 8.978 | 0.019 | |
| LJ1314+4846 | 198.6227 | 48.7780 | 13.919 | 0.019 | un.sat | 9.619 | 0.022 | 9.039 | 0.028 | 8.807 | 0.022 |
| LJ1038+4831 | 159.6242 | 48.5291 | 14.274 | 0.020 | un.sat | 9.485 | 0.021 | 8.832 | 0.021 | 8.583 | 0.017 |
| LJ2148+0126 | 327.0426 | 1.4451 | 14.456 | 0.016 | un.sat | 9.763 | 0.024 | 9.151 | 0.027 | 8.900 | 0.021 |
| KIC 5252367 | 283.1939 | 40.4956 | 16.192 | 0.004 | un.sat | 11.654 | 0.027 | 11.022 | 0.030 | 10.847 | 0.018 |
| KIC 6183511 | 283.4019 | 41.5163 | 17.194 | 0.006 | un.sat | 12.803 | 0.021 | 12.231 | 0.024 | 12.010 | 0.028 |
| KIC 3426367 | 285.9289 | 38.5210 | 15.960 | 0.008 | un.sat | 11.804 | 0.022 | 11.193 | 0.021 | 10.993 | 0.18 |
| KIC 3935942 | 285.2238 | 39.0302 | 17.165 | 0.009 | un.sat | 12.951 | 0.024 | 12.294 | 0.027 | 12.114 | 0.024 |
| KIC 4543236 | 285.2670 | 39.6315 | 17.317 | 0.013 | un.sat | 13.279 | 0.027 | 12.725 | 0.033 | 12.478 | 0.030 |
| KIC 4243354 | 285.4000 | 39.3127 | 16.412 | 0.007 | w.sat | 13.092 | 0.022 | 12.461 | 0.019 | 12.272 | 0.023 |
| KIC 5513769 | 284.2961 | 40.7159 | 16.708 | 0.008 | un.sat | 13.003 | 0.022 | 12.361 | 0.022 | 12.148 | 0.020 |
| KIC 4725681 | 283.8664 | 39.8981 | 16.703 | 0.005 | un.sat | 13.182 | 0.024 | 12.510 | 0.023 | 12.295 | 0.022 |
| KIC 4139816 | 286.0791 | 39.2783 | 16.896 | 0.012 | w.sat | 13.863 | 0.026 | 13.221 | 0.023 | 13.080 | 0.030 |
| J20515725ee2MASSJ20515725-0111317 | 312.9885 | 19.376 | 0.079 | un.sat | 15.712 | 0.087 | 15.003 | 0.094 | 14.957 | 0.145 | |
| KIC 4543619 | 285.4578 | 39.6321 | 15.873 | 0.014 | un.sat | 13.153 | 0.023 | 12.535 | 0.022 | 12.411 | 0.022 |
| KIC 2850521 | 291.0475 | 38.0901 | 15.831 | 0.014 | w.sat | 13.207 | 0.024 | 12.581 | 0.022 | 12.456 | 0.024 |
f
Note. — Name abbreviation: LJ=LSPM J
Note. — In all uncertainties above, the errors due to extinction corrections are not considered.
| Name | Spectral Type | Spectral Type Ref. | [Fe/H] | [Fe/H]Ref. |
|---|---|---|---|---|
| LSPM J0856+1239 | M6 | N14 | +0.07 0.12 | N14 |
| LSPM J1005+1703 | M6 | N14 | +0.06 0.12 | N14 |
| LSPM J1530+0926 | M6 | N14 | +0.09 0.12 | N14 |
| LSPM J2012+0112 | M6 | N14 | +0.06 0.12 | N14 |
| LSPM J0738+1829 | M6 | N14 | +0.30 0.12 | N14 |
| LSPM J1002+4827 | M6 | N14 | +0.28 0.12 | N14 |
| LSPM J1432+0811 | M6 | N14 | +0.24 0.12 | N14 |
| LSPM J1631+4051 | M6 | N14 | +0.30 0.12 | N14 |
| LSPM J0738+4925 | M6 | N14 | +0.17 0.13 | N14 |
| LSPM J1239+0410 | M6 | N14 | +0.30 0.12 | N14 |
| LSPM J1309+2859 | M5 | N14 | +0.08 0.13 | N14 |
| LSPM J1021+0804 | M5 | N14 | +0.10 0.12 | N14 |
| LSPM J1352+6649 | M5 | N14 | +0.15 0.12 | N14 |
| LSPM J0918+6037W | M5 | N14 | +0.10 0.12 | N14 |
| LSPM J0001+0659 | M5 | N14 | +0.10 0.12 | N14 |
| LSPM J0237+0021 | M5 | N14 | +0.03 0.12 | N14 |
| LSPM J0917+5825 | M5 | N14 | +0.08 0.12 | N14 |
| LSPM J1031+5705 | M5 | N14 | +0.01 0.13 | N14 |
| LSPM J1112+0338 | M5 | N14 | +0.04 0.13 | N14 |
| LSPM J1419+0254 | M5 | N14 | +0.04 0.13 | N14 |
| LSPM J0024+2626 | M5 | N14 | +0.29 0.12 | N14 |
| LSPM J1348+0429 | M5 | N14 | +0.27 0.12 | N14 |
| LSPM J1101+0300 | M5 | N14 | 0.13 | N14 |
| NLTT 8870 | M5 | M14 | +0.11 0.10 | M14-13a Empir.Calib |
| LSPM J0959+4712 | M4 | N14 | +0.01 0.12 | N14 |
| LSPM J1148+5305 | M4 | N14 | 0.13 | N14 |
| LSPM J1110+4757 | M4 | N14 | 0.13 | N14 |
| LSPM J0958+0558 | M4 | N14 | +0.03 0.12 | N14 |
| LSPM J1316+2752 | M4 | N14 | 0.14 | N14 |
| LSPM J1709+3909 | M4 | N14 | 0.14 | N14 |
| LSPM J1240+1946 | M4 | N14 | 0.14 | N14 |
| LSPM J0920+0322 | M4 | N14 | 0.14 | N14 |
| LSPM J1345+2852 | M3.5 | D13/R10 | 0.12 | D13 |
| LP 65523 | M3 | M14 | +0.03 0.10 | M14 |
| LSPM J1314+4846 | M3 | N14 | 0.12 | N14 |
| LSPM J1038+4831 | M3 | N14 | +0.24 0.12 | N14 |
| LSPM J2148+0126 | M3 | N14 | +028 0.12 | N14 |
| KIC 5252367 | M2 | P12/R1013 | 0.13 | M13b/Non-KOI sample |
| KIC 6183511 | M1.5 | P12/R1013 | 0.06 | M13b/KOI sample |
| KIC 3426367 | M1.5 | P12/R1013 | 0.13 | M13b/Non-KOI sample |
| KIC 3935942 | M1 | P12/R1013 | +0.04 0.05 | M13b/Non-KOI sample |
| KIC 4543236 | M1 | P12/R1013 | 0.06 | M13b/Non-KOI sample |
| KIC 4243354 | M0 | P12/R1013 | 0.12 | M13b/Non-KOI sample |
| KIC 5513769 | M0 | P12/R1013 | 0.09 | M13b/Non-KOI sample |
| KIC 4725681 | M0 | P12/R1013 | 0.07 | M13b/KOI sample |
| KIC 4139816 | K7.5 | P12 | 0.07 | M13b/KOI sample |
| 2MASSJ20515725aa2MASSJ20515725-0111317 | K7 | SSPP/ST | 0.05 | SSPP/M |
| KIC 4543619 | K6.5 | MQ14 | 0.12 | M13b/Non-KOI sample |
| KIC 2850521 | K6 | P12 | 0.11 | M13b/Non-KOI sample |
Note. — Source of Spectral types: M14=Mann et al. (2014), N14=Newton et al. (2014), D13/R1013=Temperature taken from Deshpande et al. (2013) and spectral type determined by the temperature-spectral relations of R10 and R13, P12/R1013=Temperatures taken from Pinsonneault et al. (2012) and spectral type determined by the temperature-spectral relation of R10 and R13, P12= Spectral type estimated by temperatures taken from Effective temperature scale for KIC stars (Pinsonneault et al. 2012), SSPP/ST= Spectral type estimated by temperature taken from the Sloan Extension for Galactic Understanding and Exploration (SEGUE) Stellar Parameter Pipeline (SSPP, Lee et al. 2008), and MQ14=Spectral type estimated by temperature taken from Rotation periods of Kepler main sequence stars (McQuillan 2014) Source of [Fe/H]: N14=Based on an empirical metallicity calibration of moderate-resolution, NIR spectra in Newton et al. (2014), M13b/KOI sample=The sample taken from Table 1 in Mann et al. (2013b) with metallicities based on a modified empirical calibration of moderate-resolution, optical spectra in Mann et al. (2013a;2013b), M13b/Non-KOI sample= The sample taken from Table 2 in Mann et al. (2013b) with metallicities based on the weighted means of J-, H-, and K-band calibrations described in Mann et al. (2013a), and SSPP/M= Based on multiple approaches of SSPP; M14-13a Empir.Calib=Mann et al. (2014), based on the empirically spectroscopic calibration through moderate-resolution observed spectra; Rob07=Robinson et al. (2007) through moderate-resolution observed spectra
REFERENCES
Adelman-McCarthy, J., et al.: 2006, ApJS 162, 38
Ahn, C. P., et al. 2012, ApJS, 203, 21
Bessell, M. S. & Brett, J. M. 1988, PASP, 100, 1134
Bochanski, J. J., et al. 2010, AJ, 139, 2679
Bochanski, J. J., et al. 2013, AJ, 145, 40
Bonfils, X., et al. 2005, A&A, 442, 635
Carlberg, R. G., Dawson, P. C., et al, 1985, APJ, 294, 674
Casagrande, L., et al. 2011, A&A, 530, A138
Casuso, E. & Beckman, J. E. 2004, AA, 419, 181
Clayton, D. D., 1985, APJ, 285, 411
Clayton, D. D., 1987, APJ, 315, 451
Clayton, D. D., 1988, MNRAS, 234, 1
Covey, K. R., et al. 2007, AJ, 134, 2398
Covey, K. R., et al. 2008, AJ, 136, 1778
Cutri, R. M., et al. 2003, The IRSA 2MASS All-Sky Point Source Catalog, NASA/IPAC Infrared Science Archive
Deshpande, R., et al. 2013, AJ, 146, 156
Dhital, S., et al. 2012, AJ, 143, 67
Fuhrmann, K. 2008, MNRAS, 384, 173
Fukugita, M., et al. 1996, AJ, 111, 1748
Gilmore, G. & Reid, N. 1983, MNRAS, 202, 1025
Gunn, J. E., et al. 1998, AJ, 116, 3040
Ivezić, Z., et al. 2004, AN 325, 583
Ivezić, Z., et al. 2007, AJ, 134, 973
Johnson, J. A. & Apps, K. 2009, ApJ, 699, 933
Johnson, J. A., et al. 2012, AJ, 143, 111
Jones, D. O., et al, 2011, AJ, 142, 44
Juri, M., et al. 2008, AJ, 673, 864
Köppen, J. & Arimoto, N. 1990, AA, 240, 22
Larson, K. A. & Whittet, D. C. B. 2005, AJ, 623, 897
Lee, Y. S., et al. 2008, AJ, 136, 2022
Lépine, S., et al. 2003, ApJ, 585, L69
Lépine, S., et al. 2007, ApJ, 669, 1235
Lépine, S., et al. 2013, AJ, 145,102
Mann, A. W., et al. 2013a, AJ, 145, 52
Mann, A. W., et al. 2013b, AJ, 770, 43
Mann, A. W., et al. 2014, AJ, 147, 160
McQuillan, A., et al. 2014, ApJS, 211, 24
Mo, H., et al. 2010, Galaxy Formation and Evolution (Cambridge University Press)
Nagashima, M. & Okamoto, T. 2006, AJ, 643, 863
Neves, V., et al. 2012, A&A, 538, A25
Newton, E. R., et al. 2014, AJ, 147, 20
Nordström, B. 2008, The Ages of Stars, Proceedings IAU Symposium, No.258
Ostriker, J. B. & Thuan, T. X. 1975, Ap. J. Lett., 201, L51
Padmanabhan, N., et al. 2008, AJ, 674, 1217
Pagel, B. E. J. & Patchett, B. E. 1975, MNRAS, 172, 13
Pagel, B. E. J. 2009, Nucleosynthesis and Chemical Evolution of Galaxies, Second edition (Cambridge University Press)
Pinsonneault, M. H., et al. 2012, ApJS, 199, 30
Prantzos, N. 2007, eprint arXiv: 1101.2108v1
Rajpurohit, A. S., et al. 2010, SF2A-2010: Proceedings of the Annual meeting of the French Society of Astronomy and Astrophysics
Rajpurohit, A. S., et al. 2013, A&A, 556, 14
Ramírez, I., et al. 2007, A&A, 465, 271
Reid, I. N. & Gizis, J. E. 1997, AJ, 114, 1992
Robinson, S. E., et al. 2007, ApJS, 169, 430
Rojas-Ayala, B., et al. 2010, ApJL, 720, L113
Rojas-Ayala, B., et al. 2012, ApJ, 748, 93
Santos, N. C., et al. 2002, AA, 392, 215
Santos, N. C., et al. 2004, A&A, 415, 1153
Schlaufman, K. C. & Laughlin, G. 2010, AA, 519, A105
Schlegel, D. J., et al. 1998, ApJ, 500, 525
Schmidt, M. 1963, ApJ, 137, 758
Skrutskie, M. F., et al. 2006, AJ, 131, 1163
Sommer-Larsen, J. 1991, MNRAS, 243, 468
Terrien, R. C., et al. 2012, ApJL, 747, L38
Tucker, D. L., et al. 2006, Astron. Nachr., 327, 821
Twarog, B. A., 1980a, ApJS, 44, 1
Twarog, B. A., 1980b, ApJ, 242, 242
Valenti, J. A., & Piskunov, N. E. 1996, AAS, 118, 595
Valenti, J. A. & Fischer, D. A. 2005, ApJS, 159, 141
West, A. A., et al. 2006, AJ, 132, 2507
West, A. A., et al. 2008, AJ, 135, 785
West, A. A., et al. 2011, AJ, 141, 97
West, A. A., et al 2014, AAS Meeting No.224, 404.04
Woolf, V. M. & Wallerstein, G. 2005, MNRAS, 356, 963
Woolf V. M., et al. 2009, PASP, 121, 117
Woolf, V. M. & West, A. A. 2012, MNRAS, 422, 1489
Wyse, R. F. G., & Gilmore, G. 1995, AJ, 110, 2771
York, D. G., et al. 2000, AJ, 120, 1579
Zagury, F. 2006, MNRAS, 370, 1763