Characterization of a metastable neon beam extracted from a commercial RF ion source
Abstract
We have used a commercial RF ion-source to extract a beam of metastable neon atoms. The source was easily incorporated into our existing system and was operative within a day of installation. The metastable velocity distribution, flux, flow, and efficiency were investigated for different RF powers and pressures, and an optimum was found at a flux density of atoms/s/sr. To obtain an accurate measurement of the amount of metastable atoms leaving the source, we insert a Faraday cup in the beam line and quench some of them using a weak nm laser beam. In order to determine how much of the beam was quenched before reaching our detector, we devised a simple model for the quenching transition and investigated it for different laser powers. This detection method can be easily adapted to other noble gas atoms.
I introduction
In 2001, two groups realized the first Bose-Einstein condensate of metastable helium Robert et al. (2001); Pereira Dos Santos et al. (2001). To excite it to the metastable state, they have both used a high voltage discharge source Browaeys et al. (2000); F. Pereira Dos Santos et al. (2001), where atoms are excited to upper states, by running a DC discharge through the expanding atomic beam, which later decayed to a long-lived metastable state. In recent years, there has been much interest in experiments with ultracold metastable noble gasses (See Vassen et al. (2012) for a review). Also, advances in the efficiency of production and trapping of metastable noble gasses have enabled spectroscopy and abundance measurements with tiny fractions of rare isotopes. The isotope shift and hyperfine structure of isotopes of argon Blaum et al. (2008), krypton Cannon and Janik (1990), neon Feldker et al. (2011) and xenon Walhout et al. (1993) were measured. Moreover, isotope shift measurements have determined the 3He nuclear charge radius Zhao et al. (1991) and recently those of 6,8He Lu et al. (2013). In atomic traps, a novel technique for radio-dating using abundance measurements of noble gas isotopes called Atom Trap Trace Analysis (ATTA) has been introduced with krypton Chen et al. (1999), and recently used with argon Reichel et al. (2013). Lastly, there is also a growing interest in measurement of cold and trapped short-lived isotopes of the noble gasses neon and helium Behr and Gorelov (2014).
a)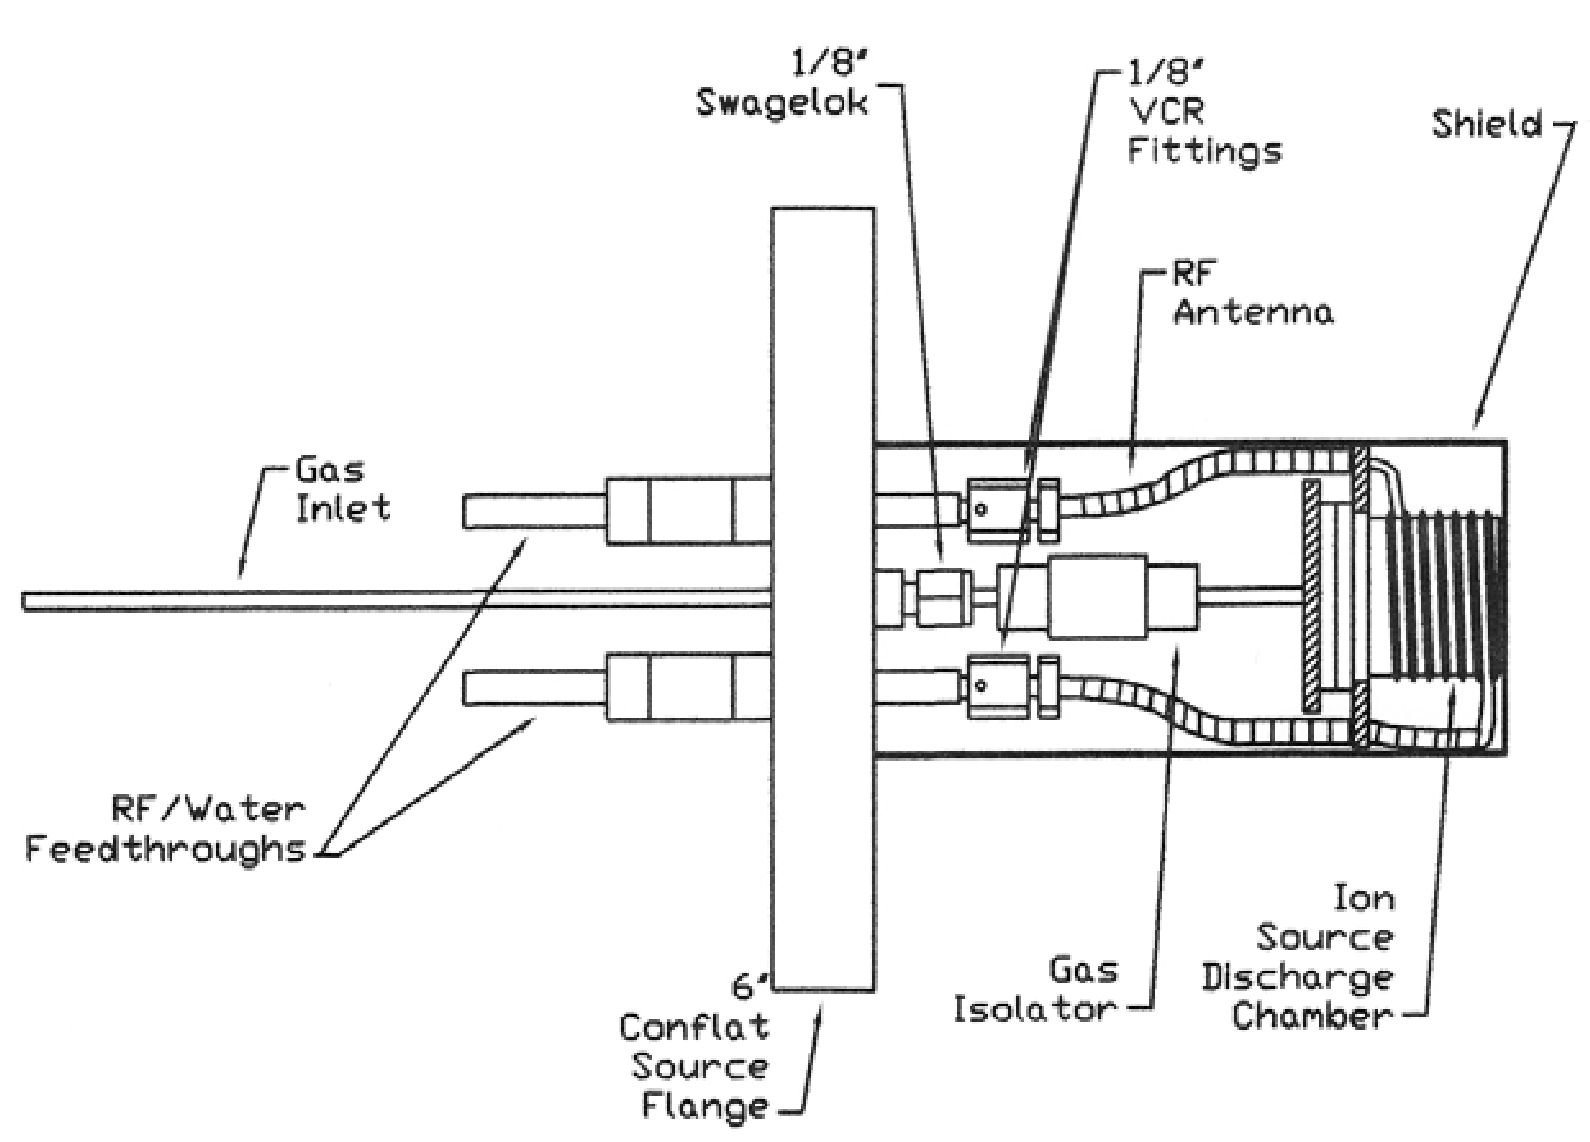 b)
b)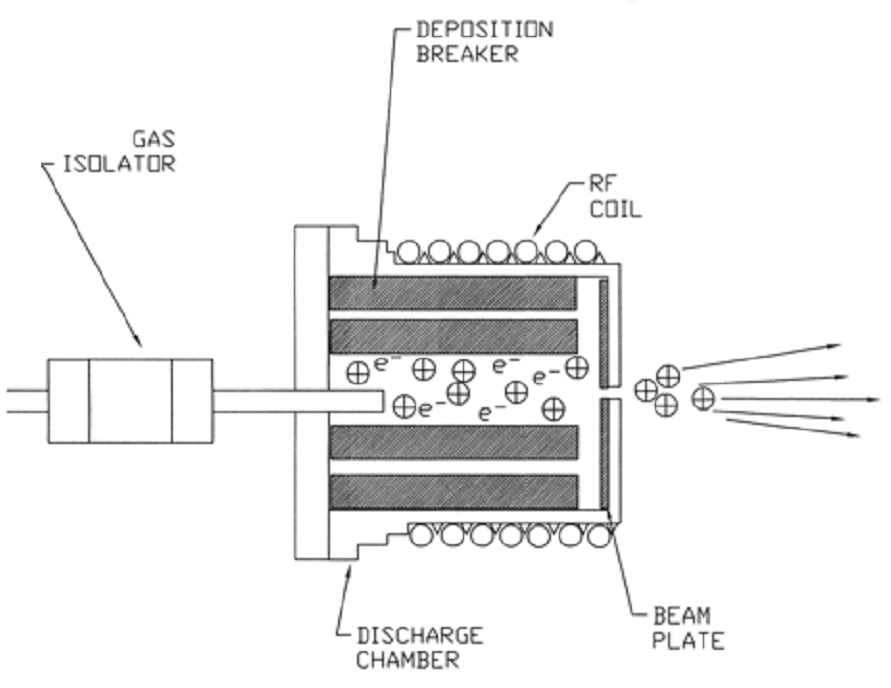
These developments have sparked interest in developing efficient metastable sources which are simple to construct, implement and maintain. Exotic sources such as an inverted magnetron pressure gauge van der Velden et al. (2004), and an all optical source Daerr et al. (2011) have been constructed, but the simplest and most efficient sources today usually rely on an RF discharge Chen et al. (2001). Despite needing much less maintenance than DC discharge sources, home built RF discharge sources degrade over time due to depositions on the discharge tube from sputtering of stainless steel vacuum parts. After experiencing difficulties in continuously operating a home built RF source we decided to acquire a commercial ion source (BIS RFIS-100) and investigate the conditions for efficiently extracting metastable neon atoms from it. In this paper we review our findings.
II RFIS-100 ion source
In Fig. 1a, adapted from Wahlin (2011), we show an overview of the source design. neon flows through the gas inlet, is delayed in the ceramic gas isolator to prevent the plasma short-circuiting to ground, and is excited in the alumina discharge chamber (Fig. 1b), where a discharge is created by applying high RF power at to a helical resonator copper antenna. The discharge chamber is equipped with an alumina deposition breaker, which serves as to prevent ablated metal particles from forming a conductive coating on the chamber which could shield the discharge from the RF power. A molybdenum beam plate acts as a nozzle which can be easily drilled to different diameters. The source also incorporates a piezoelectric high voltage module to help with ignition of the discharge.
There are normally two modes of operation with RF sources. Namely, capacitively coupled plasma, where electrons accelerated by the RF electric field ionize the gas to cause an avalanche, and inductively coupled plasma (ICP), where the electrons are accelerated by time varying magnetic fields Conrads and Schmidt (2000). ICP is initiated at high powers and pressures and is considered desirable in terms of metastable production Ritterbusch (2009). The signature of the ICP discharge is the requirement to re-tune the RF antenna’s impedance after the discharge starts. Good impedance matching between the antenna network and the RF power supply (T&C AG 0613 600W) is achieved via two high voltage vacuum variable capacitors that are connected in parallel and in series with the antenna. At virtually all pressures and powers in which neon ignites we observed a drastic change in impedance which indicates the formation of an ICP.
Igniting the plasma is harder than maintaining it, for this reason we usually start at high pressure and high RF power (W) and then quickly ramp down the power. Also, it is harder to start the plasma when the source is hot. Even though the hollow antenna is cooled by pumping a high pressure refrigeration fluid (tetrafluoromethane), the radiation dissipates significant power in the vacuum parts, and above , care must be taken. Thus, the power available to the discharge is probably less than the forward power measured by the generator (also reported at Welte (2011)). At high pressures of a few Torr, pure neon lights up easily and plasma can be sustained at powers as low as about . At low pressures of a few Torr, plasma can only be sustained at high powers of about W. When mixing a small amount of xenon (Similar to reports by Sulai (2011)), the plasma ignites at virtually all powers and pressures.
III Light induced quenching of metastable neon
The steady-state scattering rate of classical radiation by a two level system with natural linewidth is Phillips et al. (1985)
| (1) |
where is the saturation parameter, is the laser intensity, and the saturation intensity. The detuning is given by
| (2) |
where is the difference between the laser and the atomic transition frequency, and the Doppler detuning, caused by the relative velocity of the light and atom.
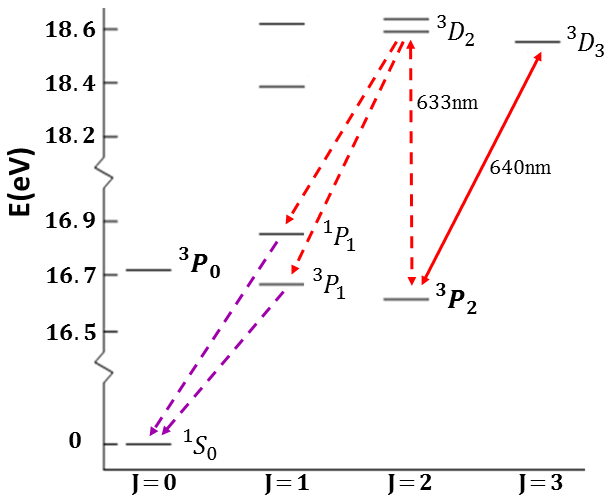
Noble gasses possess a long lived metastable state which forms such a two-level system Vassen et al. (2012). With neon, the cycling transition is between the levels , as shown in Fig. 2. Its wavelength in air is . It has a linewidth of , or, using eq. 2, in units of velocity. Another transition of interest is which has a wavelength of Ralchenko et al. (2008). It is not a closed transition, since the state can decay via a dipole transition to the and states (which decay immediately to the ground state) as well as to . Thus a laser tuned to this wavelength can deplete the population in the state; this process is also called quenching. The states of interest, and the relevant wavelengths are presented in Fig. 2.
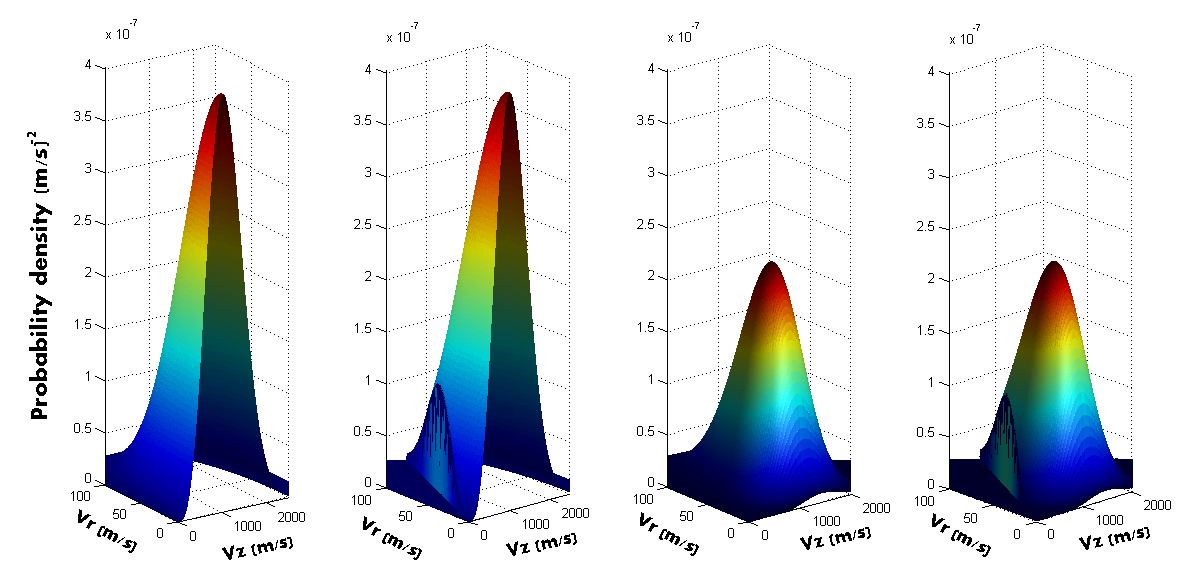
When a metastable beam encounters a laser beam tuned to the quenching transition, the atoms have a chance of absorbing photons and deexciting from the metastable state. The longer an atom spends inside the quench beam, and the stronger the laser, the chances of its survival decrease exponentially. For a transverse laser locked to the quenching transition, the detuning from the atomic transition is governed by the atom’s transverse velocity (eq. 2). We thus model, using eq. 1, this average survival rate of a metastable atom, with and the transverse and longitudinal velocities, which travels through a weak transverse quenching beam can be written as
| (3) |
Where is the effective intensity of the quench laser, and
is an effective transition linewidth, both in units
of velocity. Since our source incorporates a discharge chamber with
a small aperture (Fig. 1), the emerging beam
is assumed to have an effusive velocity distribution Pauly (2000):
| (4) | |||||
which is cylindrically normalized such that . is the most probable velocity, and the transverse rms velocity. The total velocity distribution of an atomic beam which passed a transverse laser tuned to the quenching transition is thus
Adding a weak probe beam tuned to the cycling transition and collecting the fluorescence using a photomultiplier tube (PMT), we measure a signal proportional to
| (5) |
for a transverse probe beam, and to
| (6) |
for a longitudinal probe.
To investigate the working conditions of the source, we use a weak transverse beam which probes the cycling transition and record the PMT signal for different RF powers and neon pressures. The scan voltage to frequency calibration was accomplished by conducting a wide scan and observing the isotope shift on a saturated absorption setup Lubotzky (2013). Since the fluorescence is visible to the naked eye, we noticed a slight fluorescence inside the entire source chamber which is unrelated to the atomic beam. Since we work with high RF power, we conclude that some of the background gas is also excited. This means that our PMT signal is comprised of a narrow atomic beam signal atop a wider background signal. This assumption is validated when we use the quenching beam.
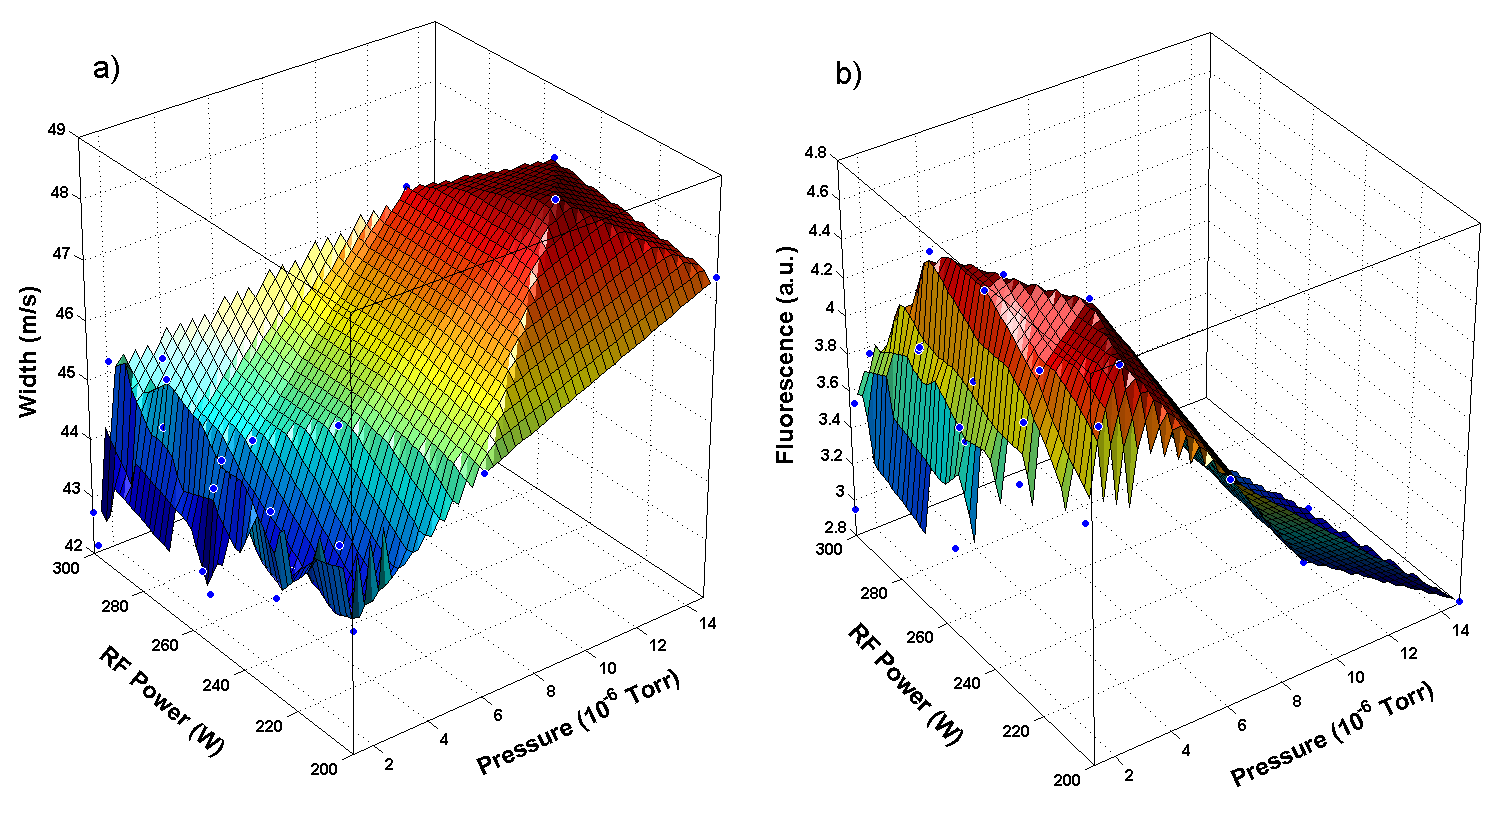
In Fig 3, we show the results obtained from fitting the PMT signal to a double Gaussian for different working conditions. Even though the atomic flux increases with pressure, high chamber pressure tend to quench the metastable beam through collisional deexcitations inside as well as outside of the source Welte et al. (2010). The optimum flux is at a chamber pressure of about and does not change much with RF power, which has to be above to sustain plasma at such low pressures. Also, a small increase of the transverse velocity is observed at high pressures, the transverse rms velocity at the desired pressure is .
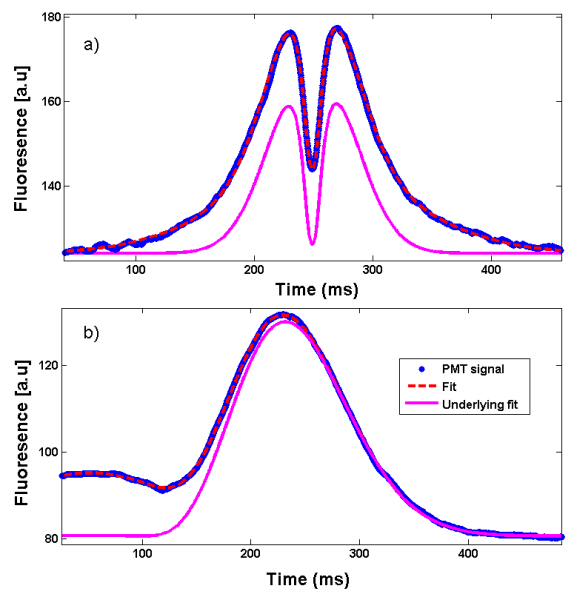
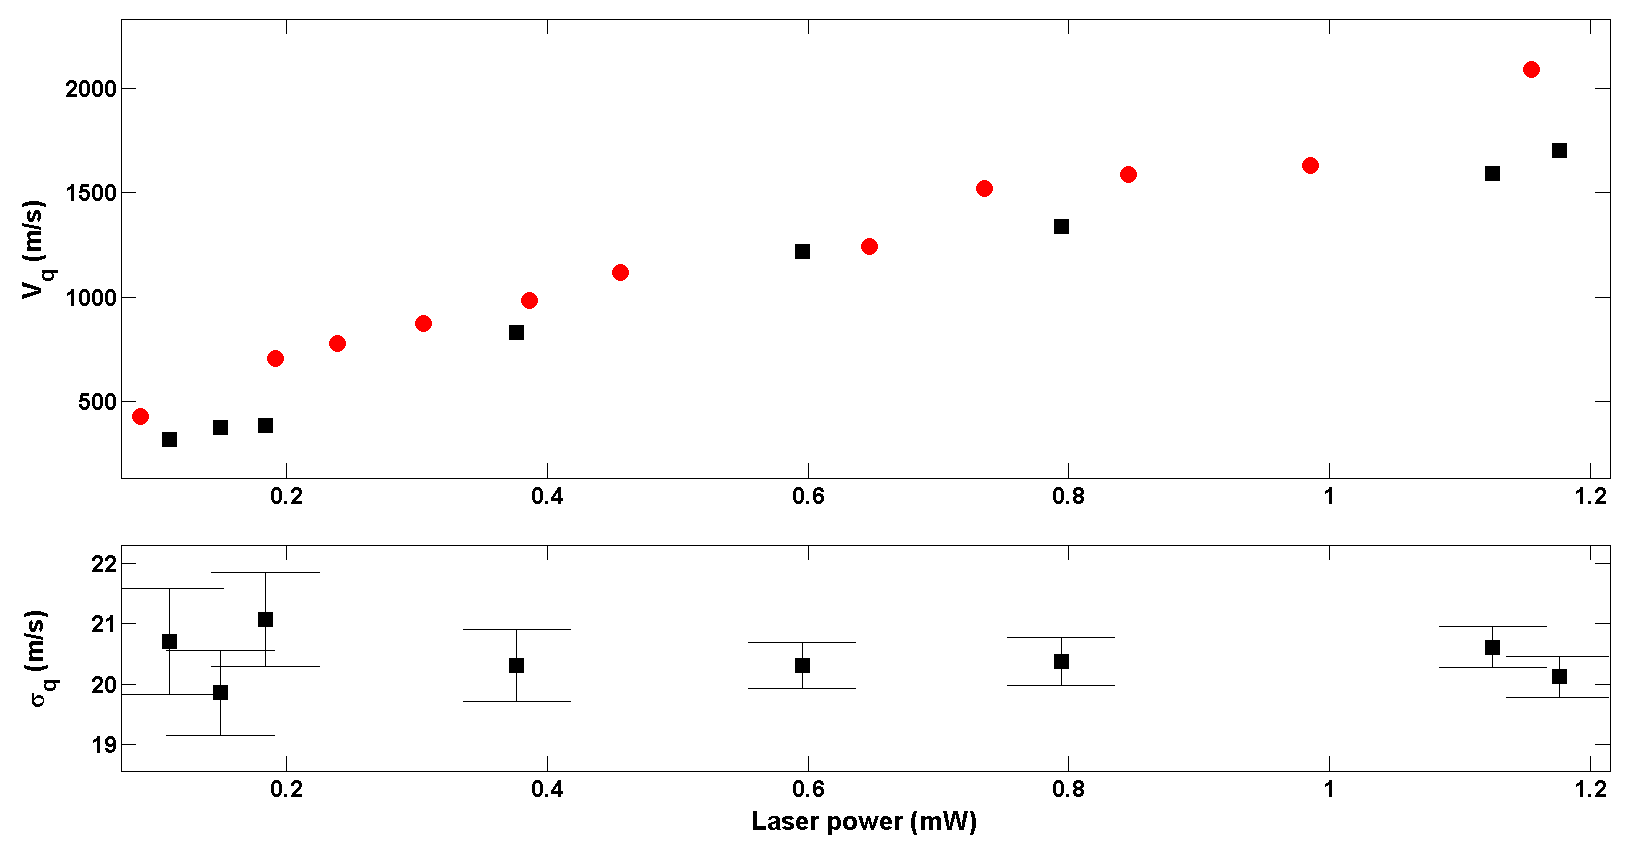
To investigate the properties of the quenching transition, we add a large transverse nm beam immediately after the source aperture, which quenches some of the metastable atoms before they reach the light collection region. For a transverse probe beam, we observe that the quenching beam affects the metastable atomic beam signal without affecting the background signal. We thus fit to a wide Gaussian plus transverse quenching (eq. 5). A typical fit, as well as the underlying fit with the background subtracted, is shown in Fig. 4a. The same was done with a longitudinal probe beam and fit to eq. 6 and is shown in Fig. 4b. We recorded and fit the transverse and longitudinal quenched fluorescence signal for different quench laser powers. The results are shown in Fig. 5. As modeled in eq. 3, the effective quench laser power at low quench powers is linear with laser power and gives similar results for both the transverse and longitudinal probes. Also, the effective transition linewidth is constant over a wide range of quench laser power.
IV Metastable detection using a Faraday-cup
Schemes for detecting metastable atoms usually rely on their long lifetime and large stored energy Hotop (1996). When metastable atoms collide with most surfaces, they immediately ionize them. If the surface is a conductor, a measurement of the ionization current can be used to determine the flux of metastable atoms in a beam.
In neon, the metastable states have approximately of internal energy, and the ionization energy is . When impacting on a metal surface with work function , which for stainless steel is under Hotop (1996), two energetic conditions are met: and , which enable two ionization processes by an exchange of electrons between the metal and the atom Cobas and Lamb (1944). The absolute metastable flux can be determined through Dunning et al. (1975)
| (7) |
where is the ionization current, is the fundamental charge, the emission coefficient for stainless steel impacted by Ne* Dunning et al. (1975), and is the fraction of atoms detected.
To implement this detection scheme we use a design similar to that of Ashmore (2005), for which a stainless steel detector plate is mounted, along with an electron collecting cathode, along the beam line. Upon operating the source, a large and noisy negative current was measured. To stabilize the current, a transverse magnetic field was introduced by mounting a coil on the vacuum window of the source chamber and flowing a large current . The field deflects fast electrons and ions before they reach the cup. To establish how much of the current left results from atoms in the state only, we measure it again with the population depleted by quenching it using the quench beam and subtract the results. This method is similar to that used by Brand et al. (1992) for neon, but since we did not need to quench all of the atomic beam, we could use a quench laser two orders of magnitude weaker.
Based on the transverse and longitudinal velocity distributions, and the distance and radius of the cup, we calculate the fraction of metastables that reach the cup and arrive at the fraction . We now simulate the amount of metastables reaching the cup when the quenching laser is on and at maximal power using the parameters from Fig. 4, and arrive at the fraction . The fraction of metastables which reach the cup and are quenched by the laser is thus . The maximal difference current obtained using the Faraday cup was , using eq. 7 we calculate that the metastable flow is Ne*/s. The average flux density in forward direction is then Ne*/s/sr. The flow and flux depend strongly on the pumping speed, our source was pumped by two turbo-molecular pumps which has a combined pumping speed of l/s. The total flow was measured using a flow meter to be sccm or Ne/s. Which yields an efficiency of about . This is the efficiency at maximum metastable flux. By operating the source with xenon, and mixing small amounts of neon , a factor of 2-3 is obtained with the efficiency and of the flux is lost.
V Summary and outlook
We have devised a simple, ad hoc model to investigate the amount of metastable neon atoms which are left after crossing a laser beam tuned to a quenching transition. This model was used to investigate how much of the ionization current in a Faraday-cup resulted from atoms in a specific metastable state and so determine the metastable flux density. Combined with spectroscopic measurements of the velocity distribution, and a measurement of the atomic flow, a complete picture of our source was obtained. Since the energy levels of other noble gasses are similar, this detection method can be readily used in existing metastable systems. The simplicity of incorporating, operating, and maintaining a commercial source might make it a choice for future industrial applications such as metastable atom lithography Allred et al. (2010).
VI Acknowledgments
The authors thank M. Oberthaler and the Synthetic Quantum Systems Group at the Kirchhoff Institute for Physics at the University of Heidelberg. This work was supported by the Israeli Science Foundation under ISF grant 177/11. Ben Ohayon is supported by the Hoffman Leadership and Responsibility fund.
References
- Robert et al. (2001) A. Robert, O. Sirjean, A. Browaeys, J. Poupard, S. Nowak, D. Boiron, C. I. Westbrook, and A. Aspect, Science 292, 461 (2001).
- Pereira Dos Santos et al. (2001) F. Pereira Dos Santos, J. Léonard, J. Wang, C. J. Barrelet, F. Perales, E. Rasel, C. S. Unnikrishnan, M. Leduc, and C. Cohen-Tannoudji, Phys. Rev. Lett. 86, 3459 (2001).
- Browaeys et al. (2000) A. Browaeys, J. Poupard, A. Robert, S. Nowak, W. Rooijakkers, E. Arimondo, L. Marcassa, D. Boiron, C. Westbrook, and A. Aspect, The European Physical Journal D 8, 199 (2000), ISSN 1434-6060.
- F. Pereira Dos Santos et al. (2001) n. F. Pereira Dos Santos, F. Perales, J. Léonard, A. Sinatra, J. Wang, F. S. Pavone, E. Rasel, C. S. Unnikrishnan, and M. Leduc, The European Physical Journal Applied Physics 14, 69 (2001), ISSN 1286-0050.
- Vassen et al. (2012) W. Vassen, C. Cohen-Tannoudji, M. Leduc, D. Boiron, C. I. Westbrook, A. Truscott, K. Baldwin, G. Birkl, P. Cancio, and M. Trippenbach, Rev. Mod. Phys. 84, 175 (2012).
- Blaum et al. (2008) K. Blaum, W. Geithner, J. Lassen, P. Lievens, K. Marinova, and R. Neugart, Nuclear Physics A 799, 30 (2008), ISSN 0375-9474.
- Cannon and Janik (1990) B. D. Cannon and G. R. Janik, Phys. Rev. A 42, 397 (1990).
- Feldker et al. (2011) T. Feldker, J. Schutz, H. John, and G. Birkl, The European Physical Journal D 65, 257 (2011), ISSN 1434-6060.
- Walhout et al. (1993) M. Walhout, H. J. L. Megens, A. Witte, and S. L. Rolston, Phys. Rev. A 48, R879 (1993).
- Zhao et al. (1991) P. Zhao, J. R. Lawall, and F. M. Pipkin, Phys. Rev. Lett. 66, 592 (1991).
- Lu et al. (2013) Z.-T. Lu, P. Mueller, G. W. F. Drake, W. Nörtershäuser, S. C. Pieper, and Z.-C. Yan, Rev. Mod. Phys. 85, 1383 (2013).
- Chen et al. (1999) C. Y. Chen, Y. M. Li, K. Bailey, T. P. O’Connor, L. Young, and Z.-T. Lu, Science 286, 1139 (1999).
- Reichel et al. (2013) T. Reichel, A. Kersting, F. Ritterbusch, S. Ebser, K. Bender, R. Purtschert, M. Oberthaler, and W. Aeschbach-Hertig, in EGU General Assembly Conference Abstracts (2013), vol. 15, p. 10901.
- Behr and Gorelov (2014) J. A. Behr and A. Gorelov, Journal of Physics G: Nuclear and Particle Physics 41, 114005 (2014).
- Wahlin (2011) E. Wahlin, Model RFIS-100 RF ion source User’s Manual, Beam Imaging Solutions (2011).
- van der Velden et al. (2004) M. H. L. van der Velden, H. Batelaan, E. te Sligte, H. C. W. Beijerinck, and E. J. D. Vredenbregt, Review of Scientific Instruments 75 (2004).
- Daerr et al. (2011) H. Daerr, M. Kohler, P. Sahling, S. Tippenhauer, A. Arabi-Hashemi, C. Becker, K. Sengstock, and M. B. Kalinowski, Review of Scientific Instruments 82, 073106 (2011).
- Chen et al. (2001) C. Y. Chen, K. Bailey, Y. M. Li, T. P. O’Connor, Z.-T. Lu, X. Du, L. Young, and G. Winkler, Review of Scientific Instruments 72, 271 (2001).
- Conrads and Schmidt (2000) H. Conrads and M. Schmidt, Plasma Sources Science and Technology 9, 441 (2000).
- Ritterbusch (2009) F. Ritterbusch, Ph.D. thesis, Kirchhoff Institute for Physics (2009).
- Welte (2011) J. Welte, Ph.D. thesis, Ruperto-Carola-University of Heidelberg (2011).
- Sulai (2011) I. A. Sulai, Ph.D. thesis, University of chicago (2011).
- Phillips et al. (1985) W. D. Phillips, J. V. Prodan, and H. J. Metcalf, J. Opt. Soc. Am. B 2, 1751 (1985).
- Ralchenko et al. (2008) Y. Ralchenko, A. E. Kramida, J. Reader, and N. A. S. D. Team, NIST Atomic Spectra Database (version 3.1.5) (2008).
- (25) A.Kramida, Yu.Ralchenko, J.Reader, and and NIST ASD Team.
- Pauly (2000) H. Pauly, Atom, Molecule, and Cluster Beams I: Basic Theory, Production and Detection of Thermal Energy Beams (Springer, 2000).
- Lubotzky (2013) B. Lubotzky, Master’s thesis, Hebrew University of Jerusalem (2013).
- Welte et al. (2010) J. Welte, F. Ritterbusch, I. Steinke, M. Henrich, W. Aeschbach-Hertig, and M. K. Oberthaler, New Journal of Physics 12, 065031 (2010).
- Hotop (1996) H. Hotop, in Atomic, Molecular, and Optical Physics: Atoms and Molecules, edited by F. Dunning and R. G. Hulet (Academic Press, 1996), vol. 29, Part B, pp. 191 – 215.
- Cobas and Lamb (1944) A. Cobas and W. E. Lamb, Phys. Rev. 65, 327 (1944).
- Dunning et al. (1975) F. B. Dunning, R. D. Rundel, and R. F. Stebbings, Review of Scientific Instruments 46 (1975).
- Ashmore (2005) J. P. Ashmore, Ph.D. thesis, Griffith University (2005).
- Brand et al. (1992) J. A. Brand, J. E. Furst, T. J. Gay, and L. D. Schearer, Review of Scientific Instruments 63, 163 (1992).
- Allred et al. (2010) C. S. Allred, J. Reeves, C. Corder, and H. Metcalf, Journal of Applied Physics 107, 033116 (2010).