ALMA and VLA measurements of frequency-dependent time lags in Sagittarius A*: evidence for a relativistic outflow
Abstract
Radio and mm-wavelength observations of Sagittarius A* (Sgr A*), the radio source associated with the supermassive black hole at the center of our Galaxy, show that it behaves as a partially self-absorbed synchrotron-emitting source. The measured size of Sgr A* shows that the mm-wavelength emission comes from a small region and consists of the inner accretion flow and a possible collimated outflow. Existing observations of Sgr A* have revealed a time lag between light curves at 43 GHz and 22 GHz, which is consistent with a rapidly expanding plasma flow and supports the presence of a collimated outflow from the environment of an accreting black hole. Here we wish to measure simultaneous frequency-dependent time lags in the light curves of Sgr A* across a broad frequency range to constrain direction and speed of the radio-emitting plasma in the vicinity of the black hole. Light curves of Sgr A* were taken in May 2012 using ALMA at 100 GHz using the VLA at 48, 39, 37, 27, 25.5, and 19 GHz. As a result of elevation limits and the longitude difference between the stations, the usable overlap in the light curves is approximately four hours. Although Sgr A* was in a relatively quiet phase, the high sensitivity of ALMA and the VLA allowed us to detect and fit maxima of an observed minor flare where flux density varied by 10%. The fitted times of flux density maxima at frequencies from 100 GHz to 19 GHz, as well as a cross-correlation analysis, reveal a simple frequency-dependent time lag relation where maxima at higher frequencies lead those at lower frequencies. Taking the observed size-frequency relation of Sgr A* into account, these time lags suggest a moderately relativistic (lower estimates: 0.5c for two-sided, 0.77c for one-sided) collimated outflow.
1 Introduction
The radio source Sagittarius A* (Sgr A*) at the center of our Galaxy is the best-constrained supermassive black hole candidate found thus far (Genzel et al., 2010; Falcke and Markoff, 2013 for a review). Located at a distance of 8.3 kpc from the solar system, its mass is calculated to be (Eisenhauer et al.,, 2003; Reid and Brunthaler,, 2004; Ghez et al.,, 2008; Gillessen et al.,, 2009; Genzel et al.,, 2010). For a black hole of this mass, Sgr A* seems to be accreting gas at a very low rate of yr-1, as was derived from Faraday rotation measures (Bower et al.,, 2005; Marrone et al.,, 2007).
The emission from Sgr A* between frequencies of 20 GHz and 230 GHz shows flux density variability of a few tens of percent on hour-long timescales, up to 100% on month-long timescales, as well as occasional flaring behavior (Dexter et al.,, 2013). In radio, Sgr A* has an inverted spectrum (i.e., rising flux density with increasing frequency) that peaks at the ’submm bump’, around 350 GHz, beyond which the spectrum steeply drops in the infrared regime. The radio emission is thought to originate mostly from partially self-absorbed synchrotron radiation emitted farther out from the black hole, while emission at frequencies corresponding to the submm bump (Falcke et al.,, 1998) of the Sgr A* spectrum is commonly associated with the optically thin emission closest to the black hole (Falcke et al.,, 1998; Shen et al.,, 2005; Bower,, 2006; Doeleman et al.,, 2008). In the mm regime and at longer wavelengths, the flux density variation is thought to arise from local bulk properties (magnetic field strength, gas density, temperature) of the plasma, while the variability seen in infrared and X-rays is mostly attributed to changes in the population of the high-energy tail of the local electron energy distribution (Özel et al.,, 2000; Markoff et al.,, 2001; Yuan et al.,, 2003; Dodds-Eden et al.,, 2010; Dibi et al.,, 2013).
While the emission mechanisms for the radio and mm-wavelength emission of Sgr A* are understood fairly well, the identification of the emission with specific flow regions is still a subject of debate. For example, an important question is whether the radio emission is generated in a jet (Falcke et al.,, 1993) or in a radiatively ineffcient accretion flow (Narayan et al.,, 1995). Sgr A* in its flaring state fits neatly onto the fundamental plane of black hole activity (Merloni et al.,, 2003; Falcke et al.,, 2004; Plotkin et al.,, 2012), and as such it would be expected to feature a jet as other sources on that scaling relation do (Markoff,, 2005). As yet, no direct detection of a jet has been made for Sgr A* despite the claimed presence of tantalizing jet-like features close to the Galactic center on parsec scales (Yusef-Zadeh et al.,, 2012; Li et al.,, 2013). Any putative jet structure close to the black hole cannot be resolved below observing frequencies of 100 GHz because interstellar scatter-broadening blurs our view of the Galactic center at such frequencies, an effect that progressively increases with lower frequency (Lo et al.,, 1981; van Langevelde et al.,, 1992; Bower et al.,, 2006; Mościbrodzka et al.,, 2014). At higher observing frequencies, interstellar scintillation is less of a problem - in the mm-wave regime, existing VLBI networks should be able to directly observe the proposed shadow of the event horizon with mmVLBI (Falcke et al.,, 2000; Doeleman et al.,, 2008).
There are other ways in which the nature of the emitting gas flow may be determined, however. Sgr A* exhibits an inverted radio spectrum. Flat or inverted radio spectra are commonly seen in quasars and active galactic nuclei, where the bases of radio jets resolved at high resolution show dominant emission at different radio frequencies as a function of distance from the core, which
is due to optical depth effects (Hada et al.,, 2011), as has also been predicted from theory (Blandford and Konigl,, 1979; Falcke and Biermann,, 1995). The multifrequency spectrum of Sgr A* (from radio to X-ray) in its flaring state looks very much like the spectrum of M81*, which has a weak jet (Bietenholz et al.,, 2004). The emission from an unresolved, compact jet may explain the inverted radio spectrum of Sgr A* (Falcke et al.,, 1993; Mościbrodzka and Falcke,, 2013).
Presence of a jet implies that specific correlations should be detected between light curves at different frequencies. As the peak frequency of radio emission changes with position along the jet axis, we expect variations in flux density at different observing frequencies to exhibit time lags relative to one another as the emitting gas moves out. Previous observations of Sgr A* made with the VLA have indeed suggested the existence of a time lag of 20 to 40 minutes in flux density variability between light curves measured at 43 GHz and 22 GHz, with variability in the higher-frequency lightcurve leading that in the lower-frequency lightcurve (Yusef-Zadeh et al.,, 2006, 2008). Yusef-Zadeh et al. interpreted this as emission from an expanding plasma cloud (van der Laan,, 1966) with velocities reaching about 0.01, but this interpretation does not take VLBA sizes into account. When coupled to the observed relation between the observing frequency and the measured intrinsic size of Sgr A* (Bower et al.,, 2004; Doeleman et al.,, 2008), the time lag between 43 GHz and 22 GHz corresponds to a size difference of 30 light minutes. Thus, such a time lag suggests the presence of a fast and directed outflow with a moderately relativistic speed (Falcke et al., 2009a, ). As the emission at observing frequencies below the submm bump is probably all partially self-absorbed synchrotron emission, time lags may be present between the light curves at any two different frequencies in that region. Measurements of time lags over a wider range of frequencies are of interest as they may aid in establishing a flow velocity profile, and they may even provide an estimate of how close to the black hole the outflow can be traced.
2 Observations and data reduction
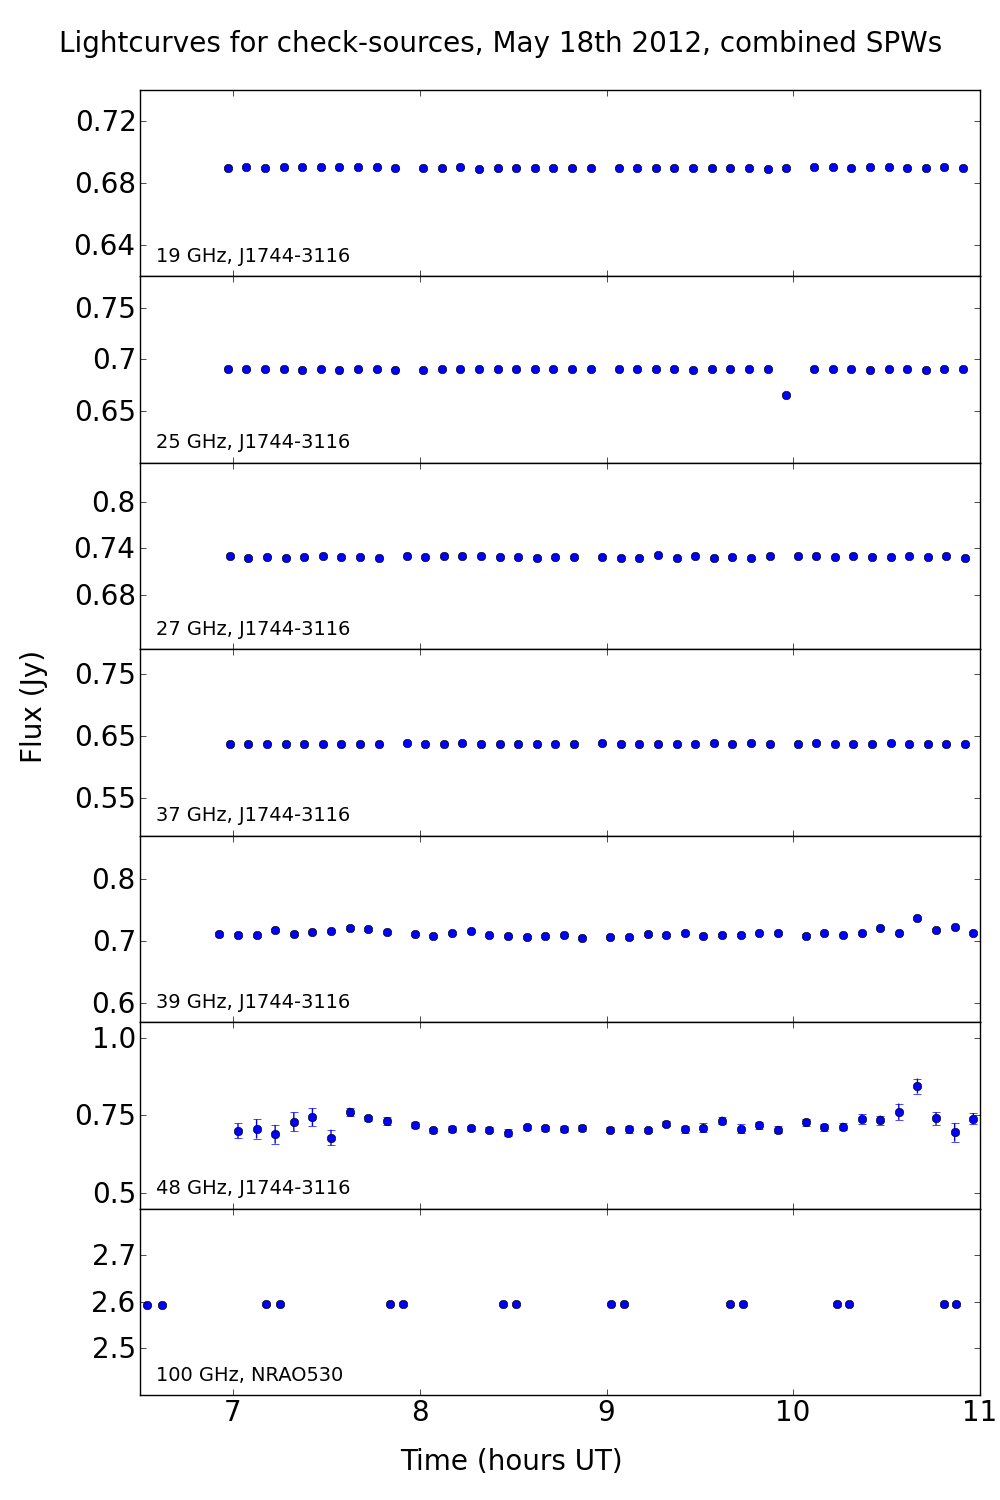
Our VLA observations were taken on May 18, 2012 from 05:25:15 UT to 12:54:01 UT in CnB configuration, chosen to coincide with a Chandra observation. Light curves for Sgr A* were taken in pairs of subbands for three basebands (X, Ka and Q), yielding 1-GHz-wide subbands at center frequencies of 19 and 25.5 GHz (K-band), 27.48 and 37.99 GHz (Ka-band), and 39.55 and 48.5 GHz (Q-band) - each using 30-second scans at an integration time of 3 seconds. The subbands eventually used for each center frequency were 4-7 (19 GHz), 0-7 (25.5 GHz), 0-7 (27 GHz), 0-7 (37 GHz), 2-7 (39 GHz), and 1-2 (48 GHz). Flux and bandpass calibration were made on the standard VLA calibrator 3C286. A monitoring loop with a period of 7.5 minutes was used for Sgr A*: within each iteration of this loop, J1744-3116 was used as a gain calibrator source and J1745-283 was used as a check-source, cycling through all three basebands in turn. The integration time of 3 seconds was chosen such that the RMS noise per scan was expected to be 1 mJy when all subbands in a baseband were used.
The VLA data (project code: 12A-339) were initially reduced using the VLA pipeline version 1.2.0 (rev. 9744) on CASA 4.1.0. After running the VLA pipeline, the sufficiently high flux density of all sources allowed us to perform careful phase self-calibration on them using progressively shorter solution intervals down to one integration length (3 seconds). Some subbands were flagged in this calibration process because their calibration solutions
did not converge. The subbands that remained unflagged were (format: baseband (subbands)) 48 GHz (1,2), 39 GHz (2-7), 37 GHz (all), 27 GHz (all), 25 GHz (all), and 19 GHz (4-7). The declination of Sgr A* combined with the latitude of the VLA means that Sgr A* never reaches an elevation over 27 degrees for the VLA. Therefore the first and last parts (before approximately 6:40 UT and after approximately 11:50 UT) of the observation suffer from coherence loss: the source is less than 18 degrees above the horizon, and the effective path length through the atmosphere for the signal varies rapidly and strongly between antennas. As such, all data in these time windows were flagged before recalibration.
For the ALMA track, observations were made in ALMA cycle 0 on May 18, 2012 from 03:30:47 UT to 10:52:16 UT (project code: 2011.0.00887.S). The ALMA light curves for Sgr A* were taken at ALMA bands 3, 6, and 7 using pairs of spectral windows each centered on 95, 105, 247, 260, 338, and 348 GHz. Each pair of spectral windows covered 3.75 GHz bandwidth for a total of 7.5 GHz bandwidth per ALMA band. Scan lengths were chosen to yield a sensitivity of 0.5 mJy. All individual scans of Sgr A* were bracketed by either NRAO530 or J1924-292 as calibrators, while flux density calibration was made on Titan and Neptune. At that time, ALMA had 19 antennas available. In this paper we limit discussion to the 100 GHz ALMA data: the light curves at 250 GHz and 340 GHz will be the subject of a future paper.
For ALMA, the source setup was somewhat more complicated because all observations in cycle 0 had to be obtained in two-hour blocks. This means that the ALMA dataset consists of four separate blocks that are contiguous in time, each starting with a flux density calibrator measurement (Titan for the first two blocks, Neptune for the latter two). Within each block, five scans on Sgr A* were made where each of these was bracketed by scans on one of the calibrator sources NRAO530 and J1924-292, a precaution taken because of possible calibration difficulties that might otherwise occur in cycle 0. Thus the scan setup for each block was (using the first letter of each source) ’NSN JSJ NSN JSJ NSN’, the average switching time between bracketing calibrator scans and Sgr A* scans was 2 minutes, and the time cadence on Sgr A* in each band was 15 minutes. As J1924-292 exhibited irregular results in its polarization-dependent flux density levels, it was not used as a calibrator and only used as a check-source. Gain levels were stable enough to warrant the usage of NRAO530 as the only gain calibrator. The ALMA data were calibrated using a custom script based on the calibration procedure for the QA2 process of Cycle 0 data, with subsequent phase self-calibration on Sgr A* (which has a very strong unresolved component of around 2.5 Jy at 100 GHz) using baselines longer than 150 k.
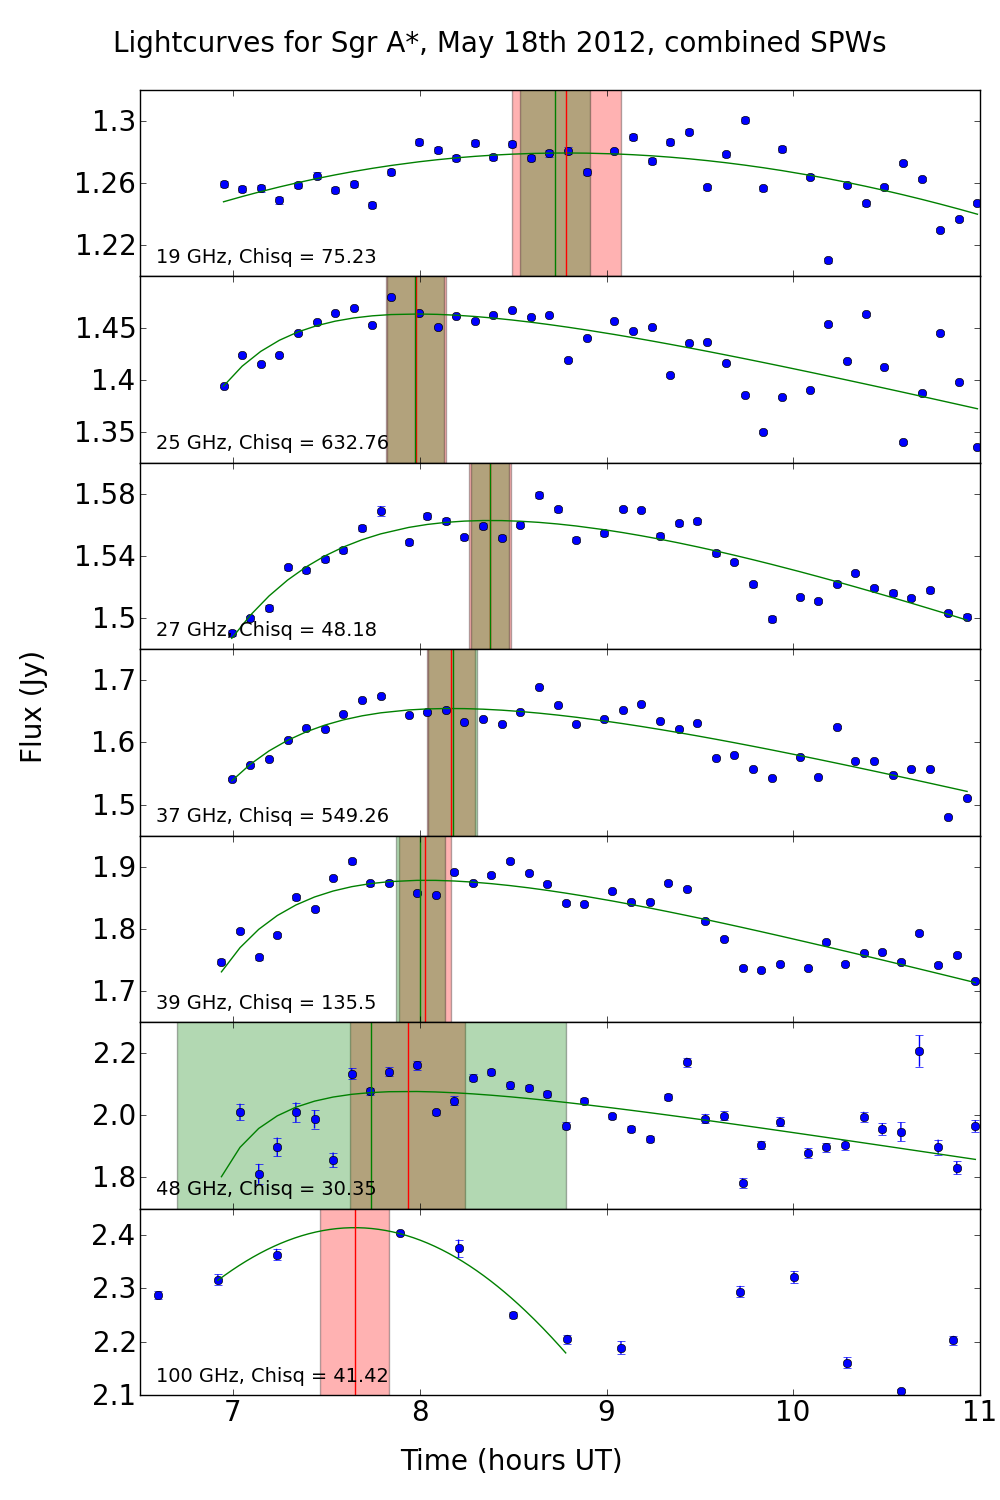
From the calibrated VLA and ALMA data, the light curves for Sgr A* were obtained by averaging all unflagged UV visibilities per scan from all baselines longer than , using uniform weighting for the selected baselines. We chose to only use projected baseline lengths over because we wished to avoid any contamination from the extended emission around Sgr A*, and baselines shorter than the chosen length show hints of structural variations over the track. Limiting ourselves to the longer baselines enabled us to work directly with the visibilities rather than needing the additional steps of imaging and model fitting. The errors on the flux density levels were estimated using the spread in amplitude of the calibrated visibilities over each scan. The calibrated light-curve data can be seen in the left column of Fig. 1. All light
curves can be seen to exhibit a gradual rise and decay, with shorter-timescale variation superimposed. For the calibrated VLA data, the resulting noise levels for the basebands at 19, 25, 27, 37, 39, and 48 GHz are 1.4, 0.7, 1.2, 0.9, 2.6, and 12.1 mJy, respectively. Limited calibration accuracy and the flagging of several subbands degrades the sensitivity from the desired sensitivity in the highest frequency bands. The final uncertainties in flux density are dominated by the calibration uncertainty coming from the variability that was exhibited by the check-source: this brings the total relative flux density measurement uncertainty to approximately 5% for the VLA data. For the ALMA data, the uncertainty in flux density is approximately 5% as well - however, the errors there are relatively small compared to the intrinsic variability of Sgr A* at 100 GHz. We note that the flux calibration of the VLA data does not give a perfectly smooth spectrum for our calibrator source J1744-3116, but this only affects the overall flux levels of the Sgr A* light curves by 5% and does not affect the conclusions in this paper.
3 Analysis and results
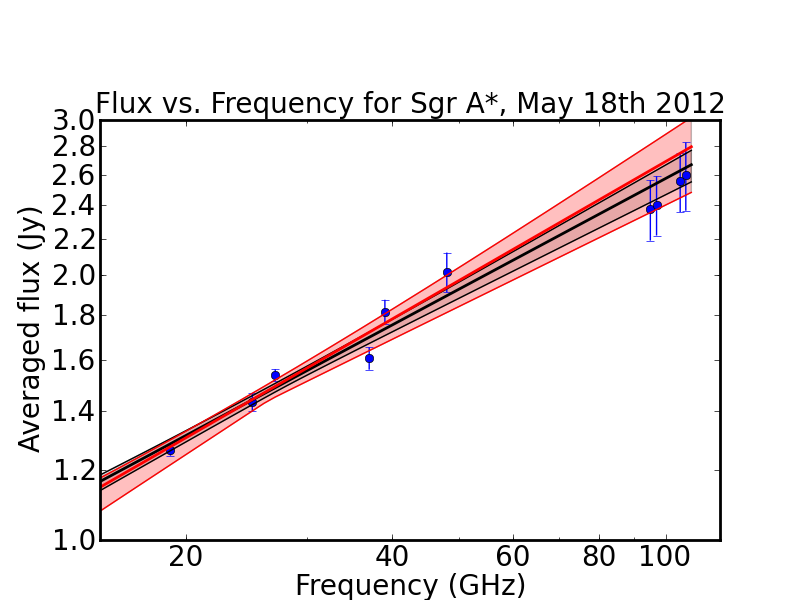
The spectral energy distribution of Sgr A* across the measured frequencies (see Fig. 2) has a spectral index of (with defined as in ) when all data (VLA + ALMA) are used for the spectral fit, and we obtain when only the VLA data are used. While this difference in spectral index cannot be called significant, it hints at a flattening of the spectrum as the submm bump is approached.
The VLA light curves at first sight each show a similar evolution of flux density with time: a rise in flux density level between 7h and 8h/9h UT, and a more slowly diminishing flux density beyond 8h/9h UT. The observed longer-term flux evolution over the full track is overlaid with more rapid variations in measured flux, which occur simultaneously in all frequency bands. These fluctuations are probably caused by atmospheric influence, which causes varying coherence loss as a function of time. The ALMA flux density measurements are highly precise, with a very small spread in visibility values per scan. The time cadence, however, is coarser than it is for the VLA data. Nonetheless, the evolution of flux density with time can be distinguished with high significance. At 100 GHz the flux density evolution is smooth, and there is a local maximum in flux at around 7:45h UT, followed by a later peak around 10:00h UT.
The z-transform discrete correlation function (ZDCF) algorithm (Alexander,, 1997) provides a way to cross-correlate light
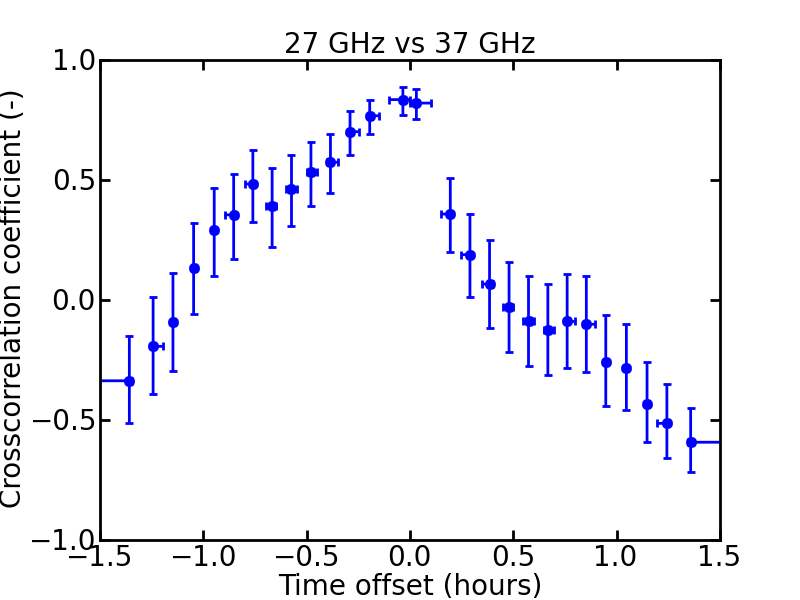
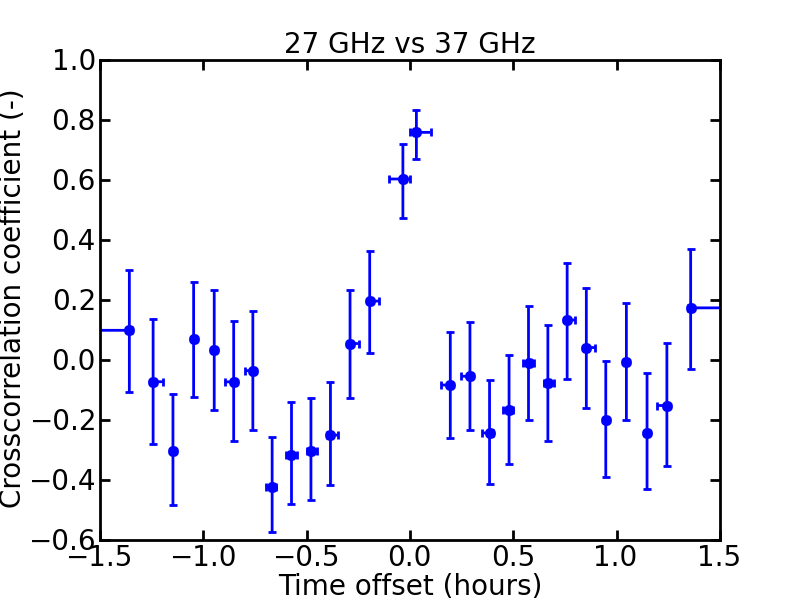
curves that have uneven temporal sampling. This method for finding time lags between the VLA light curves yields a strong zero-lag component in every case (see Fig. 3 for an example), coming from the short-time fluctuations in the data and probably attributable to coherence loss. These zero-time lag spikes tend to dominate the cross-correlation curves. Although skew is apparent in most cross-correlation curves, the zero-lag peaks preclude any meaningful time lag estimates to be made this way. To derive reliable time lag estimates, we chose the simple and robust approach of fitting the longer-term flux density evolution in all light
curves. To establish the times at which flux density maxima occur in these light curves, we fitted a smooth function to this general trend, allowing for different timescales to be associated with the rise and fall. Based on the general shape of the light curves, the choice was made to employ ’fast rise, exponential decay’ (FRED) functions as fitting functions (Bhat et al.,, 1994) (widely used in GRB light curve fitting). These functions consist of the product of two exponentials, involving four free parameters:
| (1) |
where is the maximum value of , and are parameters controlling the slopes of either side of that maximum, and is the value of for which the maximum value is reached. Because the FRED flux density value rises up from zero and returns to zero as its argument is left running, it is not a suitable function to use over time intervals that are too long: we are only interested in using it to fit a local and asymmetric feature in the light curves. To keep the general shape of the light curves sufficiently simple to enable the fit without sacrificing too many data points, we only used the flux density measurements directly around the bump feature (7h - 11h UT for VLA, 6:50 - 8:50 UT for ALMA). Acting on the assumption that this feature in the ALMA light curve can be attributed to the same event in the source that caused the maxima found in the VLA light curves, we used the fitting algorithm on this feature as well.
Variations on shorter timescales in the VLA light curves may affect the fit results. Therefore we also performed the fits using a Monte Carlo approach in which, at random, half of the data points (20 out of 40) for a given VLA light curve were dropped before attempting a fit with the FRED function. For each light
curve, this was iterated 500 times. The resulting times of maxima for all obtained fits were averaged, and the standard deviation of their distribution was calculated. These results are also plotted in Fig. 1, shaded in green. The large standard deviation in the 48 GHz case indicates skew in the range of predictions made by the Monte Carlo method, causing the left limit to fall outside of the data range. High reduced -squared values indicate that we fitted light curves whose evolution is more complicated than can be grasped by a simple function; significant short-term variability remains from imperfect flux calibration. The absolute flux density uncertainties are dominated by the calibration uncertainty of 5 percent for the entire light
curve (not shown in the figure). For most light curves, these results correspond well to the fit for which all data were used. For the light curve at 48 GHz the fits are not as robust. This is most probably due to the relatively strong flux density variations at short timescales for the 48 GHz light curve, combined with the short FRED rise time. The resulting best-fit values and uncertainties for the times of flux density maximum are shown in Fig. 1, and the time lags we found are summarized in Table 1 where the middle column uses all data and the rightmost column uses the average result from the Monte Carlo approach. As the ALMA data does not have many measurements within the relevant time window, the Monte Carlo approach could not be used there.
| Frequency | Time of max (hrs UT) (1) | Time of max (hrs UT) (2) |
|---|---|---|
| 100 GHz | - | |
| 48 GHz | ||
| 39 GHz | ||
| 37 GHz | ||
| 27 GHz | ||
| 25 GHz | ||
| 19 GHz |
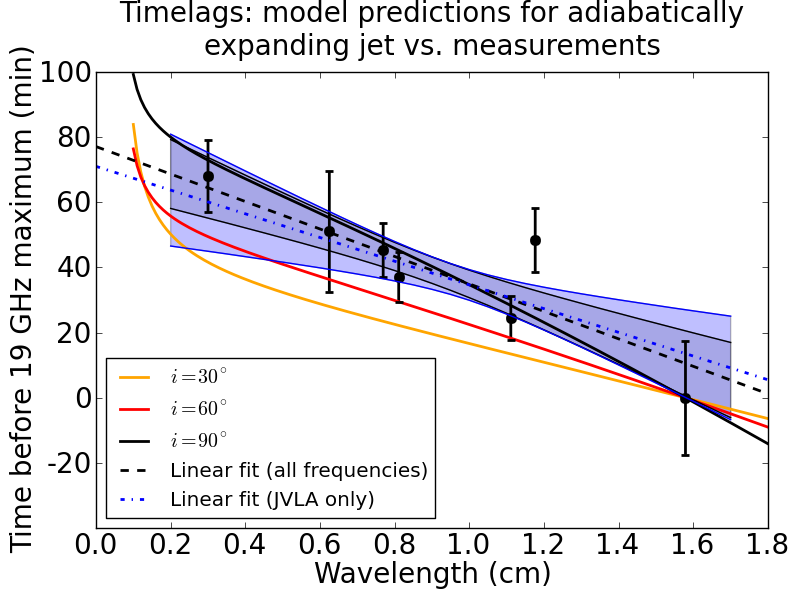
With the 25 GHz data as notable exception, the maxima occur at later times for the lower observing frequencies, which is compatible with a linear relation between observing wavelength and time of maximum flux density. There is always the risk of misinterpreting the ALMA bump at 7:40h UT as being causally connected to the maxima in flux density found in the VLA data. To check whether the VLA data by themselves are consistent with the existence of these time lags, a separate fit was made using only the VLA data (Fig. 4), and the fit results are practically identical to those obtained with the full data set. The time lag expected for the ALMA peak based on the VLA time lag/frequency fit coincides with the measured value, and thus the identification of the ALMA flux density maximum as being related to the VLA flux density maxima seems justified. The fact that the maxima occur at different times for different frequencies also precludes interpreting the observed flux density evolution as being a purely atmospheric or elevation-dependent effect. Any elevation-dependent change in measured flux density would impose a simultaneous rising and falling of all light curves, which is not what we observe.
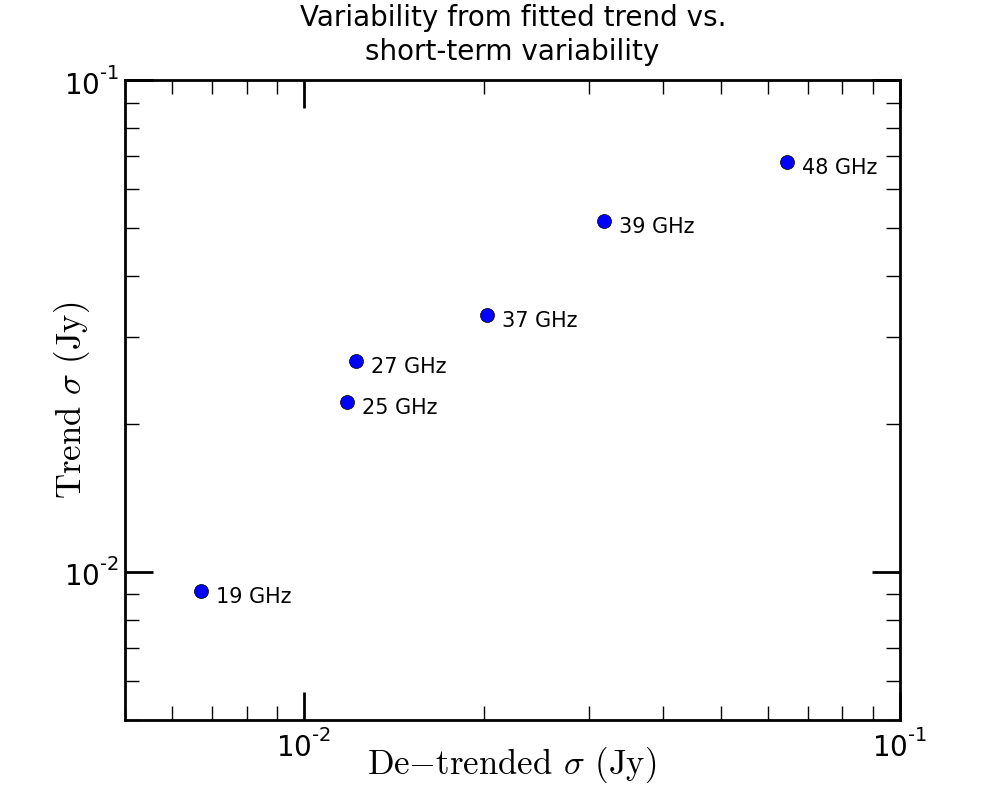
The FRED fits follow the general, long-term trend that is present in the data. In addition to this general trend, all light curves exhibit shorter-timescale fluctuations. Cross-correlation analysis on the original light curves therefore shows correlation contributions from both the general trends in the data and the shorter-timescale fluctuations. If these two variability components do not exhibit the same time lag between frequencies, interpreting the cross-correlation curves is problematic. To deal with this problem, we have subtracted the fitted FRED trends from all light curves and performed a cross-correlation analysis on the de-trended light curves (see Fig. 3). This cross-correlation peaks at zero time lag, suggesting that the short-term fluctuations have a different origin from the long-term trends. The most likely cause of the short-term fluctuations are calibration residuals stemming from phase-coherence loss due to the low elevation of Sgr A* at the VLA site. While there is a correlation between the FRED variability and the residual variability as seen from Fig. 5, this does not imply that they share the same cause. Atmospheric influence is stronger for higher observing frequency, and this effect is unrelated to intrinsic source variability.
4 Discussion and conclusion
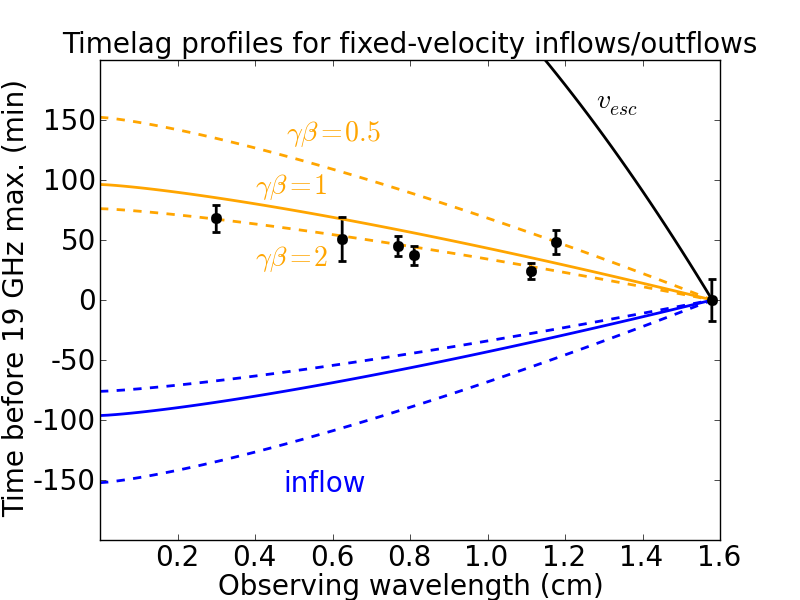
The time lags across this broad range of frequencies corroborate the picture of an expanding plasma flow with a diminishing optical depth over time. When the time lags found in this work are combined with the existing results from Yusef-Zadeh et al., (2006), they are compatible: Yusef-Zadeh et al. reported a time lag between 43 GHz and 22 GHz of 20 to 40 minutes, while we detect a time lag of 28 9 minutes between these two frequencies when we use the linear time lag/wavelength fit based on our measurements (see Fig. 4 and caption).
Measurements on time lags between Sgr A* light curves at 102 and 90 GHz were performed by Miyazaki et al., (2013), and they reported the time delay between 102 GHz and 90 GHz as being min (i.e., the 90 GHz light curve is leading the 102 GHz light curve). The expected time lag between 102 and 90 GHz that would agree with the 43 GHz -22 GHz lag found by Yusef-Zadeh et al., (2006) is quoted as being close to 3 min (with the precise value depending on the index of the power-law distribution in electron energy), whereas an extension of the linear relation we find in this work predicts a time lag between these frequencies of min (this figure increases somewhat if low inclination angles are considered, see Fig. 4). We stress that the models used to predict the time lags are very simple in all cases, and in particular measured time lags between closely neighboring frequencies can deviate from the predicted relation due to more complex plasma flow properties close to the black hole. The Blandford-Königl jet model uses a surface, the location of which along the jet only depends on the accretion rate, and which is constant throughout the jet cross-section. The actual nature of any outflow may locally be of a more chaotic character, with different regions in the jet cross-section having different plasma densities and different optical depths, as is typically witnessed in GRMHD simulations (Mościbrodzka et al.,, 2014). Our measurements, obtained over a broad range of frequencies, are expected to sample a greater spatial range of the proposed outflow. They should hence provide a robust result and a characterization of the behavior of the system as a whole, and we believe this approach warrants the use of a simple outflow model.
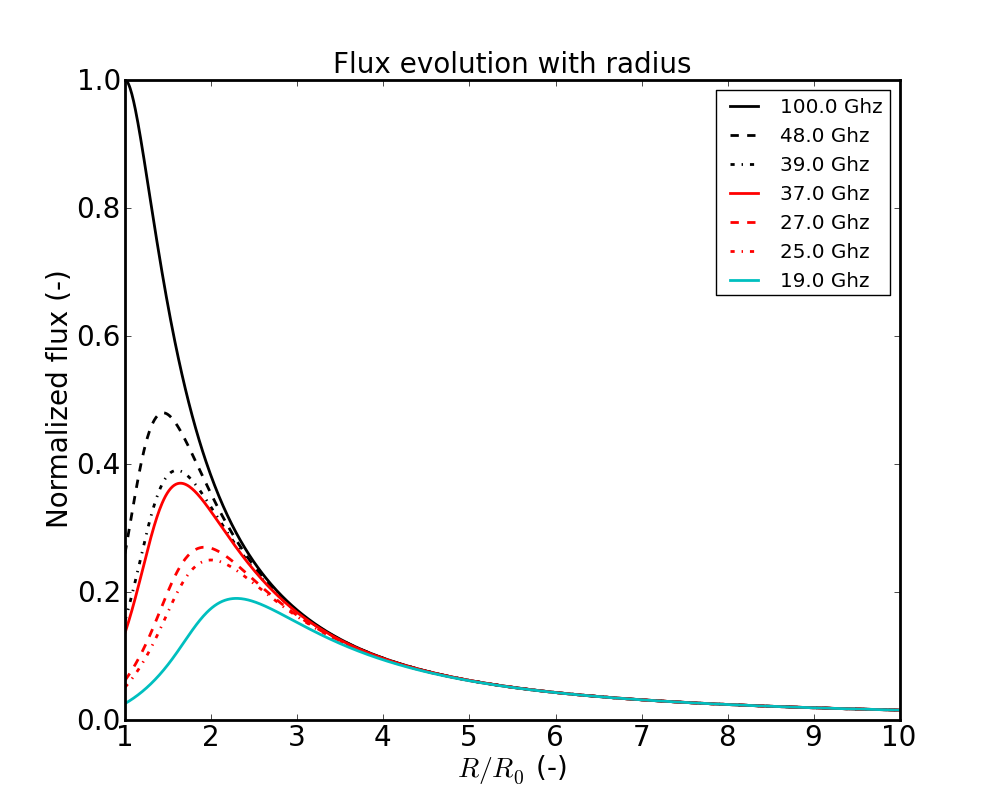
Without source size measurements, many different models of expanding plasma flows can be made to fit our observations. Following the analysis by Yusef-Zadeh et al., (2008), where an adiabatically expanding plasma cloud was used as a model for flare occurrence in Sgr A*, the cloud expands to just 2.3 times the size it initially has at the 100 GHz maximum (see Figs. 6 and 7) for the frequency range we record. The radii at which the lower-frequency emission peaks is only a few times the initial radius (which is taken to be 3 Schwarzschild radii). If we adopt the initial radius of the cloud as being 3 Schwarzschild radii, as was done by Yusef-Zadeh et al., (2008), the associated flow velocities that occur according to this model are only around 3 percent of the speed of light. This is twice the velocity that was found by Yusef-Zadeh et al., (2008).
However, we can use the size-frequency relation of Sgr A* as presented in Falcke et al., 2009b as additional information with which to provide a general estimate of the gas flow velocity. Although we do not have sufficient information to identify the variable emission (that we focus on) with the quiescent emission for which the size-frequency relation holds, considering the two components to reflect the same gas flow is the simplest hypothesis that we can consider. The size-frequency relation describes the measured intrinsic (i.e., corrected for interstellar scattering) size of Sgr A* as a function of observing wavelength, and has the form
| (2) |
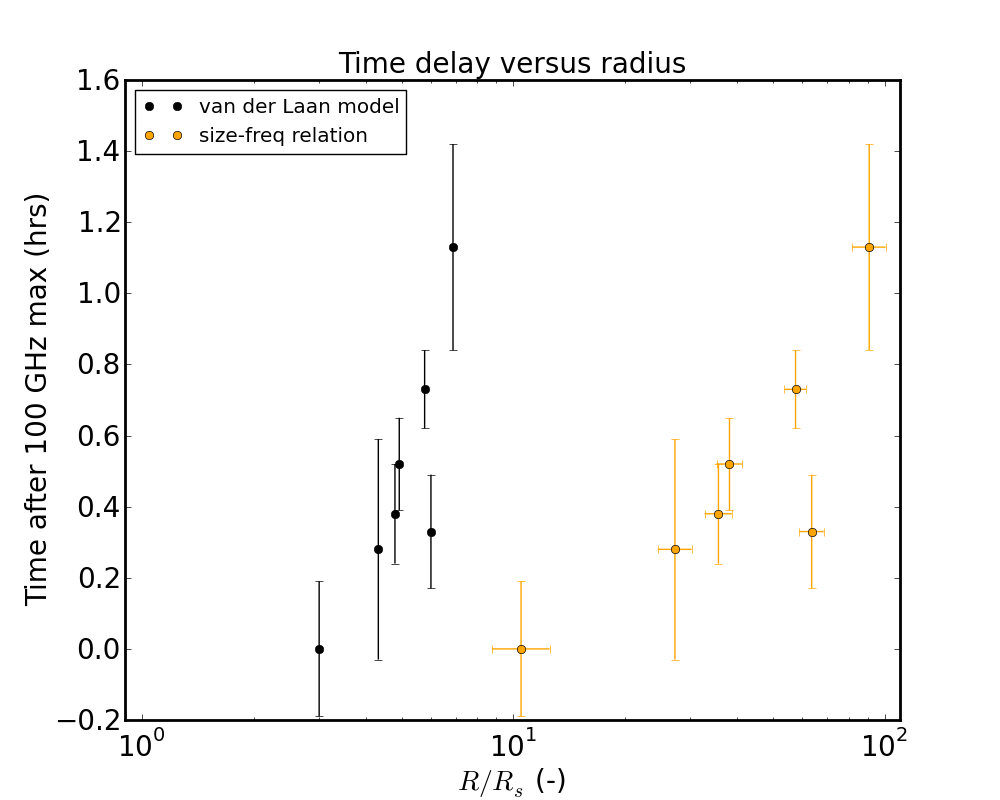
In this expression, is the angular size of Sgr A* on the sky and is the observing wavelength. Combining this (angular) size-frequency relation with an estimate for the distance between Earth and the Galactic center and taking the difference in source size for two observing frequencies, we obtain an expression for the projected source size difference on the sky in length units. When we assume a source inclination of 90∘ and a one-sided outflow interpretation (as was done by Falcke et al., 2009a ), we find that our data suggest an outflow velocity of 0.77 (). Using the variability seen in our measurements (Fig. 5) as a proxy for flare amplitude with the size-frequency relation (Eq. 2), we obtain the data points that are plotted separately in Fig. 6.
Because the source centroid position on the sky as a function of observing frequency is not known, however,we can derive a lower limit on the outflow velocity by assuming identical centroid positions for all observing frequencies. This assumption corresponds to a two-sided jet interpretation (the source grows symmetrically on the sky with lower observing frequency), so for the distance traveled by the gas in one jet we can take half of the intrinsic source size difference. Taking into account the influence of light travel time with different inclination angles yields the following expression for the expected time lag between observing frequencies:
| (3) |
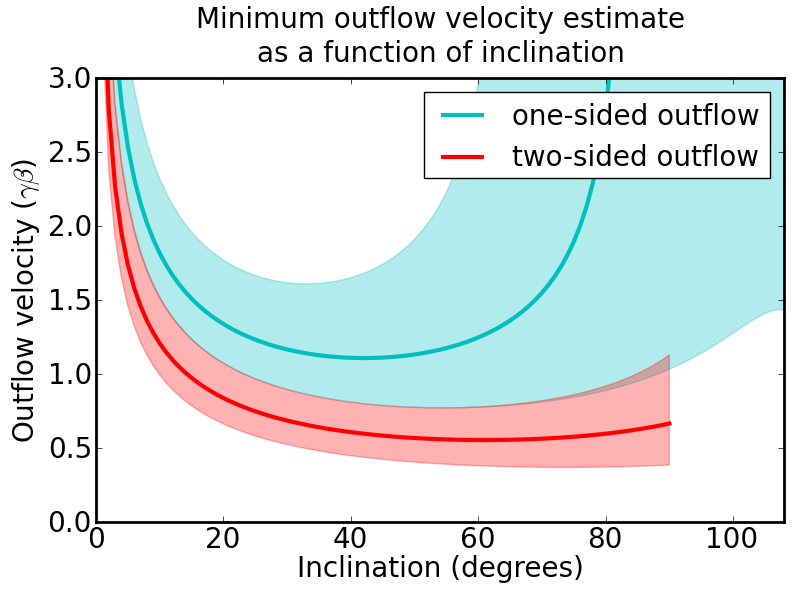
with the time lag between two observing frequencies, the radius difference for the two observing frequencies as calculated using Eq. 2 and our distance to the Galactic center of 8.3 kpc, the inclination angle (angle between the flow vector and the line of sight from Sgr A* to Earth) and the flow velocity. We can express this relation in terms of and combine it with the relation between time lag and wavelength (see Fig. 4). In this way, we can plot the relation between flow velocity estimate and jet inclination angle, where we place the constraint that the flow velocity needs to be positive and lower than the speed of light. Figure 8 shows this dependence and indicates a minimum flow velocity of c () for an inclination of 60∘. Including the light travel time in the calculation breaks the symmetry around an inclination of 90 degrees that would otherwise be present. For the two-sided outflow, we assumed here that the outflow component with an inclination smaller than 90 degrees is the one that is picked up in the time lag measurements. For the two-sided jet interpretation only inclinations close to 90∘ can be modeled reasonably in this way. Inclinations deviating significantly from 90∘ would result in ambiguous time lags because of the different light travel times from the gas in the two jets. For the case of a one-sided jet, where the source only grows toward one side with lower observing frequency, the lower velocity bound is approximately c (). Figure 4 plots the model-predicted time lags for different inclination angles and shows that no strong constraints are posed on the inclination angle by these data.
As these results are based upon measurements of a light-curve feature from a single track, it is prudent to perform this analysis on more light curves as they become available to verify the picture we establish. Although the broad nature of the flux density feature that we used in the FRED fit generally agrees with the result of the ZDCF analysis, light curves with significant flux density changes over shorter timescales would offer an opportunity of using the ZDCF more effectively as an alternative verification of the FRED fitting results. ALMA observations at a higher time cadence taken contemporaneously with VLA observations would facilitate the cross-matching of light-curve features between these frequencies.
To summarize, we have measured time lags in Sgr A* light curves from 100 GHz to 19 GHz using ALMA and the VLA. Higher-frequency light curves are seen to have their maxima at earlier times than the lower-frequency light curves. Coupled to the size-frequency relation for Sgr A*, these measurements indicate a moderately relativistic, directed outflow from Sgr A*.
5 Acknowledgements
This work was performed as part of the Chandra XVP collaboration (see http://www.sgra-star.com/collaboration-members/ for a list of collaboration members). This paper makes use of the following ALMA data: ADS/JAO.ALMA#2011.0.00887.S. ALMA is a partnership of ESO (representing its member states), NSF (USA) and NINS (Japan), together with NRC (Canada) and NSC and ASIAA (Taiwan), in cooperation with the Republic of Chile. The Joint ALMA Observatory is operated by ESO, AUI/NRAO and NAOJ. We thank our referee for providing useful comments that improved the presentation of this paper. Reproduced with permission from Astronomy & Astrophysics, ©ESO.
References
- Alexander, (1997) Alexander, T. (1997). Is AGN Variability Correlated with Other AGN Properties? ZDCF Analysis of Small Samples of Sparse Light Curves. In Maoz, D., Sternberg, A., and Leibowitz, E. M., editors, Astronomical Time Series, volume 218 of Astrophysics and Space Science Library, page 163.
- Bhat et al., (1994) Bhat, P. N., Fishman, G. J., Meegan, C. A., Wilson, R. B., Kouveliotou, C., Paciesas, W. S., Pendleton, G. N., and Schaefer, B. E. (1994). Spectral evolution of a subclass of gamma-ray bursts observed by BATSE. ApJ, 426:604–611.
- Bietenholz et al., (2004) Bietenholz, M. F., Bartel, N., and Rupen, M. P. (2004). The Location of the Core in M81. ApJ, 615:173–180.
- Blandford and Konigl, (1979) Blandford, R. D. and Konigl, A. (1979). Relativistic jets as compact radio sources. ApJ, 232:34–48.
- Bower, (2006) Bower, G. C. (2006). High Resolution Imaging of Sagittarius A*. Journal of Physics Conference Series, 54:370–376.
- Bower et al., (2004) Bower, G. C., Falcke, H., Herrnstein, R. M., Zhao, J.-H., Goss, W. M., and Backer, D. C. (2004). Detection of the Intrinsic Size of Sagittarius A* Through Closure Amplitude Imaging. Science, 304:704–708.
- Bower et al., (2005) Bower, G. C., Falcke, H., Wright, M. C., and Backer, D. C. (2005). Variable Linear Polarization from Sagittarius A*: Evidence of a Hot Turbulent Accretion Flow. ApJ, 618:L29–L32.
- Bower et al., (2006) Bower, G. C., Goss, W. M., Falcke, H., Backer, D. C., and Lithwick, Y. (2006). The Intrinsic Size of Sagittarius A* from 0.35 to 6 cm. ApJ, 648:L127–L130.
- Dexter et al., (2013) Dexter, J., Kelly, B., Bower, G. C., Marrone, D. P., Stone, J., Plambeck, R., and Doeleman, S. S. (2013). An 8 hour characteristic time-scale in submillimetre light curves of Sagittarius A*. ArXiv e-prints.
- Dibi et al., (2013) Dibi, S., Markoff, S., Belmont, R., Malzac, J., Nowak, M., Baganoff, F. K., and Neilsen, J. (2013). Exploring Plasma Evolution During Flares from Sgr A*. In AAS/High Energy Astrophysics Division, volume 13 of AAS/High Energy Astrophysics Division, page 108.14.
- Dodds-Eden et al., (2010) Dodds-Eden, K., Sharma, P., Quataert, E., Genzel, R., Gillessen, S., Eisenhauer, F., and Porquet, D. (2010). Time-Dependent Models of Flares from Sagittarius A*. ApJ, 725:450–465.
- Doeleman et al., (2008) Doeleman, S. S., Weintroub, J., Rogers, A. E. E., Plambeck, R., Freund, R., Tilanus, R. P. J., Friberg, P., Ziurys, L. M., Moran, J. M., Corey, B., Young, K. H., Smythe, D. L., Titus, M., Marrone, D. P., Cappallo, R. J., Bock, D. C.-J., Bower, G. C., Chamberlin, R., Davis, G. R., Krichbaum, T. P., Lamb, J., Maness, H., Niell, A. E., Roy, A., Strittmatter, P., Werthimer, D., Whitney, A. R., and Woody, D. (2008). Event-horizon-scale structure in the supermassive black hole candidate at the Galactic Centre. Nature, 455:78–80.
- Eisenhauer et al., (2003) Eisenhauer, F., Schödel, R., Genzel, R., Ott, T., Tecza, M., Abuter, R., Eckart, A., and Alexander, T. (2003). A Geometric Determination of the Distance to the Galactic Center. ApJ, 597:L121–L124.
- Falcke and Biermann, (1995) Falcke, H. and Biermann, P. L. (1995). The jet-disk symbiosis. I. Radio to X-ray emission models for quasars. AAP, 293:665–682.
- Falcke et al., (1998) Falcke, H., Goss, W. M., Matsuo, H., Teuben, P., Zhao, J.-H., and Zylka, R. (1998). The Simultaneous Spectrum of Sagittarius A * from 20 Centimeters to 1 Millimeter and the Nature of the Millimeter Excess. ApJ, 499:731.
- Falcke et al., (2004) Falcke, H., Körding, E., and Markoff, S. (2004). A scheme to unify low-power accreting black holes. Jet-dominated accretion flows and the radio/X-ray correlation. A&A, 414:895–903.
- Falcke et al., (1993) Falcke, H., Mannheim, K., and Biermann, P. L. (1993). The Galactic Center radio jet. AAP, 278:L1–L4.
- (18) Falcke, H., Markoff, S., and Bower, G. C. (2009a). Jet-lag in Sagittarius A*: what size and timing measurements tell us about the central black hole in the Milky Way. A&A, 496:77–83.
- (19) Falcke, H., Markoff, S., and Bower, G. C. (2009b). Jet-lag in Sagittarius A*: what size and timing measurements tell us about the central black hole in the Milky Way. A&A, 496:77–83.
- Falcke and Markoff, (2013) Falcke, H. and Markoff, S. B. (2013). Toward the event horizon - the supermassive black hole in the Galactic Center. Classical and Quantum Gravity, 30(24):244003.
- Falcke et al., (2000) Falcke, H., Melia, F., and Agol, E. (2000). Viewing the Shadow of the Black Hole at the Galactic Center. ApJ, 528:L13–L16.
- Genzel et al., (2010) Genzel, R., Eisenhauer, F., and Gillessen, S. (2010). The Galactic Center massive black hole and nuclear star cluster. Reviews of Modern Physics, 82:3121–3195.
- Ghez et al., (2008) Ghez, A. M., Salim, S., Weinberg, N. N., Lu, J. R., Do, T., Dunn, J. K., Matthews, K., Morris, M. R., Yelda, S., Becklin, E. E., Kremenek, T., Milosavljevic, M., and Naiman, J. (2008). Measuring Distance and Properties of the Milky Way’s Central Supermassive Black Hole with Stellar Orbits. ApJ, 689:1044–1062.
- Gillessen et al., (2009) Gillessen, S., Eisenhauer, F., Trippe, S., Alexander, T., Genzel, R., Martins, F., and Ott, T. (2009). Monitoring Stellar Orbits Around the Massive Black Hole in the Galactic Center. ApJ, 692:1075–1109.
- Hada et al., (2011) Hada, K., Doi, A., Kino, M., Nagai, H., Hagiwara, Y., and Kawaguchi, N. (2011). An origin of the radio jet in M87 at the location of the central black hole. Nature, 477:185–187.
- Li et al., (2013) Li, Z., Morris, M. R., and Baganoff, F. K. (2013). Evidence for a Parsec-scale Jet from the Galactic Center Black Hole: Interaction with Local Gas. ApJ, 779:154.
- Lo et al., (1981) Lo, K. Y., Cohen, M. H., Readhead, A. S. C., and Backer, D. C. (1981). Multiwavelength VLBI observations of the galactic center. ApJ, 249:504–512.
- Markoff, (2005) Markoff, S. (2005). Exploring the Jet/Accretion Flow Relationship in low Disk Luminosity Sources. Ap&SS, 300:189–195.
- Markoff et al., (2001) Markoff, S., Falcke, H., Yuan, F., and Biermann, P. L. (2001). The Nature of the 10 kilosecond X-ray flare in Sgr A*. A&A, 379:L13–L16.
- Marrone et al., (2007) Marrone, D. P., Moran, J. M., Zhao, J.-H., and Rao, R. (2007). An Unambiguous Detection of Faraday Rotation in Sagittarius A*. ApJ, 654:L57–L60.
- Merloni et al., (2003) Merloni, A., Heinz, S., and di Matteo, T. (2003). A Fundamental Plane of black hole activity. MNRAS, 345:1057–1076.
- Miyazaki et al., (2013) Miyazaki, A., Tsuboi, M., and Tsutsumi, T. (2013). Time Lag in the Intra-Day Variability of Sagittarius A∗ between Light Curves at 90 and 102 GHz. PASJ, 65:L6.
- Mościbrodzka and Falcke, (2013) Mościbrodzka, M. and Falcke, H. (2013). Coupled jet-disk model for Sagittarius A*: explaining the flat-spectrum radio core with GRMHD simulations of jets. A&A, 559:L3.
- Mościbrodzka et al., (2014) Mościbrodzka, M., Falcke, H., Shiokawa, H., and Gammie, C. F. (2014). Observational appearance of inefficient accretion flows and jets in 3D GRMHD simulations: Application to Sagittarius A*. A&A, 570:A7.
- Narayan et al., (1995) Narayan, R., Yi, I., and Mahadevan, R. (1995). Explaining the spectrum of Sagittarius A∗ with a model of an accreting black hole. Nature, 374:623–625.
- Özel et al., (2000) Özel, F., Psaltis, D., and Narayan, R. (2000). Hybrid Thermal-Nonthermal Synchrotron Emission from Hot Accretion Flows. ApJ, 541:234–249.
- Plotkin et al., (2012) Plotkin, R. M., Markoff, S., Kelly, B. C., Körding, E., and Anderson, S. F. (2012). Using the Fundamental Plane of black hole activity to distinguish X-ray processes from weakly accreting black holes. MNRAS, 419:267–286.
- Reid and Brunthaler, (2004) Reid, M. J. and Brunthaler, A. (2004). The Proper Motion of Sagittarius A*. II. The Mass of Sagittarius A*. APJ, 616:872–884.
- Shen et al., (2005) Shen, Z.-Q., Lo, K. Y., Liang, M.-C., Ho, P. T. P., and Zhao, J.-H. (2005). A size of ~1AU for the radio source Sgr A* at the centre of the Milky Way. Nature, 438:62–64.
- van der Laan, (1966) van der Laan, H. (1966). A Model for Variable Extragalactic Radio Sources. Nature, 211:1131.
- van Langevelde et al., (1992) van Langevelde, H. J., Frail, D. A., Cordes, J. M., and Diamond, P. J. (1992). Interstellar scattering toward the Galactic center as probed OH/IR stars. ApJ, 396:686–695.
- Yuan et al., (2003) Yuan, F., Quataert, E., and Narayan, R. (2003). Nonthermal Electrons in Radiatively Inefficient Accretion Flow Models of Sagittarius A*. ApJ, 598:301–312.
- Yusef-Zadeh et al., (2012) Yusef-Zadeh, F., Arendt, R., Bushouse, H., Cotton, W., Haggard, D., Pound, M. W., Roberts, D. A., Royster, M., and Wardle, M. (2012). A 3 pc Scale Jet-driven Outflow from Sgr A*. ApJ, 758:L11.
- Yusef-Zadeh et al., (2006) Yusef-Zadeh, F., Roberts, D., Wardle, M., Heinke, C. O., and Bower, G. C. (2006). Flaring Activity of Sagittarius A* at 43 and 22 GHz: Evidence for Expanding Hot Plasma. ApJ, 650:189–194.
- Yusef-Zadeh et al., (2008) Yusef-Zadeh, F., Wardle, M., Heinke, C., Dowell, C. D., Roberts, D., Baganoff, F. K., and Cotton, W. (2008). Simultaneous Chandra, CSO, and VLA Observations of Sgr A*: The Nature of Flaring Activity. ApJ, 682:361–372.