Deconstructing Thermal Sunyaev-Zel’dovich – Gravitational Lensing Cross-Correlations: Implications for the Intracluster Medium
Abstract
Recent first detections of the cross-correlation of the thermal Sunyaev-Zel’dovich (tSZ) signal in Planck cosmic microwave background (CMB) temperature maps with gravitational lensing maps inferred from the Planck CMB data and the CFHTLenS galaxy survey provide new probes of the relationship between baryons and dark matter. Using cosmological hydrodynamics simulations, we show that these cross-correlation signals are dominated by contributions from hot gas in the intracluster medium (ICM), rather than diffuse, unbound gas located beyond the virial radius (the “missing baryons”). Thus, these cross-correlations offer a tool with which to study the ICM over a wide range of halo masses and redshifts. In particular, we show that the tSZ – CMB lensing cross-correlation is more sensitive to gas in lower-mass, higher-redshift halos and gas at larger cluster-centric radii than the tSZ – galaxy lensing cross-correlation. Combining these measurements with primary CMB data will constrain feedback models through their signatures in the ICM pressure profile. We forecast the ability of ongoing and future experiments to constrain such ICM parameters, including the mean amplitude of the pressure – mass relation, the redshift evolution of this amplitude, and the mean outer logarithmic slope of the pressure profile. The results are promising, with % precision constraints achievable with upcoming experiments, even after marginalizing over cosmological parameters.
Subject headings:
Cosmic Microwave Background — Cosmology: Theory — Galaxies: Clusters: General — Large-Scale Structure of Universe — Methods: Numerical1. Introduction
Modeling the thermodynamic and dark matter (DM) properties of halos as structure grows in the Universe is fundamental to our understanding of the physics involved in galaxy formation and cosmology. In a simple model for cosmological structure formation, the thermal properties of the gas in massive halos (), known as the intracluster medium (ICM), are determined by the DM-dominated gravitational potential through spherical collapse (Kaiser, 1986). Such a model predicts self-similar scalings of the global thermodynamic properties of halos as a function of their mass and redshift. Invoking equilibrium and symmetry arguments along with the shape of the gravitational potential, one can extend this model to predict radial ICM profiles, such as the entropy profile (e.g., Voit et al., 2002; Cavaliere et al., 2009) or pressure profile (e.g., Komatsu & Seljak, 2001; Ostriker et al., 2005). However, observations (e.g., Horner, 2001; Vikhlinin et al., 2006) provide significant evidence that non-thermal processes such as star formation, radiative cooling, turbulence, and feedback contribute to the energetics of the ICM. In cosmological hydrodynamic simulations, these processes are modeled with sub-grid methods (e.g., Lewis et al., 2000; Springel & Hernquist, 2003a; Nagai, 2006; Sijacki et al., 2007; Booth & Schaye, 2009; Dubois et al., 2012) and calibrated to measurements of halo properties at low redshifts. Proper calibration of these sub-grid models requires observables that are sensitive to the thermodynamic properties across decades in halo mass and out to high redshift.
Secondary anisotropies of the cosmic microwave background (CMB) contain an abundance of cosmological and astrophysical information at . Due to advances in resolution and sensitivity achieved by recent CMB experiments, such as the Atacama Cosmology Telescope (ACT/ACTPol, Swetz et al., 2011; Niemack et al., 2010), the South Pole Telescope (SPT/SPTPol, Carlstrom et al., 2011; Austermann et al., 2012), the Planck satellite (Planck Collaboration et al., 2014a), and Polarbear (Kermish et al., 2012), it is now possible to extract this information. The secondary anisotropies of interest in this work are those sourced by the thermal Sunyaev-Zel’dovich (tSZ) effect and gravitational lensing.
The tSZ effect is the Compton up-scattering of CMB photons by hot electrons, leading to a unique spectral distortion in the CMB that is negative at frequencies below GHz and positive at higher frequencies (Sunyaev & Zeldovich, 1970). The amplitude of this distortion, sometimes known as the “Compton-” signal, is proportional to the electron pressure integrated along the line of sight. As a result, the largest tSZ signals arise from electrons in the ICM of massive galaxy clusters. Several hundred new massive clusters have been detected in blind mm-wave surveys via the tSZ effect (e.g., Hasselfield et al., 2013; Planck Collaboration et al., 2014b; Bleem et al., 2014), and the tSZ signal has now been observed at lower mass scales through stacking microwave maps on the locations of groups and massive galaxies (e.g., Hand et al., 2011; Planck Collaboration et al., 2013c; Greco et al., 2014). The tSZ effect has also been measured statistically in the power spectrum (e.g. Dunkley et al., 2011; Reichardt et al., 2012; Sievers et al., 2013; Planck Collaboration et al., 2013a; George et al., 2014), bispectrum or skewness (Wilson et al., 2012; Crawford et al., 2014), and the temperature histogram (Hill et al., 2014). However, uncertainties in ICM modeling limit the ability to use these statistical measurements to constrain cosmological parameters (e.g., Hill & Pajer, 2013; McCarthy et al., 2014). For example, at angular scales of half the power in the tSZ auto-spectrum comes from low-mass halos () and high redshifts () (e.g., Trac et al., 2011; Battaglia et al., 2012b). Additional uncertainties arise due to the modeling of other secondaries, such as the kinetic SZ effect, cosmic infrared background (CIB), radio sources, and the correlation between the CIB and tSZ signals.
The CMB lensing signal originates from the deflection of CMB photons by the gravitational field of matter located between the surface of last scattering and our telescopes. These deflections are small coherent distortions of roughly degree-scale CMB patches by arcminutes. It is possible to reconstruct the lensing potential from the statistical anisotropy induced by lensing in the small-scale power spectrum (e.g., Okamoto & Hu, 2003). Similar to the recent advances in tSZ observations, CMB lensing has experienced a rapid growth from the first detections in cross- (Smith et al., 2007; Hirata et al., 2008) and auto-correlation (Das et al., 2011; van Engelen et al., 2012) to the full-sky reconstruction of the lensing potential by Planck (Planck Collaboration et al., 2014e), as well as the first detections of polarization lensing (Hanson et al., 2013; POLARBEAR Collaboration et al., 2013; The Polarbear Collaboration: P. A. R. Ade et al., 2014; van Engelen et al., 2014; Story et al., 2014). The CMB lensing signal is a robust tracer of the large-scale matter density field. Thus, it correlates with a variety of halo populations over a wide redshift range (e.g. Sherwin et al., 2012; Bleem et al., 2012; Holder et al., 2013; Planck Collaboration et al., 2014f).
In addition to lensing of the CMB, weak gravitational lensing of light from background galaxies provides another tracer of the underlying matter density field (e.g., Tyson et al., 1984; Kaiser, 1992). The galaxy weak lensing signal appears as small but coherent distortions (“shear”) in galaxy shapes resulting from the gravitational deflection of light by intervening lenses along the line of sight. Matter over-densities produce tangentially oriented shear correlations. From the measured shear field, one can reconstruct a map of the lensing convergence. For a thorough review of weak lensing theory and observations, see Bartelmann & Schneider (2001). Weak lensing is now the focus of a number of current and future galaxy surveys aiming to constrain the nature of dark energy (e.g., Erben et al., 2013; The Dark Energy Survey Collaboration, 2005; HSC Science Collaboration, 2012; LSST Science Collaboration et al., 2009; Laureijs et al., 2011; Spergel et al., 2013). Due to the different depths and galaxy populations probed, these surveys are sensitive to cosmic structure over different redshift ranges. Thus, cross-correlating other tracers with the different lensing convergence maps allows for tomography, an idea that we take advantage of below.
In this paper, we explore cross-correlations of the tSZ signal, which probes the ICM, and the weak lensing signals from the CMB and galaxies, which probe the matter distribution. We generally work with cross-power spectra in Fourier space, alleviating the effect of correlated errors present in real-space cross-correlation functions. Early work on this topic focused on signal-to-noise estimates for then-upcoming CMB experiments such as WMAP and Planck using simple theoretical models (Goldberg & Spergel, 1999; Cooray & Hu, 2000; Cooray et al., 2000; Cooray, 2000). Recently, two measurements of tSZ – lensing cross-correlations have been presented using the CMB data that was forecasted in the early studies. Hill & Spergel (2014) constructed a Compton- map from the public Planck data (Planck Collaboration et al., 2014c) and cross-correlated it with the public CMB lensing potential map from Planck (Planck Collaboration et al., 2014e). Interpreting the measured cross-power spectrum using analytic halo model calculations, they placed competitive constraints on the cosmological parameters and (assuming a fixed ICM physics model) and constraints on the ICM model (for a fixed background cosmology, with consistent results assuming either a WMAP9 or Planck best-fit cosmology). An independent Compton- map was constructed from the public Planck data (Planck Collaboration et al., 2014c) by Van Waerbeke et al. (2014), who measured its cross-correlation with galaxy lensing shear maps from the Canada-France-Hawaii Telescope Legacy Survey (CFHTLenS) (Erben et al., 2013; Van Waerbeke et al., 2013). From the measured real-space correlation function, Van Waerbeke et al. (2014) placed constraints on the gas fraction outside of halos. In a follow-up analysis, Ma et al. (2014) interpreted the same measurement using halo model calculations to claim the detection of a gas pressure profile in disagreement with that seen in X-ray observations of massive galaxy clusters at (Arnaud et al., 2010).
We re-examine the interpretation of both cross-correlation measurements in this paper using the cosmological hydrodynamics simulations described in Battaglia et al. (2010). Furthermore, we assess the validity of the analytic halo model calculations used previously to interpret the measurements by comparing them to the simulations. Previous theoretical work on this topic focused on statistical moments (Munshi et al., 2014) and tomography (Pratten & Munshi, 2014). Here we focus specifically on the predictions of different ICM models for the tSZ – lensing cross-correlations, while self-consistently considering the influence of cosmological parameter variations. The interpretation of these cross-correlations in terms of ICM physics has important implications for understanding the discrepancy between cosmological parameters inferred from tSZ statistics (e.g., Sievers et al., 2013; Planck Collaboration et al., 2013a; George et al., 2014; Hill et al., 2014; McCarthy et al., 2014) and from the primordial CMB anisotropies (e.g., Planck Collaboration et al., 2014d). Moreover, in addition to re-interpreting the results of Hill & Spergel (2014) and Van Waerbeke et al. (2014), we also look ahead to upcoming measurements.
The capability to cross-correlate large areas of sky with high-quality lensing and CMB data will soon be possible. Near-future high-resolution CMB experiments on the ground, such as AdvACT (e.g. Calabrese et al., 2014) and SPT-3G (Benson et al., 2014) will provide higher signal-to-noise multi-frequency maps across large areas of sky, which should further improve the signal to noise in future Compton- maps. When forecasting future measurements, we assume that the signal-to-noise of the Compton- map will improve by a factor of , representing the raw increase in data volume from the Planck nominal mission data (Planck Collaboration et al., 2014a) used in Hill & Spergel (2014) and Van Waerbeke et al. (2014) to the final Planck results. CMB lensing reconstruction will also improve substantially with upcoming experiments — for example, AdvACT should detect the CMB lensing power spectrum at signal-to-noise . Galaxy lensing advances will be made over the pioneering work of the CFHTLenS survey. Ongoing experiments include the Dark Energy Survey (DES, The Dark Energy Survey Collaboration, 2005) and Hyper Suprime Cam (HSC, HSC Science Collaboration, 2012) imaging surveys, which will cover more area and image fainter galaxies than CFHTLenS. In the next decade, experiments such as the Large Synoptic Survey Telescope (LSST, LSST Science Collaboration et al., 2009), the Euclid satellite (Laureijs et al., 2011), and the Wide-Field InfraRed Survey Telescope (WFIRST, Spergel et al., 2013) will provide further increases in sky area and signal-to-noise. Looking ahead to the shear maps from these surveys, the signal-to-noise of the tSZ – galaxy lensing cross-correlations will be immense. Understanding these measurements will require further theoretical modeling of the gas and mass distributions in halos.
This paper is organized as follows. In Section 2, we describe theoretical models for tSZ – lensing cross-correlations, using both analytic calculations and numerical simulations. Section 3 compares simulations and analytic calculations of the cross-spectra and deconstructs these signals as a function of ICM physics model, halo mass, redshift, and cluster-centric radius. In Section 4, we compare the simulations and analytic results to measurements of the tSZ – lensing cross-correlations. Section 5 forecasts the constraints on ICM and cosmological parameters from future experiments. We present our conclusions in Section 6.
We adopt a flat CDM cosmology throughout. Note all masses quoted in this work are given relative to , where , unless stated otherwise. For compactness, we denote the tSZ – CMB lensing cross-correlation as and the tSZ – galaxy lensing cross-correlation as .
2. Methodology
The cross-correlation between the tSZ effect and weak lensing probes the relationship between hot, ionized gas and gravitational potential. The signal strength of the tSZ spectral distortion in the observed CMB temperature is a function of frequency and the Compton- parameter:
| (1) |
where , , is Boltzmann’s constant, and is the CMB temperature. We neglect relativistic corrections to the tSZ spectral function (e.g., Nozawa et al., 2006), as the tSZ – lensing cross-correlations are dominated by halos for which these corrections are negligible (see Section 3.3). The magnitude of is a function of the integrated electron pressure along the line of sight:
| (2) |
where is the Thomson scattering cross-section, is the electron mass, is the speed of light, is the number density of free electrons, is the physical line of sight distance, and . Here the temperature of the free electrons, , is much greater than the CMB temperature, , so . For an ideal gas, , so . For a fully ionized and ion-equilibrated plasma, the integrated parameter probes the total thermal energy in a halo. Thus, measurements of are essential to understanding the thermodynamic properties of the baryons inside halos.
As photons travel toward an observer, their path is bent by the gravitational field sourced by matter along the line of sight. If these deflections are in the weak-field regime, this effect is known as weak gravitational lensing. To calculate this weak lensing signal we use the thin lens limit, where the thickness of the gravitational lens is much smaller than both the distances between the observer and lens and the lens and background source (CMB or galaxies). We parameterize the weak lensing signal by the lensing convergence , where denotes the choice of background photon field (i.e., the CMB or galaxies). The convergence is a function of the projected mass along the line of sight and a lensing kernel,
| (3) |
where is the physical matter density (DM, gas, and stars), is the mean physical matter density at redshift , and is the lensing kernel. For galaxy lensing, the kernel is (in physical units)
| (4) |
where is the gravitational constant, is the redshift distribution of source galaxies (normalized to have unit integral), and is the comoving distance to redshift . The properties of this kernel depend on the imaging survey under consideration. For the completed CFHTLenS survey, we use the shown in Fig. 1 of Van Waerbeke et al. (2014). For surveys where observations are ongoing or have not started, we estimate as
| (5) |
where for HSC, DES, and LSST (we refer to these surveys as “HSC-like” in figures). For Euclid we choose such that it matches CFHTLenS (Laureijs et al., 2011). Thus, we have both low- and high-redshift lensing surveys when combining measurements in the forecasts presented in Sec. 5.
The CMB lensing kernel is a special case of Eq. 4 in which the source distribution is replaced by a single source at , i.e., , where is the Dirac delta function. Thus, the kernel simplifies to
| (6) |
where . This kernel peaks at and thus it probes higher redshift halos than those probed by any of the galaxy lensing kernels.
Lensing quantities can be equivalently represented via the lensing potential , which is related to the lensing convergence through the relation
| (7) |
where is line of sight unit vector and is the two-dimensional Laplacian in the plane of the sky. We choose to work in terms of in our calculations, converting from to in multipole space where the conversion is trivial, .
2.1. Analytic halo model calculations
For the analytic calculation of the angular power spectrum of and , we use the halo model formalism (e.g., Cole & Kaiser, 1988), as is standard for such calculations (e.g., Komatsu & Seljak, 2002; Hill & Pajer, 2013; Hill & Spergel, 2014; Ma et al., 2014). As shown in Hill & Spergel (2014), the total cross-power spectrum () has contributions from both the one-halo () and two-halo () terms,
| (8) |
where refers to the lensing field considered in the cross-correlation. We denote the cross-power spectrum for as and that for as .
The term is modeled as a randomly distributed Poisson process on the sky. In the flat-sky limit,
| (9) |
where is the comoving volume per steradian, is the halo mass function, and and are the two-dimensional Fourier transforms of the Compton- and lensing convergence profiles, respectively. The mass in Eq. 9 is the virial mass as defined in Bryan & Norman (1998). The mass function used is from Tinker et al. (2008) and the details of the calculations can be found in Hill & Pajer (2013) and Hill & Spergel (2014). The convergence profile and conversions between mass definitions are calculated assuming an NFW density profile (Navarro et al., 1997) and the concentration-mass relation from Duffy et al. (2008). For the Compton- profile we use a parametrized pressure profile fit to the AGN feedback simulations described below. Full details of the fit can be found in Battaglia et al. (2012b). The profile is given by
| (10) |
where , , , , and are parameters with power-law dependences on mass and redshift, and is the self-similar amplitude for pressure at (Kaiser, 1986; Voit, 2005):
| (11) |
Here, is the cluster-centric radius enclosing a mass such that the mean enclosed density is times the critical density at the cluster redshift, , where , , and are the fractions of the critical density today in matter, vacuum energy, and baryons, respectively.
Later in the paper, we allow for freedom in the gas physics model by letting the normalized amplitude and power-law redshift dependence of vary, i.e.,
| (12) | ||||
where the specific numbers are from the fitting function presented in Battaglia et al. (2012b), including the fiducial value of . The fiducial value of is simply with this definition. We allow for further freedom in the gas pressure profile by also allowing the amplitude of the outer logarithmic slope to vary in the same manner as in Eq. 12:
| (13) |
where the specific numbers are from the fitting function presented in Battaglia et al. (2012b), including the fiducial value of .
The term describes the clustering of the sources responsible for the tSZ and lensing fields (Komatsu & Kitayama, 1999). In the Limber approximation, which is highly accurate for the multipole range of interest here (), the two-halo term is (Hill & Pajer, 2013):
| (14) | ||||
where is the linear matter power spectrum computed using CAMB111http://camb.info/ and is the linear halo bias from Tinker et al. (2010). Our integration limits are (or the upper redshift limit of the source galaxy distribution in the galaxy lensing case) and . We verify that all integrals converge with these limits.
2.2. Simulations
We simulated cosmological volumes ( Mpc) using a modified version of the GADGET-2 smoothed particle hydrodynamics (SPH) code (Springel, 2005). This version of the GADGET-2 code includes sub-grid models for active galactic nuclei (AGN) feedback (Battaglia et al., 2010), radiative cooling, star formation, galactic winds, supernova feedback (Springel & Hernquist, 2003b), and cosmic ray physics (Pfrommer et al., 2006; Enßlin et al., 2007; Jubelgas et al., 2008). We used three variants of sub-grid models listed in order of increasing complexity:
-
•
The non-radiative model with only gravitational heating (referred to as shock heating).
-
•
The model with radiative cooling, star formation, galactic winds, supernova feedback, and cosmic ray physics (referred to as radiative cooling).
-
•
The radiative cooling model with the addition of AGN feedback (referred to as AGN feedback).
Note that the shock heating model is not presented as a viable alternative to the other models, but as an extreme ICM model, since it has been shown to be significantly discrepant with group and cluster observations (e.g., Puchwein et al., 2008; McCarthy et al., 2011; Hajian et al., 2013; Hill & Spergel, 2014). We ran a suite of simulations from ten unique initial conditions for each sub-grid model. The box sizes were 165 Mpc, with a resolution of 2563 gas and DM particles, corresponding to a mass resolution of and . The cosmological parameters used for these simulations were , , , , , and . The AGN feedback model has subsequently been found to agree with local tSZ measurements of high-mass cluster pressure profiles (Planck Collaboration et al., 2013b) and higher redshift X-ray measurements of massive cluster pressure profiles (McDonald et al., 2014). Additionally, it is consistent with measurements of the stellar and gas content in low-redshift clusters (Battaglia et al., 2013), as well as the pressure profile inferred from X-ray stacking of low-redshift groups (Sun et al., 2011). Unless stated otherwise, we use the AGN feedback simulations as our fiducial sub-grid model.
:
:
We calculate the tSZ – lensing cross-power spectra from the simulations as follows. Maps of the Compton- (Eq. 2) and the lensing convergence (Eq. 3) signals are made at each redshift snapshot, from . We compute the cross-power spectrum for each redshift output from the and maps and then average the cross-power spectra over the ten initial condition realizations. These average spectra are then summed over redshift222The simulations are written out at redshifts such that the step size equals the light crossing time of the simulation box length; thus, the total power spectrum is the sum of the differential power spectra.. The advantages of this procedure are that it decreases the variance of the power spectrum and uses all the information within the simulation volume. Additionally, any correlations between different redshift slices are ignored, as effectively happens in nature, since the sum over redshift slices is taken after computing the power spectra.
In each simulation, halo identification and characterization are required in order to calculate the cross-spectra as a function of halo mass, redshift, and cluster-centric radius. First, we find halos using a friends-of-friends algorithm (Huchra & Geller, 1982). Then we iteratively compute each halo’s center of mass and finally its spherical overdensity mass () and radius (), as defined above. This procedure is performed at each redshift slice in the simulations. We use the resulting halo catalogs and their properties to deconstruct the tSZ – lensing cross-spectra.
3. Theory Results
Cross-correlations of the Compton- distortion and lensing fields are strong functions of cosmological parameters and halo properties (Hill & Spergel, 2014; Van Waerbeke et al., 2014, and Sec. 2.1). Here, we fix the cosmological parameters to the values used in the simulations and exclusively quantify the dependence of the and cross-spectra signals on the properties of gas, stars, and DM in halos. We compare the cross-spectra from the AGN feedback simulations described in Sec. 2.2 to the analytic calculations described in Sec. 2.1 and interpret the resulting differences. We then use the full suite of simulations to deconstruct the contributions to the tSZ – lensing cross-spectra as functions of ICM model, halo mass, redshift, and cluster-centric radius in order to better understand the physical origins of these cross-spectra.
3.1. Comparison of the halo model to simulations
To perform a like-for-like comparison between the halo model and the simulations, we implement the simulations’ cosmological parameters (see Sec. 2.2) and lower redshift cut at in the analytic calculations333The cut in the simulation calculations is necessary to reduce sample variance from rare, massive clusters in the derived power spectra (Shaw et al., 2009).. Furthermore, as described above, the analytic calculations use the pressure profile model derived from the AGN feedback simulations. Thus, any differences in the power spectra computed from these simulations and those computed from the halo model can only be due to quantities neglected in the halo model approximations, such as contributions from diffuse, unbound gas (e.g., in filaments) and changes to the halo density profile and halo mass function induced by baryonic effects. As a check on our calculations, we verify that the CFHTLenS auto-power spectrum computed from either the analytic calculations or the simulations agrees with that computed using the nicaea code444http://www.cosmostat.org/nicaea.html (and with one another). The agreement is nearly perfect in the linear regime and reasonably close in the non-linear regime, where baryonic effects could also be at work (more detail will be discussed in Battaglia, 2014).
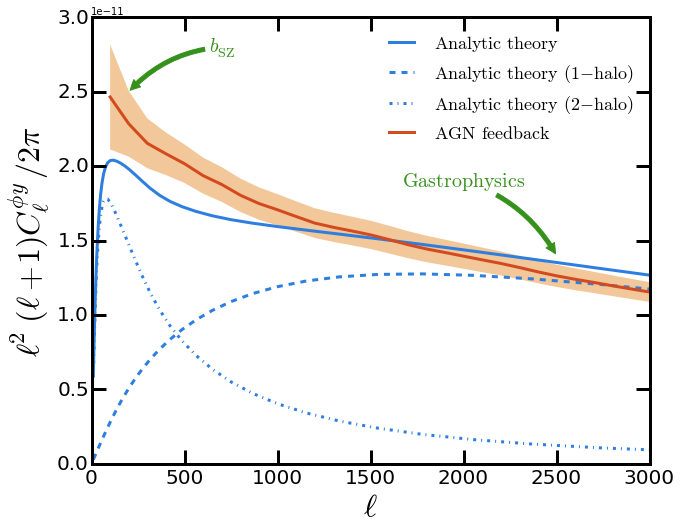
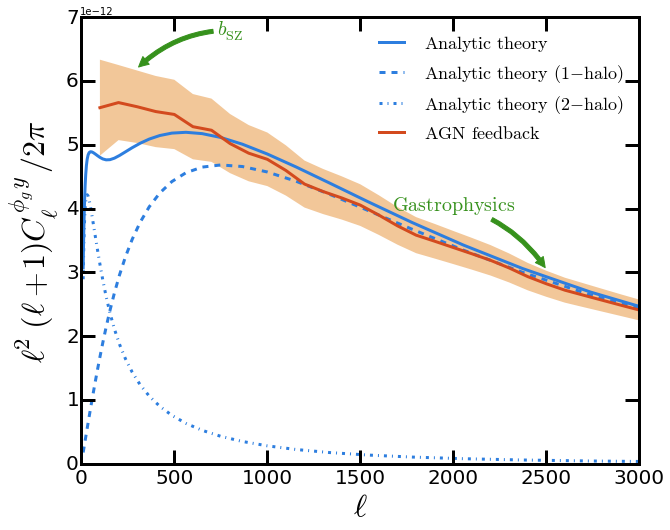
We first investigate the halo model results, before comparing them to the simulations. The one-halo and two-halo contributions to and are shown in Fig. 1. The cross-spectrum is computed for the CFHTLenS source redshift distribution. For both cross-spectra, the term which dominates the signal is -dependent . At low- (large angular scales), the two-halo term dominates. As increases, the cross-spectra transition to the one-halo term. The exact where this transition happens depends on the source redshift distribution . For peaking at a higher redshift, the transition occurs at higher (smaller angular scales), as can be seen by comparing the transition points for () and (). Fig. 1 illustrates that high signal-to-noise measurements of and over a wide multipole range will probe both the interior thermodynamic properties of halos (the one-halo term) and their global thermodynamic properties averaged over the cluster population (the two-halo term).
:
:
The range where the simulation and analytic calculations agree (within the simulation uncertainties from ten realizations) are and for and , respectively. At high-, where the one-halo term dominates, and probe the shapes of the projected pressure and density profiles of the halos. For , the analytic and simulation calculations agree very closely in this regime. For , we find that the analytic calculation predicts a higher cross-spectrum amplitude than the simulations. The analytic calculation uses the average pressure profile provided by the simulations (Battaglia et al., 2012b), and thus these differences likely arise from baryonic effects on the density profile. The mass contributions in this regime are dominated by halos for which the simulations’ mass function agrees well with Tinker et al. (2008) (Battaglia et al., 2012b, and Sec. 3.3). The analytic calculation uses an NFW density profile (Navarro et al., 1997), which contains a cuspy density profile in the interior. This profile differs from the simulations, which have a flatter interior density profile due to baryonic feedback effects (Battaglia, 2014, will explore this in more detail). Due to the different density profile shapes, the analytic cross-spectrum will have more power than the simulation cross-spectrum on angular scales where the interior density profiles begin to be resolved (high-). The results in Fig. 1 indicate that these baryonic effects on the interior density profile are more significant in higher-redshift, lower-mass halos, because the analytic calculation matches the simulations well at high-, while the does not (the following subsections demonstrate that is more sensitive to higher-redshift, lower-mass halos than ). Although the total signal is a convolution of pressure and mass profiles, a high signal-to-noise measurement of and combined with a measurement of the pressure profile could provide constraints on the density profiles of the halos probed by and (for a fixed cosmological model, unless degeneracies with cosmological parameters can be broken).
On large angular scales (small ) the cross-spectra probe the large-scale bias between ICM thermal energy and the matter distribution (). This bias is a sensitive tracer of energetic feedback (due to AGN, SNe, and more exotic sources) for the halos that are probed by and , since feedback alters the global thermal properties of these halos. There will be degenerate effects between the many models for feedback and a natural trade-off between heating and depleting of the ionized gas in halos, which increase or decrease the cross-spectrum signal, respectively. However, a high signal-to-noise measurement of and could differentiate between such models (see Sec. 5).
In addition to feedback effects, the low- cross-spectra are potentially sensitive to the presence of diffuse, unbound gas (“missing baryons”), which would manifest as an underestimate of the signal in the halo model calculations (which do not include such gas) compared to the simulations. Fig. 1 indicates a weak preference for such gas in the large-angle cross-spectrum (), but a stronger preference in the cross-spectrum (). The diffuse gas signal is small but non-negligible, contributing % of the total signal at . This result is sensible in the context of the deconstructed cross-spectra presented below, which show that is more sensitive to gas in lower-mass, higher-redshift halos at larger cluster-centric radii than . Accounting self-consistently for this diffuse gas when interpreting the measured will shift the inferred cosmological parameters ( and ) slightly downward from the values found in Hill & Spergel (2014) (see Sec. 4). However, degeneracies between the cosmological parameters and gas physics model currently do not allow for a robust detection of the diffuse gas signal in , as its presence cannot be straightforwardly separated from other sources contributing to the total observed signal. We revisit these points in Sec. 4.
3.2. Dependence on sub-grid gas models
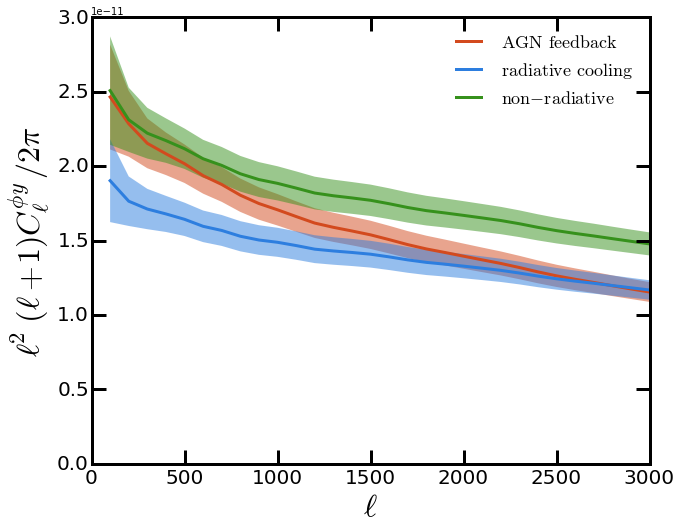
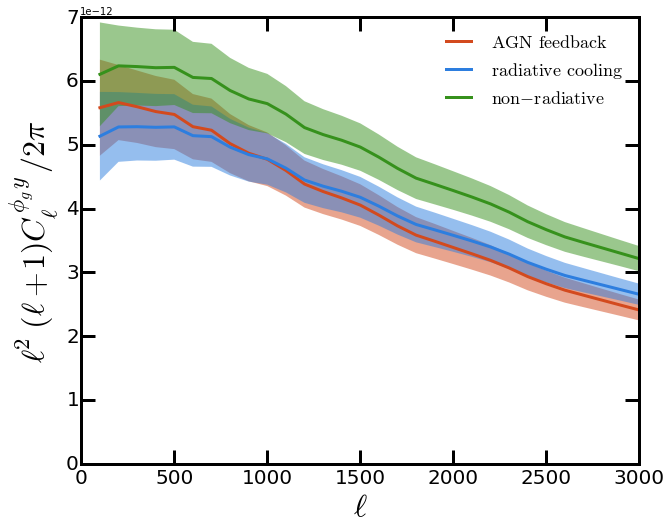
The shape and amplitude of the and cross-spectra are sensitive to the ICM modeling. Changes in the ICM model will mainly affect the Compton- contribution to and . Although extreme cases of energetic feedback can significantly affect halo mass profiles (and thus ), such sub-grid models are not considered in this work. The sub-grid models affect the Compton- parameter through changes to the electron pressure profile (Battaglia et al., 2010, 2012b). The processes of radiative cooling and star formation remove ionized gas from the ICM by converting it into stars, while feedback mechanisms slow this process and heat the surrounding gas. In Fig. 2, we show how the halo gas models affect the cross-spectra. The stark differences between cross-spectra from the shock heating and radiative cooling simulations are the result of star formation, which removes gas from halos and lowers the overall -signal (e.g., Nagai et al., 2007; Battaglia et al., 2012a; Kay et al., 2012; Le Brun et al., 2014). The overall amplitude of these cross-spectra are a function of the gas fraction in halos, which sets the pressure profile normalization. The introduction of energetic feedback in the AGN feedback simulations affects the cross-spectra differently depending on the multipole considered. At low-, the cross-spectra from the AGN feedback simulations approaches the shock heating spectra. Here, the additional heating from AGN in the AGN feedback simulations counteracts the loss of gas to star formation, affecting the global thermodynamics probed by the two-halo term. At high-, the AGN feedback simulation spectra are similar to the radiative cooling spectra and decrease in amplitude to higher . This additional reduction in power results from a shallower pressure profile in the cores of halos in the AGN feedback simulation compared to that found in the other simulations. The AGN feedback simulations expel gas or halt its initial infall onto halos which results in flatter interior pressure profiles. These effects likewise flatten the interior density profile as well (Battaglia, 2014).
3.3. Mass and redshift dependences
:
:
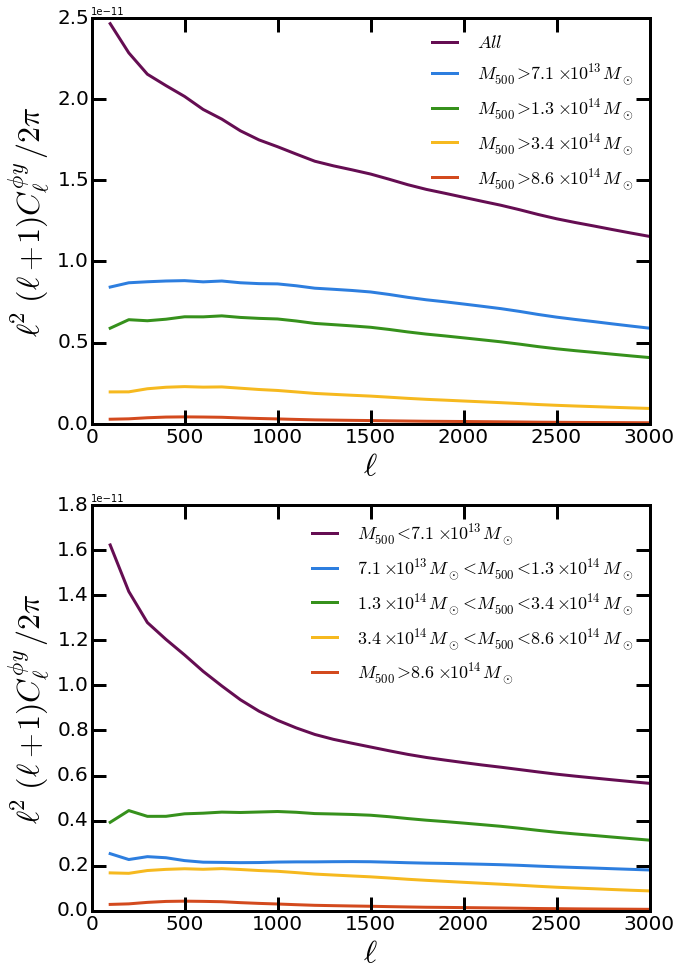
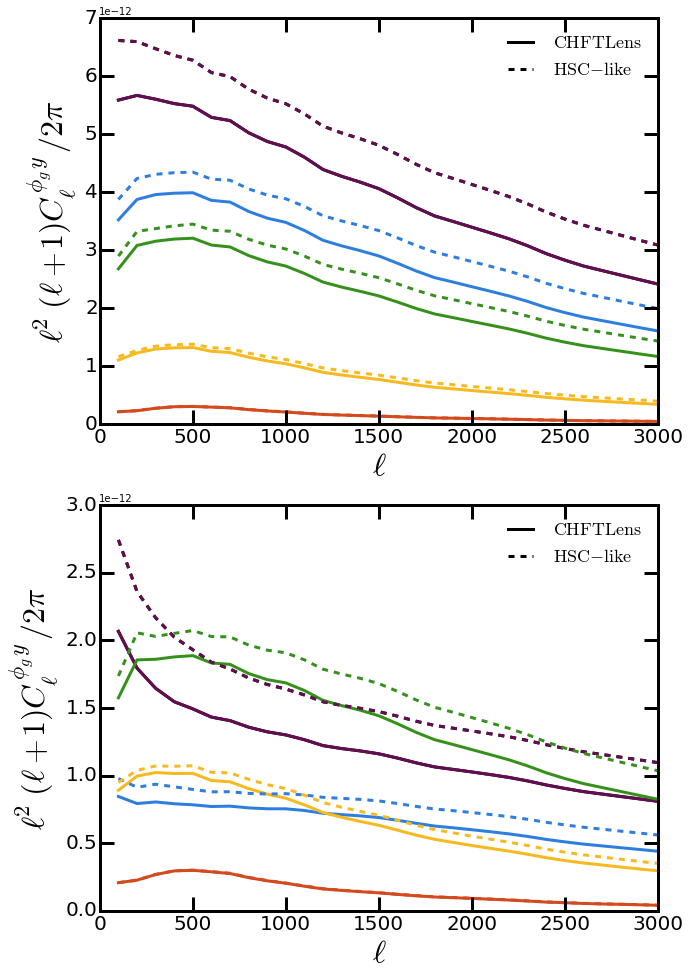
:
:
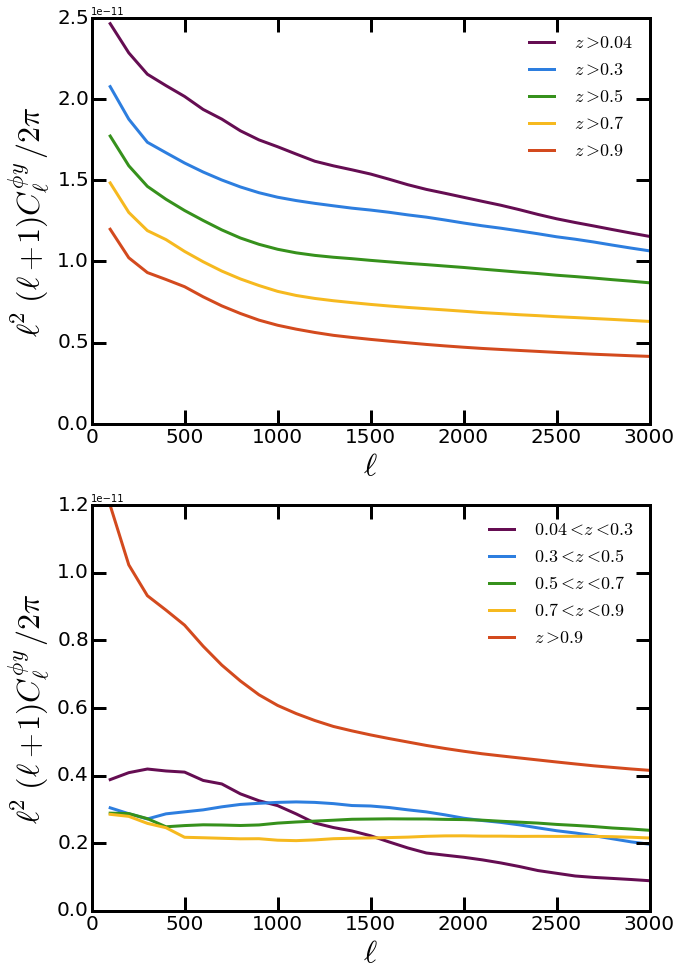
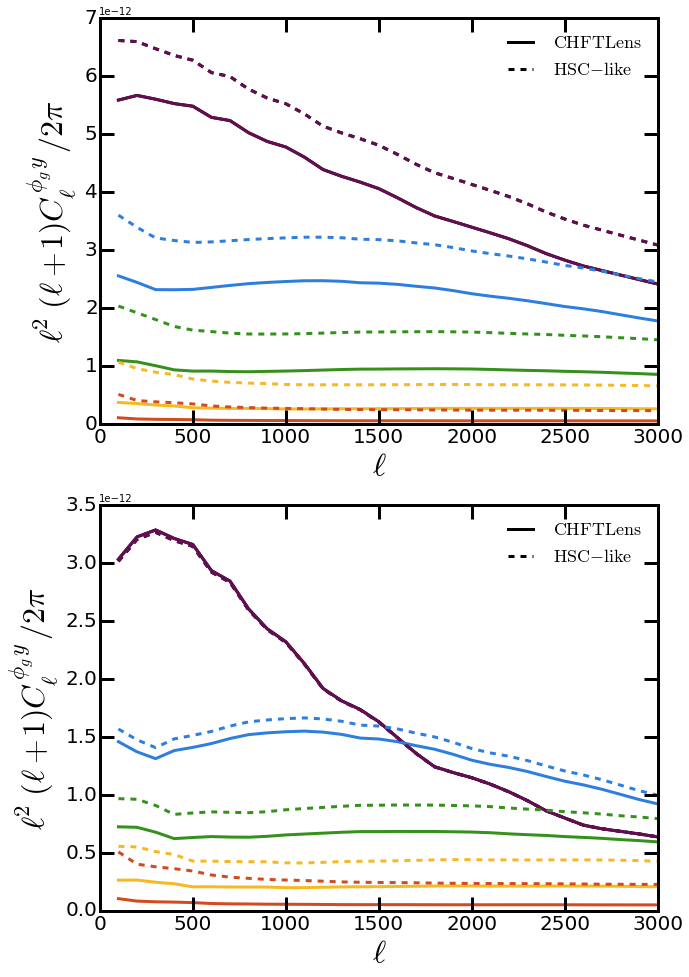
In this subsection, we deconstruct and in mass and redshift bins using the fiducial AGN feedback simulations. We consider both CFHTLenS and HSC-like source galaxy redshift distributions for . The mass and redshift deconstruction of is also investigated in Hill & Spergel (2014) in the halo model approximation, but not using simulations. We explore both cumulative and differential mass and redshift bins. We consider all gas particles (or radii) within when projecting the Compton- signal in the simulations. We use the full maps. Our method is careful not to double-count the cluster mass in overlapping volumes of close-by cluster pairs. Note that the halo mass cuts truncate the halo contribution at (see Sec. 3.4 for details). This truncation removes some of the contributions to the two-halo term; thus, at low- where the two-halo term is important, the curves should be considered lower limits.
In Fig. 3, we show the cross-spectra and (left and right, respectively) broken down into cumulative (top panels) and differential (lower panels) mass bins. Fig. 4 presents the analogous calculations for cumulative and differential redshift bins. The lensing kernels and drive the differences in the mass and redshift dependences for and . The Compton- signal is strongest for the most massive objects in the Universe, most of which do not form until late times (). The mass and redshift contributions to and arise from halos lying at the intersection of the relevant lensing kernel and the Compton- “kernel” driven by the formation of massive structures. Since the galaxy lensing kernel is restricted to low redshifts, larger halo masses contribute more to than . Given the halo mass bins we choose, the largest contribution to come from halos with for for both CFHTLenS and HSC-like galaxy imaging surveys. In contrast, the largest contribution to arises from halos with (given the mass bins we choose). This result is in agreement with that found in Hill & Spergel (2014) (see their Fig. 5, convert mass definitions appropriately, and bin as in Fig. 3 here).
The redshift cuts are easily understood in the context of the different lensing kernels. The CFHTLenS, HSC-like, and CMB lensing kernels peak at increasingly higher redshifts, and thus the associated tSZ – lensing cross-spectra probe gas at progressively higher redshifts. Given the redshift bins we choose, is dominated by contributions from , while (for either CFHTLenS or HSC-like) is mostly sourced by halos at () or (). Note that the different source redshift distributions of different galaxy imaging surveys potentially allow for tomography of the tSZ – lensing signal. For example, an HSC-like survey will have source galaxies to higher redshift than CFHTLenS, and thus its cross-spectrum is more sensitive to higher redshift and lower mass halos than CFHTLenS. Because of the different dependences of sub-grid physics models on mass and redshift, such tomographic measurements can potentially provide powerful mass- and redshift-dependent constraints on the ICM and feedback prescriptions (Pratten & Munshi, 2014).
3.4. Radial cuts
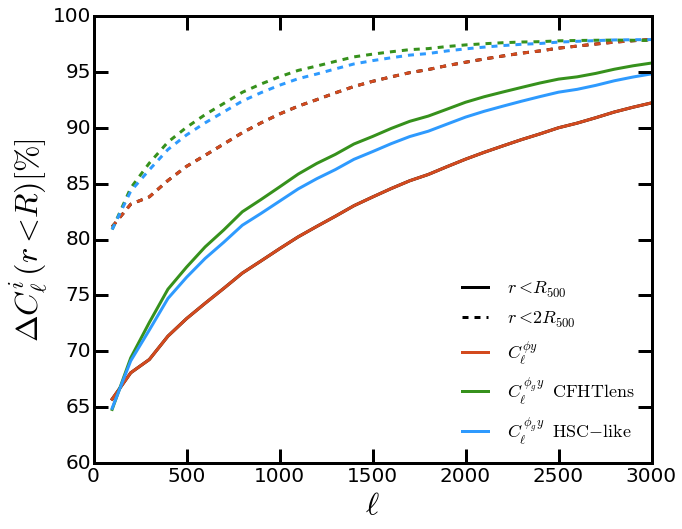
We now investigate the regions of each halo contributing to the cross-spectra, to ascertain whether the core regions or the outskirts are responsible for the signals. We apply varying radial truncations to the simulated -maps, using clusters with at . We follow the procedure in Battaglia et al. (2012b) to make real-space cuts and use a Gaussian taper when truncating at a given radius to avoid ringing in Fourier space. We place radial tapers at , , and in the -maps, adopting as the reference radial taper for the signal from the entire halo.
In Fig. 5, we show the fractional percentage contributions to , defined as , where is the cross-spectrum from the radial cut and are cross-spectra from the other radial cuts. Note that since we cut the smaller halos with , we remove some of the two-halo term from the cross-spectra (similarly, contributions from diffuse gas are not included in the calculation). Thus, the percentages shown in Fig. 5 for multipoles where the two-halo term dominates, for and for , are upper limits to the contributions from within a given radius. For example, we find that gas at contributes of the power at the lowest multipoles. At , this gas contributes % of the total power. Since the one-halo term dominates in this regime, the estimate should be accurate. We find that gas at contributes % at low and % at high . The contributions at large radii, and , are greater for then for , a result that can be traced to the different lensing kernels as in the previous subsection. At high , we show that the cross-spectra are starting to resolve the halo centers and gas inside contributes an overwhelming majority of the power to the cross-spectra.
4. Comparison to observations
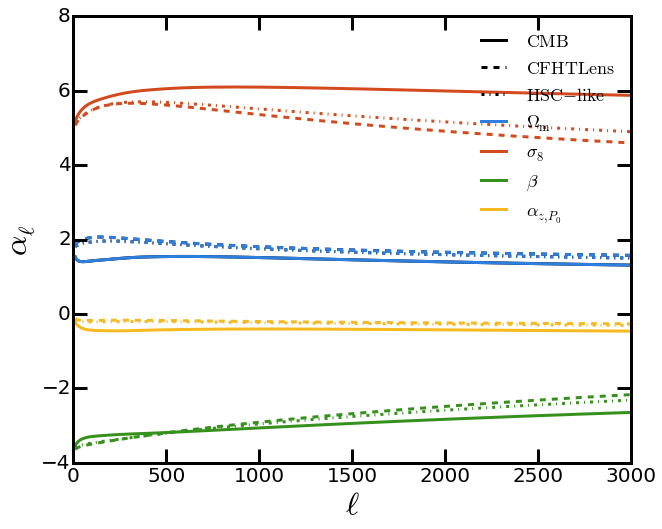
The initial measurements of (Hill & Spergel, 2014) and (Van Waerbeke et al., 2014) fit the data individually using different models (see Hill & Spergel, 2014; Ma et al., 2014, respectively). Here, we re-interpret the measurements in the context of the AGN feedback model discussed in Section 2, using both analytic halo model calculations (which match the procedure used in Hill & Spergel (2014)) and simulations. We choose and as the fiducial cosmological parameter values (these are the WMAP9+eCMB+BAO+ maximum-likelihood parameters (Hinshaw et al., 2013), which we refer to as the WMAP9 cosmology for brevity). The fiducial gas physics parameters are , , and as described in Section 2.1, matching the AGN feedback model. The fiducial parameter set is denoted as where labels each parameter, i.e., . We then use the analytic halo model calculations to compute the dependence of the tSZ – lensing cross-spectra on each parameter. Thus, we use the fiducial analytic cross-spectra, , and compute new spectra by perturbing only one parameter in a given calculation. At each multipole , we compare the relative amplitudes of the spectra
| (15) |
where is the perturbed parameter. Here, we assume that the cross-spectra scale as a power-law function of the perturbed parameter at each , with a power-law index . In Figure 6, we show the values for for each parameter in the model. Changes in scale linearly into changes in and (c.f., Eq. 12) and thus are not shown for clarity. The most sensitive parameter, as expected from previous tSZ studies (e.g., Komatsu & Seljak, 2002; Hill & Pajer, 2013; Hill & Spergel, 2014), is , with the cross-spectra scaling roughly as over the range considered.
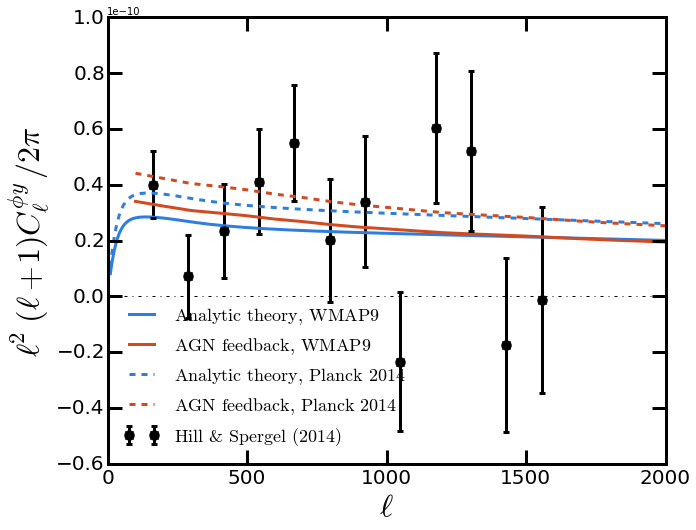
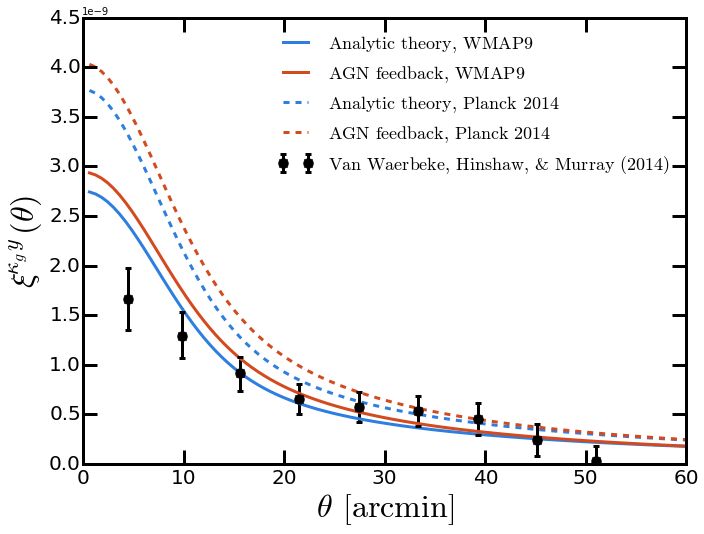
Using the dependence of the cross-spectra on each parameter, we investigate fits to the and measurements. In Fig. 7, we compare the simulation and analytic theory results from the previous section to the data. The measurement of is made in terms of a real-space cross-correlation function of Compton- and CFHTLenS , and we thus Legendre transform the theory and convert to appropriately. In the Legendre transformation, we also account for the smoothing of the and maps used in the measurement (Van Waerbeke et al., 2014)555Note that the FWHM of the map is 9.9 arcmin (L. van Waerbeke, priv. comm.).. We extend the simulation curve to the lowest multipoles needed for the Legendre transformation by assuming a smooth interpolation based on the analytic results. In both panels of Fig. 7, the small differences between the simulation and analytic calculations result from the effects described in Sec. 3.1, specifically the signal from diffuse, unbound gas and the flattening of the inner density profile due to baryonic feedback. Note that these effects are convolved in the real-space cross-correlation shown in the right panel of Fig. 7.
More important, however, is the role of cosmological parameter variations. For this exercise, we leave the gas physics model fixed to the AGN feedback prescription, and consider WMAP9 or Planck values for and . The Planck values are and (Planck Collaboration et al., 2014d). For the results, we compute simple values for the simulation curves with respect to the measured data. The simulation results include effects neglected in Hill & Spergel (2014), such as the presence of diffuse, unbound gas at large angular scales (low ). We find and for the WMAP9 and Planck cosmological parameters, respectively, with 12 degrees of freedom in either case. Thus, in the context of the AGN feedback pressure profile model, the data moderately prefer the WMAP9 parameters to those from Planck. This result matches the qualitative conclusions of Hill & Spergel (2014), although the preference for WMAP9 over Planck is stronger here because of the higher predicted by the simulations for a given set of cosmological parameters. To compare further with the results of Hill & Spergel (2014), we fit the best-determined degenerate combination of and . The best-fit result is with , nearly identical to the WMAP9 value, with an error bar matching the result from Hill & Spergel (2014) of . Thus, as expected due to the inclusion of signal missing in the halo model calculations of Hill & Spergel (2014), the best-fit amplitude has decreased slightly, although well within the statistical error bar.
We perform similar exercises for the measurements of Van Waerbeke et al. (2014), though only at a qualitative level, as values cannot be robustly computed without using the full covariance matrix for this observable (i.e., the points are significantly correlated), which is not publicly available. Fig. 7 compares the AGN feedback analytic and simulation calculations for both WMAP9 and Planck parameter values to the measurements. The Planck calculations are clearly much higher than the data, especially at small angular scales. The tension is somewhat relieved by using WMAP9 parameters. The small-scale data points can be better fit with lower values of and (e.g., and , the values used in the Battaglia et al. (2010) simulations), a result that agrees with direct cluster count measurements (e.g., Hasselfield et al., 2013; Planck Collaboration et al., 2014g), tSZ power spectrum measurements (e.g., Sievers et al., 2013; George et al., 2014; Planck Collaboration et al., 2013a), and measurements of higher-order tSZ statistics (Wilson et al., 2012; Crawford et al., 2014; Hill et al., 2014). However, the better fit at small scales comes at the cost of a slightly worse fit to the large-scale data points. The large scales can possibly be further remedied by modifying the pressure profile model or including additional diffuse, unbound gas — but clearly these possibilities are degenerate with changes in the cosmological parameters.
At large angular scales in (corresponding to low- in ), the halo model and simulation calculations agree well, with less evidence for diffuse, unbound gas (“missing baryons”) than in the calculations — see Fig. 1. Thus, for a WMAP9 or Planck cosmology, the large angular scales in do not require additional signal (in fact the Planck prediction is already too high); for different cosmological parameters, this conclusion will vary, thus reflecting the degeneracy between changes in the gas physics model and cosmology that affects nearly all tSZ measurements, including cluster counts (e.g., Hasselfield et al., 2013; Planck Collaboration et al., 2014g) and indirect statistics (e.g., Hill & Pajer, 2013; McCarthy et al., 2014; Hill & Spergel, 2014). A robust detection of the missing baryons (diffuse, unbound gas beyond halos) in an observed tSZ – lensing cross-correlation would require a demonstration that the data can only be well fit when including the excess power at low- seen in the simulations over the halo model prediction (see Fig. 1), and that changes to the gas pressure profile model or cosmological parameters cannot be made instead to improve the fit. Clearly the current tSZ – lensing cross-correlation measurements are far from this regime, given the error bars and significant outstanding uncertainty on the gas pressure profile model.
5. Future observational constraints
:
:
In this section, we forecast the ability to simultaneously constrain cosmological and astrophysical parameters by combining and measurements. We use the current measurements of and as a baseline, and anticipate the expected improvements in signal-to-noise over these measurements from ongoing and future experiments. We use the Fisher matrix formalism (e.g., Fisher, 1935; Knox, 1995; Jungman et al., 1996) to forecast the expected constraints on these parameters. As with all Fisher analyses, we assume gaussian errors. We also assume that and are well described by the halo model described in Sec. 2.1 and that the parameters used in the modeling (both cosmological and astrophysical) are reasonably close to the real values. The Fisher matrix is calculated
| (16) |
where is the inverse covariance matrix and is parameter that we are forecasting. We calculate using pure statistical errors bars for the cross-spectra,
| (17) |
where is the observed fraction of the sky, is the bandpower width, and , , and are the observed auto and cross-spectra (including the noise biases). For we use the observed spectrum from Hill & Spergel (2014) (which includes the significant non-tSZ noise bias) and we estimate a signal-to-noise improvement of in the final data release from Planck. In this analysis, the fiducial map is denoted by and the future, improved map is denoted by . Forecasting the signal-to-noise of future maps with improved component separation techniques is beyond the scope of this paper (see Hill & Pajer (2013) for an example).
We use the theoretical predictions of and computed in Section 2 for , which assume that the cross-spectra contain pure tSZ – lensing signal. We use the measured CMB lensing power spectrum from Planck (Planck Collaboration et al., 2014e) for our initial estimate of (including the noise bias). We estimate future CMB plus noise using the minimum-variance estimator from Hu & Okamoto (2002) for Stage 2 CMB experiments (e.g., ACTpol and SPTpol) and Stage 3 CMB experiments (e.g., AdvACT and SPT3G). We estimate the observed galaxy lensing convergence auto-power spectrum as,
Current
Future
| (18) |
where is the shape noise term, which results from the finite number of source galaxies that are averaged over. The values for , the intrinsic ellipticity dispersion per component, and , the number of source galaxies per square arcminute, will depend on the survey. In Table 1 we summarize the values used for each survey. For galaxy lensing we consider CFHTLenS, Stage 3 ground-based surveys (e.g., HSC and DES), a Stage 4 ground-based survey (LSST), and a Stage 4 satellite survey (Euclid) .
| Galaxy | CMB | |||||
| Experiments | CFHTLenS | Stage 3 | LSST | Euclid | Planck | Stage 3 |
| 0.005 | 0.048 | 0.25 | 0.2 | 0.25177 | 0.25 | |
| 0.28 | 0.28 | 0.28 | 0.22 | - | - | |
| 7.6 | 15 | 40 | 35 | - | - | |
| map |
To combine the experiments, we sum the different , which assumes that the measurements of and are uncorrelated. This assumption is valid as long as we do not use surveys with overlapping sky coverage666We neglect small correlations due to common long-wavelength modes.. Any overlap will result in the measurements using the same objects in the -map and/or the density field, and thus the measurements will no longer be uncorrelated. In the cases where the surveys would overlap, we enforce the constraint that each survey has a unique survey area, so that we do not double-count the information. For related reasons, we also do not include information from the auto-power spectra of the Compton- or lensing measurements, although these clearly possess constraining power. We leave a full analysis of the joint covariances of the tSZ auto-, lensing auto-, and tSZ – lensing cross-power spectra for future work.
We forecast constraints on five parameters, two cosmological and three astrophysical, as listed in Section 4. The cosmological parameters we consider are and , which both strongly influence the number of halos as a function of mass and redshift. For the astrophysical parameters, we reduce the large range of uncertainties in modeling the halo gas to three pressure profile parameters. In principle, the halo density profiles will also be altered due to changes in feedback and star formation modeling, but these effects will be sub-dominant to changes in the pressure profiles. From Eqs. 12 and 13, we vary , , and . The parameter governs the total amount of thermal energy in a halo. Removal of gas into stars via star formation will decrease , while heating of the gas via feedback will increase it. The parameter controls the outer logarithmic slope of the profile, which is sensitive to the amount of feedback in halos. Finally, the parameter controls the redshift evolution of the total amount of thermal energy in halos and is sensitive to departures from the standard redshift evolution predicted by self-similar collapse (Kaiser, 1986). In the Fisher analysis, we use the complete -dependent results for the power-law scalings of the cross-spectra with respect to each parameter, , as computed in Section 4.
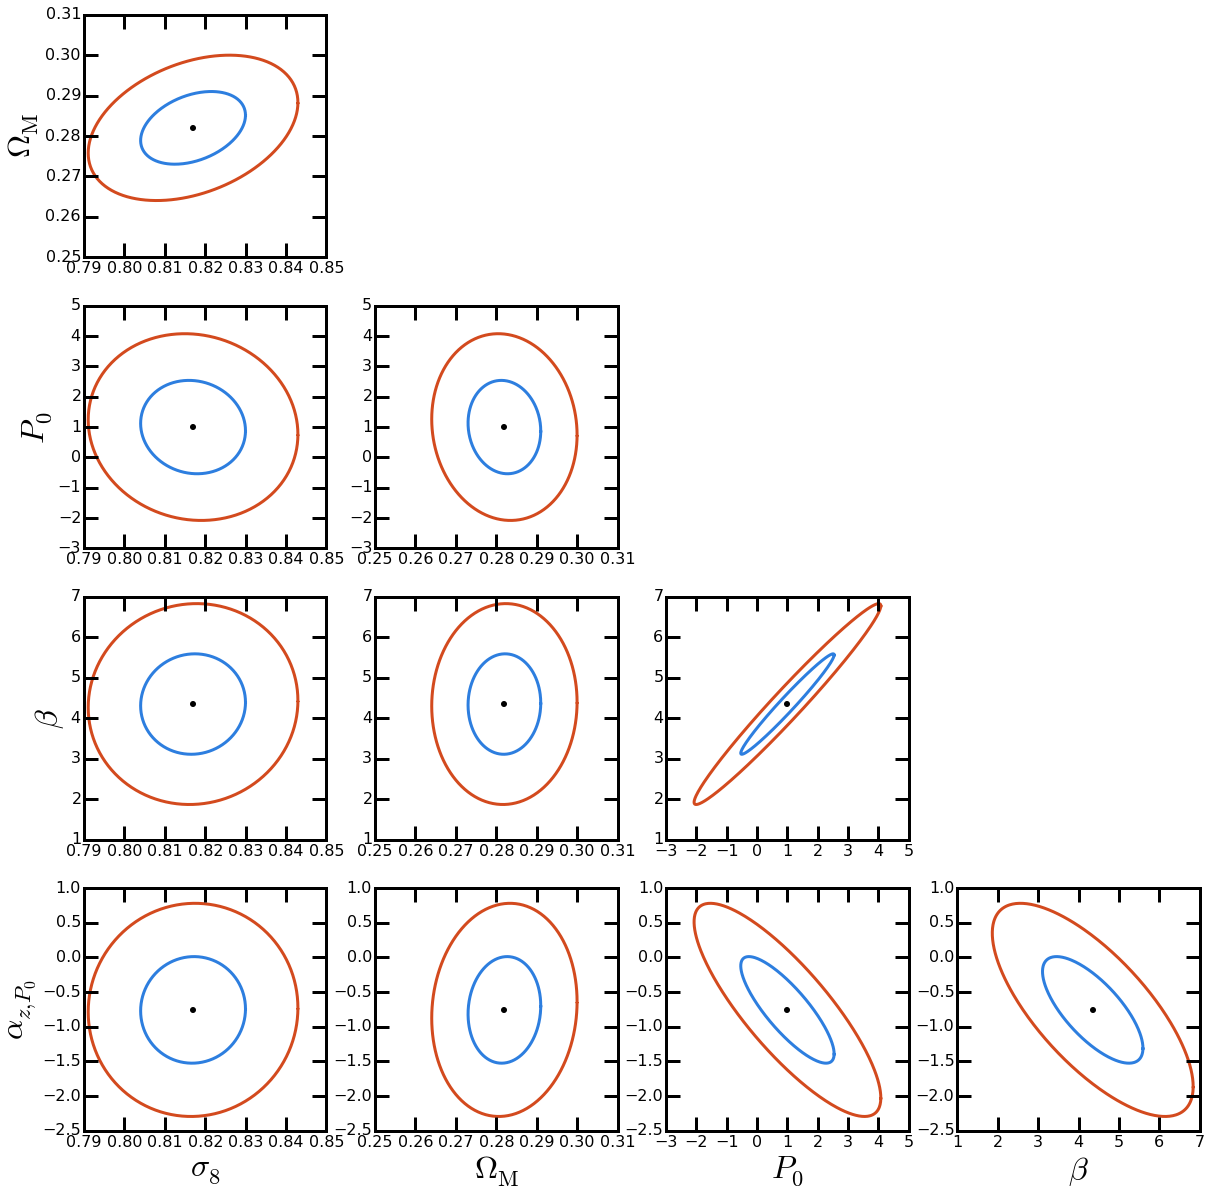
In Figure 8, we show the estimated parameter constraints for two combinations of and measurements. The first (left panel) represents the current measurements: a combination of from CFHTLenS (Van Waerbeke et al., 2014), from a Stage 3 galaxy lensing survey, and from Planck (Hill & Spergel, 2014). To break parameter degeneracies, we include the primary CMB constraints on and from Planck (Planck Collaboration et al., 2014d). Note that the constraints on and are completely driven by the Planck primary constraints. If we had instead placed strong priors on the gas physics parameters, the tSZ – lensing data could yield improvements in the cosmological constraints. However, our focus here is on using the tSZ – lensing measurements to learn about the ICM, and thus we place no priors on the gas physics parameters. In this framework, current data are mostly useful for constraining the gas physics model.
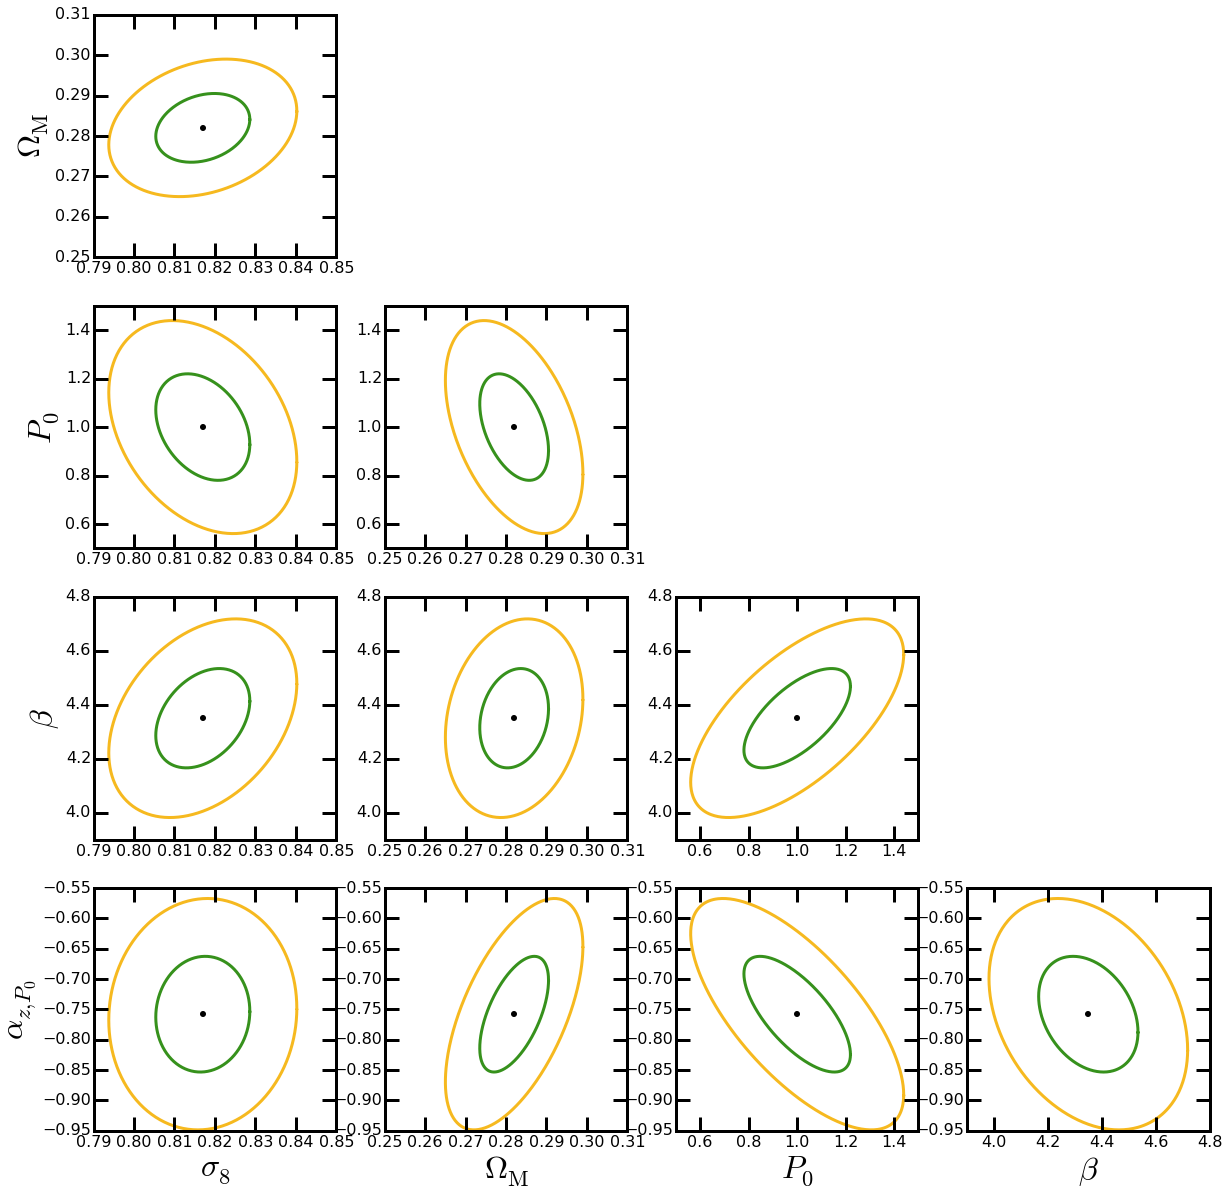
In the right panel of Figure 8, we show the constraints with the combination of the Euclid satellite, LSST, and Stage 3 CMB experiments (for estimated AdvACT sky coverage). These surveys will cover approximately half the sky or more, but we assume that each of them uniquely covers only a fourth of the sky. Therefore, each measurement is independent and their Fisher matrices can be summed without considering the covariances between them. These forecasts also include the primary CMB constraints on and from Planck (Planck Collaboration et al., 2014d). The constraints on the astrophysical parameters are much tighter than those forecast for current experiments, and the tSZ – lensing cross-correlation data now tighten the constraints on and slightly as well. As noted above, if we had placed priors on the gas physics parameters, the tSZ – lensing measurements would provide significant additional constraining power on the cosmological parameters beyond the Planck primary CMB data. But with no such priors in place, degeneracies between the gas physics and cosmological parameters result in the tSZ – lensing data mostly improving constraints on the gas physics parameters — to a very promising level of precision.
We summarize in Table 2 the fully marginalized constraints on the cosmological and astrophysical parameters. Although ongoing and near-future measurements of the cross-correlations yield fairly weak constraints on the astrophysical parameters, the forecast for future experiments is much more promising. We find marginalized fractional errors of %, %, and % on , , and , respectively (recall that the fiducial values are , , and ) . With these potential constraints, it will be possible to start to distinguish between sub-grid ICM models for star formation and feedback.
| Parameters | Current | Future |
|---|---|---|
| 0.013 (1.6%) | 0.012 (1.4%) | |
| 0.0090 (2.8%) | 0.0085 (2.7%) | |
| 1.9 (190%) | 0.22 (22%) | |
| 1.5 (34%) | 0.18 (4.1%) | |
| 1.1 (150%) | 0.095 (13%) |
6. Conclusions
How hot, ionized gas traces the underlying mass in the Universe is an important cosmological and astrophysical question. Weak lensing observations robustly trace the matter distribution, while tSZ observations track the thermal pressure of hot, ionized gas. Naturally, the cross-correlation of these quantities probes the interplay between the mass and ionized gas. Recently, the cross-correlation of the these quantities was measured at independently by Hill & Spergel (2014) and Van Waerbeke et al. (2014), by cross-correlating independently constructed Compton- maps with CMB lensing and galaxy lensing maps, respectively. In this paper, we show and compare theoretical predictions for these cross-correlations using both an analytic halo model and full cosmological hydrodynamic simulations that include sub-grid models for radiative cooling, star formation, and AGN feedback. We predict signals for both CMB lensing, , and galaxy lensing, .
Using the gas pressure profile derived from the simulations, we self-consistently compare the halo model predictions to the simulations. The predicted signals from the halo model and simulations agree well over a wide range of angular scales for and . Small differences are seen at low- where the halo model does not capture the signal from diffuse gas in the intergalactic medium, an effect that is stronger in . However, the diffuse signal comprises only a small fraction of the total signal, even at low-. Additionally, at high-, the predictions from the halo model have more power than the simulations, which is a result of the cuspy NFW density profile assumed in the halo model compared to the flatter interior density profile seen in the simulations.
Both and are functions of the assumed ICM physics model. However, the ICM models affect and differently since the different lensing kernels lead to sensitivity to different halo masses and different redshift ranges. The observations receive strong contributions from halos with and . The mass and redshift dependences for depend on the specifics of the galaxy lensing survey. For CFHTLenS, is most sensitive to halo masses between for , and redshifts for and for . Thus, combining the and measurements provides tomographic information on the correlation of matter and ionized gas.
The cross-spectra and are sensitive to cosmological parameters in addition to the ICM model. They both roughly scale as and . We compare our results with the existing tSZ – lensing cross-correlation measurements. The AGN feedback model with WMAP9 cosmological parameters provides a good fit to the results of Hill & Spergel (2014), although the results of Van Waerbeke et al. (2014) qualitatively prefer a lower amplitude, particularly at small scales. Due to degeneracies between the gas physics model and cosmological parameters, it is unclear what role diffuse, unbound gas (missing baryons) might play in either measurement. Moreover, such gas only contributes a small fraction of the total signal. Given current observational and theoretical uncertainties, no robust claim can be made at the present time. Comparing the halo model and simulation calculations indicates that the presence of diffuse gas should be seen most clearly at low- in .
Looking ahead, we forecast the constraints on cosmological and astrophysical parameters obtainable with current and future maps cross-correlated with CMB and galaxy lensing surveys. We show that the combination of these future cross-spectra measurements will constrain ICM physics parameters to % percent precision, even after marginalizing over cosmological parameters (with the inclusion of primary CMB data). Thermal SZ – gravitational lensing cross-correlations thus hold immense promise for understanding the physics governing hot, ionized gas throughout the history of structure formation in our Universe.
References
- Arnaud et al. (2010) Arnaud, M., Pratt, G. W., Piffaretti, R., Böhringer, H., Croston, J. H., & Pointecouteau, E. 2010, A&A, 517, A92
- Austermann et al. (2012) Austermann, J. E. et al. 2012, in Society of Photo-Optical Instrumentation Engineers (SPIE) Conference Series, Vol. 8452, Society of Photo-Optical Instrumentation Engineers (SPIE) Conference Series, 1
- Bartelmann & Schneider (2001) Bartelmann, M., & Schneider, P. 2001, Phys. Rep., 340, 291
- Battaglia (2014) Battaglia, N. 2014, in prep.
- Battaglia et al. (2012a) Battaglia, N., Bond, J. R., Pfrommer, C., & Sievers, J. L. 2012a, ApJ, 758, 74
- Battaglia et al. (2012b) —. 2012b, ApJ, 758, 75
- Battaglia et al. (2013) —. 2013, ApJ, 777, 123
- Battaglia et al. (2010) Battaglia, N., Bond, J. R., Pfrommer, C., Sievers, J. L., & Sijacki, D. 2010, ApJ, 725, 91
- Benson et al. (2014) Benson, B. A. et al. 2014, in Society of Photo-Optical Instrumentation Engineers (SPIE) Conference Series, Vol. 9153, Society of Photo-Optical Instrumentation Engineers (SPIE) Conference Series, 1
- Bleem et al. (2014) Bleem, L. E. et al. 2014, ArXiv e-prints
- Bleem et al. (2012) —. 2012, ApJ, 753, L9
- Booth & Schaye (2009) Booth, C. M., & Schaye, J. 2009, MNRAS, 398, 53
- Bryan & Norman (1998) Bryan, G. L., & Norman, M. L. 1998, ApJ, 495, 80
- Calabrese et al. (2014) Calabrese, E. et al. 2014, J. Cosmology Astropart. Phys, 8, 10
- Carlstrom et al. (2011) Carlstrom, J. E. et al. 2011, PASP, 123, 568
- Cavaliere et al. (2009) Cavaliere, A., Lapi, A., & Fusco-Femiano, R. 2009, ApJ, 698, 580
- Cole & Kaiser (1988) Cole, S., & Kaiser, N. 1988, MNRAS, 233, 637
- Cooray (2000) Cooray, A. 2000, Phys. Rev. D, 62, 103506
- Cooray & Hu (2000) Cooray, A., & Hu, W. 2000, ApJ, 534, 533
- Cooray et al. (2000) Cooray, A., Hu, W., & Tegmark, M. 2000, ApJ, 540, 1
- Crawford et al. (2014) Crawford, T. M. et al. 2014, ApJ, 784, 143
- Das et al. (2011) Das, S. et al. 2011, Physical Review Letters, 107, 021301
- Dubois et al. (2012) Dubois, Y., Devriendt, J., Slyz, A., & Teyssier, R. 2012, MNRAS, 420, 2662
- Duffy et al. (2008) Duffy, A. R., Schaye, J., Kay, S. T., & Dalla Vecchia, C. 2008, MNRAS, 390, L64
- Dunkley et al. (2011) Dunkley, J. et al. 2011, ApJ, 739, 52
- Enßlin et al. (2007) Enßlin, T. A., Pfrommer, C., Springel, V., & Jubelgas, M. 2007, A&A, 473, 41
- Erben et al. (2013) Erben, T. et al. 2013, MNRAS, 433, 2545
- Fisher (1935) Fisher, R. A. 1935, Journal of the Royal Statistical Society, 98, pp. 39
- George et al. (2014) George, E. M. et al. 2014, ArXiv e-prints
- Goldberg & Spergel (1999) Goldberg, D. M., & Spergel, D. N. 1999, Phys. Rev. D, 59, 103002
- Greco et al. (2014) Greco, J. P., Hill, J. C., Spergel, D. N., & Battaglia, N. 2014, ArXiv e-prints
- Hajian et al. (2013) Hajian, A., Battaglia, N., Spergel, D. N., Bond, J. R., Pfrommer, C., & Sievers, J. L. 2013, J. Cosmology Astropart. Phys, 11, 64
- Hand et al. (2011) Hand, N. et al. 2011, ApJ, 736, 39
- Hanson et al. (2013) Hanson, D. et al. 2013, Physical Review Letters, 111, 141301
- Hasselfield et al. (2013) Hasselfield, M. et al. 2013, J. Cosmology Astropart. Phys, 7, 8
- Hill & Pajer (2013) Hill, J. C., & Pajer, E. 2013, Phys. Rev. D, 88, 063526
- Hill et al. (2014) Hill, J. C. et al. 2014, ArXiv:1411.8004
- Hill & Spergel (2014) Hill, J. C., & Spergel, D. N. 2014, J. Cosmology Astropart. Phys, 2, 30
- Hinshaw et al. (2013) Hinshaw, G. et al. 2013, ApJS, 208, 19
- Hirata et al. (2008) Hirata, C. M., Ho, S., Padmanabhan, N., Seljak, U., & Bahcall, N. A. 2008, Phys. Rev. D, 78, 043520
- Hojjati et al. (2014) Hojjati et al. 2014
- Holder et al. (2013) Holder, G. P. et al. 2013, ApJ, 771, L16
- Horner (2001) Horner, D. J. 2001, PhD thesis, University of Maryland College Park
- HSC Science Collaboration (2012) HSC Science Collaboration. 2012
- Hu & Okamoto (2002) Hu, W., & Okamoto, T. 2002, ApJ, 574, 566
- Huchra & Geller (1982) Huchra, J. P., & Geller, M. J. 1982, ApJ, 257, 423
- Jubelgas et al. (2008) Jubelgas, M., Springel, V., Enßlin, T., & Pfrommer, C. 2008, A&A, 481, 33
- Jungman et al. (1996) Jungman, G., Kamionkowski, M., Kosowsky, A., & Spergel, D. N. 1996, Phys. Rev. D, 54, 1332
- Kaiser (1986) Kaiser, N. 1986, MNRAS, 222, 323
- Kaiser (1992) —. 1992, ApJ, 388, 272
- Kay et al. (2012) Kay, S. T., Peel, M. W., Short, C. J., Thomas, P. A., Young, O. E., Battye, R. A., Liddle, A. R., & Pearce, F. R. 2012, MNRAS, 422, 1999
- Kermish et al. (2012) Kermish, Z. D. et al. 2012, in Society of Photo-Optical Instrumentation Engineers (SPIE) Conference Series, Vol. 8452, Society of Photo-Optical Instrumentation Engineers (SPIE) Conference Series, 1
- Knox (1995) Knox, L. 1995, Phys. Rev. D, 52, 4307
- Komatsu & Kitayama (1999) Komatsu, E., & Kitayama, T. 1999, ApJ, 526, L1
- Komatsu & Seljak (2001) Komatsu, E., & Seljak, U. 2001, MNRAS, 327, 1353
- Komatsu & Seljak (2002) —. 2002, MNRAS, 336, 1256
- Laureijs et al. (2011) Laureijs, R. et al. 2011, ArXiv:1110.3193
- Le Brun et al. (2014) Le Brun, A. M. C., McCarthy, I. G., Schaye, J., & Ponman, T. J. 2014, MNRAS, 441, 1270
- Lewis et al. (2000) Lewis, G. F., Babul, A., Katz, N., Quinn, T., Hernquist, L., & Weinberg, D. H. 2000, ApJ, 536, 623
- LSST Science Collaboration et al. (2009) LSST Science Collaboration et al. 2009, ArXiv:0912.0201
- Ma et al. (2014) Ma, Y.-Z., Van Waerbeke, L., Hinshaw, G., Hojjati, A., & Scott, D. 2014, ArXiv e-prints
- McCarthy et al. (2014) McCarthy, I. G., Le Brun, A. M. C., Schaye, J., & Holder, G. P. 2014, MNRAS, 440, 3645
- McCarthy et al. (2011) McCarthy, I. G., Schaye, J., Bower, R. G., Ponman, T. J., Booth, C. M., Dalla Vecchia, C., & Springel, V. 2011, MNRAS, 412, 1965
- McDonald et al. (2014) McDonald, M. et al. 2014, ApJ, 794, 67
- Munshi et al. (2014) Munshi, D., Joudaki, S., Coles, P., Smidt, J., & Kay, S. T. 2014, MNRAS, 442, 69
- Nagai (2006) Nagai, D. 2006, ApJ, 650, 538
- Nagai et al. (2007) Nagai, D., Kravtsov, A. V., & Vikhlinin, A. 2007, ApJ, 668, 1
- Navarro et al. (1997) Navarro, J. F., Frenk, C. S., & White, S. D. M. 1997, ApJ, 490, 493
- Niemack et al. (2010) Niemack, M. D. et al. 2010, in Society of Photo-Optical Instrumentation Engineers (SPIE) Conference Series, Vol. 7741, Society of Photo-Optical Instrumentation Engineers (SPIE) Conference Series, 1
- Nozawa et al. (2006) Nozawa, S., Itoh, N., Suda, Y., & Ohhata, Y. 2006, Nuovo Cimento B Serie, 121, 487
- Okamoto & Hu (2003) Okamoto, T., & Hu, W. 2003, Phys. Rev. D, 67, 083002
- Ostriker et al. (2005) Ostriker, J. P., Bode, P., & Babul, A. 2005, ApJ, 634, 964
- Pfrommer et al. (2006) Pfrommer, C., Springel, V., Enßlin, T. A., & Jubelgas, M. 2006, MNRAS, 367, 113
- Planck Collaboration et al. (2014a) Planck Collaboration et al. 2014a, A&A, 571, A1
- Planck Collaboration et al. (2014b) —. 2014b, A&A, 571, A29
- Planck Collaboration et al. (2013a) —. 2013a, ArXiv:1303.5081
- Planck Collaboration et al. (2014c) —. 2014c, A&A, 571, A6
- Planck Collaboration et al. (2014d) —. 2014d, A&A, 571, A16
- Planck Collaboration et al. (2014e) —. 2014e, A&A, 571, A17
- Planck Collaboration et al. (2014f) —. 2014f, A&A, 571, A18
- Planck Collaboration et al. (2014g) —. 2014g, A&A, 571, A20
- Planck Collaboration et al. (2013b) —. 2013b, A&A, 550, A131
- Planck Collaboration et al. (2013c) —. 2013c, A&A, 557, A52
- POLARBEAR Collaboration et al. (2013) POLARBEAR Collaboration et al. 2013, ArXiv e-prints
- Pratten & Munshi (2014) Pratten, G., & Munshi, D. 2014, MNRAS, 442, 759
- Puchwein et al. (2008) Puchwein, E., Sijacki, D., & Springel, V. 2008, ApJ, 687, L53
- Reichardt et al. (2012) Reichardt, C. L. et al. 2012, ApJ, 755, 70
- Shaw et al. (2009) Shaw, L. D., Zahn, O., Holder, G. P., & Doré, O. 2009, ApJ, 702, 368
- Sherwin et al. (2012) Sherwin, B. D. et al. 2012, Phys. Rev. D, 86, 083006
- Sievers et al. (2013) Sievers, J. L. et al. 2013, J. Cosmology Astropart. Phys, 10, 60
- Sijacki et al. (2007) Sijacki, D., Springel, V., Di Matteo, T., & Hernquist, L. 2007, MNRAS, 380, 877
- Smith et al. (2007) Smith, K. M., Zahn, O., & Doré, O. 2007, Phys. Rev. D, 76, 043510
- Spergel et al. (2013) Spergel, D. et al. 2013, ArXiv e-prints
- Springel (2005) Springel, V. 2005, MNRAS, 364, 1105
- Springel & Hernquist (2003a) Springel, V., & Hernquist, L. 2003a, MNRAS, 339, 289
- Springel & Hernquist (2003b) —. 2003b, MNRAS, 339, 289
- Story et al. (2014) Story, K. T. et al. 2014, ArXiv:1412.4760
- Sun et al. (2011) Sun, M., Sehgal, N., Voit, G. M., Donahue, M., Jones, C., Forman, W., Vikhlinin, A., & Sarazin, C. 2011, ApJ, 727, L49
- Sunyaev & Zeldovich (1970) Sunyaev, R. A., & Zeldovich, Y. B. 1970, Ap&SS, 7, 3
- Swetz et al. (2011) Swetz, D. S. et al. 2011, ApJS, 194, 41
- The Dark Energy Survey Collaboration (2005) The Dark Energy Survey Collaboration. 2005, ArXiv:0510346
- The Polarbear Collaboration: P. A. R. Ade et al. (2014) The Polarbear Collaboration: P. A. R. Ade et al. 2014, ApJ, 794, 171
- Tinker et al. (2008) Tinker, J., Kravtsov, A. V., Klypin, A., Abazajian, K., Warren, M., Yepes, G., Gottlöber, S., & Holz, D. E. 2008, ApJ, 688, 709
- Tinker et al. (2010) Tinker, J. L., Robertson, B. E., Kravtsov, A. V., Klypin, A., Warren, M. S., Yepes, G., & Gottlöber, S. 2010, ApJ, 724, 878
- Trac et al. (2011) Trac, H., Bode, P., & Ostriker, J. P. 2011, ApJ, 727, 94
- Tyson et al. (1984) Tyson, J. A., Valdes, F., Jarvis, J. F., & Mills, Jr., A. P. 1984, ApJ, 281, L59
- van Engelen et al. (2012) van Engelen, A. et al. 2012, ApJ, 756, 142
- van Engelen et al. (2014) —. 2014, ArXiv:1412.0626
- Van Waerbeke et al. (2013) Van Waerbeke, L. et al. 2013, MNRAS, 433, 3373
- Van Waerbeke et al. (2014) Van Waerbeke, L., Hinshaw, G., & Murray, N. 2014, Phys. Rev. D, 89, 023508
- Vikhlinin et al. (2006) Vikhlinin, A., Kravtsov, A., Forman, W., Jones, C., Markevitch, M., Murray, S. S., & Van Speybroeck, L. 2006, ApJ, 640, 691
- Voit (2005) Voit, G. M. 2005, Reviews of Modern Physics, 77, 207
- Voit et al. (2002) Voit, G. M., Bryan, G. L., Balogh, M. L., & Bower, R. G. 2002, ApJ, 576, 601
- Wilson et al. (2012) Wilson, M. J. et al. 2012, Phys. Rev. D, 86, 122005