Galaxy evolution across the optical emission-line diagnostic diagrams?
Abstract
Context. The discovery of the relation, the local galaxy bimodality, and the link between black-hole and host-galaxy properties, have raised the question whether Active Galactic Nuclei (AGN) play a role in galaxy evolution. AGN feedback is one of the biggest observational challenges of modern extragalactic astrophysics. Several theoretical models implement AGN feedback to explain the observed galaxy luminosity function, and possibly the color and morphological transformation of spiral galaxies into passive ellipticals.
Aims. To understand the importance of AGN feedback, a study of the AGN populations in the radio-optical domain is crucial. A mass sequence linking star-forming galaxies and AGN has been already noted in previous works, and it is now investigated as possible evolutionary sequence.
Methods. We observed a sample of intermediate-redshift () SDSS-FIRST radio emitters with the Effelsberg 100-m telescope at and GHz and obtained spectral indices. The sample includes star-forming galaxies, composite galaxies (with mixed contribution to line emission from star formation and AGN activity), Seyferts and Low Ionization Narrow Emission Region (LINER) galaxies. With these sources we search for possible evidence of spectral evolution, and a link between optical and radio emission in intermediate-redshift galaxies.
Results. We find indications of spectral index flattening in high-metallicity star-forming galaxies, composite galaxies, and Seyferts. This “flattening sequence” along the [NII]-based emission-line diagnostic diagram is consistent with the hardening of galaxy ionizing field, due to nuclear activity. After combining our data with FIRST measurements at GHz, we find that the three-point radio spectra of Seyferts and LINERs show substantial differences, attributable to small radio core components and larger (arcsecond sized) jet/lobe components, respectively. A visual inspection of FIRST images seem to confirm this hypothesis.
Conclusions. Galaxies along this sequence are hypothesized to be transitioning from the active star-forming galaxies (blue cloud) to the passive elliptical galaxies (red sequence). This supports the suggestion that AGN play a role in shutting down star-formation, and allow the transition from one galaxy class to the other.
Key Words.:
Galaxies: active – Galaxies: evolution – Galaxies: starburst – Radio:continuum1 Introduction
The observationally established correlations between the mass of the black hole (BH) and the properties of the bulge of its host galaxy (Kormendy & Richstone 1995; Magorrian et al. 1998; Gebhardt et al. 2000; Ferrarese & Merritt 2000; Tremaine et al. 2002; Marconi & Hunt 2003; Heckman et al. 2004; Aller & Richstone 2007; Hopkins et al. 2007; Feoli & Mancini 2009; Gültekin et al. 2009) support the hypothesis of coevolution between BH and surrounding galaxy. A tight link between black hole growth and evolution of the host is expected, considering that BH accretion and star formation are fueled by the same material (Trump et al. 2012). Observational evidence for coeval star formation and black hole growth are found in the star-formation histories of Active Galactic Nuclei (AGN) hosts (Heckman & Kauffmann 2006).
Galaxy color bimodality (e.g. Baldry et al. 2004) leads to the expectation that galaxy color may evolve with time, followed by a morphological evolution (Kauffmann et al. 2003b). When molecular gas is available, the galaxy appears blue (Baldry et al. 2004). It is generally accepted that massive ellipticals form via mergers of gas-rich disk galaxies (e.g. Toomre & Toomre 1972). The latter provide a significant amount of gas to fuel star formation. However, models for galaxy evolution that explain the subsequent passive phase via gas consumption, produce galaxies that are too luminous and blue (Croton et al. 2006; Bower et al. 2006). In between the blue distribution of star-forming objects (blue cloud) and the red distribution of passively evolving galaxies (red sequence) lies a group of galaxies showing intermediate properties (green valley). The latter also show intermediate morphology, i.e. they present large bulges with a disk component. The relatively high number of AGNs that have been found to reside in green valley galaxies (Nandra et al. 2007; Salim et al. 2007; Georgakakis et al. 2008; Silverman et al. 2008; Gabor et al. 2009; Schawinski 2009; Hickox et al. 2009) may connect the black hole activity with the transitional phase from the blue cloud to the red sequence. This has been construed as AGN-feedback (Silk & Rees 1998; Benson et al. 2003; Di Matteo et al. 2005; Cattaneo et al. 2005; Kawata & Gibson 2005; Kaviraj et al. 2007; Khalatyan et al. 2008), where plasma jets may sweep away or heat up the gas reservoir of galaxies. This would remove the fuel for star formation, or prevent it from cooling down to form new stars (Dekel & Silk 1986; Benson et al. 2003). In particular, the existence of two different AGN-feedback modes has been suggested. In the quasar or high-excitation mode, a fraction of the gas accreted onto a BH during a major merger is isotropically injected back to the gas reservoir of the host galaxy as thermal energy. According to simulations (Springel et al. 2005; Narayanan et al. 2006; Li et al. 2007; Narayanan et al. 2008) this may be the case for quasar-driven powerful outflows that quench the star formation on short time scales (Hamann et al. 2002; Maiolino et al. 2012). This phase is also associated with vigorous star formation at kpc scales. It is now observationally established that in some cases the most luminous radio-loud AGNs are associated with enhanced star formation activity (Ivison et al. 2012; Norris et al. 2012). Tadhunter et al. (2007) state that the percentage of powerful radio loud AGNs with significant recent starburst activity is about . Cases of radio-loud AGNs with powerful recent star formation can be found in Hes et al. (1995); Tadhunter et al. (2002); Wills et al. (2002, 2004); Tadhunter et al. (2007). Towards the end of the quasar phase, the AGN heats or mechanically disrupts the surrounding gas, and star formation is terminated. The host is then visible as an early-type galaxy whose spectrum is dominated by older generations of stars with redder colors. Theoretical models also include quasar feedback as a way to quench star formation in the host and create red passively-evolving products (Granato et al. 2004; Springel et al. 2005; Hopkins et al. 2006). The second AGN-feedback mode is the so-called radio mode or low-excitation mode (Croton et al. 2006; Bower et al. 2006; Khalatyan et al. 2008). It is thought to occur at later times and over a more extended period of time, liberating a smaller fraction of energy into the ISM and preventing cooling flows. The radio mode is linked to radio AGN outflows in already massive, red galaxies. The destruction of the molecular gas reservoir may in turn terminate the growth of the black hole as material for further accretion is no longer available.
The observational finding that AGN can also trigger star formation activity points to a more complex interplay between the two (Khalatyan et al. 2008; Cattaneo et al. 2009; Harrison et al. 2012; Ishibashi & Fabian 2012; Zinn et al. 2013). Enhanced star formation can be triggered by strong jets, which cause shocks and induce turbulence (Klamer et al. 2004; vanBreugel et al. 2004; Gaibler et al. 2012; Ishibashi & Fabian 2012). The question to what extent AGN and host are related to each other still needs to be answered. Strong and direct evidence of AGN-feedback in action is still missing.
Radio galaxies are active galaxies that are luminous at radio frequencies, and are often chosen for AGN-feedaback studies because jets and lobes are more easily observed. They can be divided into two main groups. The Fanaroff-Riley type I (FR I, Fanaroff & Riley 1974) sources become fainter as one approaches the outer points of the lobes. Radio spectra are steep, indicating that the radiating particles have aged the most. Fanaroff-Riley type II (FR II) sources show the oppsite trend, i.e. hotspots in their lobes at great distance from the center. The majority of FR I radio galaxies show very weak or completely absent optical emission lines. Those are referred to as low-excitation systems (Hardcastle et al. 2006), and they are mostly found in elliptical galaxies with little ongoing star formation (Ledlow & Owen 1995; Govoni et al. 2000). If optical spectroscopic information is available, low-excitation systems are generally classified as low-ionization nuclear emission-line regions (LINERs, Heckman 1980). Conversely, the most powerful, high-redshift FR II radio galaxies have, in most cases, strong low-ionization emission lines typical of AGN spectra (Kozieł-Wierzbowska & Stasińska 2011) and the hosts show peculiar optical morphologies like tails, bridges, and shells (Smith & Heckman 1989; Zirbel 1996), indicating recent galaxy-galaxy interactions, and bluer colors compared to giant ellipticals. Schawinski et al. (2007) explain the bluer colors of early-type galaxies hosting AGN as “rejuvenation”, i.e. star formation triggered by the AGN. FR Is and IIs are usually associated with elliptical hosts (Martel et al. 1999), but exceptions are found (e.g., Ledlow et al. 1999). While FR IIs show post-merger features like tails and bridges, and are hypothesized to result from the encounter of gas-rich parent galaxies, some FR Is might be the product of non-gas rich galaxies encounters (Gonzalez-Serrano et al. 1993; Colina & de Juan 1995; Martel et al. 1999).
It has been established that powerful FR IIs show a strong correlation between their radio luminosity and their optical emission-line luminosity (Baum et al. 1995), suggesting that both the optical and the radio emission are connected to each other and might arise from the same physical process. Some attempts to study the correlation between AGN activity and evolution of host properties in the radio-optical regime have been already done in the past by using the large SDSS sample combined with the Faint Images of the Radio Sky at Twenty-Centimiters (FIRST; Becker et al. 1995), and the NRAO VLA Sky Survey (NVSS; Condon et al. 1998), or previous radio samples (Ivezić et al. 2002; Obrić et al. 2006; Buttiglione et al. 2010; Best et al. 2005; Vitale et al. 2012). Vitale et al. (2012), using a cross-matched SDSS-FIRST sample, find that the relative number of AGNs decreases with the ratio between radio luminosity at GHz () and luminosity of the H line (). In particular, the radio luminosity increases from star-forming galaxies to composites (galaxies where contributions to line emission come from both AGN and star formation), Seyfert and LINER galaxies, while the H luminosity decreases and reaches its minimum in LINERs. This can be interpreted as optical line emission tracing recent star- formation in relatively young galaxies, while radio emission appears at a later stage of galaxy evolution and is mostly detected in massive and red ellipticals. This fact is consistent with the differences in the radio luminosity functions of starburst and AGNs (Machalski & Godlowski 2000; Sadler et al. 2002).
Low-ionization emission-line diagnostic diagrams (Baldwin et al. 1981; Veilleux & Osterbrock 1987; Dopita et al. 2002; Kewley et al. 2003; Lamareille et al. 2004; Groves et al. 2004a, b; Lamareille 2010) are largely used to classify galaxies according to the main contributions to line emission - photoionization by hot stars and/or Supernovae (SNe) driven shocks from HII regions, photoionization by disk accretion or fast shocks from AGN, or both. Diagnostic diagrams make use of emission line ratios whose strength is a function of the ionization parameter , and the metallicity. In general, AGNs differ from star-forming galaxies because their ionizing fields have a higher energy component, and produce strong [N ii], [S ii], and [O i] lines.
To understand the importance of AGN feedback in the current scenarios of galaxy evolution, and the connection between nuclear activity and change in the physical properties of the host, a study of the AGN populations in the radio-optical domain is crucial. In the scenario where powerful (predominantly high-excitation) and weak (predominantly low-excitation) radio AGNs represent different (i.e., earlier and later, respectively) stages of the blue-to-red galaxy evolution (Smolčić 2009), radio AGN activity is a strong function of host galaxy properties. Radio activity can therefore be linked to different stages of massive galaxy formation (see also Schawinski 2009, for a similar study in the optical domain). The indication of a sequence of increasing stellar mass from star-forming galaxies to AGNs as found in Vitale et al. (2013), the increase of the ratio along the same (Vitale et al. 2012), and the color and morphological transformation, all point to a possible AGN- triggered evolution that needs to be tested.
This paper aims at studying galaxy spectral evolution in a sample of bright intermediate-redshift radio emitters with detected optical counterparts. We performed observations at and GHz with the Effelsberg 100-m telescope of a sample of radio emitters to study the spectral properties of star-forming, composite, Seyfert, and LINER galaxies. We search for AGN-feedback signatures in the “transiting” or composite galaxies, which may represent the intermediate stages of galaxy evolution.
This paper is organized as follows: In Sec. 2 we introduce the sample selection and available archival data, and in Sec. 3 the radio observations and data reduction are presented. Data analysis and results are described in Sec. 4. Sec. 5 contains the discussion, and Sec. 6 the main findings and conclusions.
2 Optical and radio samples
2.1 Sloan Digital Sky Survey
The Sloan Digital Sky Survey (SDSS) is a photometric and spectroscopic survey that covers one-quarter of the celestial sphere in the north Galactic cap (York et al. 2000; Stoughton et al. 2002). Observations were performed using a m wide-field optical telescope. The spectra have an instrumental velocity resolution of km/s and the spectral coverage is Å. The measured galaxies have a median redshift of . Spectra were taken with diameter fibers ( kpc at ), which makes the sample sensitive to aperture effects (see Sect. 2.4). Low redshift objects are likely to be dominated by nuclear emission (e.g., Kewley et al. 2003).
The Max-Planck-Institute for Astrophysics (MPA)-Johns Hopkins University (JHU) Data Release 7 (DR7) of spectral measurements111http://www.mpa-garching.mpg.de/SDSS/DR7/ contains the derived galaxy properties from the MPA-JHU emission line analysis for the objects in the SDSS DR7 (Abazajian et al. 2009). Stellar population synthesis spectra (updated Bruzual & Charlot 2003) have been used for the stellar continuum subtraction. The MPA-JHU contains, in particular, the emission-line measurements of the low-ionization lines that are used in diagnostic diagrams to separate star-forming galaxies from the AGN families (Seyferts and LINERs, or high- and low-excitation systems). Optical images are available as well. Total stellar masses are also provided and estimated by fitting broad-band spectral energy distributions (SEDs) with stellar population models.
2.2 Faint Images of the Radio Sky at Twenty-centimeters survey
The Faint Images of the Radio Sky at Twenty-centimeters survey (FIRST; Becker et al. 1995) has used the Very Large Array (VLA) in the B-array configuration to produce a map of the GHz sky emission with a beam size of and a rms sensitivity of about mJy/beam. The survey covers an area of about in the north Galactic cap, corresponding to the sky regions investigated by SDSS, and observed sources. At the mJy source detection threshold, about one third of the FIRST sources show resolved structures on scales of (Ivezić et al. 2002). The FIRST catalog222http://sundog.stsci.edu/first/catalogs/readme.html provides information on the continuum flux density peak and the integrated flux density at GHz, which allows the separation of resolved from unresolved sources. FIRST sources have flux density measurement errors smaller than %. Radio images are available for each source.
2.3 SDSS-FIRST cross-identification
We performed a cross-identification of the SDSS DR7 and the FIRST catalog to obtain a large optical-radio sample of mostly active, metal rich galaxies (see also Vitale et al. 2012, for details). For generating the cross-matched SDSS-FIRST sample, we used the matching results provided by the SDSS DR7 via Casjobs (OMullane et al. 2005), based on a matching radius of . The resulting sample contains radio emitters which corresponds to % of the SDSS sample. Within the detection limits of the FIRST and SDSS surveys, there are radio emitters without optical counterparts. Best et al. (2005) found that radio galaxies extracted from the main spectroscopic sample of the SDSS reside in very massive early-type galaxies, with weak or undetectable optical emission lines. Some potentially real cross-matched objects are not identified by the matching procedure, however, due to positional offsets between the location of the radio emission with respect to the optical emission, especially in case of extended sources. From here and throughout the paper, we call the cross-matched SDSS-FIRST sample the “parent sample”.
2.4 Effelsberg sample selection
From the parent sample we have selected a subsample of radio-bright galaxies ( mJy, where is the integrated flux density at GHz) to obtain spectral information at two different radio frequencies than FIRST. Observations were performed with the Effelsberg 100-m single dish telescope (see Sect. 3).
The mJy selection resulted in a sample of sources, among which exhibit SDSS emission line measurements used in optical diagnostic diagrams. From this initial sample, we excluded:
-
•
all line emitters with to avoid aperture effects (see Kewley et al. 2003);
-
•
one high redshift () galaxy;
-
•
three sources with broad lines;
-
•
all sources with signal to noise (S/N) on the equivalenth width of the emission lines involved in the diagnostic diagrams.
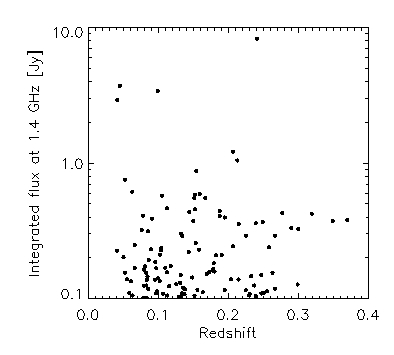
Galaxies of the Effelsberg sample are in the redshift range . The lower cut is because local galaxies have angular sizes larger than the size of the fiber used for the SDSS survey. Assuming good centering, emission from the outer regions of the galaxies is not measured. Consequently, a redshift lower limit of is required (Kewley et al. 2003) where the SDSS fiber includes on average of the galaxy area. The redshift upper limit is due to the reliance on emission-line diagnostic diagrams, requiring [N ii] and H in the observable spectral window, hence limiting the sample to . The [OII]/H versus [O iii]/H diagram (Tresse et al. 1996; Rola et al. 1997; Lamareille et al. 2004; Lamareille 2010) represents a higher-redshift option to the more classic diagnostic diagram, although there is only one sources in our sample at . The use of these additional diagnostics does not add substantially to our analysis, and the source has been excluded from the sample. The redshift distribution is illustrated in Fig. 1. There is no obvious trend between integrated flux at GHz and redshift.
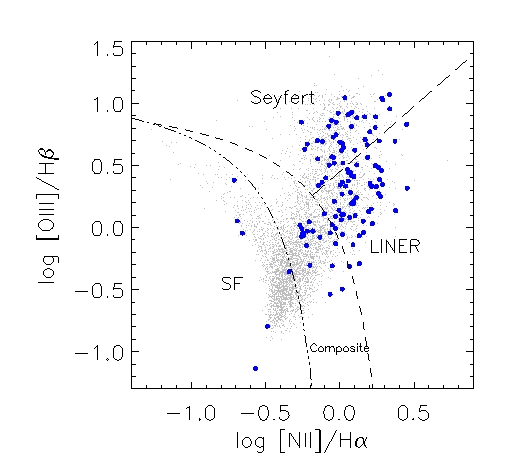
The cut in S/N on the equivalenth width of the emission lines involved in the diagnostic diagrams leads to a sample of galaxies in the [N ii]-based diagram (S/N for [N ii], [O iii], H and H lines), galaxies in the [S ii]-based diagram (S/N for [S ii] doublet, O iii, H and H lines), and galaxies in the [O i]-based diagram (S/N for [O i], O iii, H and H lines). The [N ii]-based diagram counts the highest number of sources and is used as main tool to show our results. With the Effelsberg telescope we observed (out of ) [N ii]-diagram classified high S/N sources (see Sect. 3.1). Sources are listed in Table 2 of the Appendix, where also additional diagnostic diagrams are shown. The sample is composed of star-forming galaxies (SFGs, % of the sample), composites (%), Seyferts (%), and LINERs (%). Fig. 2 shows how sources are distributed in the diagnostic diagram. The underlying grey distribution represents the SDSS-FIRST parent sample.
The completeness of the Effelsberg sample is related to the completeness of SDSS and FIRST. SDSS is regarded as a complete sample (magnitude limited, but including all galaxy types), while FIRST is surface-brightness (Jy beam-1) limited (Condon 1998). For more information on these samples, see Vitale et al. (2012). By selection, all galaxies in the sample are line emitters (with available SDSS measurements). Seyfert galaxies usually have bright and well detectable emission lines, while LINERs exhibit much weaker emission lines. By applying a S/N cut on the line fluxes, we likely exclude some of the optically-weak but radio-strong emitters from the sample. In particular, we could be excluding galaxies such as the so-called “fake-LINERs” and “retired galaxies” (Stasińska et al. 2008; Cid Fernandes et al. 2010, 2011; Vitale et al. 2012), which exhibit low H equivalent width and are possibly powered by old post-asymptotic giant branch (AGB) stars. The Effelsberg sample, selecting all cross-matched SDSS-FIRST radio emitters that have an integrated flux at GHz mJy, and a redshift , contains many AGNs and metal-rich star-forming galaxies (see Vitale et al. 2012, Fig.1). This is because, in general, high radio-flux sources are found to be powerful AGN, while the fainter sources include many more normal (non active) or star-forming galaxies. Consequently, we note that our sample is not complete in a statistical sense, and findings are not representative of the whole optical-radio galaxy population.
3 Effelsberg
3.1 Observations
Observations at the Effelsberg 100-m telescope were performed between February and October 2013 in a total of single observing sessions. Each source was observed at 4.85 GHz (6 cm) and 10.45 GHz (2.8 cm) with multi-feed heterodyne receivers mounted in the secondary focus to derive radio spectral indices from (quasi-) simultaneous observations (guaranteeing measurements free of source variability). The flux density measurements at each frequency were performed using cross-scans in Azimuth and Elevation direction as well as “beam switch”. The cross-scans allow the correction of small pointing offsets and the detection of possible spatial extension or cases of confusion from field sources. The beam switch allows real-time sky subtraction and removes most of the atmospheric variations. All sources in the sample were sufficiently strong to facilitate cross-scans with typically 4 to 12 sub-scans (each with a length of times the telescope beam) depending on the source brightness at the given frequency. During each session frequent focus and calibration measurements were performed using the primary calibrators 3C 286, 3C 295 and NGC 7027. Three weak galaxies were not observable during our session at Effelsberg due to bad weather conditions.

| SFGs | Composites | Seyferts | LINERs | ||||
| 6 | 19 | 42 | 52 | ||||
| R mean | R median | R mean | R median | R mean | R median | R mean | R median |
| 2.66 | 2.61 | 2.61 | 2.58 | 2.74 | 2.72 | 2.83 | 2.70 |
| Quiet | Loud | Quiet | Loud | Quiet | Loud | Quiet | Loud |
| 2 | 4 | 4 | 15 | 8 | 34 | 7 | 45 |
3.2 Data reduction
The data reduction, from raw telescope data to calibrated spectra, was done in the standard manner (see e.g. Fuhrmann et al. 2008) and included the following steps: (i) baseline subtraction and Gauss fitting of (sub-) scans and the necessary steps of data quality control (on sub-scan level) including flagging of discrepant or otherwise bad sub-scans/scans, (ii) correction of small residual pointing offsets (typically ”), (iii) atmospheric opacity correction using the -measurements obtained with each scan, (iv) accounting for remaining systematic gain-elevation effects and finally (v) flux density calibration using the frequent primary calibrator measurements (Baars et al. 1977; Ott et al. 1994; Zijlstra et al. 2008). The overall measurement uncertainties are less than a few percent.
4 Analysis and Results
4.1 Radio loudness
Galaxies can be classified into two families, radio quiet and radio loud, depending on their monochromatic luminosity at radio () and optical () wavelengths. In this work, radio loudness () is defined as in Panessa et al. (2007), as /, where is the integrated radio flux density at GHz. For , sources are considered to be radio quiet, while for , galaxies are considered to be radio loud. Note that this classification is to some degree arbitrary, as there is a continuum of radio loudness values, with no obvious bimodality in this distribution. Radio loudness suffers from selection effects. As radio galaxies are selected to have high radio luminosities, this results in large values of and the lack of many low-power galaxies and AGNs (Sadler et al. 2002). This is the case for our sample, where the lower limit in radio flux density ( mJy) selects strong radio emitters, leading to a quite severe selection bias. In the optical regime, radiation from star-forming galaxies could be suppressed by dust, which would result in high radio-optical flux ratios (Afonso et al. 2005). These sources are, however, mostly revealed as submillijansky and microjansky radio sources and are placed at high redshifts (, see Barger et al. 2000), and are excluded from our sample. In addition, the observed optical emission of type 2 sources suffers from dust obscuration/extinction leading to an overestimation of radio loudness. The contribution of different components/processes to the radio emission (starburst activity, AGN) is a further complication. We refer to e.g. Sikora et al. (2007) for a detailed discussion on radio loudness related issues. Another problem arises when computing the optical luminosity. A correct computation of the parameter would imply a method to subtract the contribution of the host to the overall optical emission, e.g. via galaxy image decomposition (Ho & Kim 2014). This technique, although powerful, can be used on high-resolution images only, and at best for local sources. When the host-light subtraction is not achievable, cetral optical luminosity is the next good option (Ho et al. 2001). Unfortunately, the Effelsberg sample has been selected to avoid aperture effects. Thus, the SDSS fibers collect light from the galaxy nuclear regions as well as from the bulge, and we cannot retrieve central luminosities. All this evidence suggests that radio loudness varies strongly for different galaxy populations, and it is arduous to estimate for a mixed sample of radio-bright star-forming galaxies and AGNs placed at intermediate redshifts. We nevertheless calculate the radio loudness seeking for broad trends in our sample.
We calculate by using the logarithmic ratio between the -GHz flux density (measured with Effelsberg) and -band observed flux density in Jy (calculated from SDSS DR7). We find that (%) of our radio emitters are radio loud, and (%) are radio quiet. Radio loudness for each spectral class is shown in Fig. 3, and the statistics are listed in Tab. 1. LINERs are the most radio loud objects of the sample (mean , median ) and their reaches values of . Seyferts and LINERs show a gaussian distribution, with peaks at .There is no obvious bimodality in as seen in the overall Effelsberg sample (Fig. 3). The dividing line, though, corresponds well to the location of the peak in the observed radio loudness distribution.
4.2 Spectral indices
We calculate the two-point spectral index from our simultaneous Effelsberg measurements at and GHz (). The spectral index is defined as and is equal to:
| (1) |
where and are the observed flux densities at and GHz. Spectra are here considered as steep when , flat when , and inverted when . The mean (median) error on the spectral index is (), estimated from the standard propagation of errors:
| (2) |
where , are the respective flux density errors.
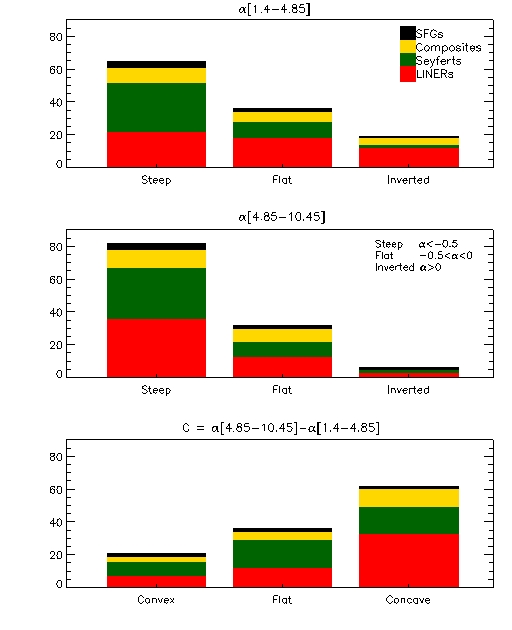
For comparison, we also calculate the two-point spectral index using the GHz (FIRST) and GHz (Effelsberg) non-simultaneous data (). We then calculate the spectral curvature, defined as , following Gregorini et al. (1984). Curvature classes are: concave (), flat (), and convex (or humped, ) spectra.
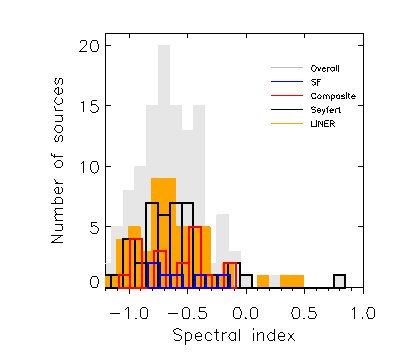
Fig.4 shows the two-point spectral index distributions as derived from Effelsberg data at and GHz for star-forming, composite, Seyfert and LINER galaxies. Seyferts and LINERs span a wider range than star-forming galaxies and composites. The range is for Seyferts, and for LINERs, while it is for composite and for star-forming galaxies. Mean (median) values per spectral class are: () for star-forming, () for composite, () for Seyfert, and () for LINER galaxies. We do not find significant differences between the galaxy classes. The distribution of the overall sample shows a peak at , and a second tentative one at . As suggested by a previous study based on -GHz observations of objects from NRAO-MPI -GHz surveys of extragalactic sources (Witzel et al. 1979), the distribution of the two-point spectral indices at these frequencies exhibits a double peak. Witzel et al. (1979) found that galaxies are mainly responsible for the peak at , while quasars form the peak at . We do not see this galaxy/quasar division as our redshift limits and exclusion of broad emission line systems ensures we have very few quasar-like objects in our sample.
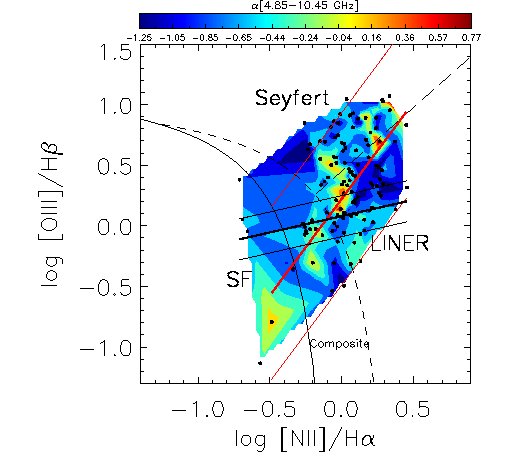
Fig. 5 shows the two-point spectral index distribution in the [NII]-based diagnostic diagram. Steep spectra are shown as blue, flat spectra green, and inverted spectra yellow-red. The red line represents the regression curve of the % most flat- and inverted-spectrum sources ( galaxies). The parallel red thinner lines are the and lines. The black line is the regression curve of all steep-spectrum sources (, galaxies in total, % of the sample). Parallel black thinner lines are . Flat and inverted sources in our -galaxy sample are mainly clustered along a diagonal line. The line extends from the end of the star-forming sequence to the Seyfert region. These trends suggest a possible spectral “flattening sequence”, which crosses the composite region of the diagram, and roughly follows the division line between Seyferts and LINERs. An extra region of spectral flattening is located at the bottom of the LINER region, close to the composite-LINER division line. For a sample which also includes Effelsberg measurements of sources with S/N ( additional galaxies, for a total of objects), the trend is similar. The lack of S/N cut recovers, however, mostly LINERs with steep spectral index.
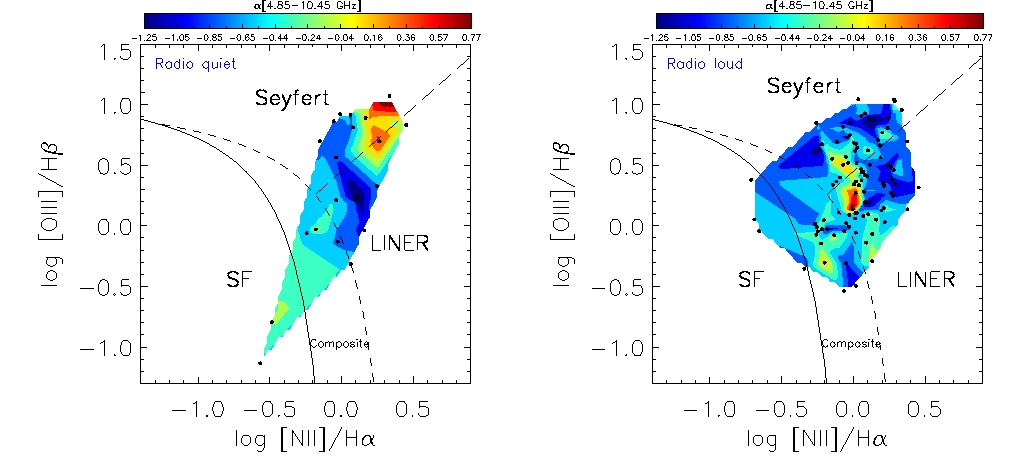
In Fig. 6 we study whether this trend is persistent in the case of separated radio quiet () and radio loud () objects. We conclude that no clear trend between radio-quiet and radio-loud objects is visible, and the spectral index flattening sequence mostly results from the combination of radio quiet high-metallicity star-forming galaxies and [O iii] emitters (Seyferts/LINERs), and radio-loud LINERs and composites. It is nonetheless tantalising to note that the most extreme inverted radio spectra correspond to the most extreme optical line ratios for radio quiet systems, while for radio loud they seem to favour optical line diagnostics close to the Kewley et al. (2001) dividing line.
Fig. 7 shows cumulative histograms of the spectral indices ( and ) and curvature, calculated for each galaxy class. The top panel shows that out of Effelsberg sources have steep spectra between and GHz. Seyfert galaxies dominate the distribution ( sources), though they are not the most abundant spectral class in our sample. The other steep-spectrum sources are: star-forming, composite, and LINER galaxies. On the other hand, LINERs show the highest number of flat and inverted spectra at these frequencies ( and , respectively). At the higher Effelsberg frequencies (- GHz, middle panel), the number of steep-spectrum sources slightly increases ( instead of ), especially in case of LINERs (which are now ). The number of star-forming, composite, and Seyfert galaxies remains almost constant compared to the - GHz frequency range (, , and , respectively). The bottom panel shows the spectral curvature trends. About of sources display a negative curvature (convex shape), with high fluxes at the intermediate frequency ( GHz). Seyferts dominate the “concave” (positive curvature) and “flat” (zero curvature) distributions ( out of and out of sources, respectively), while LINERs are the class of objects showing the highest number of “convex” spectra ( over total sources with negative curvature), peaking at GHz.
GHz-peaked spectra are sometimes an indication of extremely compact sources (GHz peaked-spectrum, or compact steep-spectrum sources, O’Dea 1998), whose nucleus is bright at high radio frequencies (up to GHz). A concave shape often results, in contrast, from the steep-spectrum contribution of extended structures (lobes) at GHz, and the flat/inverted contribution of the nucleus. The latter makes the spectra rise at GHz. However, it must be mentioned that with our Effelsberg data ( GHz) we are mainly looking at radio emission from the central region, or at a contamination of quiescent jet emission and activity in the nucleus. This is because the lobes, when present, mostly emit at lower frequencies, due to their steep spectra and the aging of the synchrotron radiation. Therefore, we assume that the flattening of the spectral indices come almost exclusively from nuclear activity. Following the relation between turnover frequency, source size, turnover frequency and peak flux density, as well as magnetic field strength (Kellermann & Pauliny-Toth 1981) our results imply that the high frequency emission of Seyferts along the division line between Seyferts and LINERs in the [NII]-based diagnostic diagram is dominated by compact radio emission from central regions (flat spectra), whereas the emission of LINERs is dominated by extended emission from larger source components (steep spectra). Those could be due to arcsecond sized components that may be associated with nuclear jets, hot spots in radio lobes, or very compact wind/shock regions that are bright in the radio domain.
Spectral information includes the effects of variability, i.e. changes in the spectral slope between - GHz and - GHz. This might be due to flux increase at the highest frequencies of our spectral range, because of the activity in the compact nucleus on time scales of days to years. FIRST data were collected about years ago, so a change in the spectral index may be associated with nuclear variability. However, for the non-blazar like objects considered in this study, variability is in general not high in the spectral interval GHz (Eckart et al. 1989). This means that we can safely make assumptions on the shape of the spectra, without taking variability into account.
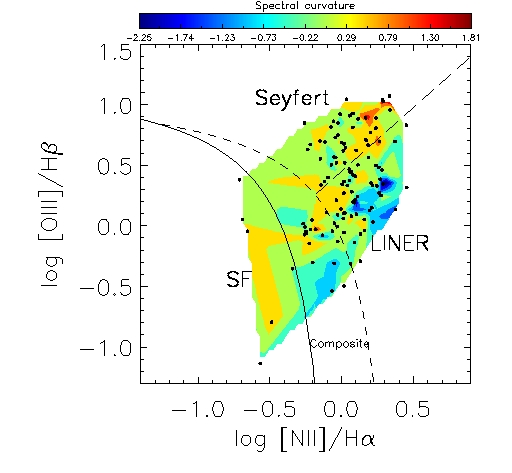
Fig. 8 illustrates the color-coded spectral curvature distribution in the [NII]-based diagram. The diagram shows a clearer difference between Seyferts and LINERs with respect to the spectral index distribution in Fig. 5. This is because Seyferts tend to have a zero or positive curvature, indicating flat or concave-shaped spectra, while LINERs show more convex spectra.
4.3 Black hole mass
Following Gültekin et al. (2009), we calculate the black hole masses for each source in the Effelsberg sample from the scaling relation with stellar velocity dispersion (), which are provided in the SDSS DR7 and measured from the galaxy absorption lines:
| (3) |
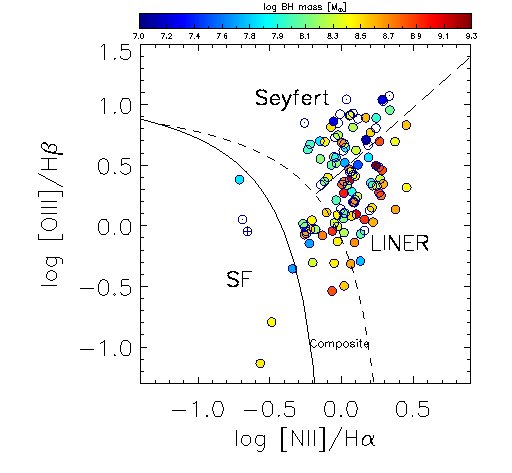
Fig. 9 shows the distribution in the [NII]-based diagram. Black-hole masses range from to . The objects with the highest black hole masses are mostly located in the composite and LINER regions of the diagram. Mean (median) logarithmic black-hole masses are : () for star-forming, () for composite, () for Seyfert, and () for LINER galaxies. Assuming the relation (see Sect. 5.1), this trend points to LINERs being the oldest and most evolved spectral class in the diagram. We need to point out, however, that these differences in among the four galaxy spectral classes may not be significant, since for each object the calculation relies on the accuracy of the stellar velocity dispersion measurements.
For a few objects, indicated with white circles in Fig. 9, the determination of the black hole mass is not reliable. Reliability is estimated according to SDSS error flags on the measurement of . We notice that the latter objects are not isolated cases of stellar velocity dispersion mismeasurements, but they occupy precise regions of the diagnostic diagrams of the cross-matched SDSS-FIRST parent sample, namely the upper part of the Seyfert region (see Fig. 15, right panel). We checked the SDSS morphology, and based on it we speculate that the Seyferts with very high [O iii]/H could be identified with the newly discovered population of “green beans” galaxies (Schirmer et al. 2013). This class of objects is indicated with red triangles in Fig.15. Those which are Seyferts show especially high log [O iii]/H ratios (), appear green in the SDSS images, and often show signs of perturbed morphology and post-merger activity. Those perturbations the green beans undergo could be an explanation of the stellar velocity dispersion mismeasurements.
A second class of objects showing velocity dispersion mismeasurements, this time not flagged in the SDSS DR7, is represented by only two star-forming sources in the Effelsberg sample (indicated with a white circle and a crossed white circle in Fig. 9) and by a larger SDSS-FIRST parent population (blue squares in Fig. 15). Those galaxies may be associated to the “green peas” (Cardamone et al. 2009). Green peas are starburst galaxies and are very compact. They also show signs of merger activity. According to Cardamone et al. (2009), the green peas might be the downscaled version of high-redshift massive merging galaxies, observed in the local universe due to the mass downsizing (less massive galaxies evolve in a longer interval of time).
In Fig. 9 we see an apparent trend to higher-mass black holes for LINER systems compared to Seyferts, increasing initially between star-forming galaxies to Seyferts. Aknowledging the small number statistics, and the presence of unreliable measurements in the sample, this trend still supports a possible evolution from star-forming to LINER galaxies. The black-hole mass distribution of the parent sample (Fig. 15), thanks to a much bigger sample size, points to a clear transition from low-metallicity star-forming galaxies to composites and LINERs, where the latter are found to be the galaxies harboring the most massive black holes in the sample.
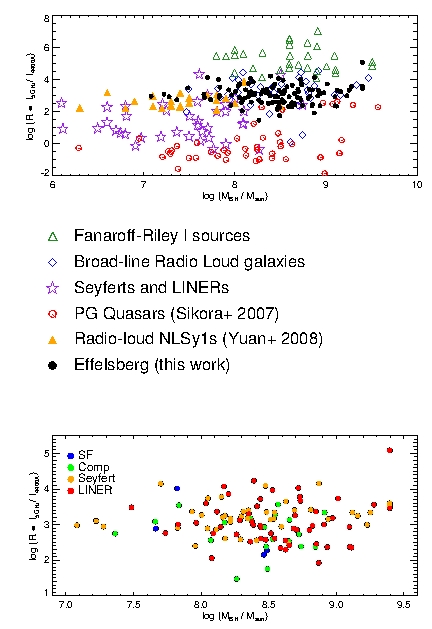
The upper panel of Fig. 10 shows the position of the Effelsberg objects in the black-hole mass-radio loudness (-) plane. A set of different galaxy classes from Sikora et al. (2007) are represented in different colors and symbols: FR I, broad-line radio loud galaxies, Seyferts and LINERs, and Palomar-Green (PG) quasars. Radio-loud Narrow-Line Seyfert 1s (NLSy1s) are from Yuan et al. (2008). Our sample (black dots) is mostly consistent with broad-line radio loud galaxies and partly with radio loud NLSy1s, but not with Seyferts and LINERs. This finding is consistent with our previous discussion on the radio flux lower cut of the Effelsberg sample, which mostly selects powerful radio-loud objects with high . The lower panel shows our Effelsberg sample divided by spectral class, according to the [NII]-based diagnostic diagram. The four spectral classes are almost equally spread in the - plane.
4.4 Radio and Optical morphologies
On one hand, a host’s optical morphology can reveal signs of galaxy-galaxy interactions, and information on galaxy stellar and gas contents. Spectroscopic surveys find a link between emission type (as classified in the optical emission-line diagnostic diagrams) and Hubble type (Ho et al. 1997). HII emission tends to be in late type spirals and ellipticals, including low-luminosity galaxies. LINERs and Seyferts tend to inhabit early-type spirals and to avoid low-luminosity galaxies instead, suggesting their presence in more evolved hosts (Moles et al. 1995; Ho et al. 1997). On the other hand, radio morphology can give important hints on the evolutionary stage of a galaxy. For instance, lobe extensions and shapes can be used to measure the AGN age (Shulevski et al. 2012). The presence of jets in radio images helps to constrain cases where AGN feedback can regulate star formation.
In this framework, we have visually analyzed the FIRST radio images of the Effelsberg sample. About % of the objects are unresolved at FIRST resolutions (”), and they appear as point sources in the images. The resolved sources show extended radio lobes, and are almost exclusively classified as LINERs. In particular, we find galaxies (% of the sample) showing lobes or jets in FIRST images, and of them are LINERs according to the [NII]-based emission-line diagnostic diagram (see Tab. 2). This is in agreement with our hypothesis that LINERs might be dominated by lobe emission in the radio domain, while Seyferts are core dominated. Other sources with extended radio emission are classified as Seyferts () and composites (). sources show less clear signs of extended emission (e.g. elongated structures, not clearly identifiable with lobes). These are again mostly LINERs (). Finally, galaxies show multiple point sources in the radio images. This could be either due to the presence of bright dense star-forming regions (e.g. in case of starburst galaxies) or the presence of an unrelated source of radio emission.
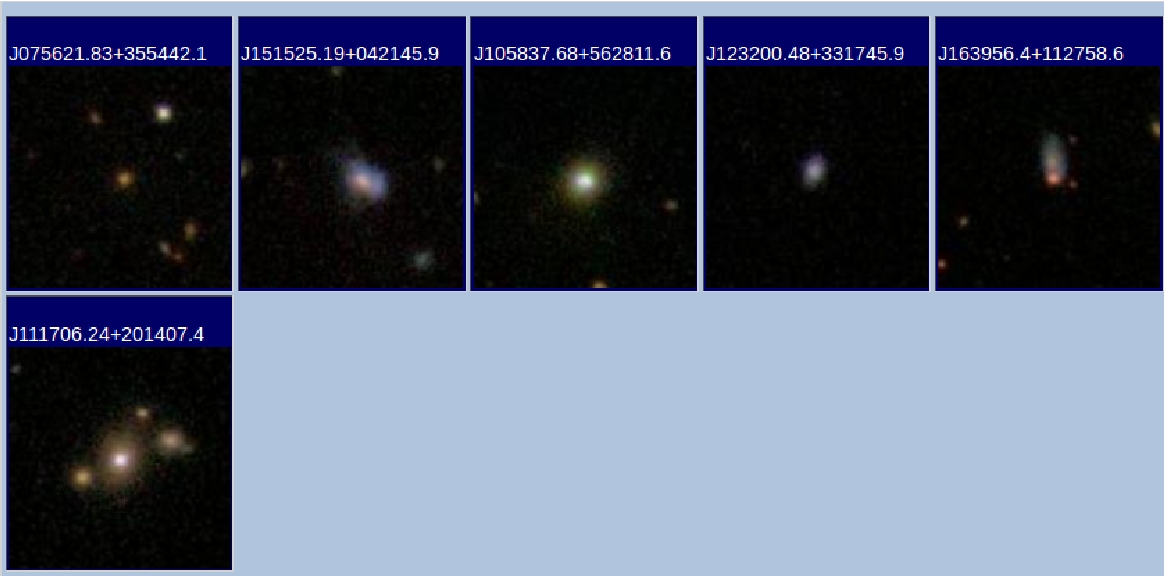
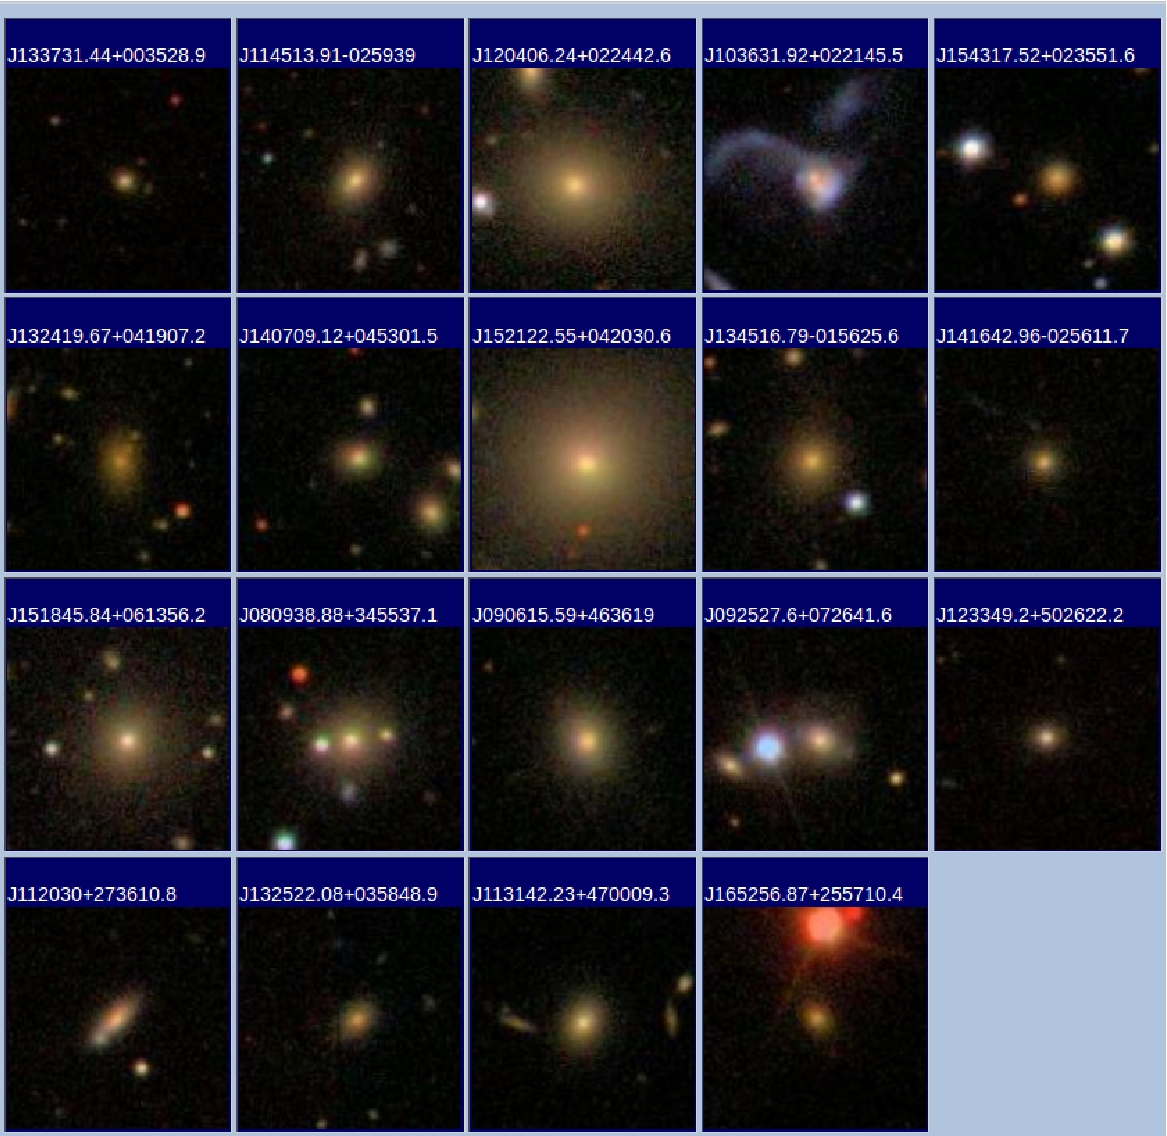
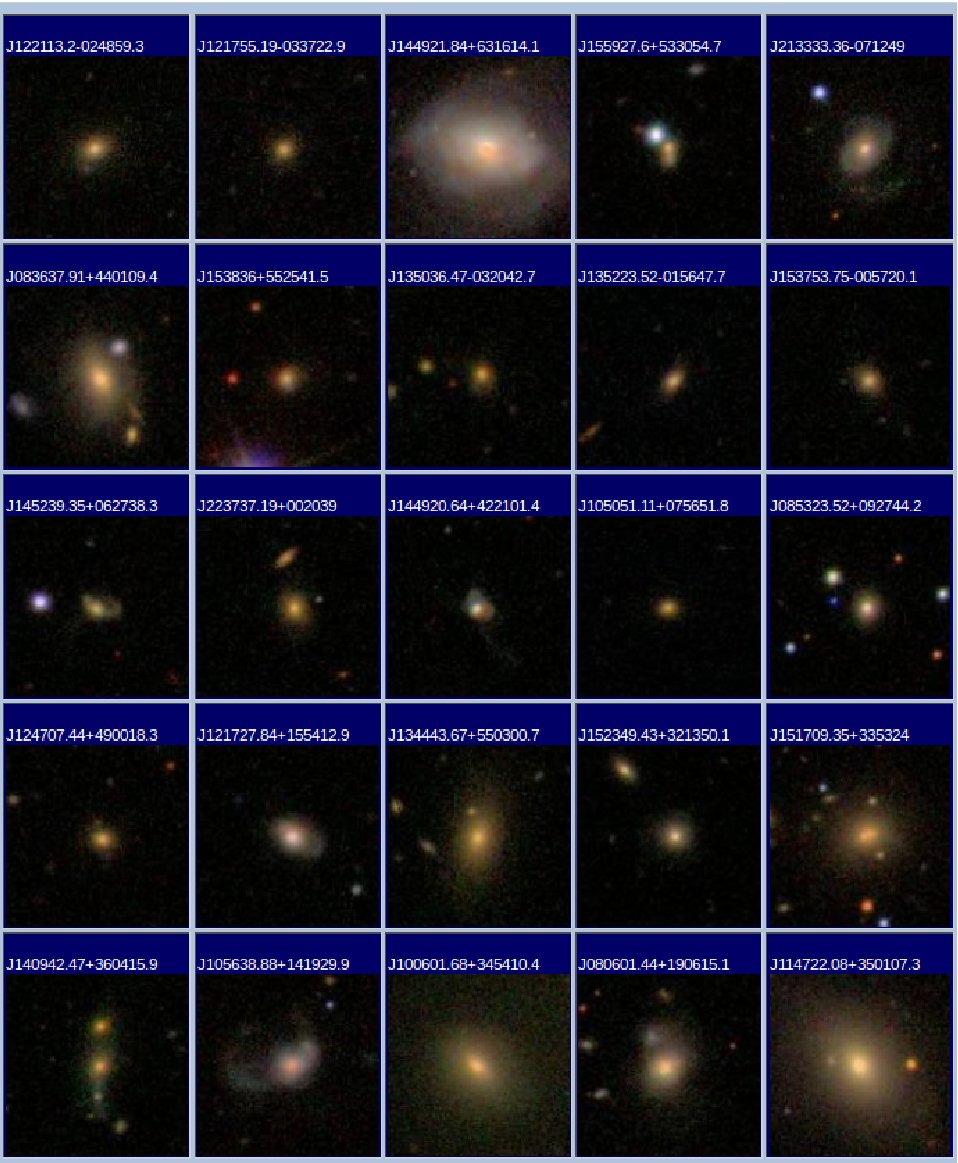
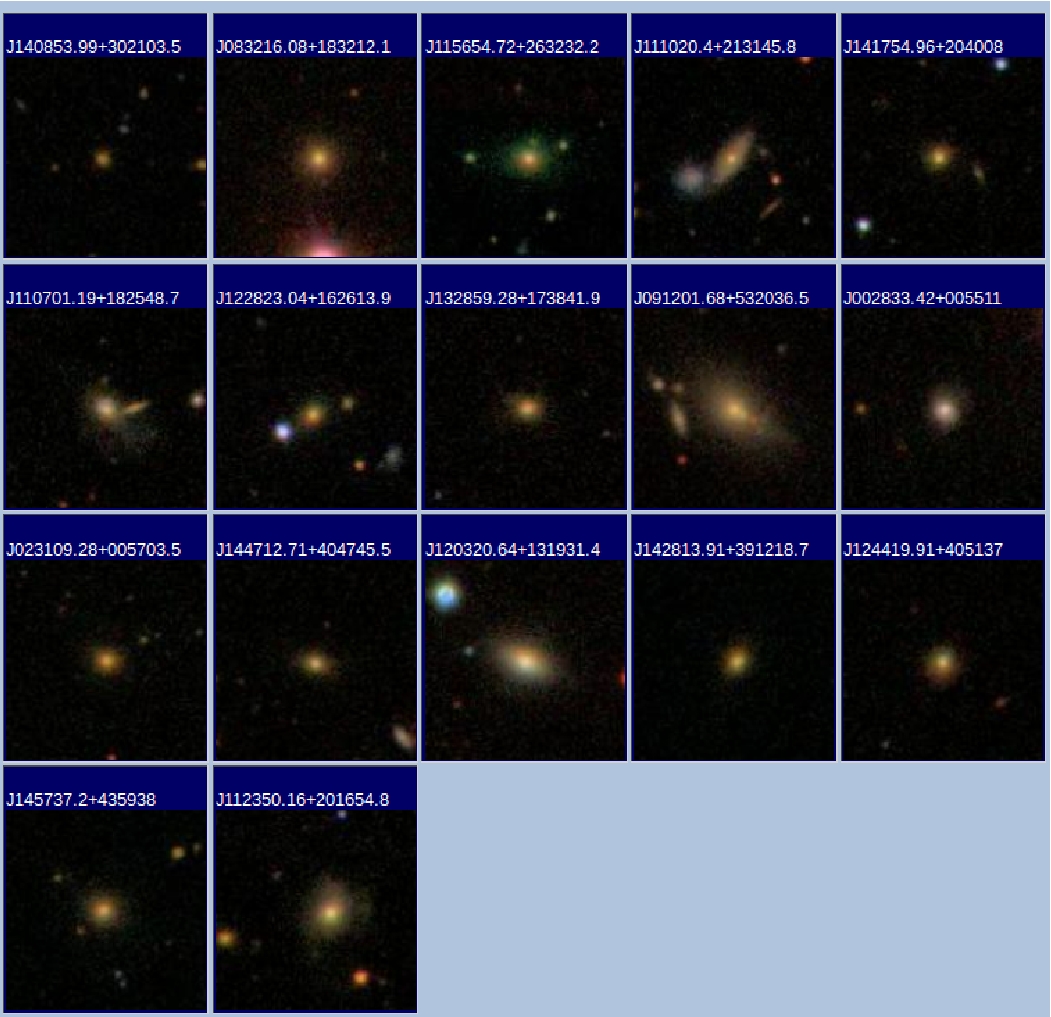
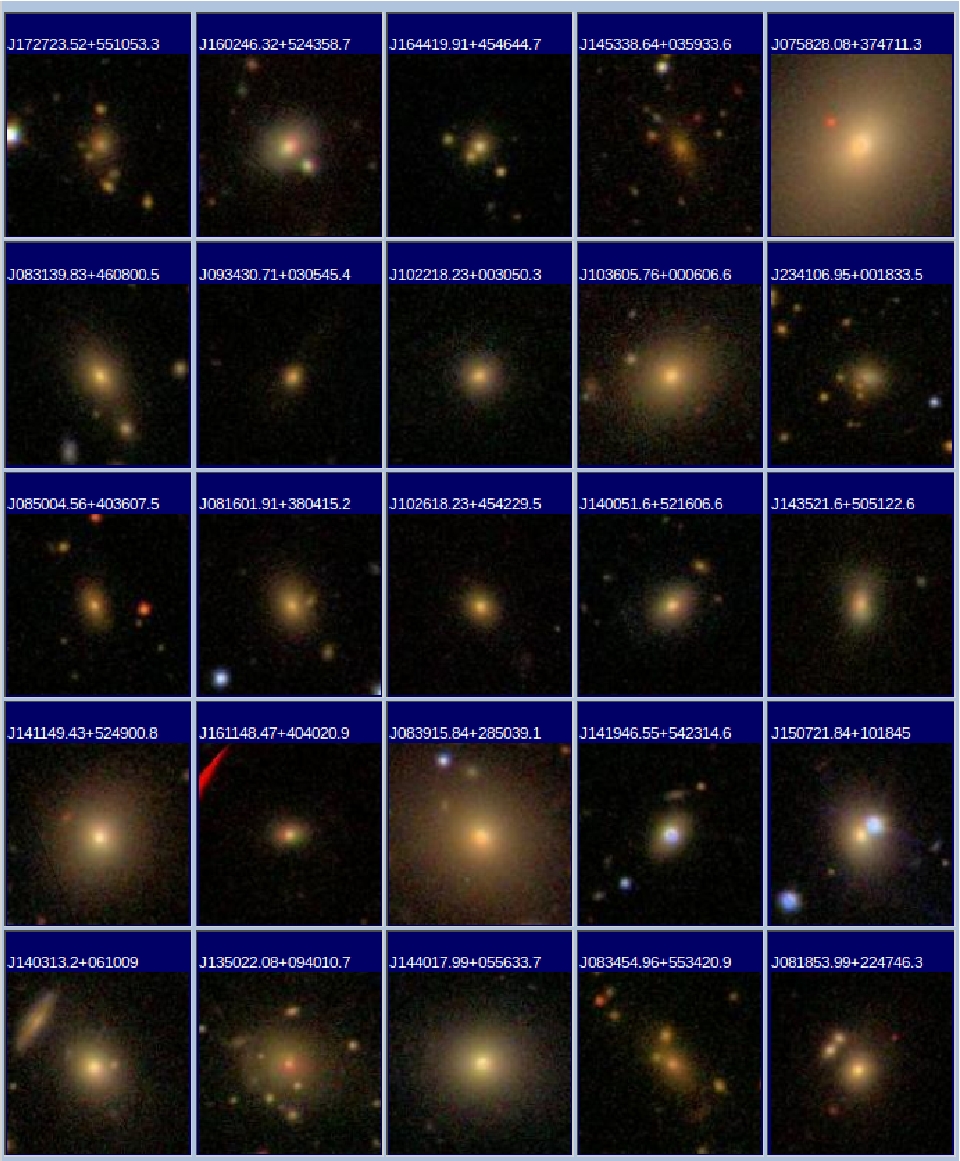
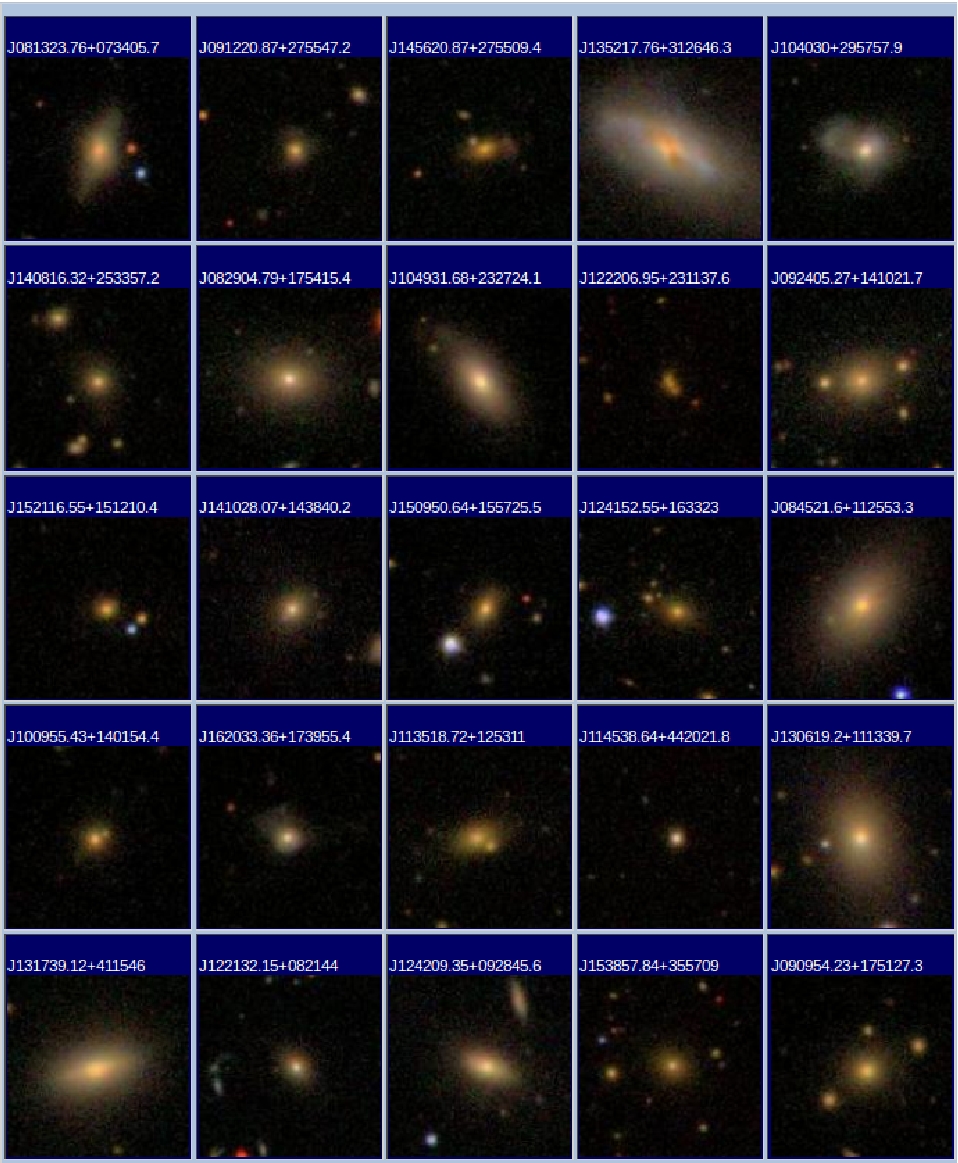
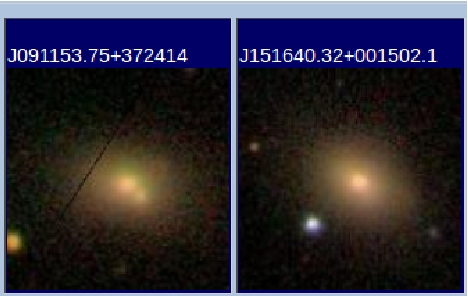
SDSS optical images of our sample are the only ones available for our objects, given their intermediate redshift. Images do not show peculiar morphologies, except for a few post-merger cases () and galaxies with signs of a possible interaction with neighboring galaxies (). A detailed analysis of the optical morphology is beyond the scope of the current work. However, we notice that galaxies with extended features such as lobes and jets show lenticular (S0) and elliptical (E) morphology. Often, it is not possible to distinguish between the two. SDSS images of our sample, separated by spectral class, can be found in the Appendix (Fig. 16-19).
The merging and interaction signatures in the SDSS images of the parent sample are present in galaxies belonging to the upper part of the star-forming sequence (low-metallicity star-forming galaxies). Unfortunately, low-metallicity starbursts are under-represented due to the -GHz flux lower limit, and only two candidate post-merger galaxies are found in the Effelsberg sample (Fig. 16, panel 2 and 5). A different sample (i.e. with a lower radio flux limit) might be able to recover more low-metallicity starbursts and improve the poor statistics, revealing that interactions are a common feature in this class of young objects. The -GHz flux lower limit still selects many Seyfert galaxies. Seyferts with perturbed morphologies might be more abundant in the Effelsberg sample, where we count galaxies with stellar velocity dispersion mismeasurements. In particular, we see post-merger signs in the Seyferts with high [O iii]/H, a characteristic that was already noted by Schirmer et al. (2013) and may have important implications for the development of a galaxy evolution scheme accross the diagnostic diagrams. Their SDSS colors are also redder than those of galaxies placed in the star-forming region.
5 Discussion
5.1 correlation
Studies on host-dominated AGNs suggest that AGNs are more likely to be hosted in massive galaxies (Kauffmann et al. 2003a; Haggard et al. 2010; Vitale et al. 2013), though Aird et al. (2012) claim that the trend is due to the Eddington-ratio distribution: a higher fraction of AGNs are detected in massive hosts as they are intrinsically more luminous. Vitale et al. (2013) show that up to intermediate redshifts () AGN hosts have stellar masses of , and that mass increases along the left branch of the distribution in the [NII]-based diagram (see also Kauffmann et al. 2003a; Stasińska et al. 2006). Low-metallicity star-forming galaxies have, therefore, lower stellar masses than metal-rich star-forming galaxies. Star-forming galaxies have, in general, lower stellar masses than composites and AGNs. This means that, by selecting mailnly metal-rich star-forming galaxies, composites, and AGNs from the optical-radio domain (Vitale et al. 2012), we automatically exclude galaxies with less massive hosts from the sample.
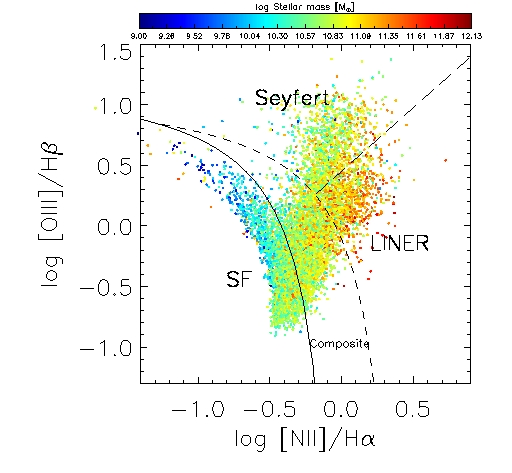
Fig. 11 shows the SDSS-FIRST stellar mass distribution in the [NII]-based diagram. Stellar masses are provided in the MPA-JHU DR7 of spectrum measurements444http://www.mpa-garching.mpg.de/SDSS/DR7/, as mentioned in Sect. 2.1. Metal-poor star-forming galaxies exhibit the lowest stellar mass values ( ), while LINERs the highest ( )555Data on galaxy stellar masses from the MPA-JHU emission line analysis of SDSS DR7. Average black-hole masses are low for star-forming galaxies ( ), increase for composites and Seyfers and are one order of magnitude higher than in SFGs for LINERs. This result is in agreement with LINERs mostly sitting in large ellipticals (Ho et al. 1997), and with the trend in Fig. 9. The trend is also in agreement with the studies of the correlation between small scales properties of the central black hole and large scale properties of galaxies in the local universe (Ferrarese & Merritt 2000; Gebhardt et al. 2000; Marconi & Hunt 2003; Gültekin et al. 2009; Kormendy & Ho 2013), though the estimation of black-hole masses relies of different methods and it is still affected by large errors.
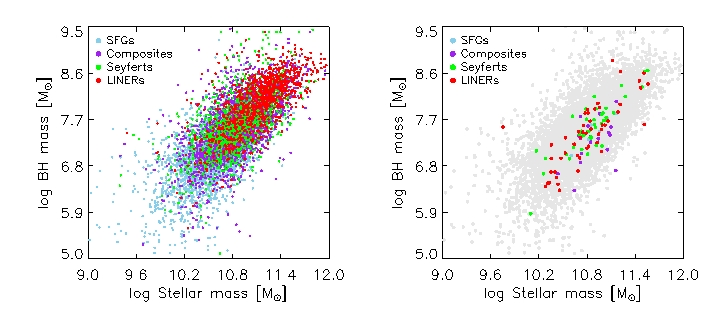
The question arises whether the stellar mass is always related to the mass of the black hole. In Fig. 12 we show the trend between average stellar SDSS masses and BH masses of the parent sample (left panel) and the Effelsberg sample (right panel). The star-forming galaxies appear to have the lowest stellar and BH masses. The distribution shows a progressive increase in both values for composites, Seyferts and LINERs. The Effelsberg sample, due to the smaller sample size, does not show the same clear trend.
The trend between stellar and BH mass, here shown for each spectral class of the SDSS-FIRST and Effelsberg samples, could be interpreted as the more massive and more high metallicity galaxies being the ones where the AGN can be “switched on” (Seyferts and LINERs). Stellar mass build up and BH accretion are connected and it is possible that AGN-feedback manifests itself in massive and more evolved hosts, with . This consideration does not include Narrow-Line Seyfert 1 galaxies, which are anyhow rare objects with low .
5.2 An evolutionary sequence in the [NII]-based diagram?

An important next step would be to set a simple and universally valid galaxy evolutionary scenario that explains how blue star-forming galaxies turn into red passively-evolving systems. Some models take into account this kind of transition and the necessity of a mechanism to truncate star formation (eg. Hopkins et al. 2006), but there is still the need of observational confirmations. The current standard models of galaxy evolution (Hopkins et al. 2008a, b) rely on major mergers and/or interactions to trigger both star formation and AGN activity in two merging late-type galaxies. Then the system relaxes and forms an early-type galaxy hosting a radio AGN. We are interested in testing a scenario where the end of the star-forming sequence represents a turnover point in galaxy evolution, i.e. the start of the quasar phase, which leads to the colour and morphological transformation of the hosts (transition from the active blue cloud to the “dead” red sequence).
The Effelsberg observations help us to probe galaxy spectral evolution in radio emitters that are classified as star-forming, composite, Seyfert and LINER galaxies in the optical emission-line diagnostic diagrams, by looking at their combined optical-radio properties. In particular, we see indications of a flattening of the spectral index along the composite-AGN sequence of the diagnostic diagrams. A flattening of the spectral index is expected due to the presence of compact nuclei/jet emission, that could indicate the presence of AGN activity as mechanism that shuts star formation down. A similar sequence was first noticed in Vitale et al. (2012, 2013). Vitale et al. (2012) have shown that the radio luminosity at GHz progressively increases from star-forming galaxies to Seyferts and LINERs. The H luminosity - a tracer of star-formation activity - decreases in the same direction. This indicates that strong optical emission is a characteristic sign of recent star-formation, thus of the youth of a galaxy, while radio emission appears as a “later” feature, in massive and red ellipticals. Vitale et al. (2013) found that galaxy stellar masses, and age and metallicity of the stellar populations, increase progressively from star-forming galaxies and composites, to AGNs. These findings strengthen the hyphothesis of a galaxy evolutionary sequence based on the analysis of optical and radio properties of normal galaxies and AGN hosts.
In additional support to this scenario, other studies have already been conducted on separate optical and radio samples. Of special interest is the study of high- and low- excitation systems (see e.g. Kozieł-Wierzbowska & Stasińska 2011). It has been suggested that the two major radio AGN populations - the powerful ( W/Hz) high-excitation, and the weak () low-excitation radio AGNs - represent an earlier and later stage of massive galaxy build-up (Hardcastle et al. 2006; Smolčić 2009). As support for this hyphothesis, a clear dichotomy is found between the properties of low-excitation (LEGs) and high-excitation (HEGs) galaxies. In the radio, FR I are mostly LEGs, while some FR II are HEGs. HEGs are hypothesised to evolve into LEGs due to changes in the black-hole accretion rate, maybe after accreting material is no longer available. The hosts of LEGs have the highest stellar masses, reddest optical colors, and highest black holes masses, but accrete at low rates. On the other hand, the high-excitation radio AGNs have lower stellar masses, bluer optical colors (consistent with the green valley), lower mass black holes that accrete at high rates (Smolčić 2009).
A link could also exist between HEGs/LEGs and Seyferts/LINERs. Some optically-classified Seyferts appear to be mostly luminous FR II radio sources, while LINERs are more consistent with FR Is (Buttiglione et al. 2010) and a “later” stage of radio evolution. FR II hosts were found to be bluer than hosts of FR Is and often showed signatures of mergers (Heckman et al. 1986; Baldi & Capetti 2008; Ramos Almeida et al. 2012). Also, the host galaxies of FR Is were found to be more massive than the FR II hosts (Owen & Laing 1989; Govoni et al. 2000). This might be due to the fact that also FRI and FRII have been hypothesized to be AGNs with different BH accretion rates (Buttiglione et al. 2010). These studies seem to point to an evolution from Seyferts to LINERs, possibly regulated by AGN-feedback. Therefore, LINER activity might be the “smoking gun” of the highly effective suppression mode (radio mode) of AGN feedback (Schawinski et al. 2007). Consequently the question we want to address is: are LINERs the last stage of galaxy evolution across the diagnostic diagrams?
In Fig. 5, the possible presence of a sequence of galaxies with flat or inverted spectra is a hint of increased nuclear activity along the same. The sequence could be explained as an increase in the strength of the ionising field of the galaxies, due to disk accretion. LINERs, which are mostly found in old hosts, do not show this feature and represent a different class of shock-ionised (rather than photo-ionised) objects. In LINERs, AGN activity could have led to negative feedback, where powerful jets and/or galactic superwinds blow most of the gas away and prevent star-formation.
As seen in Fig. 5, radio-AGN signature inferred from the spectra is also present in metal-rich star-forming galaxies. We find three possible scenarios to explain flat-spectrum radio sources in the star-forming region of the diagnostic diagram:
-
•
The enhancement of star formation might be triggered by the AGN, which induces gas compression and acts as positive feedback.
-
•
Sources host young AGNs, and the star formation in the galaxy has not yet been suppressed. This could be the case for strong and widespread star formation, where the timescale for it to cease could be several hundred Myr - potentially longer than the lifetime of the AGN. If AGNs are recurrent phenomena, it might be a periodic process for multiple episodes of the AGN that progressively slows down the star formation throughout the galaxy.
-
•
The AGN is not strong enough to suppress the star formation entirely, or there is no link between the AGN and the star formation suppression. In this latter case, flat-spectrum radio galaxies in the star-forming region of the diagram would represent counter-examples to the hypothesis of AGN quenching star formation.
Finally, LINERS with (Fig. 5) might be older AGN with radio emission dominated by the echoes of old electron populations, as also evident from the radio images (Fig 19). This fits with our nominal evolutionary sequence, and is consistent with the natural progression from that.
The importance of mergers at has been unclear, and assumed to be small, given the low observed merger rate (e.g. Lotz et al. 2008) before the discovery of Ultra-Luminous Infra-Red Galaxies (ULIRGs) and the “green peas” class of objects (Cardamone et al. 2009), which may represent the downscaled version of high-redshift merging galaxies. The low stellar-mass and low-metallicity galaxies merging at may well represent the beginning of an evolutionary sequence traced by the diagnostic diagrams at (Fig. 13). Along the star-forming sequence of the [NII]-based diagram and up to the composites-AGN region, the galaxy total stellar mass has been found to increase (Vitale et al. 2013), probably due to the presence of gas brought up by mergers/interactions. At the same time, the black hole is fed and its mass increases.
To summarize, while there are some studies aiming at explaining the most latest stages of galaxy evolution, observational proofs of the transition from star-forming to high-excitation systems are still missing, especially in the radio-optical regime. Our spectral index flattening sequence traces the increase of the ionising field from star-forming galaxies to AGNs, probably due to disk accretion. AGN activity may translate into feedback, which regulates star formation in the passage from composite to Seyfert and LINER galaxies.
6 Conclusions
We have conducted observations with the Effelsberg 100-m telescope to probe galaxy evolution in radio emitters that are classified as star-forming, composite, Seyfert and LINER galaxies in the optical emission-line diagnostic diagrams, by looking at their combined optical-radio properties. We have found indications for a flattening of the spectral index along the composite-AGN sequence of the diagnostic diagrams. This supports a scenario where the end of the star-forming sequence represents a turning point in galaxy evolution, i.e. the start of the quasar phase, which leads to the colour and morphological transformation of the hosts. The analysis of the spectral index distribution, combined with the information on the radio morphology (low resolution, from FIRST survey at GHz), have been presented to investigate the nature of the sources along the AGN branch, their active state, and the chance to spot an evolutionary sequence. Our conclusions are:
-
•
The objects in our sample show a possible sequence of flattening spectral indices that extend from the high-metallicity end of the star-forming sequence in the [NII]-based diagnostic diagram, to the Seyfert region, with the highest (most inverted) values found among the AGNs. The sequence crosses the composite region and follows the Seyfert/LINER division line. It is consistent with a progressive hardening of the ionizing field of the galaxy, due to intense nuclear activity.
-
•
The spectral curvature distribution shows the difference in the Seyfert and LINER spectra, with Seyferts having flatter and LINER more convex (-GHz peaked) spectra. This suggests that the high frequency radio-emission of Seyferts along the division line between Seyferts and LINERs in the [NII]-based diagram is dominated by small radio core components, whereas the emission of LINERs is dominated by larger source components. Those could be due to milliarcsecond sized components associated with nuclear jets, compact working points in radio lobes, or very compact wind/shock regions that are bright in the radio domain. This hypothesis is consistent with LINERs’ radio morphology.
-
•
The spectral index flattening seems to be significant for sources that are in the middle of a galaxy evolutionary sequence that starts with low-metallicity star-forming galaxies and ends with LINERs and passive galaxies, after morphological and color transformation. In this respect, nuclear activity triggering AGN feedback may have a role in first enhancing (in spectroscopically-classified star-forming galaxies) and then shutting down star formation in the hosts, and building up the galaxy color bimodality.
-
•
Our results are consistent with previous findings that star-forming galaxies, composites, Seyferts and LINERs show progressively older stellar populations (Vitale et al. 2013), redder colors (e.g. Schawinski et al. 2007; Schawinski 2009) and higher black hole masses, and with radio-loud AGN being two earlier and later stages of massive galaxy build-up (Hardcastle et al. 2006; Smolčić 2009), corresponding to Seyferts and LINERs. The presence of merging and post-merging features in galaxies belonging to the SFGs branch strengthens the scenario of merging-triggered star formation at intermediate redshifts, and sets it at the beginning of the evolutionary sequence.
This trend, however, has to be confirmed by follow-up observations extending to lower radio flux densities ( mJy) on a larger galaxy sample. Future high-resolution imaging will help further constrain the nature of radio-emitters along the flattening sequence in the [NII]-based diagram, and study AGN-feedback in sources that are just leaving the star-forming galaxy branch.
Acknowledgements.
M. Vitale is supported by the International Max-Planck Research School (IMPRS) for Astronomy and Astrophysics at the Universities of Bonn and Cologne. This work is partly based on observations with the 100-m telescope of the MPIfR (Max-Planck-Institut fuer Radioastronomie) at Effelsberg. The authors would like to thank Alex Kraus for support and help during observations and data reduction. The FIRST Survey is supported in part under the auspices of the Department of Energy by Lawrence Livermore National Laboratory under contract W-7405-ENG-48 and the Institute for Geophysics and Planetary Physics. The Sloan Digital Sky Survey is a joint project of the University of Chicago, Fermilab, the Institute for Advanced Study, the Japan Participation Group, Johns Hopkins University, the Max Planck Institute for Astronomy, the Max Planck Institute for Astrophysics, New Mexico State University, Princeton University, the United States Naval Observatory, and the University of Washington. Apache Point Observatory, site of the SDSS, is operated by the Astrophysical Research Consortium. Funding for the project has been provided by the Alfred P. Sloan Foundation, the SDSS member institutions, NASA, the NSF, the Department of Energy, the Japanese Monbukagakusho, and the Max Planck Society. The SDSS Web site is http://www.sdss.org. This work was supported in part by the Deutsche Forschungsgemeinschaft (DFG) via the Cologne Bonn Graduate School (BCGS), and via grant SFB 956. We had fruitful discussions with members of the European Union funded COST Action MP0905: Black Holes in a violent Universe and the COST Action MP1104: Polarization as a tool to study the Solar System and beyond. We received funding from the European Union Seventh Framework Program (FP7/2007-2013) under grant agreement No.312789.References
- Abazajian et al. (2009) Abazajian, K. N., Adelman-McCarthy, J. K., Agüeros, M. A., et al. 2009, ApJS, 182, 543
- Afonso et al. (2005) Afonso, J., Georgakakis, A., Almeida, C., et al. 2005, ApJ, 624, 135
- Aird et al. (2012) Aird, J., Coil, A. L., Moustakas, J., et al. 2012, ApJ, 746, 90
- Aller & Richstone (2007) Aller, M. C. & Richstone, D. O. 2007, ApJ, 665, 120
- Baars et al. (1977) Baars, J. W. M., Genzel, R., Pauliny-Toth, I. I. K., & Witzel, A. 1977, A&A, 61, 99
- Baldi & Capetti (2008) Baldi, R. D. & Capetti, A. 2008, A&A, 489, 989
- Baldry et al. (2004) Baldry, I. K., Glazebrook, K., Brinkmann, J., et al. 2004, ApJ, 600, 681
- Baldwin et al. (1981) Baldwin, J. A., Phillips, M. M., & Terlevich, R. 1981, PASP, 93, 5
- Barger et al. (2000) Barger, A. J., Cowie, L. L., & Richards, E. A. 2000, AJ, 119, 2092
- Baum et al. (1995) Baum, S. A., Zirbel, E. L., & O’Dea, C. P. 1995, ApJ, 451, 88
- Becker et al. (1995) Becker, R. H., White, R. L., & Helfand, D. J. 1995, ApJ, 450, 559
- Benson et al. (2003) Benson, A. J., Bower, R. G., Frenk, C. S., et al. 2003, ApJ, 599, 38
- Best et al. (2005) Best, P. N., Kauffmann, G., Heckman, T. M., & Ivezić, Ž. 2005, MNRAS, 362, 9
- Bower et al. (2006) Bower, R. G., Benson, A. J., Malbon, R., et al. 2006, MNRAS, 370, 645
- Bruzual & Charlot (2003) Bruzual, G. & Charlot, S. 2003, MNRAS, 344, 1000
- Buttiglione et al. (2010) Buttiglione, S., Capetti, A., Celotti, A., et al. 2010, A&A, 509, A6
- Cardamone et al. (2009) Cardamone, C., Schawinski, K., Sarzi, M., et al. 2009, MNRAS, 399, 1191
- Cattaneo et al. (2005) Cattaneo, A., Blaizot, J., Devriendt, J., & Guiderdoni, B. 2005, MNRAS, 364, 407
- Cattaneo et al. (2009) Cattaneo, A., Faber, S. M., Binney, J., et al. 2009, Nature, 460, 213
- Cid Fernandes et al. (2011) Cid Fernandes, R., Stasińska, G., Mateus, A., & Vale Asari, N. 2011, MNRAS, 413, 1687
- Cid Fernandes et al. (2010) Cid Fernandes, R., Stasińska, G., Schlickmann, M. S., et al. 2010, MNRAS, 403, 1036
- Colina & de Juan (1995) Colina, L. & de Juan, L. 1995, ApJ, 448, 548
- Condon (1998) Condon, J. J. 1998, in IAU Symposium, Vol. 179, New Horizons from Multi-Wavelength Sky Surveys, ed. B. J. McLean, D. A. Golombek, J. J. E. Hayes, & H. E. Payne, 19
- Condon et al. (1998) Condon, J. J., Cotton, W. D., Greisen, E. W., et al. 1998, AJ, 115, 1693
- Croton et al. (2006) Croton, D. J., Springel, V., White, S. D. M., et al. 2006, MNRAS, 365, 11
- Dekel & Silk (1986) Dekel, A. & Silk, J. 1986, ApJ, 303, 39
- Di Matteo et al. (2005) Di Matteo, T., Springel, V., & Hernquist, L. 2005, Nature, 433, 604
- Dopita et al. (2002) Dopita, M. A., Kewley, L. J., & Sutherland, R. S. 2002, in Revista Mexicana de Astronomia y Astrofisica, vol. 27, Vol. 12, Revista Mexicana de Astronomia y Astrofisica Conference Series, ed. W. J. Henney, J. Franco, & M. Martos, 225–229
- Eckart et al. (1989) Eckart, A., Hummel, C. A., & Witzel, A. 1989, MNRAS, 239, 381
- Fanaroff & Riley (1974) Fanaroff, B. L. & Riley, J. M. 1974, MNRAS, 167, 31P
- Feoli & Mancini (2009) Feoli, A. & Mancini, L. 2009, ApJ, 703, 1502
- Ferrarese & Merritt (2000) Ferrarese, L. & Merritt, D. 2000, ApJ, 539, L9
- Fuhrmann et al. (2008) Fuhrmann, L., Krichbaum, T. P., Witzel, A., et al. 2008, A&A, 490, 1019
- Gabor et al. (2009) Gabor, J. M., Impey, C. D., Jahnke, K., et al. 2009, ApJ, 691, 705
- Gaibler et al. (2012) Gaibler, V., Khochfar, S., Krause, M., & Silk, J. 2012, MNRAS, 425, 438
- Gebhardt et al. (2000) Gebhardt, K., Bender, R., Bower, G., et al. 2000, ApJ, 539, L13
- Georgakakis et al. (2008) Georgakakis, A., Nandra, K., Yan, R., et al. 2008, MNRAS, 385, 2049
- Gonzalez-Serrano et al. (1993) Gonzalez-Serrano, J. I., Carballo, R., & Perez-Fournon, I. 1993, AJ, 105, 1710
- Govoni et al. (2000) Govoni, F., Falomo, R., Fasano, G., & Scarpa, R. 2000, A&A, 353, 507
- Granato et al. (2004) Granato, G. L., De Zotti, G., Silva, L., Bressan, A., & Danese, L. 2004, ApJ, 600, 580
- Gregorini et al. (1984) Gregorini, L., Mantovani, F., Eckart, A., et al. 1984, AJ, 89, 323
- Groves et al. (2004a) Groves, B. A., Dopita, M. A., & Sutherland, R. S. 2004a, ApJS, 153, 9
- Groves et al. (2004b) Groves, B. A., Dopita, M. A., & Sutherland, R. S. 2004b, ApJS, 153, 75
- Gültekin et al. (2009) Gültekin, K., Richstone, D. O., Gebhardt, K., et al. 2009, ApJ, 698, 198
- Haggard et al. (2010) Haggard, D., Green, P. J., Anderson, S. F., et al. 2010, ApJ, 723, 1447
- Hamann et al. (2002) Hamann, F., Korista, K. T., Ferland, G. J., Warner, C., & Baldwin, J. 2002, ApJ, 564, 592
- Hardcastle et al. (2006) Hardcastle, M. J., Evans, D. A., & Croston, J. H. 2006, MNRAS, 370, 1893
- Harrison et al. (2012) Harrison, C. M., Alexander, D. M., Mullaney, J. R., et al. 2012, ApJ, 760, L15
- Heckman (1980) Heckman, T. M. 1980, A&A, 87, 152
- Heckman & Kauffmann (2006) Heckman, T. M. & Kauffmann, G. 2006, New A Rev., 50, 677
- Heckman et al. (2004) Heckman, T. M., Kauffmann, G., Brinchmann, J., et al. 2004, ApJ, 613, 109
- Heckman et al. (1986) Heckman, T. M., Smith, E. P., Baum, S. A., et al. 1986, ApJ, 311, 526
- Hes et al. (1995) Hes, R., Barthel, P. D., & Hoekstra, H. 1995, A&A, 303, 8
- Hickox et al. (2009) Hickox, R. C., Jones, C., Forman, W. R., et al. 2009, ApJ, 696, 891
- Ho et al. (2001) Ho, L. C., Feigelson, E. D., Townsley, L. K., et al. 2001, ApJ, 549, L51
- Ho et al. (1997) Ho, L. C., Filippenko, A. V., & Sargent, W. L. W. 1997, ApJ, 487, 568
- Ho & Kim (2014) Ho, L. C. & Kim, M. 2014, ApJ, 789, 17
- Hopkins et al. (2008a) Hopkins, P. F., Cox, T. J., Kereš, D., & Hernquist, L. 2008a, ApJS, 175, 390
- Hopkins et al. (2006) Hopkins, P. F., Hernquist, L., Cox, T. J., et al. 2006, ApJS, 163, 1
- Hopkins et al. (2008b) Hopkins, P. F., Hernquist, L., Cox, T. J., & Kereš, D. 2008b, ApJS, 175, 356
- Hopkins et al. (2007) Hopkins, P. F., Hernquist, L., Cox, T. J., Robertson, B., & Krause, E. 2007, ApJ, 669, 67
- Ishibashi & Fabian (2012) Ishibashi, W. & Fabian, A. C. 2012, MNRAS, 427, 2998
- Ivezić et al. (2002) Ivezić, Ž., Menou, K., Knapp, G. R., et al. 2002, AJ, 124, 2364
- Ivison et al. (2012) Ivison, R. J., Smail, I., Amblard, A., et al. 2012, MNRAS, 425, 1320
- Kauffmann et al. (2003a) Kauffmann, G., Heckman, T. M., Tremonti, C., et al. 2003a, MNRAS, 346, 1055
- Kauffmann et al. (2003b) Kauffmann, G., Heckman, T. M., White, S. D. M., et al. 2003b, MNRAS, 341, 33
- Kaviraj et al. (2007) Kaviraj, S., Kirkby, L. A., Silk, J., & Sarzi, M. 2007, MNRAS, 382, 960
- Kawata & Gibson (2005) Kawata, D. & Gibson, B. K. 2005, MNRAS, 358, L16
- Kellermann & Pauliny-Toth (1981) Kellermann, K. I. & Pauliny-Toth, I. I. K. 1981, ARA&A, 19, 373
- Kewley et al. (2001) Kewley, L. J., Dopita, M. A., Sutherland, R. S., Heisler, C. A., & Trevena, J. 2001, ApJ, 556, 121
- Kewley et al. (2003) Kewley, L. J., Geller, M. J., & Jansen, R. A. 2003, in Bulletin of the American Astronomical Society, Vol. 35, American Astronomical Society Meeting Abstracts, 119.01
- Kewley et al. (2006) Kewley, L. J., Groves, B., Kauffmann, G., & Heckman, T. 2006, MNRAS, 372, 961
- Khalatyan et al. (2008) Khalatyan, A., Cattaneo, A., Schramm, M., et al. 2008, MNRAS, 387, 13
- Klamer et al. (2004) Klamer, I. J., Ekers, R. D., Sadler, E. M., & Hunstead, R. W. 2004, ApJ, 612, L97
- Kormendy & Ho (2013) Kormendy, J. & Ho, L. C. 2013, ARA&A, 51, 511
- Kormendy & Richstone (1995) Kormendy, J. & Richstone, D. 1995, ARA&A, 33, 581
- Kozieł-Wierzbowska & Stasińska (2011) Kozieł-Wierzbowska, D. & Stasińska, G. 2011, MNRAS, 415, 1013
- Lamareille (2010) Lamareille, F. 2010, A&A, 509, A53
- Lamareille et al. (2004) Lamareille, F., Mouhcine, M., Contini, T., Lewis, I., & Maddox, S. 2004, MNRAS, 350, 396
- Ledlow & Owen (1995) Ledlow, M. J. & Owen, F. N. 1995, AJ, 110, 1959
- Ledlow et al. (1999) Ledlow, M. J., Owen, F. N., & Keel, W. C. 1999, in IAU Symposium, Vol. 186, Galaxy Interactions at Low and High Redshift, ed. J. E. Barnes & D. B. Sanders, 359
- Li et al. (2007) Li, Y., Hernquist, L., Robertson, B., et al. 2007, ApJ, 665, 187
- Lotz et al. (2008) Lotz, J. M., Davis, M., Faber, S. M., et al. 2008, ApJ, 672, 177
- Machalski & Godlowski (2000) Machalski, J. & Godlowski, W. 2000, A&A, 360, 463
- Magorrian et al. (1998) Magorrian, J., Tremaine, S., Richstone, D., et al. 1998, AJ, 115, 2285
- Maiolino et al. (2012) Maiolino, R., Gallerani, S., Neri, R., et al. 2012, MNRAS, 425, L66
- Marconi & Hunt (2003) Marconi, A. & Hunt, L. K. 2003, ApJ, 589, L21
- Martel et al. (1999) Martel, A. R., Baum, S. A., Sparks, W. B., et al. 1999, ApJS, 122, 81
- Moles et al. (1995) Moles, M., Marquez, I., & Perez, E. 1995, ApJ, 438, 604
- Nandra et al. (2007) Nandra, K., Georgakakis, A., Willmer, C. N. A., et al. 2007, ApJ, 660, L11
- Narayanan et al. (2008) Narayanan, D., Cox, T. J., Kelly, B., et al. 2008, ApJS, 176, 331
- Narayanan et al. (2006) Narayanan, D., Cox, T. J., Robertson, B., et al. 2006, ApJ, 642, L107
- Norris et al. (2012) Norris, R. P., Lenc, E., Roy, A. L., & Spoon, H. 2012, MNRAS, 422, 1453
- Obrić et al. (2006) Obrić, M., Ivezić, Ž., Best, P. N., et al. 2006, MNRAS, 370, 1677
- O’Dea (1998) O’Dea, C. P. 1998, PASP, 110, 493
- OMullane et al. (2005) OMullane, W., Li, N., Nieto-Santisteban, M., et al. 2005, eprint arXiv:cs/0502072
- Ott et al. (1994) Ott, M., Witzel, A., Quirrenbach, A., et al. 1994, A&A, 284, 331
- Owen & Laing (1989) Owen, F. N. & Laing, R. A. 1989, MNRAS, 238, 357
- Panessa et al. (2007) Panessa, F., Barcons, X., Bassani, L., et al. 2007, A&A, 467, 519
- Ramos Almeida et al. (2012) Ramos Almeida, C., Bessiere, P. S., Tadhunter, C. N., et al. 2012, MNRAS, 419, 687
- Rola et al. (1997) Rola, C. S., Terlevich, E., & Terlevich, R. J. 1997, MNRAS, 289, 419
- Sadler et al. (2002) Sadler, E. M., Jackson, C. A., Cannon, R. D., et al. 2002, MNRAS, 329, 227
- Salim et al. (2007) Salim, S., Rich, R. M., Charlot, S., et al. 2007, ApJS, 173, 267
- Schawinski (2009) Schawinski, K. 2009, in American Institute of Physics Conference Series, Vol. 1201, American Institute of Physics Conference Series, ed. S. Heinz & E. Wilcots, 17–20
- Schawinski et al. (2007) Schawinski, K., Thomas, D., Sarzi, M., et al. 2007, MNRAS, 382, 1415
- Schirmer et al. (2013) Schirmer, M., Diaz, R., Holhjem, K., Levenson, N. A., & Winge, C. 2013, ApJ, 763, 60
- Shulevski et al. (2012) Shulevski, A., Morganti, R., Oosterloo, T., & Struve, C. 2012, A&A, 545, A91
- Sikora et al. (2007) Sikora, M., Stawarz, Ł., & Lasota, J.-P. 2007, ApJ, 658, 815
- Silk & Rees (1998) Silk, J. & Rees, M. J. 1998, A&A, 331, L1
- Silverman et al. (2008) Silverman, J. D., Mainieri, V., Lehmer, B. D., et al. 2008, ApJ, 675, 1025
- Smith & Heckman (1989) Smith, E. P. & Heckman, T. M. 1989, ApJ, 341, 658
- Smolčić (2009) Smolčić, V. 2009, ApJ, 699, L43
- Springel et al. (2005) Springel, V., Di Matteo, T., & Hernquist, L. 2005, MNRAS, 361, 776
- Stasińska et al. (2006) Stasińska, G., Cid Fernandes, R., Mateus, A., Sodré, L., & Asari, N. V. 2006, MNRAS, 371, 972
- Stasińska et al. (2008) Stasińska, G., Vale Asari, N., Cid Fernandes, R., et al. 2008, MNRAS, 391, L29
- Stoughton et al. (2002) Stoughton, C., Lupton, R. H., Bernardi, M., et al. 2002, AJ, 123, 485
- Tadhunter et al. (2007) Tadhunter, C., Dicken, D., Holt, J., et al. 2007, ApJ, 661, L13
- Tadhunter et al. (2002) Tadhunter, C., Dickson, R., Morganti, R., et al. 2002, MNRAS, 330, 977
- Toomre & Toomre (1972) Toomre, A. & Toomre, J. 1972, ApJ, 178, 623
- Tremaine et al. (2002) Tremaine, S., Gebhardt, K., Bender, R., et al. 2002, ApJ, 574, 740
- Tresse et al. (1996) Tresse, L., Rola, C., Hammer, F., et al. 1996, MNRAS, 281, 847
- Trump et al. (2012) Trump, J. R., Weiner, B. J., Koo, D. C., Faber, S. M., & Kocevski, D. D. 2012, in American Astronomical Society Meeting Abstracts, Vol. 219, American Astronomical Society Meeting Abstracts 219, 131.01
- vanBreugel et al. (2004) vanBreugel, W., Fragile, C., Croft, S., et al. 2004, in IAU Symposium, Vol. 222, The Interplay Among Black Holes, Stars and ISM in Galactic Nuclei, ed. T. Storchi-Bergmann, L. C. Ho, & H. R. Schmitt, 485–488
- Veilleux & Osterbrock (1987) Veilleux, S. & Osterbrock, D. E. 1987, ApJS, 63, 295
- Vitale et al. (2013) Vitale, M., Mignoli, M., Cimatti, A., et al. 2013, A&A, 556, A11
- Vitale et al. (2012) Vitale, M., Zuther, J., García-Marín, M., et al. 2012, A&A, 546, A17
- Wills et al. (2004) Wills, K. A., Morganti, R., Tadhunter, C. N., Robinson, T. G., & Villar-Martin, M. 2004, MNRAS, 347, 771
- Wills et al. (2002) Wills, K. A., Tadhunter, C. N., Robinson, T. G., & Morganti, R. 2002, MNRAS, 333, 211
- Witzel et al. (1979) Witzel, A., Pauliny-Toth, I. I. K., Nauber, U., & Schmidt, J. 1979, AJ, 84, 942
- York et al. (2000) York, D. G., Adelman, J., Anderson, Jr., J. E., et al. 2000, AJ, 120, 1579
- Yuan et al. (2008) Yuan, W., Zhou, H. Y., Komossa, S., et al. 2008, ApJ, 685, 801
- Zijlstra et al. (2008) Zijlstra, A. A., van Hoof, P. A. M., & Perley, R. A. 2008, ApJ, 681, 1296
- Zinn et al. (2013) Zinn, P.-C., Middelberg, E., Norris, R. P., & Dettmar, R.-J. 2013, ApJ, 774, 66
- Zirbel (1996) Zirbel, E. L. 1996, ApJ, 473, 713
| z | RA | DEC | F[1.4] | F[10.45] | Err | F[4.85] | Err | Mo | Mr | Activity | NIId |
|---|---|---|---|---|---|---|---|---|---|---|---|
| 0.298 | 204.38 | 0.5913 | 127.25 | 0.1366 | 0.0015 | 0.1552 | 0.0027 | E | PS | BLLAC | C |
| 0.106 | 176.30 | -2.994 | 108.93 | 0.0875 | 0.0374 | 0.1213 | 0.0281 | E | PS | AGN | C |
| 0.112 | 185.30 | -2.816 | 105.55 | 0.1516 | 0.0036 | 0.1628 | 0.0108 | E | PS | AGN | S |
| 0.182 | 184.48 | -3.623 | 208.86 | 0.0366 | 0.0043 | 0.0711 | 0.0029 | E | PS | AGN | S |
| 0.247 | 261.84 | 55.181 | 149.13 | 0.2200 | 0.0034 | 0.1624 | 0.0030 | E/Cl | PS | L | |
| 0.041 | 222.34 | 63.270 | 2922.8 | 0.4338 | 0.0049 | 0.9249 | 0.0047 | SB0 | PS/FRI? | Sy2 | S |
| 0.105 | 240.69 | 52.732 | 575.70 | 0.0886 | 0.0078 | 0.1876 | 0.0024 | S0/E | PS | Sy1 | L |
| 0.179 | 239.86 | 53.515 | 182.35 | 0.0282 | 0.0096 | 0.0555 | 0.0019 | E | PS | Sy2 | S |
| 0.224 | 251.08 | 45.779 | 115.05 | 0.0684 | 0.0008 | 0.1020 | 0.0024 | E | lobes/FRI? | BLLAC c | L |
| 0.084 | 181.02 | 2.4118 | 145.27 | 0.0602 | 0.0031 | 0.1196 | 0.0031 | E/S0 | lobes | C | |
| 0.050 | 159.13 | 2.3626 | 202.42 | 0.0518 | 0.0000 | 0.1033 | 0.0029 | S/PM | Double PS | HII | C |
| 0.370 | 223.41 | 3.9926 | 378.48 | 0.0893 | 0.0035 | 0.1575 | 0.0028 | E | PS | L | |
| 0.086 | 323.38 | -7.213 | 193.21 | 0.0376 | 0.0000 | 0.0597 | 0.0018 | S | PS | AGN | S |
| 0.040 | 119.61 | 37.786 | 225.50 | 0.4315 | 0.0012 | 0.9773 | 0.0069 | S0 | Jets/FRII | L | |
| 0.131 | 127.91 | 46.133 | 130.74 | 0.0732 | 0.0116 | 0.1008 | 0.0034 | E | PS | L | |
| 0.225 | 143.62 | 3.0959 | 292.08 | 0.0521 | 0.0023 | 0.1071 | 0.0013 | E | PS | L | |
| 0.319 | 119.09 | 35.911 | 423.67 | 0.0907 | 0.0000 | 0.1653 | 0.0027 | E | PS | SF | |
| 0.055 | 129.15 | 44.019 | 139.30 | 0.0394 | 0.0046 | 0.0609 | 0.0007 | S0 | PS | AGN | S |
| 0.097 | 155.57 | 0.5139 | 167.36 | 0.0482 | 0.0012 | 0.0824 | 0.0030 | S0 | PS | AGN | L |
| 0.096 | 159.02 | 0.1018 | 109.91 | 0.0774 | 0.0019 | 0.1953 | 0.0036 | Scd | Jets/FRII | L | |
| 0.187 | 235.82 | 2.5976 | 442.5 | 0.0699 | 0.0035 | 0.1481 | 0.0027 | E | PS | Sy2 | C |
| 0.263 | 201.08 | 4.3186 | 155.16 | 0.0179 | 0.0015 | 0.0413 | 0.0011 | E | PS | AGN | C |
| 0.133 | 211.78 | 4.8837 | 109.33 | 0.0347 | 0.0378 | 0.0391 | 0.0002 | E | PS | AGN | C |
| 0.095 | 228.85 | 4.3627 | 138.32 | 0.0381 | 0.0039 | 0.0726 | 0.0030 | S | PS | HII | SF |
| 0.052 | 230.34 | 4.3418 | 155.38 | 0.2662 | 0.0008 | 0.3424 | 0.0048 | E/S0 | Jet? | C | |
| 0.190 | 234.65 | 55.428 | 209.83 | 0.0505 | 0.0012 | 0.0902 | 0.0025 | E | PS | Sy2 | S |
| 0.149 | 206.32 | -1.940 | 374.64 | 0.0805 | 0.0023 | 0.1432 | 0.0037 | E/S0 | PS | AGN/r-l | C |
| 0.239 | 207.65 | -3.345 | 104.48 | 0.0271 | 0.0004 | 0.0453 | 0.0004 | E | PS? | AGN | S |
| 0.166 | 208.09 | -1.946 | 552.19 | 0.0778 | 0.0070 | 0.1797 | 0.0036 | E | PS | S | |
| 0.132 | 214.17 | -2.936 | 101.12 | 0.0392 | 0.0000 | 0.0711 | 0.0033 | E/S0 | PS | AGN | C |
| 0.137 | 234.47 | -0.955 | 107.55 | 0.0250 | 0.0034 | 0.0431 | 0.0022 | E | PS | Sy2/NLAGN | S |
| 0.266 | 223.16 | 6.4606 | 291.60 | 0.0805 | 0.0011 | 0.1683 | 0.0027 | S | PS | S | |
| 0.102 | 229.69 | 6.2322 | 210.86 | 0.1348 | 0.0095 | 0.2368 | 0.0034 | S0 | NAT/jet? | C | |
| 0.195 | 339.40 | 0.3441 | 115.98 | 0.0346 | 0.0062 | 0.0499 | 0.0004 | E | PS | AGN | S |
| 0.276 | 355.27 | 0.3093 | 428.95 | 0.1915 | 0.0108 | 0.2661 | 0.0004 | S/E | PS | NLAGN | L |
| 0.266 | 132.51 | 40.602 | 118.29 | 0.1200 | 0.0019 | 0.1064 | 0.0025 | E | PS | AGN | L |
| 0.082 | 122.41 | 34.926 | 154.86 | 0.1058 | 0.0004 | 0.1476 | 0.0026 | E/S0 | jet? | BLLAC | L |
| 0.172 | 124.00 | 38.070 | 157.25 | 0.1089 | 0.0008 | 0.1746 | 0.0011 | E | Extend | L | |
| 0.143 | 164.65 | 56.469 | 221.38 | 0.1503 | 0.0780 | 0.2098 | 0.0023 | S/E | PS | BLLAC | SF |
| 0.084 | 136.56 | 46.605 | 313.57 | 0.1194 | 0.0089 | 0.1635 | 0.0009 | SO | PS | LINER | C |
| 0.151 | 156.57 | 45.708 | 105.18 | 0.0659 | 0.0046 | 0.0909 | 0.0019 | E | PS | L | |
| 0.178 | 222.33 | 42.350 | 165.63 | 0.0563 | 0.0033 | 0.0620 | 0.0006 | PM/QSO | PS | Blaz | S |
| 0.214 | 162.71 | 7.9477 | 138.52 | 0.0540 | 0.0015 | 0.0861 | 0.0040 | E | PS | S | |
| 0.129 | 141.36 | 7.4449 | 103.06 | 0.0420 | 0.0004 | 0.0587 | 0.0008 | SO | PS | C | |
| 0.117 | 210.21 | 52.268 | 174.49 | 0.0391 | 0.0056 | 0.0817 | 0.0020 | E | PS | AGN | L |
| 0.099 | 218.84 | 50.856 | 140.96 | 0.0380 | 0.0012 | 0.0674 | 0.0004 | E | PS | AGN | L |
| 0.076 | 212.95 | 52.816 | 321.58 | 0.2412 | 0.0034 | 0.4185 | 0.0048 | E | Extend | L | |
| 0.151 | 242.95 | 40.672 | 553.08 | 0.0757 | 0.0004 | 0.1730 | 0.0035 | E | PS | L | |
| 0.079 | 129.81 | 28.844 | 124.72 | 0.1760 | 0.0131 | 0.2445 | 0.0043 | E/SO | jet | L | |
| 0.115 | 133.34 | 9.4622 | 123.72 | 0.0650 | 0.0027 | 0.0927 | 0.0013 | E/SO | PS | S | |
| 0.206 | 188.45 | 50.439 | 243.22 | 0.0966 | 0.0027 | 0.1466 | 0.0030 | E/S0 | Extend | Blaz | C |
| 0.206 | 191.78 | 49.005 | 1212.6 | 0.3512 | 0.0005 | 0.5757 | 0.0018 | E | PS | Sy2 | S |
| 0.083 | 184.36 | 15.903 | 137.5 | 0.0682 | 0.0171 | 0.0378 | 0.0030 | S | PS | S | |
| 0.152 | 206.18 | 55.050 | 456.95 | 0.1436 | 0.0005 | 0.2132 | 0.0013 | E | PS | AGN | S |
| 0.152 | 214.94 | 54.387 | 583.66 | 0.6297 | 0.0092 | 0.4965 | 0.0053 | E/S0/QSO | Double PS | BLLAC | SF |
| 0.078 | 226.84 | 10.312 | 407.85 | 0.1281 | 0.0085 | 0.2146 | 0.0029 | S0,Comp | PS | L | |
| 0.082 | 210.80 | 6.1691 | 125.0 | 0.1338 | 0.0091 | 0.1781 | 0.0029 | E/S0 | jets | L | |
| 0.132 | 207.59 | 9.6696 | 300.57 | 0.1904 | 0.0081 | 0.3315 | 0.0039 | E/Cl | PS | Blaz/Sy1.9 | L |
| 0.061 | 220.07 | 5.9427 | 133.99 | 0.1144 | 0.0083 | 0.1353 | 0.0029 | S0 | Extend? | L | |
| 0.109 | 230.95 | 32.230 | 169.28 | 0.0314 | 0.0058 | 0.0677 | 0.0016 | S0 | PS | S |
| z | RA | DEC | F[1.4] | F[10.45] | Err | F[4.85] | Err | Mo | Mr | Activity | NIId |
|---|---|---|---|---|---|---|---|---|---|---|---|
| 0.135 | 229.28 | 33.889 | 120.38 | 0.0346 | 0.0000 | 0.0616 | 0.0014 | E/QSO2 | Double PS | Sy1 | S |
| 0.148 | 212.42 | 36.071 | 143.24 | 0.0229 | 0.0004 | 0.0495 | 0.0018 | E/int | PS | S | |
| 0.241 | 128.72 | 55.572 | 8254.5 | 2.4487 | 0.1362 | 5.4221 | 0.0388 | E/int/QSO? | PS | LINER | L |
| 0.095 | 124.72 | 22.796 | 187.0 | 0.0862 | 0.0050 | 0.1463 | 0.0026 | E | Asym dbl | L | |
| 0.081 | 164.16 | 14.324 | 173.41 | 0.0302 | 0.0008 | 0.0568 | 0.0060 | S/PM | PS | S | |
| 0.112 | 123.34 | 7.5682 | 462.92 | 0.0720 | 0.0012 | 0.1488 | 0.0039 | E/S0,bar | PS | Sy1 | L |
| 0.099 | 151.50 | 34.902 | 3399.3 | 0.8897 | 0.0098 | 1.4429 | 0.0141 | S0 | PS | LINER | S |
| 0.098 | 121.50 | 19.104 | 113.29 | 0.0514 | 0.0031 | 0.0769 | 0.0003 | S0 | FRII? | S | |
| 0.158 | 138.08 | 27.929 | 230.35 | 0.0500 | 0.0012 | 0.0984 | 0.0011 | E | PS | L | |
| 0.062 | 176.84 | 35.018 | 615.09 | 0.2251 | 0.0244 | 0.2232 | 0.0035 | S0/Comp | Jets | BLAC?/Sy2 | S |
| 0.230 | 224.08 | 27.919 | 108.12 | 0.0305 | 0.0066 | 0.0480 | 0.0025 | E | PS | L | |
| 0.289 | 212.22 | 30.350 | 332.55 | 0.0681 | 0.0006 | 0.1277 | 0.0023 | E | PS | S | |
| 0.078 | 188.00 | 33.296 | 101.47 | 0.0200 | 0.0050 | 0.0339 | 0.0002 | S | Extend | SF | |
| 0.045 | 208.07 | 31.446 | 3709.1 | 1.0669 | 0.0706 | 1.8531 | 0.0135 | S | FRI | LINER | L |
| 0.091 | 160.12 | 29.966 | 388.36 | 0.0751 | 0.0288 | 0.1174 | 0.0024 | S | PS | L | |
| 0.159 | 212.06 | 25.565 | 589.27 | 0.1661 | 0.0098 | 0.3051 | 0.0043 | E | Extend | L | |
| 0.079 | 249.98 | 11.466 | 163.94 | 0.0536 | 0.0073 | 0.0858 | 0.0030 | S/int? | PS | SF | |
| 0.154 | 128.06 | 18.536 | 874.23 | 0.3816 | 0.0008 | 0.6079 | 0.0015 | E,N gal | PS | S | |
| 0.089 | 127.27 | 17.904 | 231.80 | 0.1405 | 0.0023 | 0.2010 | 0.0028 | E/SO | Jets | BLLAC c | L |
| 0.155 | 179.22 | 26.542 | 116.58 | 0.0834 | 0.0016 | 0.1016 | 0.0022 | SO?,g | PS | S | |
| 0.112 | 170.12 | 27.603 | 156.75 | 0.0411 | 0.0004 | 0.0591 | 0.0026 | E | PS | C | |
| 0.063 | 162.38 | 23.456 | 105.55 | 0.0427 | 0.0027 | 0.0582 | 0.0018 | E/S0 | Extend | L | |
| 0.134 | 167.58 | 21.529 | 289.01 | 0.0470 | 0.0024 | 0.0889 | 0.0015 | S/int? | PS | S | |
| 0.349 | 185.52 | 23.193 | 374.16 | 0.0627 | 0.0000 | 0.1222 | 0.0021 | E | Extend | L | |
| 0.250 | 214.47 | 20.668 | 110.83 | 0.0878 | 0.0016 | 0.1175 | 0.0028 | E | jet? | S | |
| 0.135 | 141.02 | 14.172 | 108.25 | 0.0180 | 0.0008 | 0.0330 | 0.0009 | E/S0/QSO | PS | L | |
| 0.214 | 230.31 | 15.202 | 356.98 | 0.0628 | 0.0038 | 0.1121 | 0.0025 | E | PS | L | |
| 0.178 | 166.75 | 18.430 | 159.92 | 0.0376 | 0.0004 | 0.0634 | 0.0017 | S0/int? | PS | S | |
| 0.137 | 169.27 | 20.235 | 117.45 | 0.0641 | 0.0004 | 0.0737 | 0.0029 | S0 | PS | Sy2/BLLAC? | SF |
| 0.144 | 212.61 | 14.644 | 434.41 | 0.1544 | 0.0103 | 0.2537 | 0.0036 | E/S0 | Extend | L | |
| 0.187 | 227.46 | 15.957 | 406.70 | 0.1185 | 0.0058 | 0.2276 | 0.0054 | E | Double PS | L | |
| 0.229 | 187.09 | 16.437 | 105.58 | 0.0355 | 0.0066 | 0.0539 | 0.0028 | E | lobes | S | |
| 0.180 | 202.24 | 17.645 | 158.77 | 0.0300 | 0.0012 | 0.0508 | 0.0019 | E/SO | PS | S | |
| 0.238 | 190.46 | 16.556 | 359.38 | 0.0545 | 0.0039 | 0.1104 | 0.0031 | E | PS | L | |
| 0.066 | 131.33 | 11.431 | 168.82 | 0.0512 | 0.0019 | 0.0871 | 0.0023 | S0 | Extend | L | |
| 0.212 | 152.48 | 14.031 | 1044.7 | 0.2435 | 0.0194 | 0.4066 | 0.0045 | E | PS | L | |
| 0.163 | 245.13 | 17.665 | 111.44 | 0.0839 | 0.0019 | 0.0918 | 0.0034 | SO/int? | PS | S | |
| 0.101 | 138.00 | 53.343 | 135.64 | 0.0639 | 0.0015 | 0.0932 | 0.0042 | S0/E | Double PS | NLAGN/Sy2 | S |
| 0.255 | 201.34 | 3.9802 | 113.29 | 0.0290 | 0.0004 | 0.0585 | 0.0027 | E | PS | AGN | C |
| 0.104 | 7.1392 | 0.9197 | 237.22 | 0.0425 | 0.0015 | 0.0806 | 0.0064 | S/S0 | PS | Sy2/r-l | S |
| 0.247 | 37.788 | 0.9509 | 109.26 | 0.0295 | 0.0023 | 0.0418 | 0.0017 | E | PS | S | |
| 0.195 | 221.80 | 40.796 | 396.94 | 0.0899 | 0.0020 | 0.1659 | 0.0011 | E | Extend | S | |
| 0.125 | 172.92 | 47.002 | 127.34 | 0.0422 | 0.0006 | 0.0687 | 0.0011 | S0 | PS | C | |
| 0.204 | 173.82 | 12.886 | 139.19 | 0.0418 | 0.0008 | 0.0568 | 0.0031 | E | PS | L | |
| 0.058 | 180.83 | 13.325 | 110.27 | 0.0341 | 0.0031 | 0.0597 | 0.0024 | S0 | Double PS? | AGN | S |
| 0.258 | 217.05 | 39.205 | 239.44 | 0.1214 | 0.0031 | 0.1462 | 0.0022 | S0/QSO? | Extend? | Blaz | S |
| 0.299 | 176.41 | 44.339 | 327.30 | 0.1794 | 0.0002 | 0.2368 | 0.0017 | S0/QSO? | Extend | AGN | L |
| 0.085 | 196.58 | 11.227 | 117.94 | 0.1233 | 0.0000 | 0.1998 | 0.0029 | E0 | lobes | L | |
| 0.066 | 199.41 | 41.262 | 248.86 | 0.1537 | 0.0074 | 0.2280 | 0.0001 | S0 | PS | L | |
| 0.131 | 185.38 | 8.3622 | 150.13 | 0.0733 | 0.0134 | 0.0964 | 0.0030 | S0 | PS | BLLac? | L |
| 0.249 | 191.08 | 40.860 | 367.63 | 0.0672 | 0.0023 | 0.1757 | 0.0014 | S0/QSO? | PS | Sy? | S |
| 0.083 | 190.53 | 9.4793 | 101.15 | 0.0304 | 0.0016 | 0.0690 | 0.0055 | E | jet? | L | |
| 0.168 | 224.40 | 43.993 | 152.63 | 0.0435 | 0.0052 | 0.0821 | 0.0027 | S0 | jet? | S | |
| 0.232 | 234.74 | 35.952 | 146.91 | 0.0556 | 0.0016 | 0.0863 | 0.0026 | E | Extend | L | |
| 0.237 | 253.23 | 25.952 | 125.12 | 0.0422 | 0.0014 | 0.0628 | 0.0000 | E | PS | C | |
| 0.153 | 137.47 | 17.857 | 257.0 | 0.0681 | 0.0011 | 0.1155 | 0.0019 | S0 | PS | L | |
| 0.130 | 170.95 | 20.281 | 102.18 | 0.0306 | 0.0034 | 0.0486 | 0.0026 | S0 | PS | S | |
| 0.104 | 137.97 | 37.403 | 226.92 | 0.1536 | 0.0004 | 0.2813 | 0.0015 | S0 | Extend | L | |
| 0.052 | 229.16 | 0.2505 | 755.71 | 1.0338 | 0.0568 | 1.1906 | 0.0108 | S0/Comp | FRII | LINER | L |
Appendix A
Tab. 2 contains general information on our sample, including redshift, coordinates, fluxes, morphological and spectral classification.
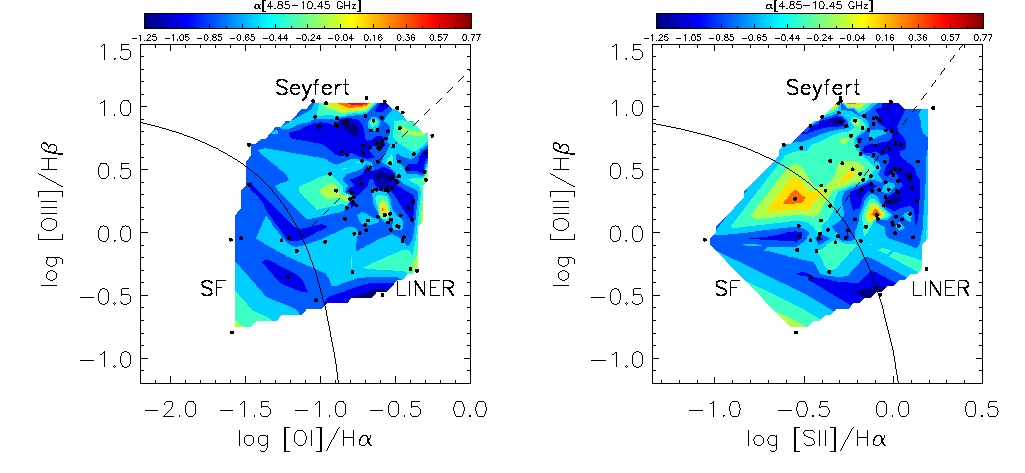
Fig. 14 shows the [O i]- and the [S ii]-based diagnostic diagrams. Here a flattening sequence is less visible, due to the lack of the composite region (Fig. 5). This is because the Kewley et al. (2006) scheme for the [N ii]-based diagram substantially changes the LINER boundaries, and includes a class for starburst-AGN composites.
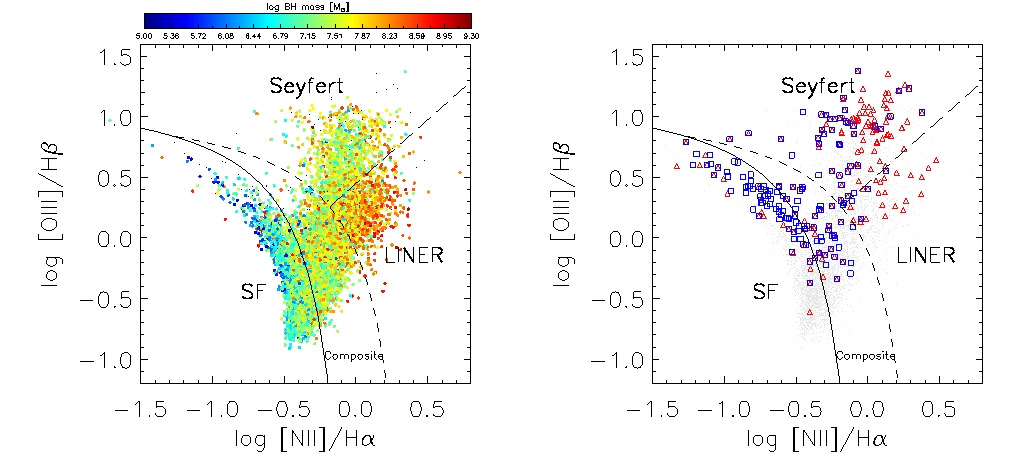
.
The SDSS-FIRST cross-matched sample is composed by star-forming, composite, Seyfert, and LINER galaxies for which we can trust the black-hole mass estimations. Fig. 15 presents the black-hole mass distribution of the objects in this sample. The distribution shows that the black hole mass clearly increases from star-forming galaxies to composites and LINERs. Mean (median) black hole mass values per spectral class are: () for star-forming, () for composite, () for Seyfert, and () for LINER galaxies. The trend shown here is very clear, even though black-hole mass measurements are not direct but derived from the SDSS stellar velocity dispersion. The plot shows a substancial change in the galaxy populations, which is reflected by the Effelsberg sample (Fig. 9).The right panel of Fig. 15 presents the overall black-hole mass distribution of the SDSS-FIRST sample overimposed with red triangles, which indicate SDSS sources with velocity dispersion mismeasurements ( star-forming, composite, Seyfert, and LINER galaxies), and blue squares, which indicate sources with ( star-forming, composite, Seyfert, and LINER galaxies). The latter could be again the result of velocity dispersion mismeasurements, not flagged in the SDSS DR7. Some sources are marked as both red triangles and blue squares, indicating that the high black hole masses measured for the objects marked as blue squares could be indeed due to velocity dispersion mismeasurements. It is interesting to note that % of the red triangles are Seyferts, while % of the blue squares are star-forming galaxies. Moreover, those Seyferts show especially high log [O iii]/H ratios (), and those star-forming galaxies occupy the metal-poor part of the star-forming branch.
The color composite images from SDSS are shown in Fig. 16 to 19 illustrate the optical morphology of our radio-emitting star-forming, composite, Seyfert and LINER galaxies. Star-forming galaxies are in general blue, and the galaxy color gets progressively redder in the other spectral types. Only a few galaxies are close enough () for their morphology to be determined by eye.
