Critical Phase in Complex Networks: a Numerical Study
Abstract
We compare phase transition and critical phenomena of bond percolation on Euclidean lattices, nonamenable graphs, and complex networks. On a Euclidean lattice, percolation shows a phase transition between the nonpercolating phase and percolating phase at the critical point. The critical point is stretched to a finite region, called the critical phase, on nonamenable graphs. To investigate the critical phase, we introduce a fractal exponent, which characterizes a subextensive order of the system. We perform the Monte Carlo simulations for percolation on two nonamenable graphs – the binary tree and the enhanced binary tree. The former shows the nonpercolating phase and the critical phase, whereas the latter shows all three phases. We also examine the possibility of critical phase in complex networks. Our conjecture is that networks with a growth mechanism have only the critical phase and the percolating phase. We study percolation on a stochastically growing network with and without a preferential attachment mechanism, and a deterministically growing network, called the decorated flower, to show that the critical phase appears in those models. We provide a finite-size scaling by using the fractal exponent, which would be a powerful method for numerical analysis of the phase transition involving the critical phase.
pacs:
89.75.Hc,87.23.Ge,05.70.Fh,64.60.aqI Introduction
In our world, we have many complex networks, e.g., the WWW, the Internet, social networks, and airlines. The study of complex networks has been one of the most popular topics for many research fields since the late 1990’s Albert and Barabási (2002); Newman (2003a); Boccaletti et al. (2006); Barrat et al. (2008). This activity has stemmed from the discoveries of the small-world property Watts and Strogatz (1998) and the scale free property Barabási and Albert (1999) in many real networks. The former means that the mean shortest path length between nodes (sites, vertices) scales as , where is the number of nodes in the network (graph, lattice), while the latter means that the degree distribution obeys a power law , where the degree is the number of edges (bonds, links) connected to a node. The small-world property often means that the network has both a logarithmic size dependence of and a high clustering coefficient, i.e., , where is the probability that two randomly-chosen neighbors of a randomly-chosen node are connected to each other.
Among various studies in network science, many kinds of dynamics on complex networks, such as percolation, epidemic processes, spin systems, and coupled oscillators, have been extensively studied to stimulate our interests in the relationships between network topology and critical phenomena they exhibit Dorogovtsev et al. (2008). On networks with complex connectivity, the type of phase transition can be different from that on the Euclidean lattices. Indeed, a new phase called the critical phase appears in some complex networks (but not all). The authors have studied phase transitions and critical phenomena involving the critical phase in complex networks and nonamenable graphs (explained in Sec. III) Nogawa and Hasegawa (2009a, b); Hasegawa and Nemoto (2010); Hasegawa et al. (2010); Nogawa et al. (2012a, b); Hasegawa and Nogawa (2013); Hasegawa et al. (2013); Nogawa and Hasegawa (2013). In this paper, we mainly focus on bond percolation, which is the simplest model showing a phase transition, and review our results in an attempt to unveil the nature of the critical phase.
The organization of this paper is as follows. In Sec. II, we start with the introduction of percolation on the Euclidean lattices. We consider bond percolation on the square lattice to introduce phase transition and critical phenomena. In Sec. III, we study percolation on nonamenable graphs, which is the first example showing the critical phase. We start with the definition of nonamenable graphs and multiple phase transition, which includes the critical phase. After reviewing the previous results for infinite nonamenable graphs, we express the critical phase in finite nonamenable graphs and corroborate it by using some nonamenable graphs. In Sec. IV, we move on to complex networks. In this section, we consider two types of networks, namely stochastically growing networks and deterministically growing (hierarchical small-world) networks, to show that such networks also have critical phase. In the last part of this section, we will introduce a finite-size scaling method for complex networks. Section V is devoted to the discussion for future works.


II Percolation on the Euclidean lattices
In this section, we recall some elementary properties of phase transition and critical phenomena in bond percolation on the Euclidean lattices Stauffer and Aharony (1994). Let us consider a square lattice of linear dimension . The number of nodes is . Bond percolation with open bond probability is a very simple process: each bond is independently open (undamaged) with probability , and closed (damaged, to be removed) otherwise (Fig. 1). We call a component connected by open bonds a cluster. The size of a cluster is given by the number of nodes that belong to it.
Once the state of each bond is set to be open or closed at a given value of , an important problem is whether a giant component (percolating cluster), which is a cluster that occupies a finite fraction of the whole system in the large size limit , exists or not. For small , a large number of closed bonds divide the lattice into finite clusters and no giant components exist (Fig. 1(a)). A giant component appears when exceeds a certain value (Fig. 1(c)). In the language of physics, the system is said to show a second order phase transition from the nonpercolating phase, in which only finite clusters exist, to the percolating phase, in which a giant component almost surely exists beside finite clusters, via a critical state at the critical point (also known as the percolation threshold) (Fig. 1(b)). The schematic of the phase diagram of percolation on the Euclidean lattices is shown in Fig. 2. For the square lattice, .
We usually introduce the order parameter to characterize the phase transition. Let us denote by the size of the largest cluster, averaged over many trials, for percolation on the lattice with nodes. The order parameter in the large size limit is defined by
| (1) |
In Fig. 3(a), we plot , obtained by Monte Carlo simulations, as a function of with several sizes. In the large size limit, for because only finite clusters exist, whereas for because a giant component exists. At the critical state does not include a giant component, so that .
We can characterize each phase in another way. In Fig. 3(b), we numerically plot for the square lattice with several sizes. Here the lattice dimension and the effective dimension of the largest cluster are given as
| (2) |
respectively. For the square lattice, . Figure 3(b) indicates that in the large size limit, becomes a step function of . For , because the sizes of all clusters are finite. For , because the giant component has a size on the same order as the lattice size. Just at , is not zero but slightly smaller than because the largest cluster is fractal. For the square lattice, at Stauffer and Aharony (1994). When we plot for several system sizes, we have one crossing point at , as shown in the inset of Fig. 3(b).


Near the critical point , the systems show critical phenomena, i.e., some physical quantities exhibit power-law behaviors. For example, the order parameter and the mean size of all clusters except the largest one (per node) , which we call the susceptibility by analogy with magnetic susceptibility in spin systems, behave as
| (3) | |||||
| (4) |
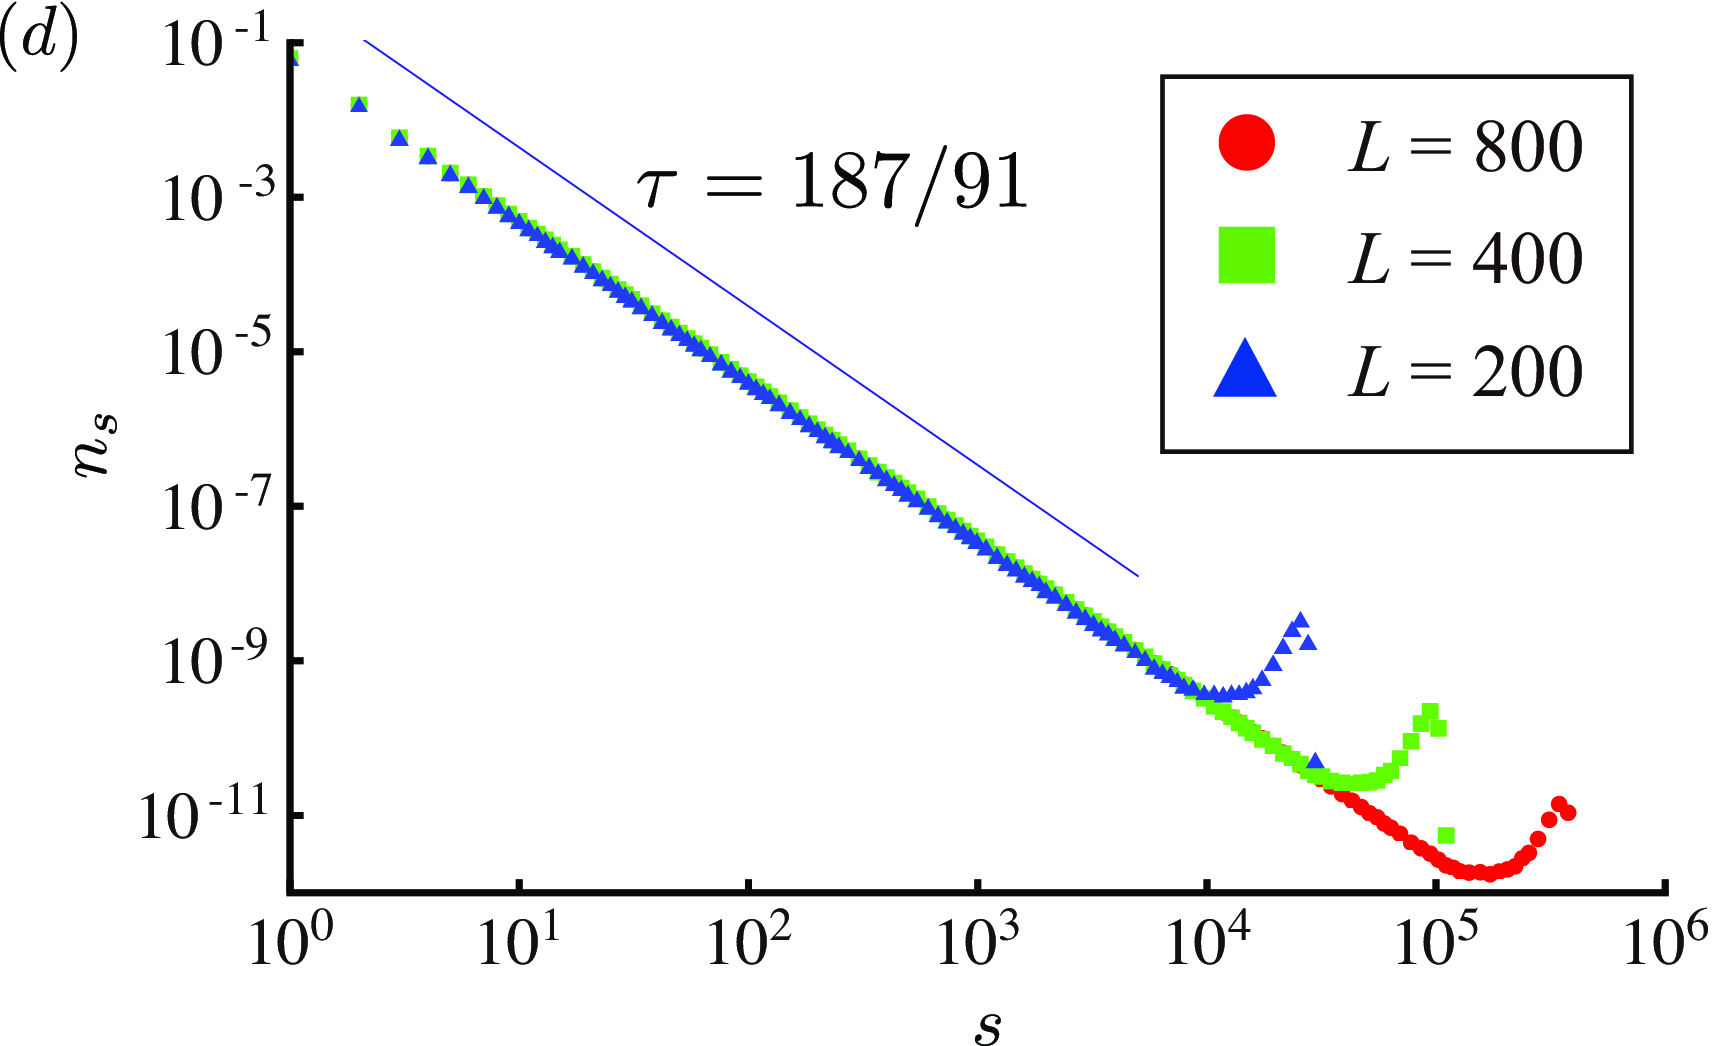
respectively. The latter diverges in the large size limit at (Fig. 3(c)). This behavior is dominated by a divergent length , which is called the correlation or connectivity length. The correlation function is defined as mean distance between two nodes belonging to the same cluster, and behaves as . Here the critical exponents , and are universal, i.e., they depend only on the dimensionality of the lattice (for example, the critical exponents of percolation on the square lattice are the same as those on the triangular lattice). The dominance of the correlation length is well understood by considering the mean number of clusters with size per node, which we call the cluster size distribution. At the critical point where diverges, obeys a power law (Fig. 3(d)), and for finite , it is modified such that it decreases rapidly for :
| (5) |
where is a scaling function decreasing rapidly with . This form reflects a fractal nature of the system. One can easily show from this distribution that a scaling relation holds. For the square lattice, , , , and Stauffer and Aharony (1994).
To determine the critical point and the critical exponents from Monte Carlo simulations of finite size systems, we often use a finite-size scaling method. The correlation length determines the relevancy of the finite linear dimension to the behavior of observables. For , all observables are governed by , while they are governed by for . If an observable is expected to behave as in the large size limit, finite-size scaling predicts that it will obey a scaling law
| (6) |
where and are scaling functions.
To summarize percolation on the Euclidean lattices, both and in the nonpercolating phase and and in the percolating phase. At the critical point, , although , and obeys a power law. The phase diagram schematically shown in Fig. 2 holds for all Euclidean lattices (although when ). However, this is not always the case for non-Euclidean lattices. In the next section, we consider a well-defined example using percolation on nonamenable graphs.
(a)
 (b)
(b)
 (c)
(c)

III Percolation on nonamenable graphs
Percolation on a nonamenable graph (NAG) along with its novel phase transition, called multiple phase transition (MPT) Benjamini and Schramm (1996), has been studied in the field of probability theory, where an infinite graph is usually assumed. In the first part of this section, we briefly review previous results for percolation on infinite NAGs. Next we provide an expression of the MPT in finite size systems and corroborate it with two NAGs – the binary tree (BT) and the enhanced binary tree (EBT).
III.1 Theoretical framework
III.1.1 Nonamenable graph and multiple phase transition
Let us consider an infinite (almost-)transitive graph . Here “transitive” means that all nodes in play the same role (i.e., a transitive graph is a regular lattice). An infinite graph is said to be nonamenable/amenable if the Cheeger constant is positive/zero. The Cheeger constant is given by
| (7) |
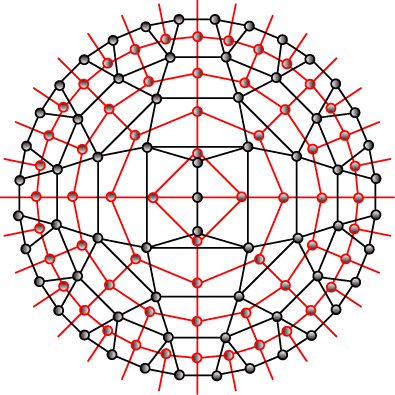
where is an arbitrary nonempty subset of , being the set of all nodes in , and consists of all nodes in that have a neighbor in . Figure 4 shows typical examples of NAGs, such as the Bethe lattice, hyperbolic lattice, and the enhanced binary tree (EBT). A fundamental property of NAGs is that the number of reachable nodes from an arbitrary node increases exponentially with the distance from the starting node. Such an exponential volume growth is never observed in Euclidean lattices (which are amenable). In the language of the network science, NAGs are regular lattices having a small-world property: the mean shortest path length of a finite NAG with nodes is .
As reviewed in Lyons (2000); Schonmann (2001), percolation on NAGs exhibits a phase transition different from the standard second order transition on the Euclidean lattices, i.e., MPT. Figure 5 is a schematic of the phase diagram of the percolation on NAGs. The system on the NAG shows the following three phases, depending on the value of :
-
•
nonpercolating phase, where there are only finite clusters, for ,
- •
-
•
percolating phase, where a unique infinite cluster exists and other clusters are finite, for .
Here an infinite cluster is defined as a cluster whose size is infinite. For transitive NAGs, Lyons (2000); Schonmann (2001), while for the Euclidean lattices, , i.e., the critical point is unique Burton and Keane (1989).
Whether or on a given depends on the number of , which is a graph property that measures a sort of vulnerability of the graph. The number of ends of , , is given as the supremum of the number of infinite connected components in , where is the graph obtained from by removing an arbitrary finite subset of nodes or edges. The number of ends of an infinite transitive (amenable and nonamenable) graph is either of 1, 2, or Mohar (1991), e.g., an infinite tree (with a branching number larger than one) has infinitely many ends, whereas the hyperbolic lattices and the EBT have one end 111 is realized only for infinite one-dimensional chain.. If is locally-finite (i.e., degrees of all nodes are bounded) and transitive, when , and when . Indeed, Benjamini and Schramm proved the existence of the MPT () on planar transitive NAGs with one end Benjamini and Schramm (2001).
III.1.2 Critical phase in finite size systems
The above results apply to infinite NAGs. Here we should note that infinite NAGs might be different from the asymptotic graphs for a sequence of size-increasing finite NAGs, e.g., in the language of statistical physics, the Bethe lattice is defined as an ginterior region h of the infinite Cayley tree such that any boundary effect disappears. The Bethe lattice is an infinite NAG, and the infinite Cayley tree is the limit of a sequence of size-increasing finite NAGs. The latter has non-negligible boundary effects, unlike the Bethe lattice, although such an asymptotic graph also shows a critical phase, as we show later. What we want to qualify here is the asymptotic behavior of the sequence of size-increasing finite graphs. Below we mention how percolation behaves on a finite NAG.
Plainly speaking, the critical phase is a finite region in where the system is in a critical state. In other words, the critical phase is a set of critical points. A quantity that demonstrates it well is the cluster size distribution . In the critical phase, always obeys a power law, i.e.,
| (8) |
as of the Euclidean lattices does at the critical point . Moreover, in the critical phase changes its exponent with .
In Nogawa and Hasegawa (2009a), we introduced the fractal exponent to characterize the critical phase. The fractal exponent is defined as
| (9) |
which is a generalization of for the -dimensional Euclidean lattice systems. Actually, the fractal exponent corresponds to for the Euclidean lattices. In the critical phase, takes a certain value between zero and one as of the Euclidean lattices does at . The fractal exponent in the critical phase continuously increases with and is related to the exponent because plays a role of a natural cutoff exponent 222See Dorogovtsev et al. (2001b) for a natural cutoff of in complex networks. of . Assuming that a power law of holds asymptotically and the number of clusters with sizes larger than should be at most one in a graph with nodes, the largest cluster size satisfies
| (10) |
From Eqs.(9) and (10), we have
| (11) |
Here this equation reduces to a well-known scaling relation for Euclidean lattices. By using data of from systems of various size, we can characterize each phase as follows:
-
•
and go to zero with increasing in the nonpercolating phase.
-
•
goes to and goes to zero with in the critical phase.
-
•
goes to unity and goes to when increases in the percolating phase.
The fractional value of the fractal exponent in a critical phase indicates that the largest cluster size diverges in the limit , i.e., it is an infinite cluster. However, it does not occupy a finite fraction of the whole system because as long as . Thus, the order parameter is zero in the critical phase and becomes nonzero only when (and then the largest cluster can be regarded as the giant component). For numerical evaluation, we approximate by the difference as, for example,
| (12) |
Finally we note that a standard finite-size scaling analysis does not work to determine and by using the data in the critical phase. Suppose that holds with an increasing analytic function of in the critical phase. Then one can expand around any in the critical phase so that , which leads us to
| (13) |
where is a “scaling function” around . For this reason, this sort of finite-size scaling provides an artificial threshold, depending on the range of the size in the system. Thus the boundary and is hardly determined from this type of analysis. In Sec. IV.3, we provide a finite scaling analysis using only data where .


III.2 Percolation on the binary tree
As an example of finite NAGs, let us consider the binary tree (BT). In a BT that has generations, each node, except in the last generation, has two descendants of nodes in the next generation, so that the node has two bonds linked to the nodes and , where denotes the -th node in generation ( and ). There are nodes in total.
Percolation on the BT has from analysis by a branching process and because it is a tree. We consider the root cluster, i.e., the cluster containing the root node . In some models discussed in this paper, we calculate the mean size of the root cluster, , and its fractal exponent, , such that , instead of those of the largest cluster. Because of the fact that our fractal exponent focuses on the -dependence of a cluster size, it is sufficient that the focal node is contained in the largest cluster with a nonzero probability, and then . Nodes in the central area of finite NAGs, or hubs of scale-free networks, would be good candidates in most cases. We easily obtain . The mean root cluster size of the BT having generations, follows the recursive equation
| (14) |
with . Then, we have
| (18) |
where
| (19) |
As increases, increases continuously from at to at . In Fig. 6(a), we compare the analytical result (19) and numerical results for the fractal exponent of the root cluster and the largest cluster, defined as
| (20) |
respectively. The numerical values of the fractal exponents for systems of various sizes are almost independent of , and correspond to the analytical line, except near above and below , where the generation of the BT is not sufficient for convergence of the fractal exponent. Also, deviates from the analytical line when compared with . However, both fractal exponents approach the analytical line as increases.
The root cluster size tells us what happens at . In percolation, the correlation function between two nodes in a graph is defined as the probability that the two nodes belong to the same cluster. Because there is only one path to connect these two nodes in a tree, the correlation function between -distant nodes is given as
| (21) |
Here the correlation length is finite as long as , in contrast to that of the Euclidean systems, which diverges at the critical point . At , the correlation length itself does not diverge, but the sum of the correlation functions does. This is due to the exponential volume growth of the NAG. The number of nodes such that the distance from the root is , , is , where . Since the root cluster size is written in terms of the sum of the correlation function as
| (22) |
it diverges if only . In the critical phase, some clusters diverge in size (the sum of correlation functions), though the correlation length remains finite for , and it is at that (if properly defined) diverges. Conversely, the appearance of the critical phase requires an exponential volume growth or a small-world property.
As mentioned in the previous section, the cluster size distribution always obeys a power law in the critical phase. In Fig. 6(b), we plot of systems of various size at 0.6, 0.7, and 0.8. We find that a power law of changes its slope with , although it is difficult to confirm a clear slope near above because is a decreasing function of , becoming infinite at .
The continuous change of the power law of with at and at means that the -th moment of starts to diverge as approaches the value satisfying from below. Any order of moments of does not diverge at , but these moments sequentially diverge in descending order as increases in the critical phase. In terms of spin systems, this type of phase transition can be understood by defining a free energy of percolation as a generating function of a ghost field :
| (23) |
so that the -th moment of is obtained by the -th derivative of with respect to . Then, the present transition of this model is often called the sequence of phase transitions, from the infinite order transition (at ) to the first order transition (at ). The same type of phase transition has already been reported in the spin system on the Cayley tree Eggarter (1974); Müller-Hartmann and Zittartz (1974). Finally, in this context, we should mention that the mean cluster size (as well as the susceptibility ) diverges above , at which . We can also define the fractal exponent of the mean cluster size, . Since , is related to as for . As shown in Fig. 6(a), the numerically-obtained satisfies this relation.



III.3 Percolation on the enhanced binary tree
Next, we consider the EBT, on which percolation shows a two-stage transition at and (see our original articles Nogawa and Hasegawa (2009a, b)). We “enhance” the binary tree with generation by adding the intra-generation (circumferential) bonds between and ( and ) and and to create the EBT with generation . We performed Monte Carlo simulations for percolation on the EBT with . Each data at a given value of is averaged over 480,000 samples.
We also investigated percolation on the dual lattice of the EBT, which we call the dual EBT. Each node of the dual EBT is put on the center of the triangular or rectangular cells of the EBT, and each bond crosses with the conjugate bond of the EBT (Fig. 4(c)). Let us denote the open bond probability of the dual lattice by . Just like a well-known duality relation between a planar Euclidean lattice and its dual lattice, , we assume the following duality relations for our case,
| (24) |
which indeed hold for transitive planar NAGs Benjamini and Schramm (2001).
Figure 7 shows the -dependences of for both of the EBT and the dual EBT. In Fig. 7, we reverse the values of of the dual EBT (as ) for the check of the duality relations. As expected, we find the three phases: the nonpercolating phase below , the critical phase between and , and the percolating phase above . The fractal exponent of the EBT continuously increases from zero to one in the critical phase. Conversely, of the dual EBT decreases from unity to zero between and . This suggests the duality relations indeed hold.
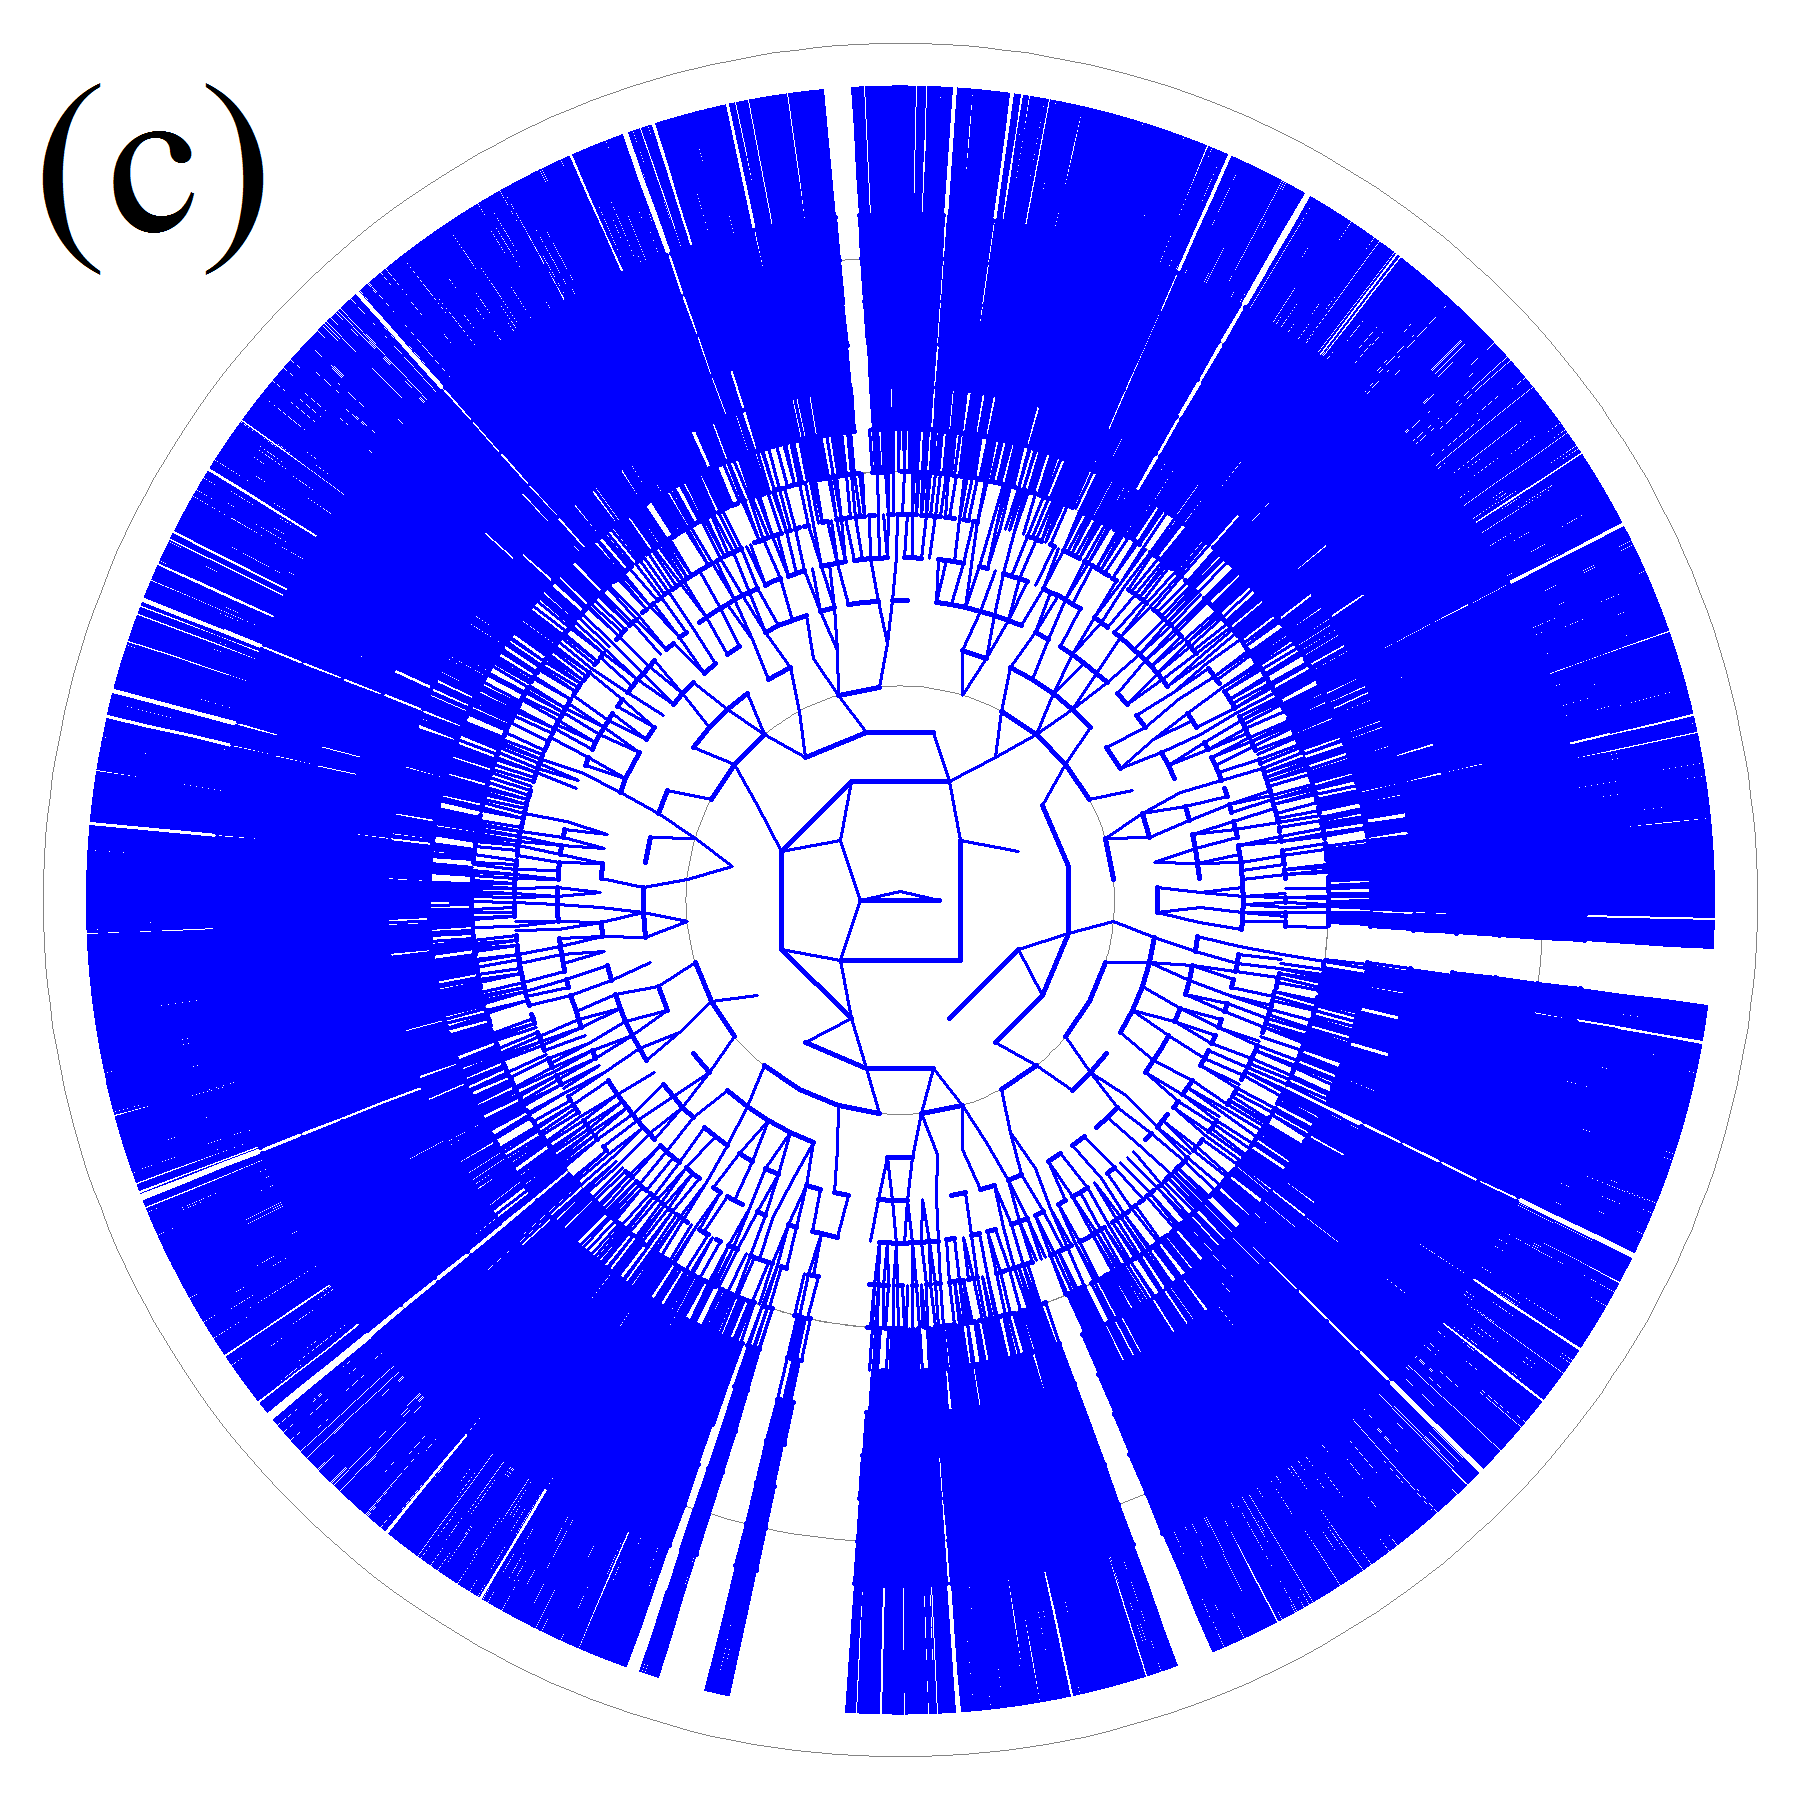
As a reference, we show some snapshots of the root cluster in the critical phase (Fig. 8). At , the root cluster survives marginally. The root cluster percolates along the radial direction, but its branches do not show spreading behavior; therefore, the mass of this cluster is roughly proportional to the number of generations (Fig. 8(a)). The size of this root cluster diverges in the limit , but it occupies a very small part of the whole system due to the fact that the spreading rate is slower than that of the EBT itself. Consequently, this root cluster does not produce any macroscopic order, and the system has space for other clusters to diverge in the limit . When increases, the root cluster grows; it has more branches, a larger spreading rate, and a larger size (Fig. 8(b)). When reaches , the connections of the “enhanced” circumferential connections are effective to form the giant component such that it occupies the finite fraction of the whole system in the large size limit (Fig. 8(c)).
The precise value of is given by measuring the -dependence of the root cluster size, i.e., by measuring whether the root cluster can survive or not. Approaching from above, goes to zero, but diverges as (). In Fig. 9, we plot
| (25) |
as a function of . As goes to infinity, decreases to zero for , and diverges for . Only at does rapidly converge to unity, which is consistent with . Our numerical result for the -dependence of the root cluster size in systems of various size shows one cross point with , which gives the precise values of the first critical point of both the EBT and the dual EBT, and . We can also determine from the point where , as is done in Nogawa and Hasegawa (2009b).
Compared to the first transition, it is more difficult to determine the precise value of directly from Monte Carlo simulations (see arguments in Nogawa and Hasegawa (2009a); Baek et al. (2009a); Nogawa and Hasegawa (2009b); Minnhagen and Baek (2010); Gu and Ziff (2012); Baek (2012)). In Nogawa and Hasegawa (2009a), we only assumed and from the duality relations (24) 333Our values of and of the EBT are consistent with the recent numerical result Gu and Ziff (2012). to observe the -dependence of the order parameter at . The order parameter is well-fitted by at (Fig. 10). This means that has a finite limit value in at . We must be careful when determining whether or not this transition is truly discontinuous, but of the order parameter would be very small even if it were continuous.
Finally, we check the cluster size distribution in the critical phase. We assume a finite-size scaling law for as
| (26) |
at each in the critical phase. Here the scaling functions and behave as
| (27) |
In Fig. 11, we show a finite-size scaling result for at several values of in the critical phase. Our results strongly support that our scaling holds in the critical phase, and therefore is indeed a power law for at the all points in the critical phase.


III.4 Remarks on other NAGs
Other representative examples of NAGs are hyperbolic lattices. In recent years, numerical approaches for percolation on the hyperbolic lattices have been investigated in Baek et al. (2009b); Gu and Ziff (2012); Lee and Baek (2012). Their numerically-obtained results also showed the existence of the MPT.
To summarize percolation on NAGs, the critical phase where the system is in a critical state appears. The critical phase is not characterized by the standard order parameter , which catches only macroscopic order, but by the fractal exponent , which catches a subextensive order. As we showed in this section, the uniqueness of the critical point, i.e., , is likely violated for non-Euclidean lattices. Therefore, we should keep in mind the possibility of the critical phase when we study percolation on general graphs.
IV Percolation on complex networks
One of the important issues in network science is the robustness of real networks against random failures, which remove a set of nodes randomly, and against intentional attacks, which preferentially remove nodes having large degrees Albert and Barabási (2002); Newman (2003a); Dorogovtsev et al. (2008); Barrat et al. (2008). Albert et al. Albert et al. (2000) numerically examined the robustness of scale-free networks with small to show that they are highly robust against random failures, i.e., the network remains intact until almost all nodes have been removed. On the other hand, such networks are very fragile against intentional attacks because the removal of a small fraction of hubs is enough to destroy the network. Random failures and intentional attacks can be interpreted as percolation problems when the removal of a node/bond is regarded as a node vacancy in site percolation/a closed link in bond percolation. Therefore, both site and bond percolation models on various networks have been extensively studied (see Dorogovtsev et al. (2008) and references therein).
An elementary theoretical framework of percolation in complex networks is provided by the local tree approximation for uncorrelated networks Cohen et al. (2000, 2002). Uncorrelated networks with arbitrary degree distribution are prepared by the configuration model Molloy and Reed (1995). The configuration model with nodes is given as follows: (i) generate a degree sequence of nodes, according to a desired distribution , (ii) attach stubs (half edges that are the ends of edges-to-be) to node , and (iii) make links by connecting randomly chosen pairs of stubs 444Since two stubs of a node may be paired together or a pair of nodes may be selected in many times, the configuration model allows a number of self-loops or multiple edges in principle. But these may be neglected in many cases.. The local tree approximation shows that the critical properties for uncorrelated networks with scale-free degree distribution are determined by the exponent Cohen et al. (2000, 2002): the critical point between the nonpercolating phase and the percolating phase is given by , where , and the critical behavior of the order parameter depends only on Cohen et al. (2002) as given by
| (32) |
The local tree approximation for uncorrelated networks confirms that scale-free networks with heavy-tailed degree distributions are robust against random failures Callaway et al. (2000); Cohen et al. (2000), i.e., is zero for both bond and site percolations when , while for . This approximation can be applied to the case of intentional attacks to show that uncorrelated scale-free networks with small are fragile against such attacks Callaway et al. (2000); Cohen et al. (2001). This theory can be extended to treat clustered networks and correlated networks Goltsev et al. (2008); Tanizawa et al. (2012); Newman (2003b); Gleeson (2009); Gleeson and Melnik (2009); Gleeson et al. (2010).
As long as a network is uncorrelated, the percolation on the network shows a conventional second order phase transition between the nonpercolating phase and the percolating phase at the critical point . However, the systems on networks made with the growth mechanism show quite a different picture. Here “growth” means the number of nodes in the graph increases with time. Previous analytical studies for several growing and hierarchical small-world (deterministically growing) networks have revealed that the system exhibits an unusual phase transition, termed the inverted Berezinskii-Kosterlitz-Thouless (BKT) transition Callaway et al. (2001); Dorogovtsev et al. (2001a); Lancaster (2002); Kim et al. (2002); Coulomb and Bauer (2003); Zalányi et al. (2003); Krapivsky and Derrida (2004); Bollobás and Riordan (2004); Bollobás et al. (2005); Bollobás and Riordan (2005); Riordan (2005); Pietsch (2006); Zhang et al. (2008): (i) The singularity of the transition at is infinitely weak. When is nearly above the percolation threshold , the order parameter follows
| (33) |
where . (ii) In the whole region below , obeys a power law, i.e., . If this unusual phase on growing networks is regarded as the critical phase on NAGs, these systems have a new scenario of phase diagrams: and . In this section, we consider such networks by calculating the fractal exponent in order to substantiate this conjecture.
IV.1 Stochastically growing networks
Among several mathematical models of growing networks, the most famous one is the Barabási-Albert (BA) model. It has a preferential attachment mechanism, in which new nodes prefer to connect to pre-existing nodes with larger degrees. The percolation on the BA model is known to indicate Albert et al. (2000). On the other hand, the percolation on a growing network without preferential attachment, which is called -out graph, has been studied rigorously and is found to have a finite percolation threshold , at which an inverted BKT transition occurs. Here, we consider percolation on a growing random network (GRN) proposed in Dorogovtsev et al. (2000); Krapivsky et al. (2000), which interpolates between the BA model and the -out graph by introducing the initial attractiveness.
IV.1.1 Model
The GRN stochastically generates a graph with nodes as follows: (i) At the initial time, we start with a complete graph of nodes, where is a given positive integer. We call these nodes the roots. (ii) At each time step, a new node joins the network by attaching to pre-existing nodes. The probability that a new edge attaches to a node with degree is proportional to a quantity called the linear attachment kernel , given by
| (34) |
where is a constant called the initial attractiveness. (iii) The process (ii) continues until the number of nodes reaches . For , the degree distribution becomes stationary and is given by
| (35) |
for and for Dorogovtsev et al. (2000). Here is the degree exponent controlled by the initial attractiveness as Krapivsky et al. (2000); increases from to as increases from to . The cases of and are reduced to the BA model and the -out graph, respectively. We also call the case of the growing random tree (GRT) because the resulting network is a tree.
IV.1.2 Percolation on the GRT
In Hasegawa and Nemoto (2010), the authors studied percolation on the GRT. This network model remains a tree but grows with time. Since we expect that growing networks have no nonpercolating phase (except at ) while any tree has no percolating phase (except at ), it is not surprising that the percolation on the GRT is always critical in the whole range of (except at ), regardless of the degree exponent .
By the rate equation approach, we can obtain the approximate forms of and for the GRT with arbitrary (see Hasegawa and Nemoto (2010)). The fractal exponent of and the exponent of are
| (36) |
respectively. The relation (11) holds for this case, as expected. Equation (36) indicates that increases from to 1 as increases from to . Thus, the GRT is always in the critical phase (except at ), regardless of the value of , i.e., the network heterogeneity.
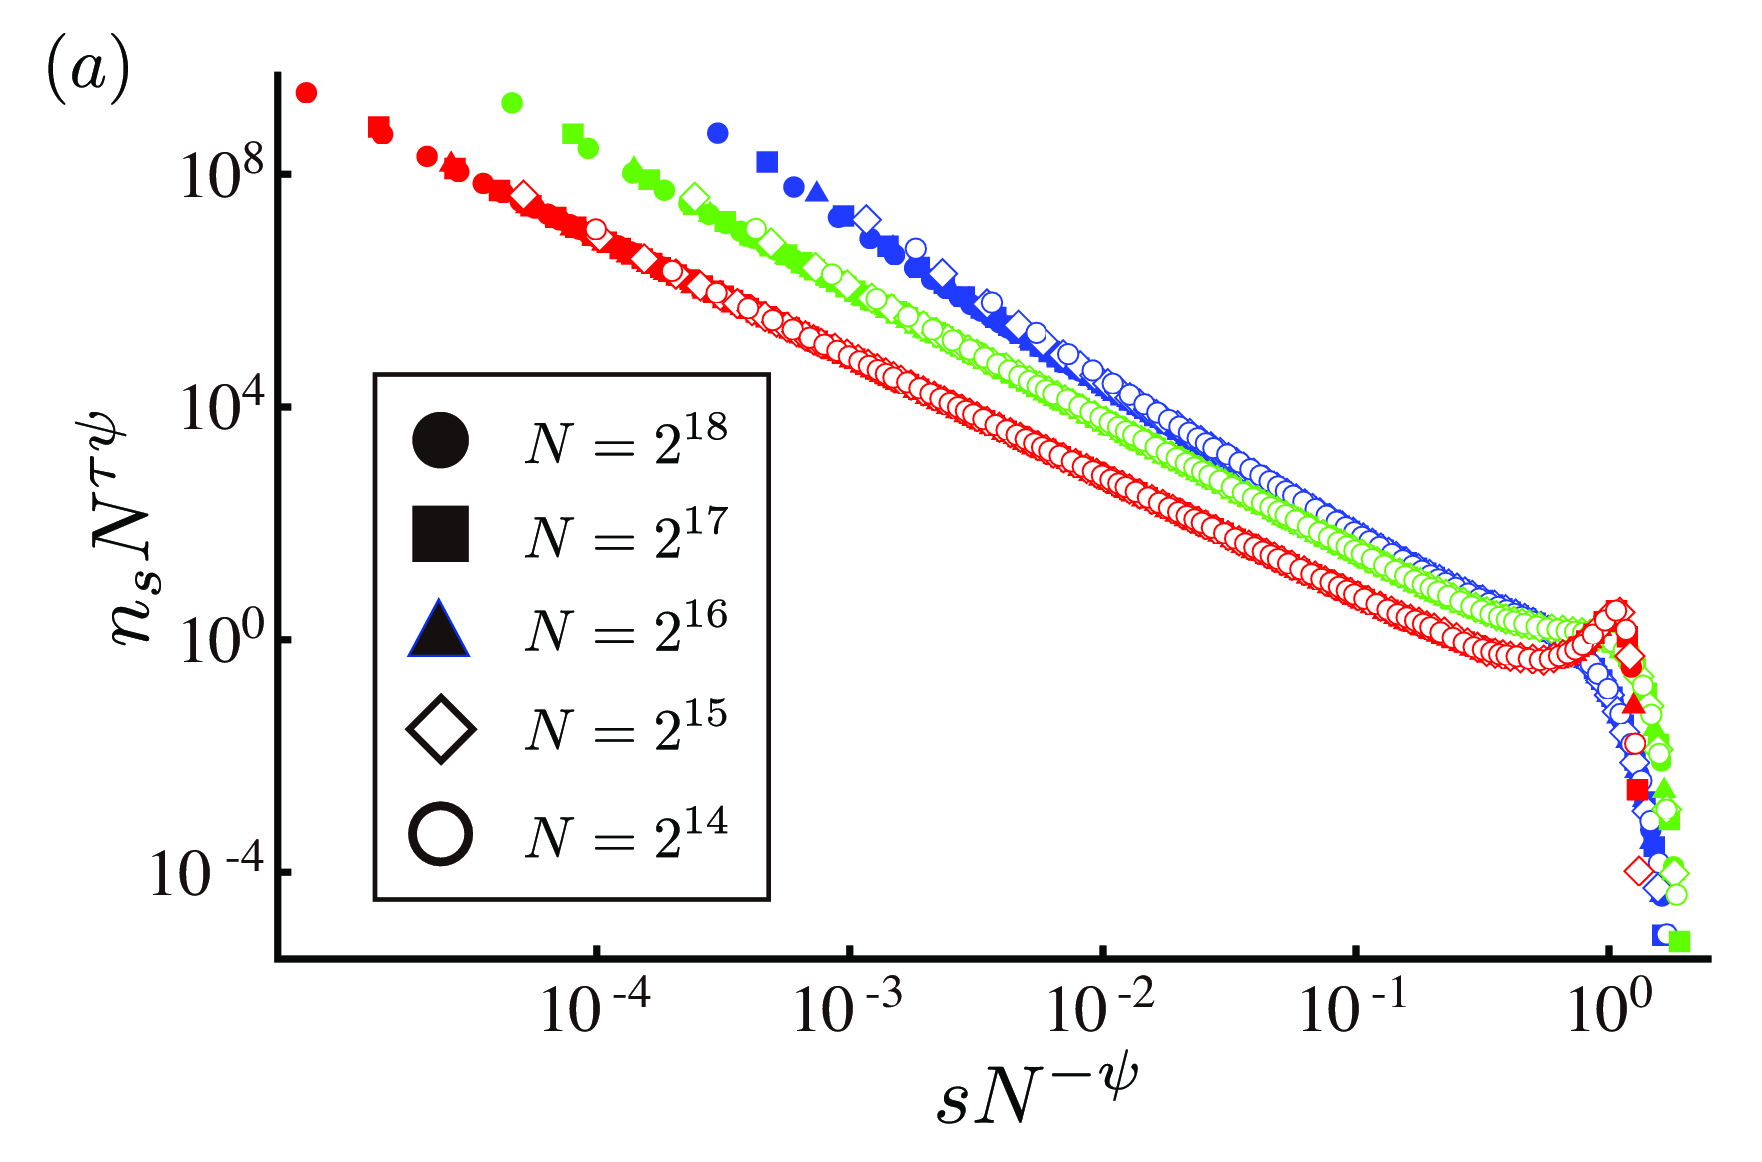
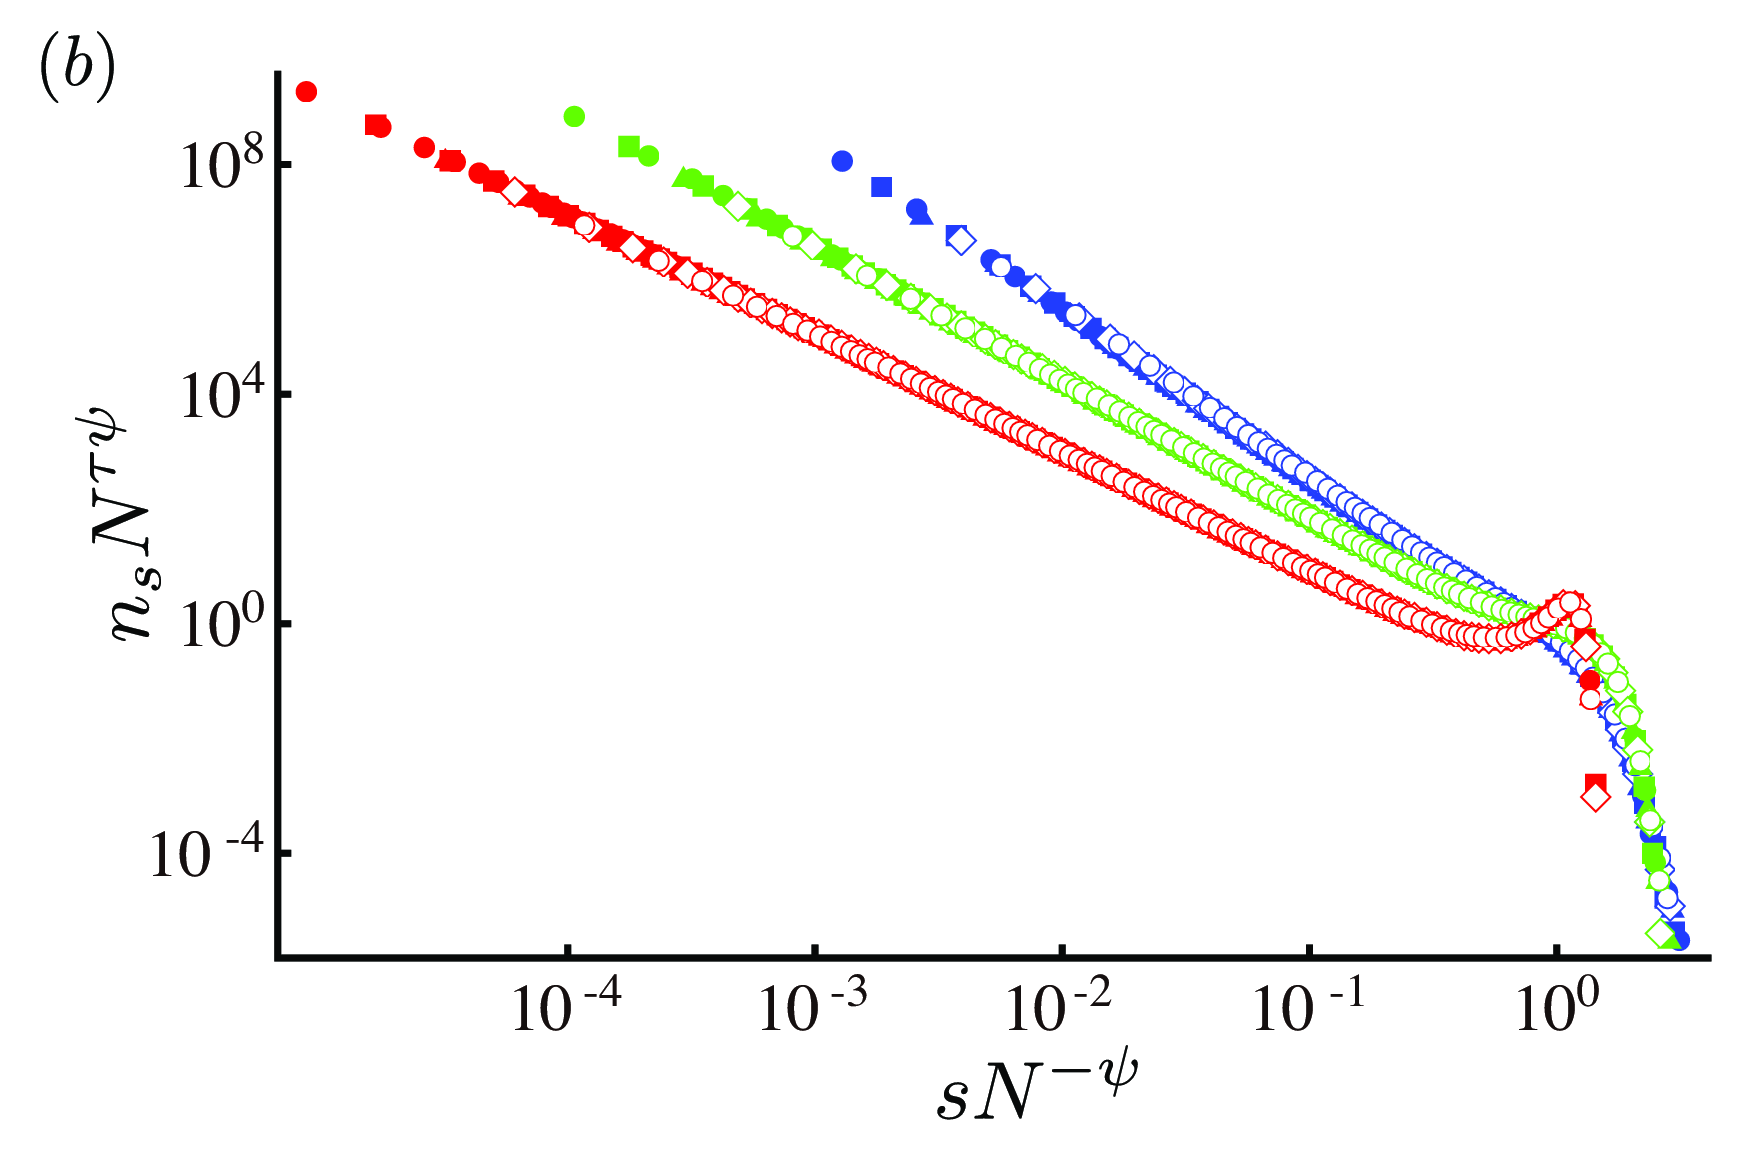
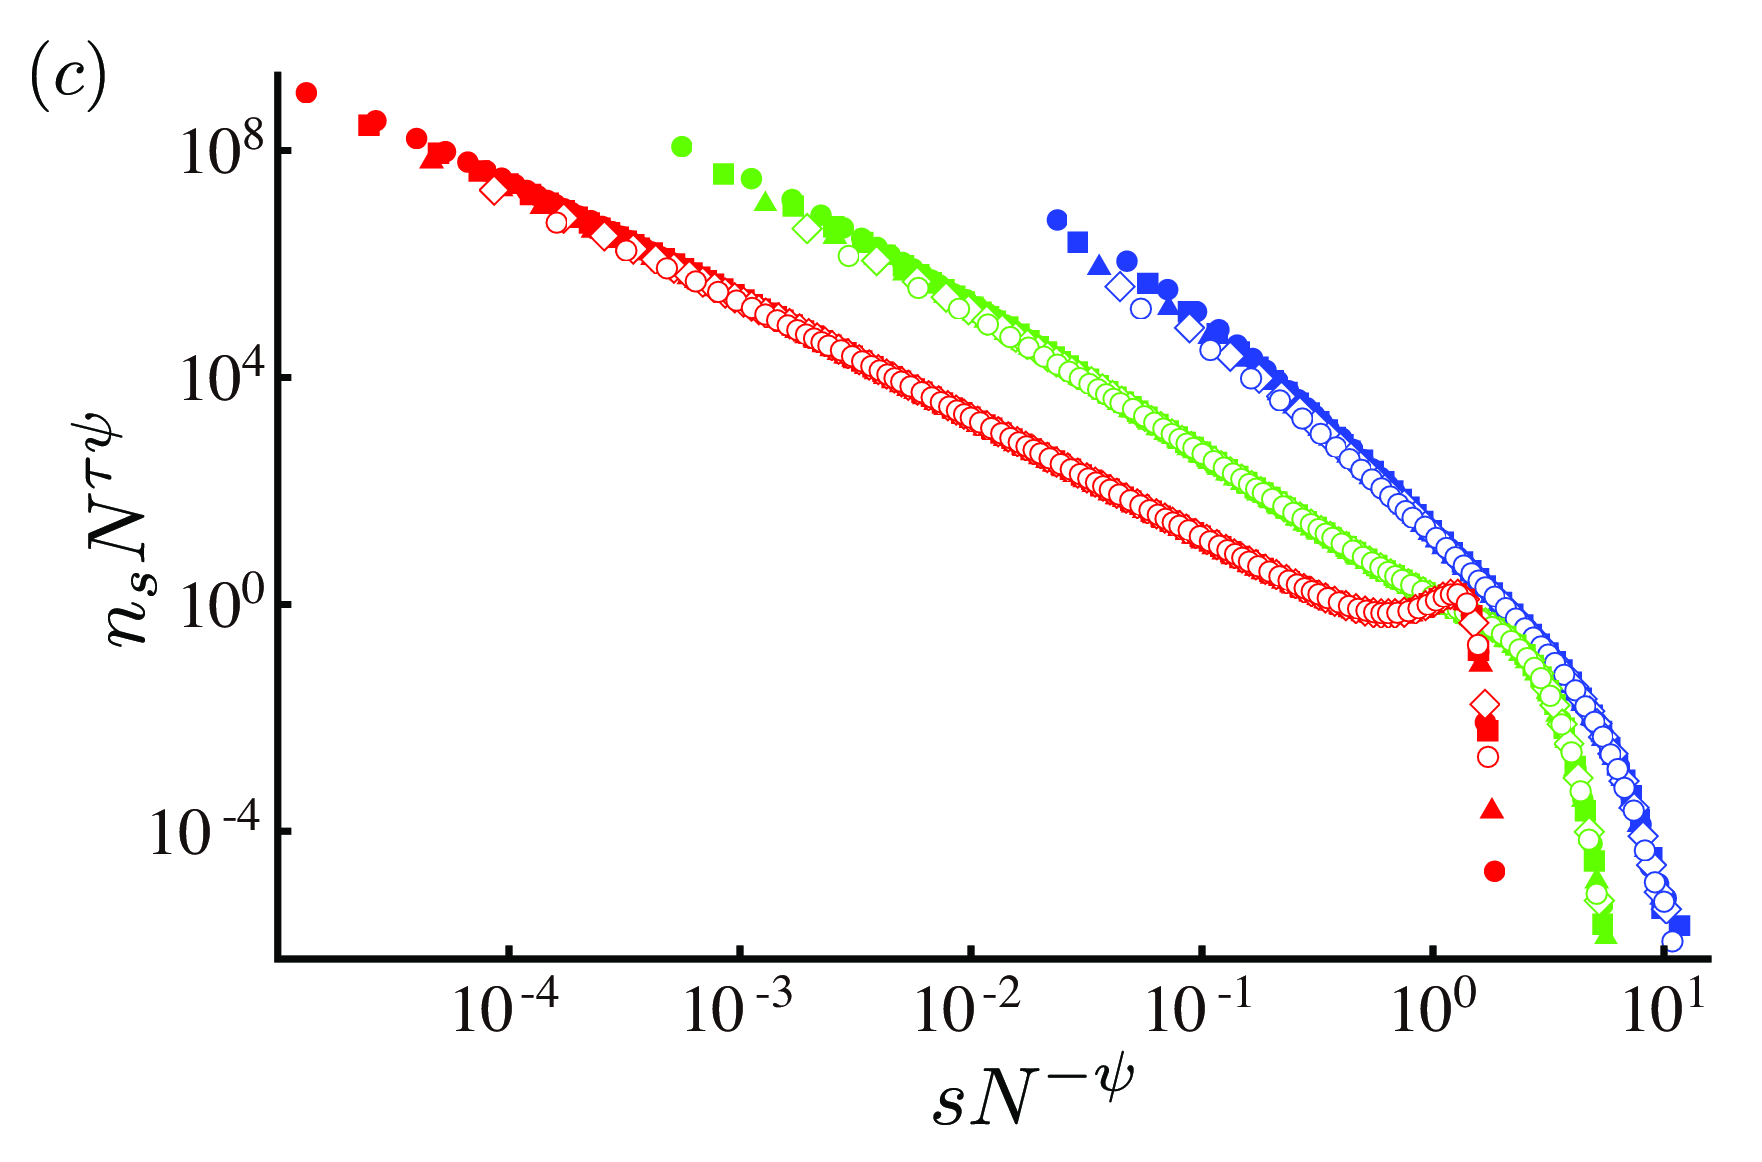
To check this analytical prediction, we performed the Monte Carlo simulations. The number of nodes is taken from to . To average each data at a given value of , we generated 1,000 graph samples and generated the bond percolation 1,000 times on each sample. Figure 12 plots the numerical result of and its analytical prediction (36). We see that the numerically-obtained corresponds well with the line generated by (36) for . The deviation seen for tends to diminish with increasing (not shown). We also measure the fractal exponent of the largest cluster, as shown in Fig. 12. The estimated value of shows good agreement with , which indicates that the root cluster is one of the infinite clusters (for ) with finite probability, as well as being the largest cluster. Figure 13(a) shows our finite-size scaling (26) for on the GRT with . The scaling is quite good over a wide range of . We also find similar results for other values of , as shown in Figs. 13(b) and (c).

IV.1.3 Percolation on the GRN
Next, we consider the case of . In Hasegawa et al. (2013), we studied percolation on the -out graph (the GRN with ). As given in Riordan (2005); Bollobás and Riordan (2005) after Zalányi et al. (2003), the percolation threshold of the -out graph is given as
| (37) |
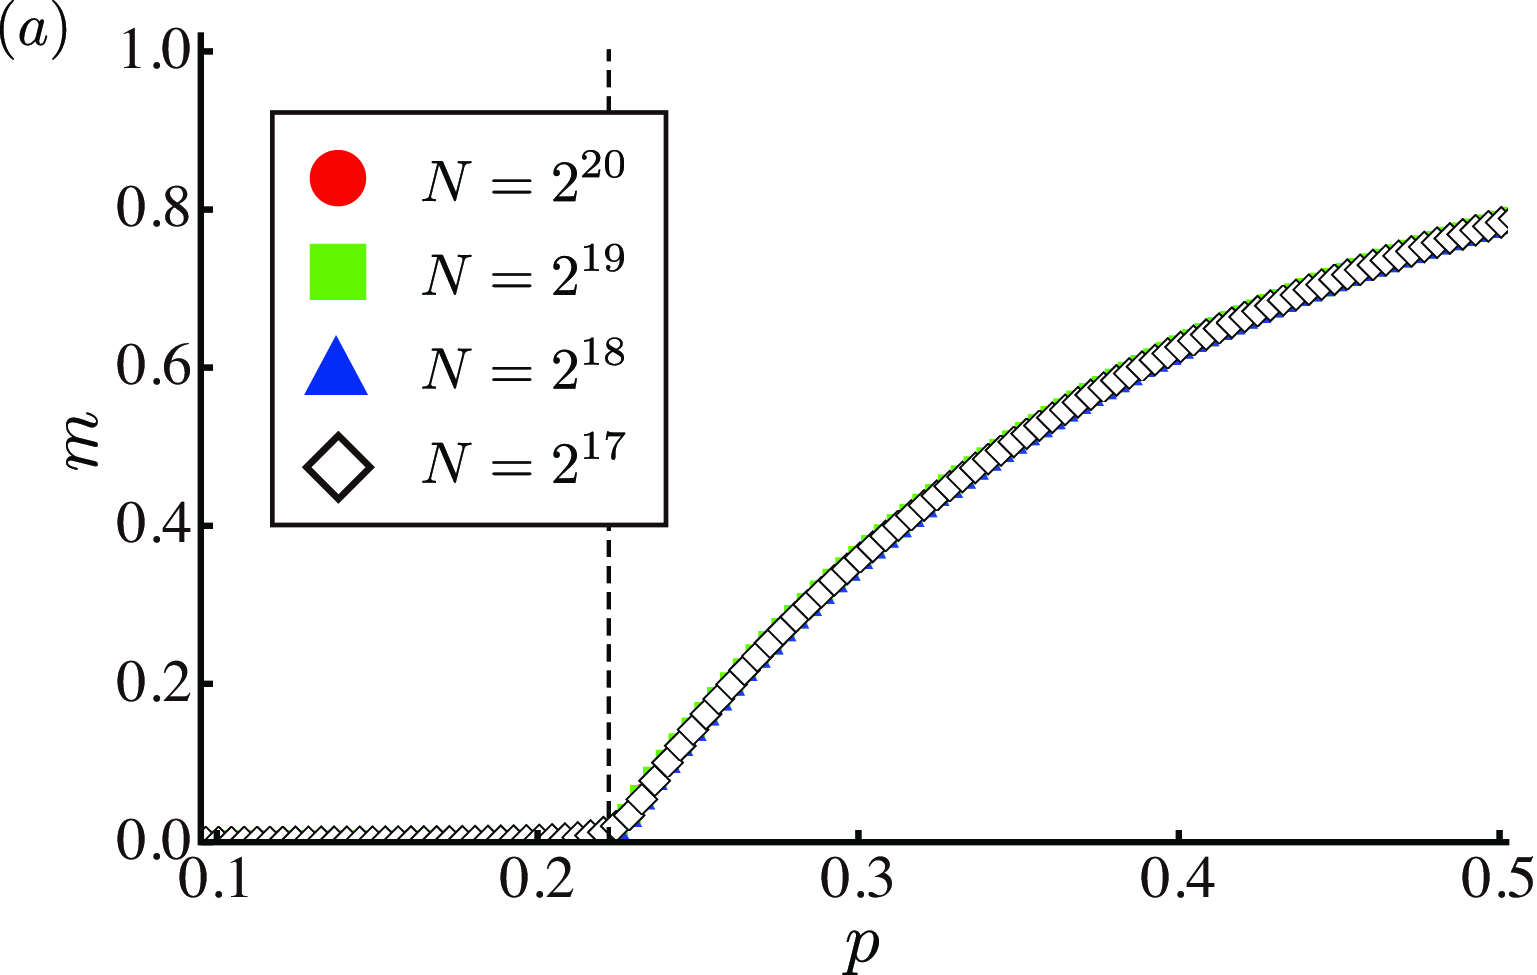
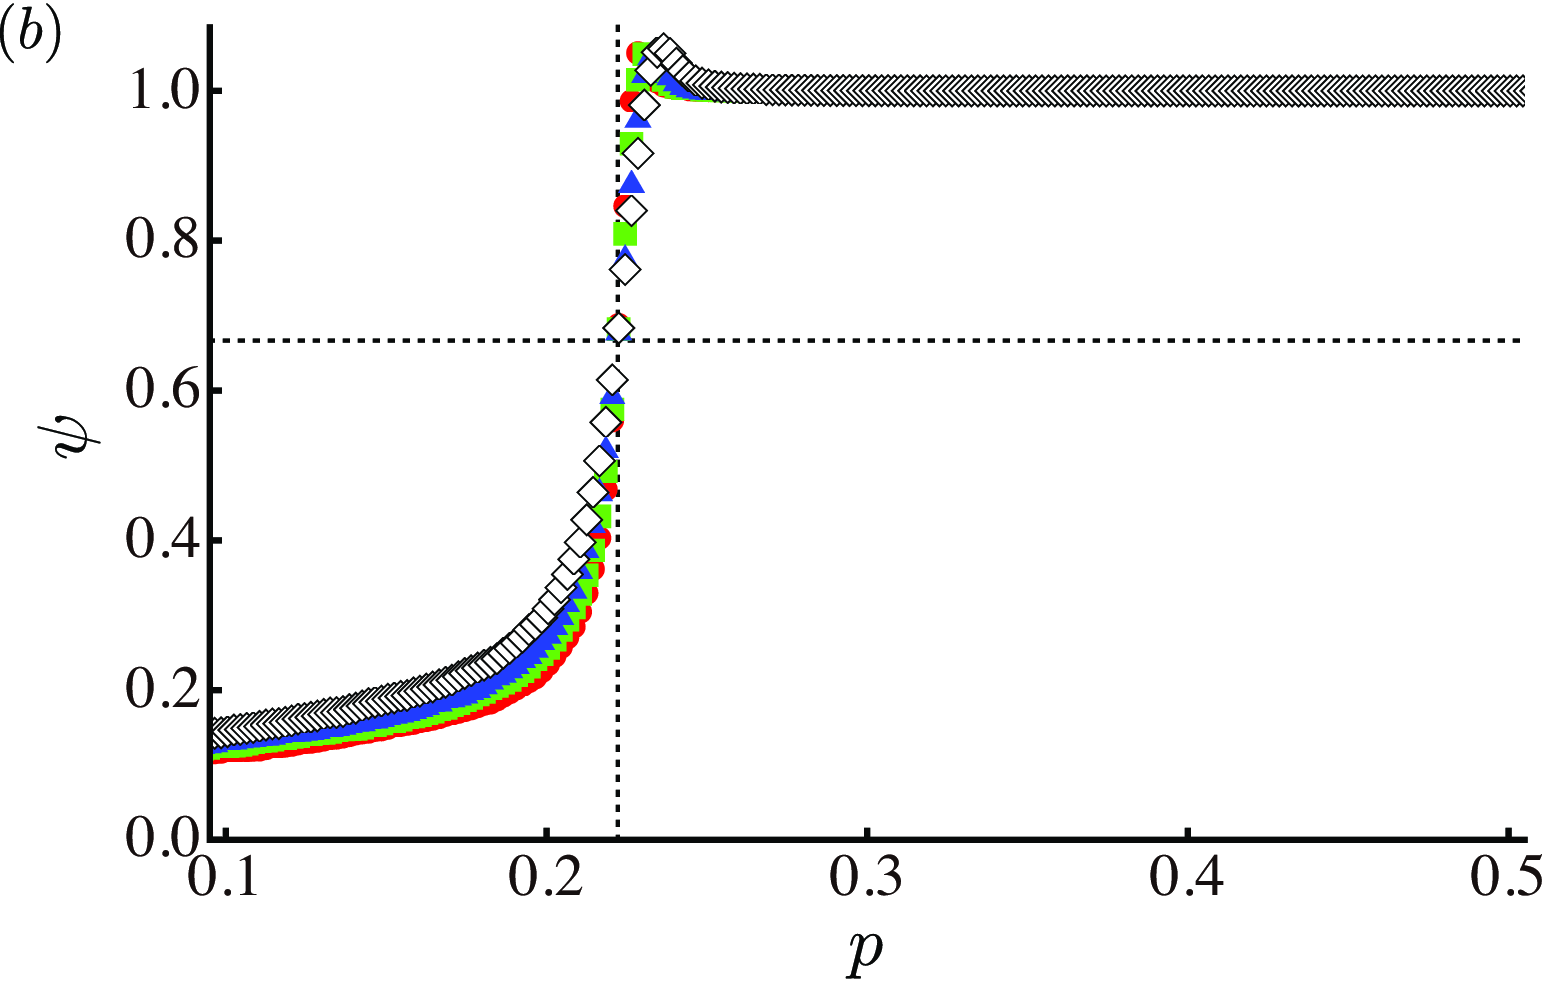
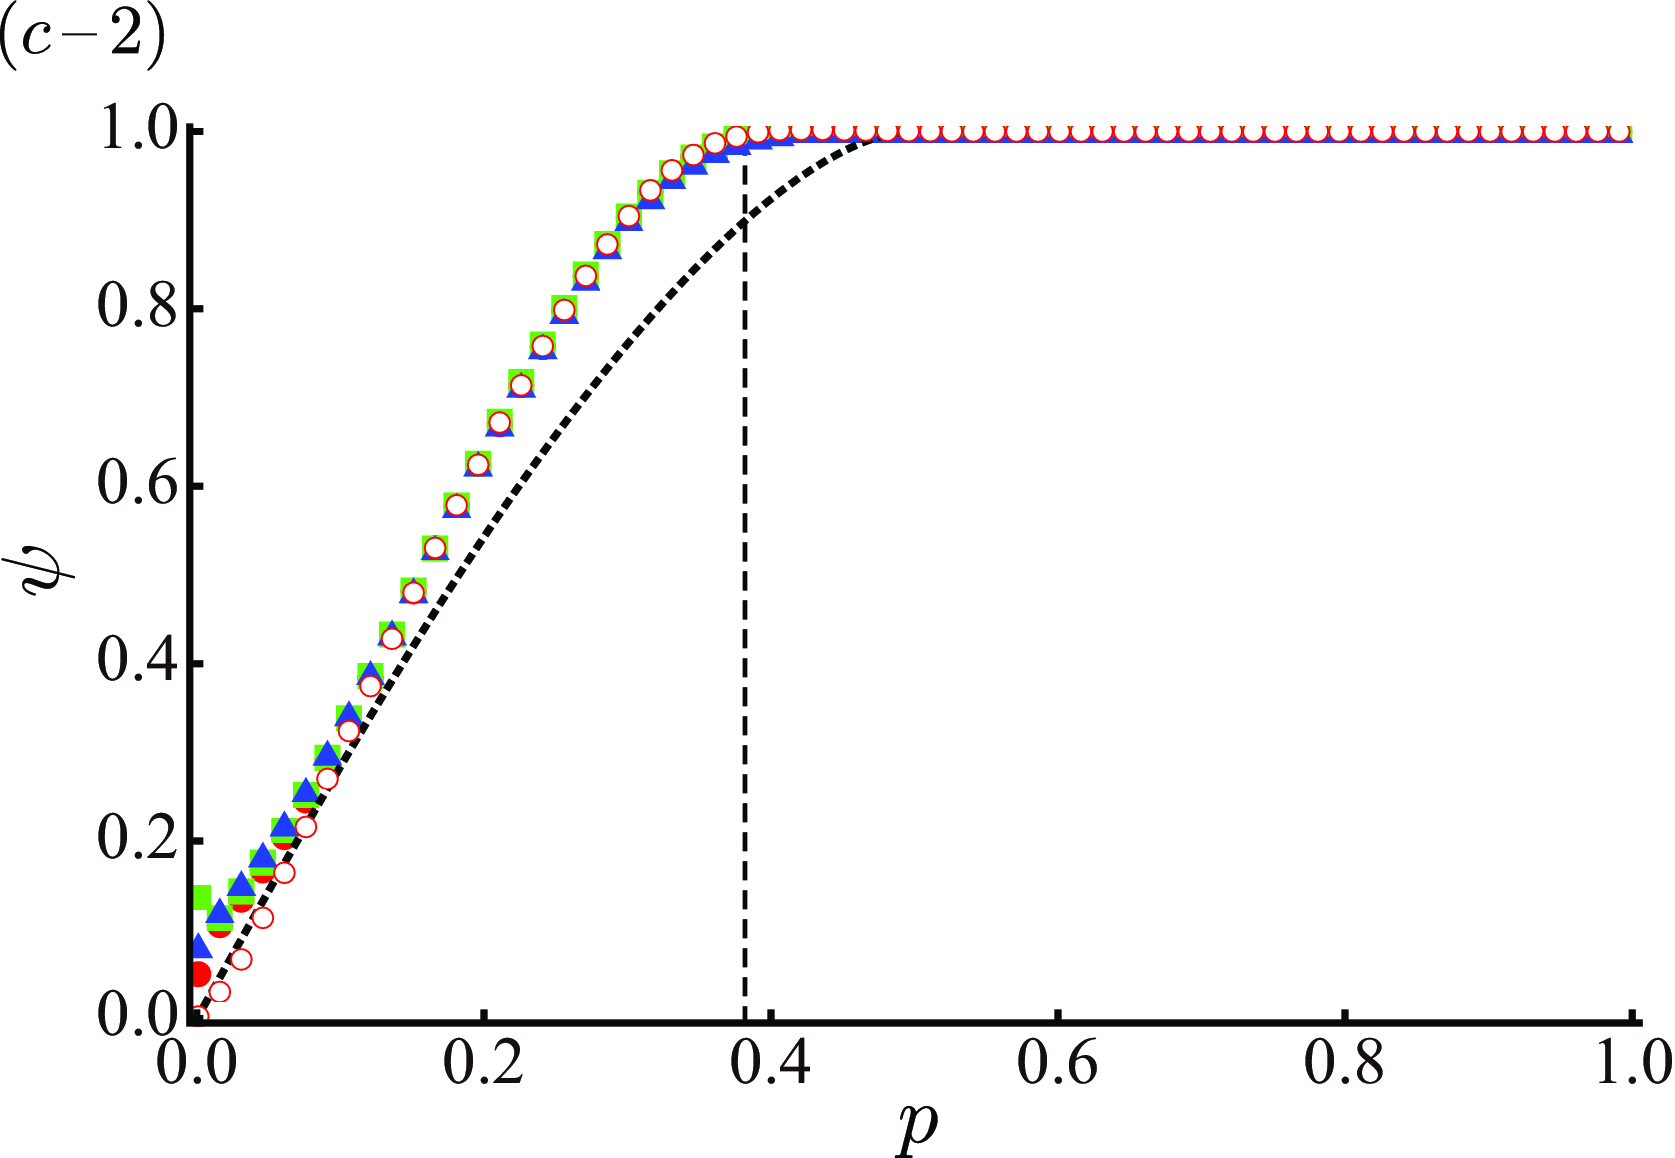
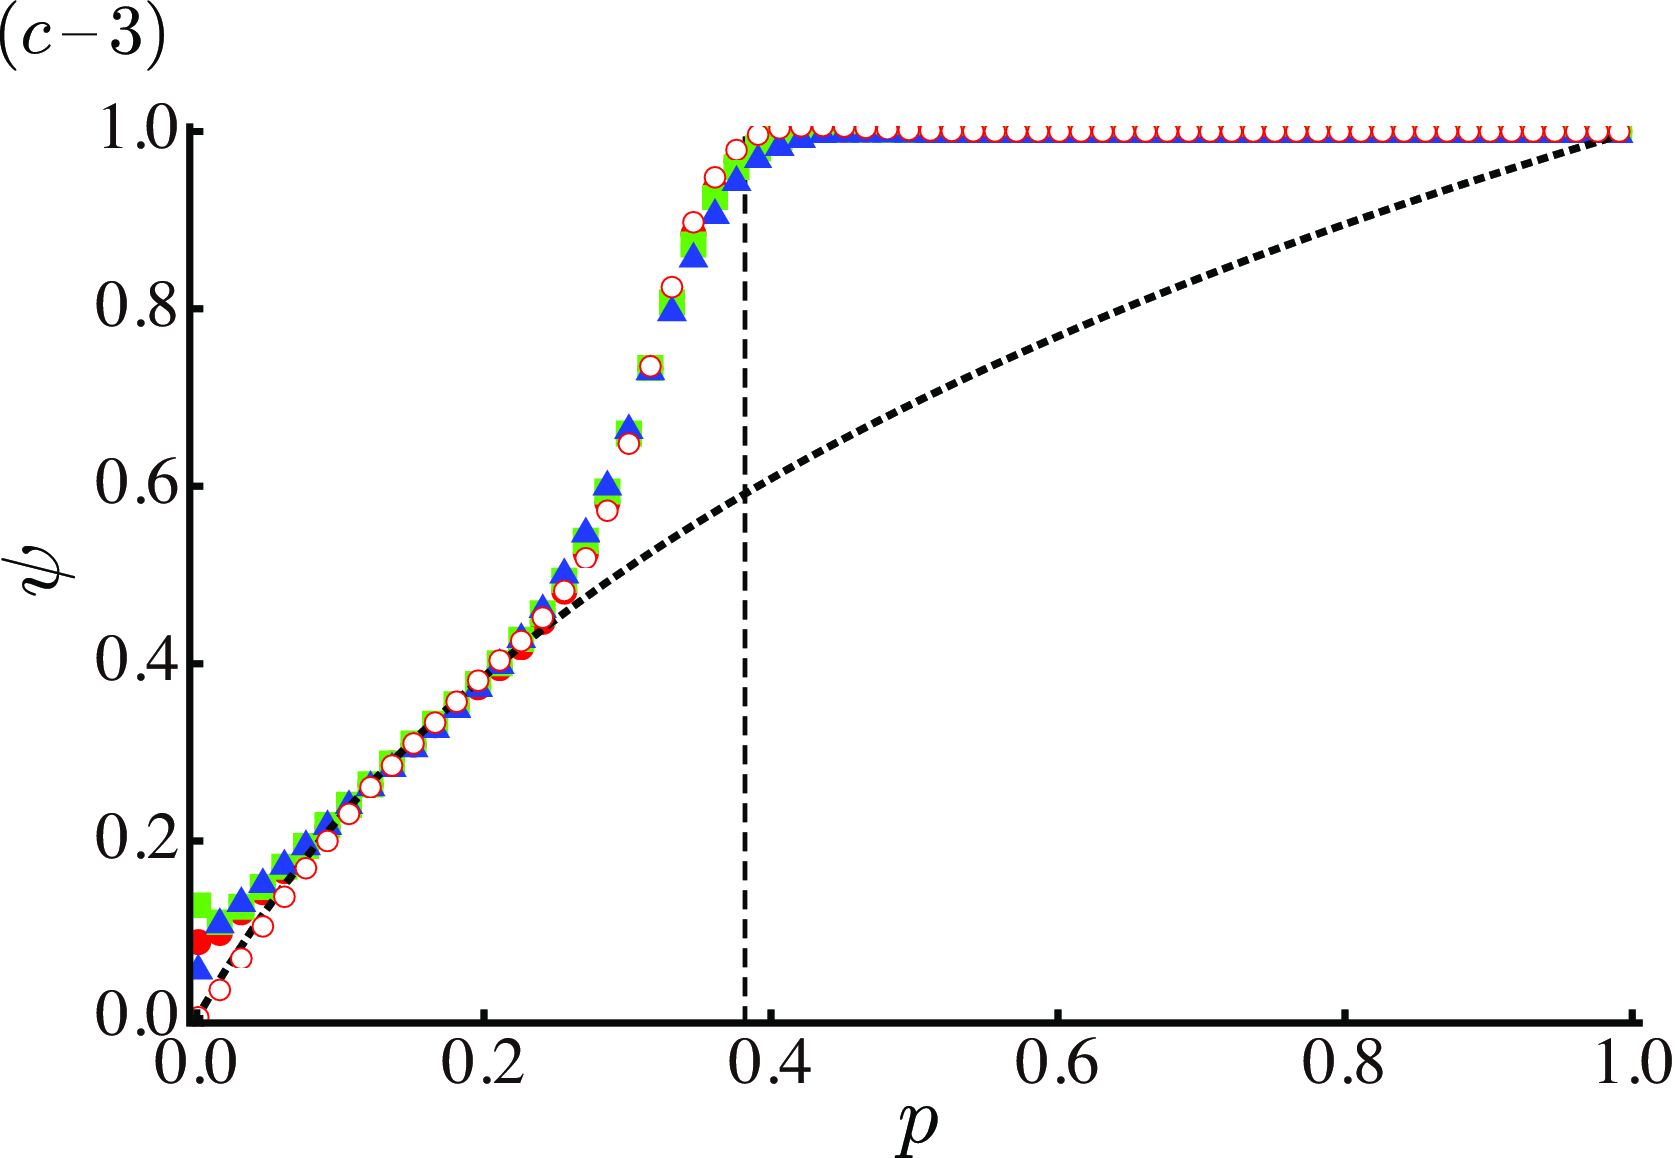
and follows Eq.(33) with and . In Krapivsky and Derrida (2004), Krapivsky and Derrida also derived a similar result on a generalized model and showed that the cluster size distribution is a power-law in the whole region below , meaning . Moreover, we have from the power-law behavior of at (see Eq.(6) in Krapivsky and Derrida (2004)). For Monte Carlo simulations, we set and . The number of graph realizations is 1,000 and the number of percolation trials on each realization is 100. The order parameter and the fractal exponent on the -out graph are shown in Fig. 14. For each value of below , almost converges to a certain value, while for varies very slowly but approaches unity with increasing . In spite of our extensive simulations, at looks slightly smaller than due to a logarithmic correction in the power law of Krapivsky and Derrida (2004). However, grows continuously with for up to at , and then jumps to .
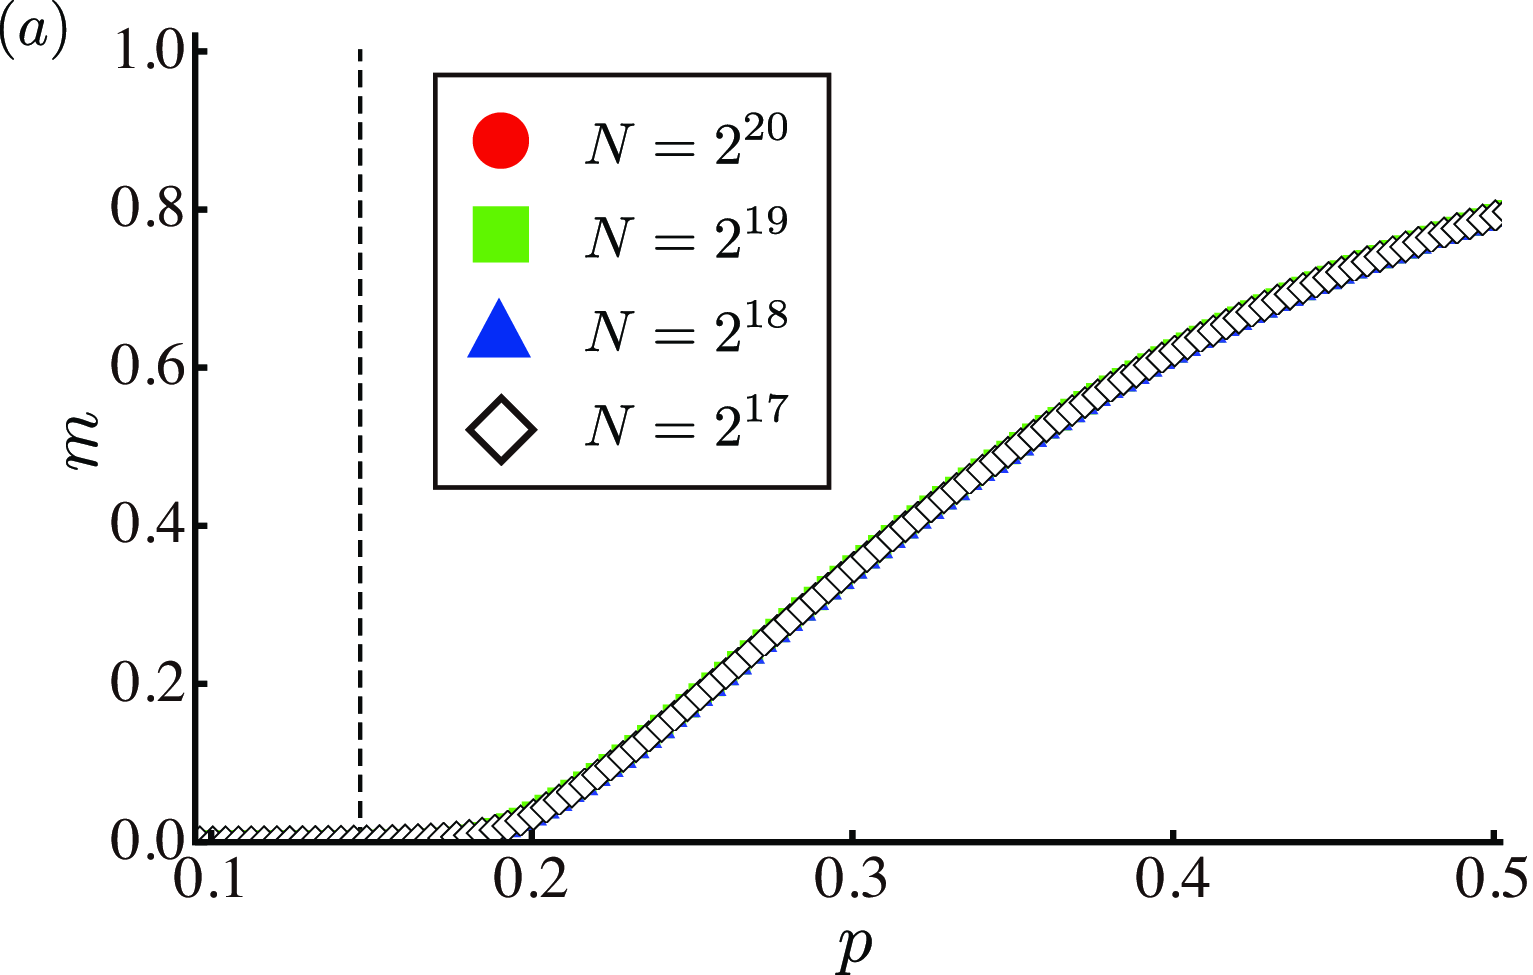
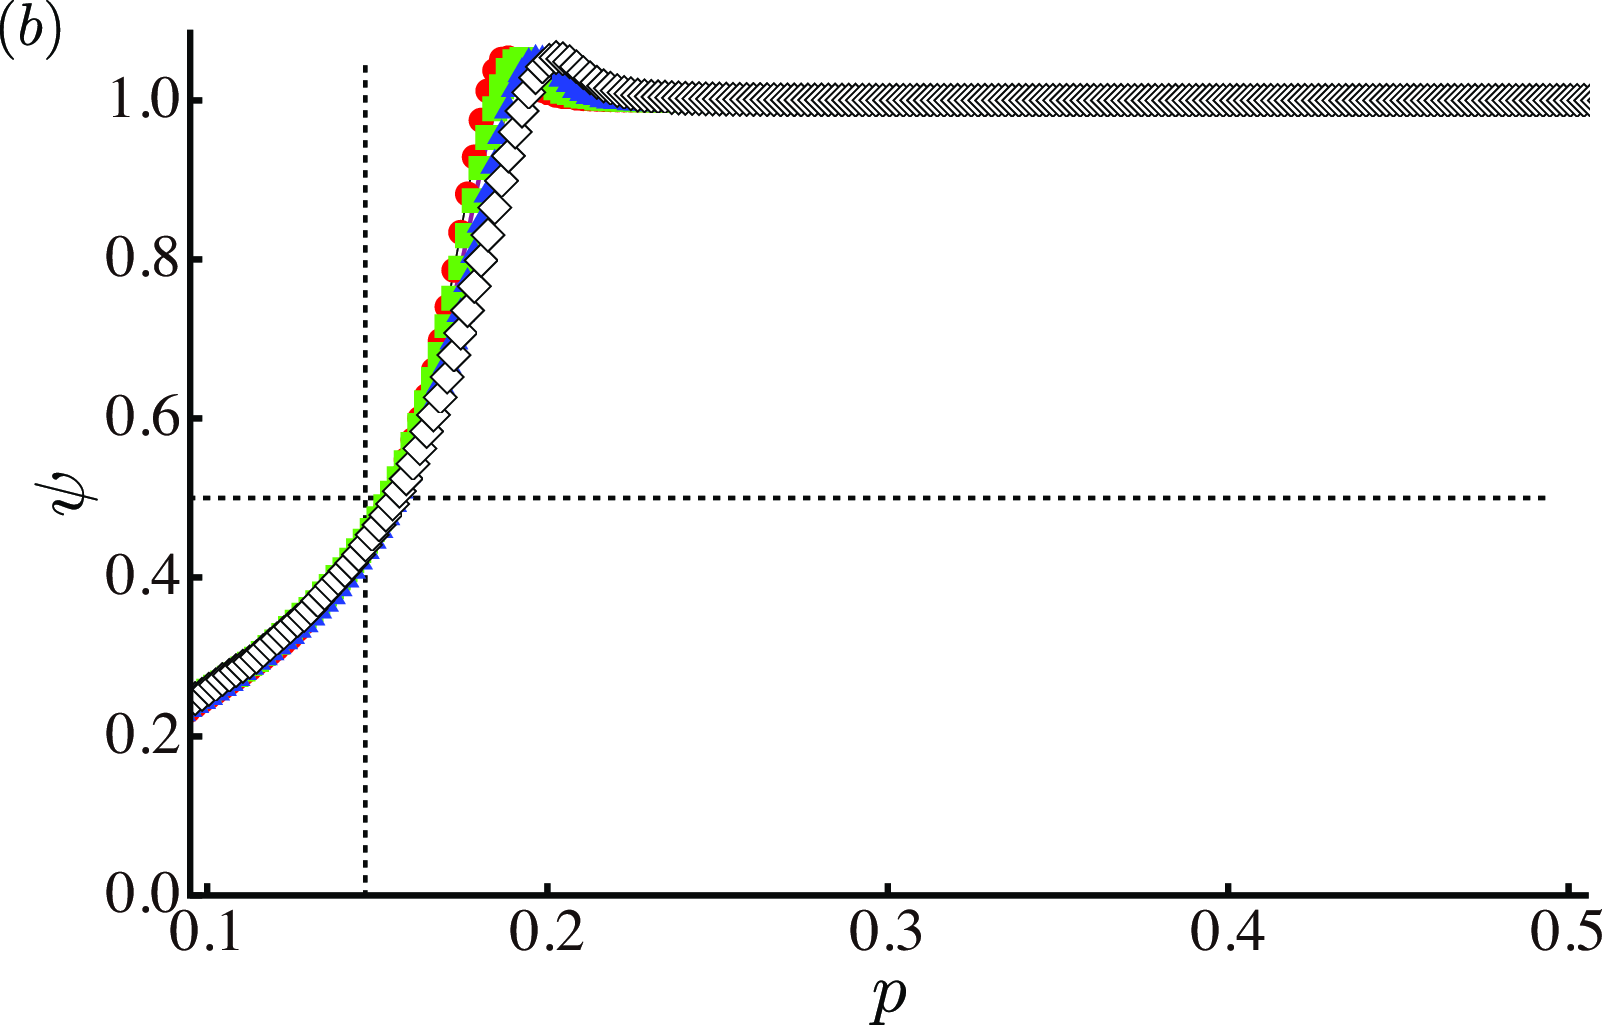
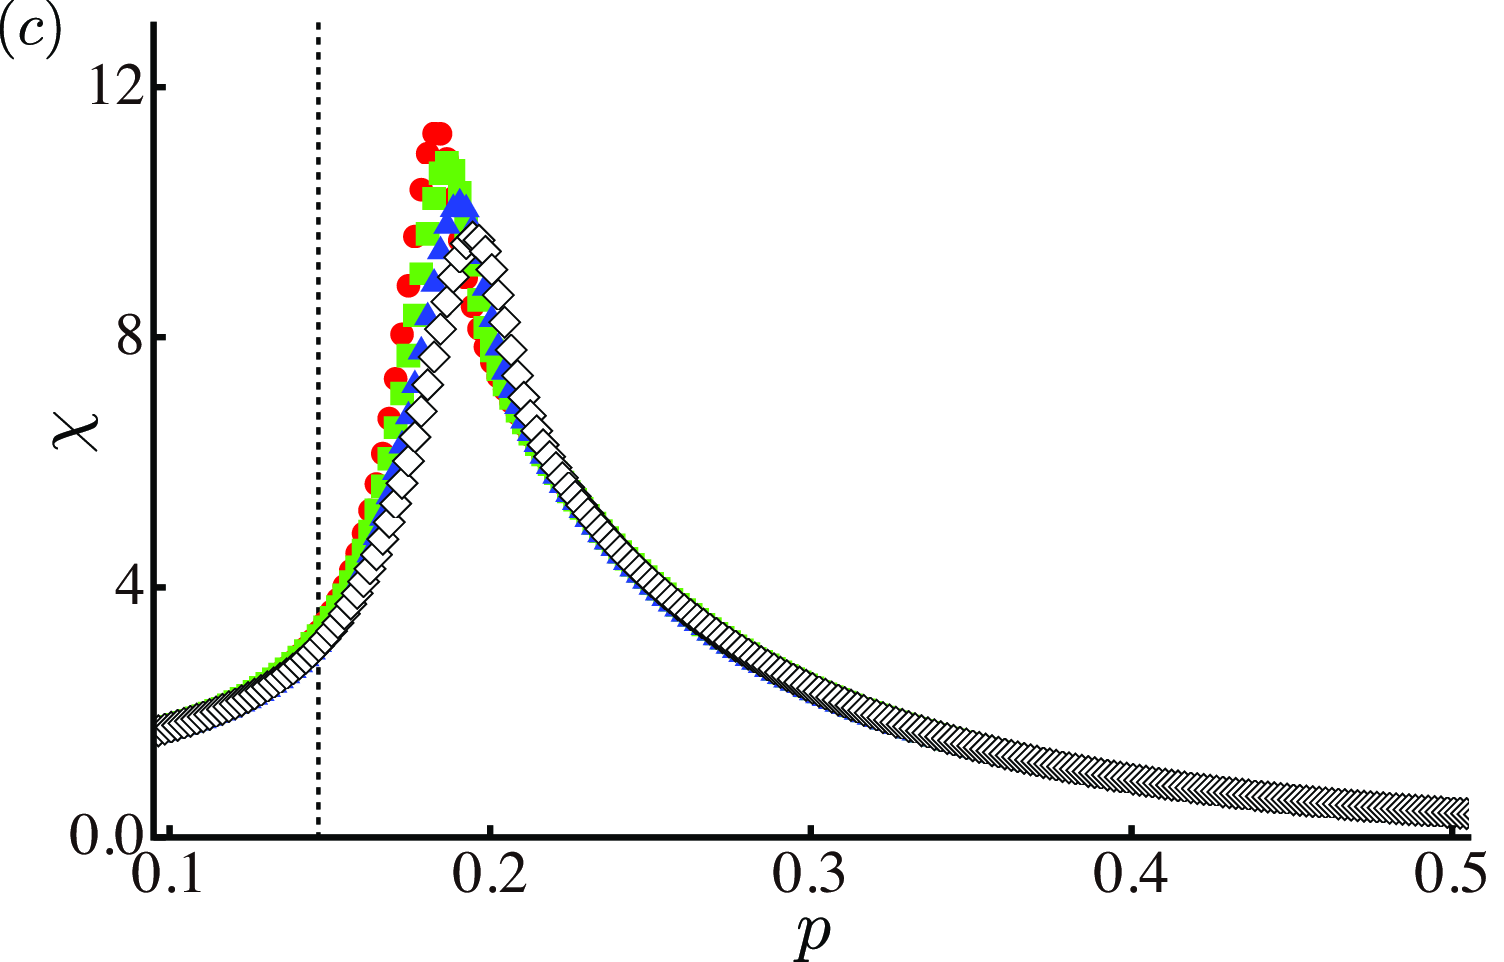
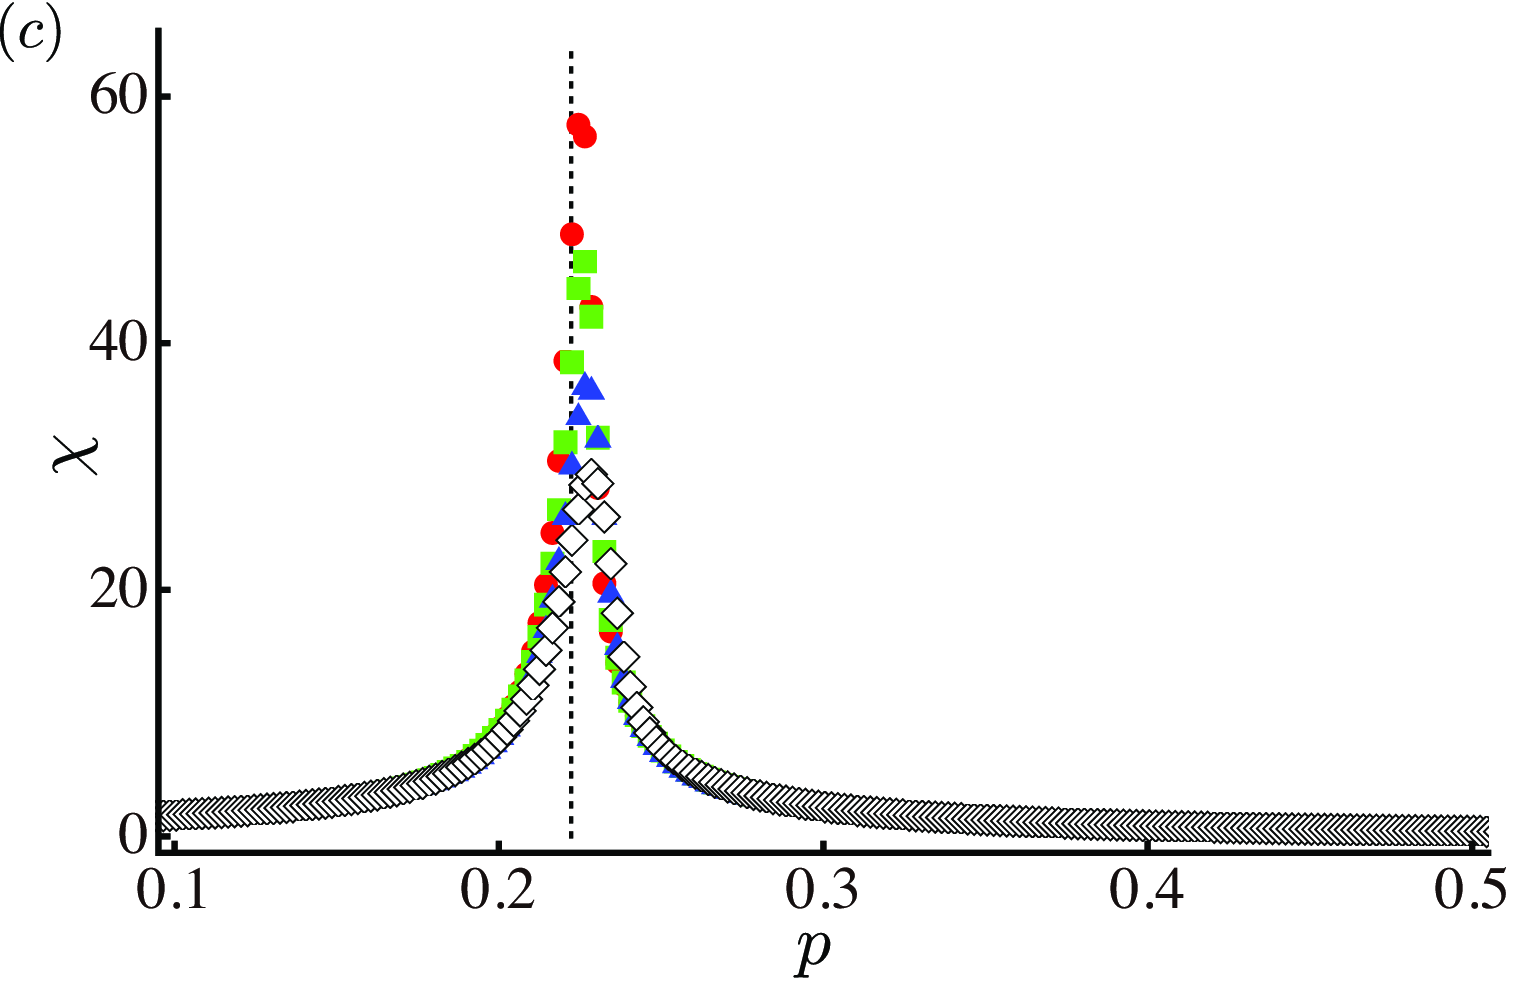
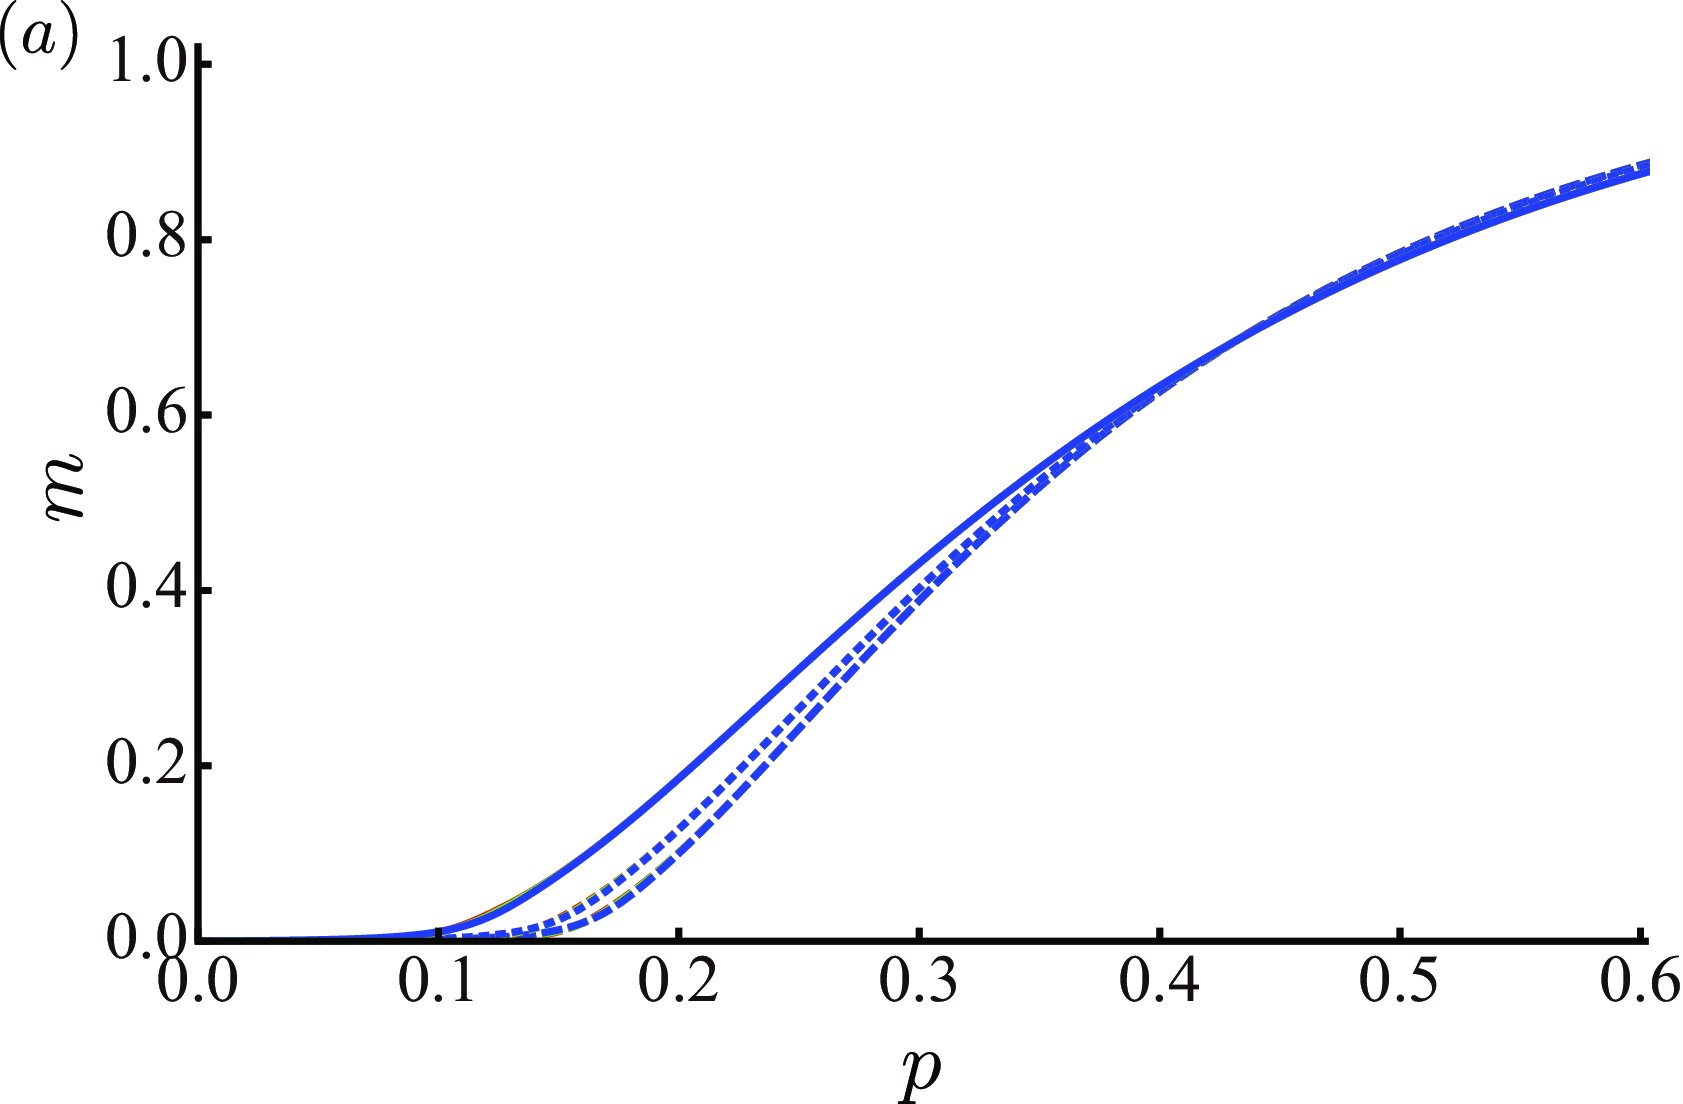
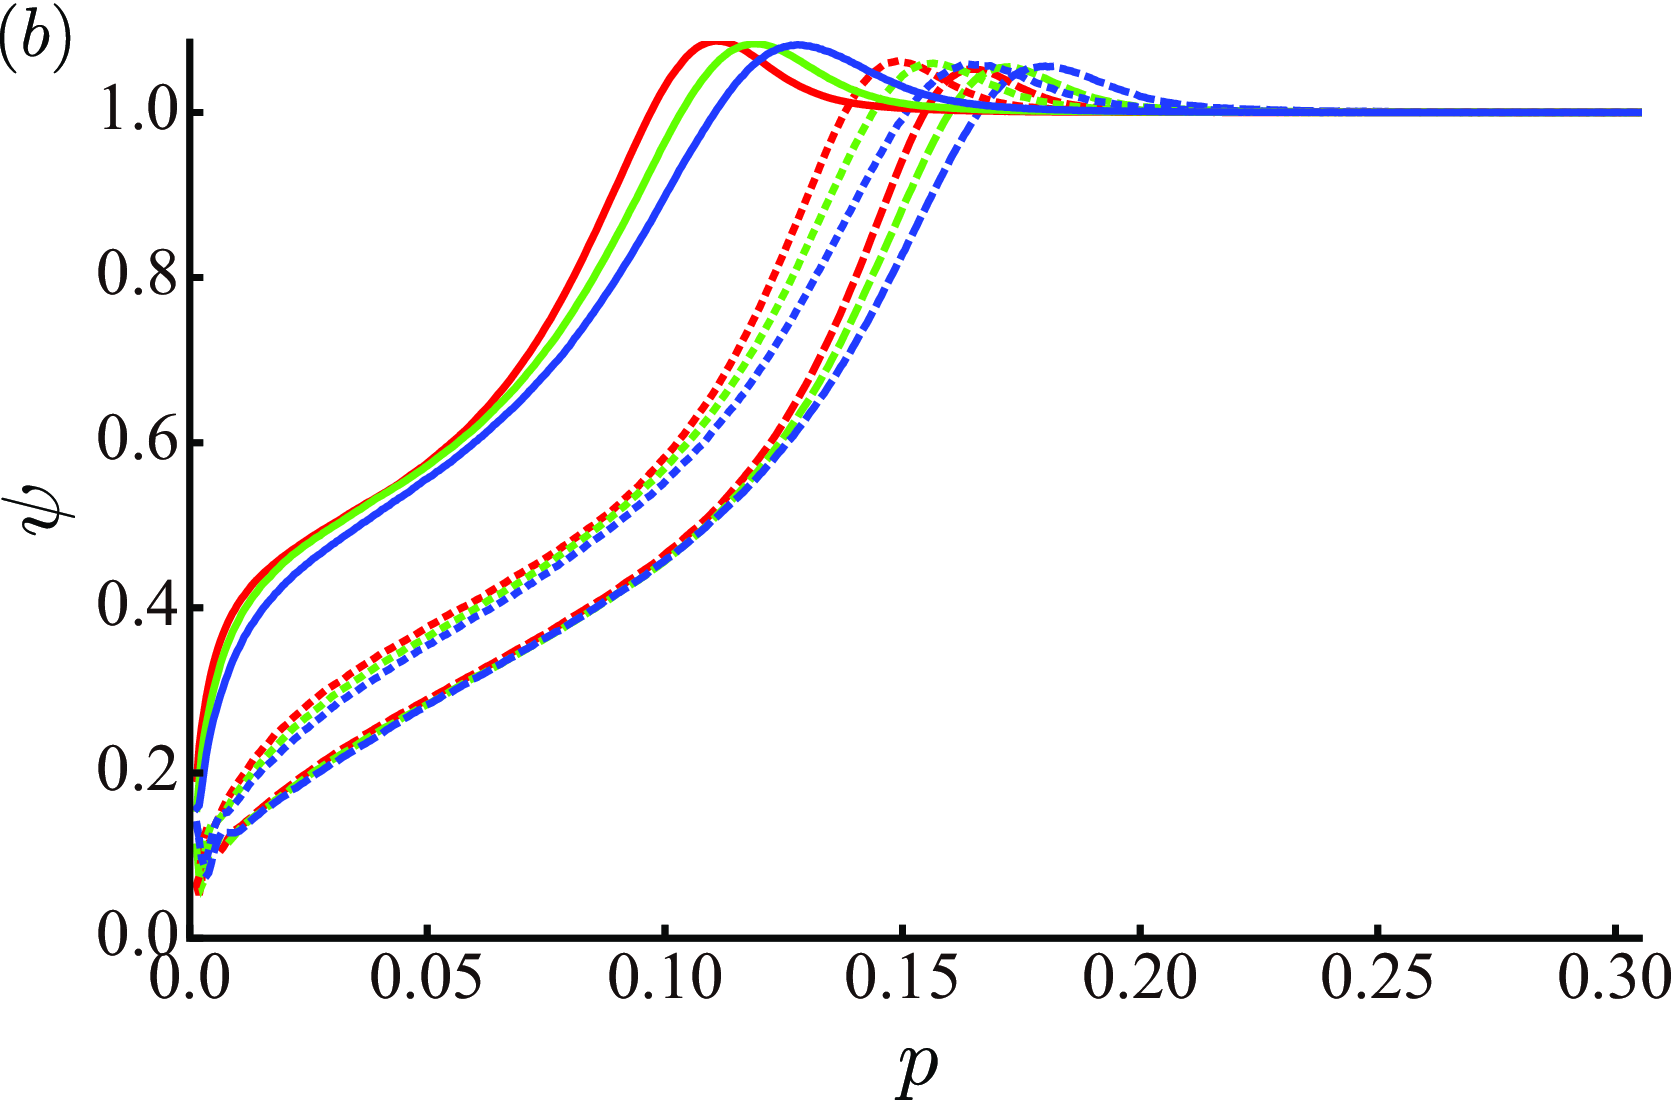
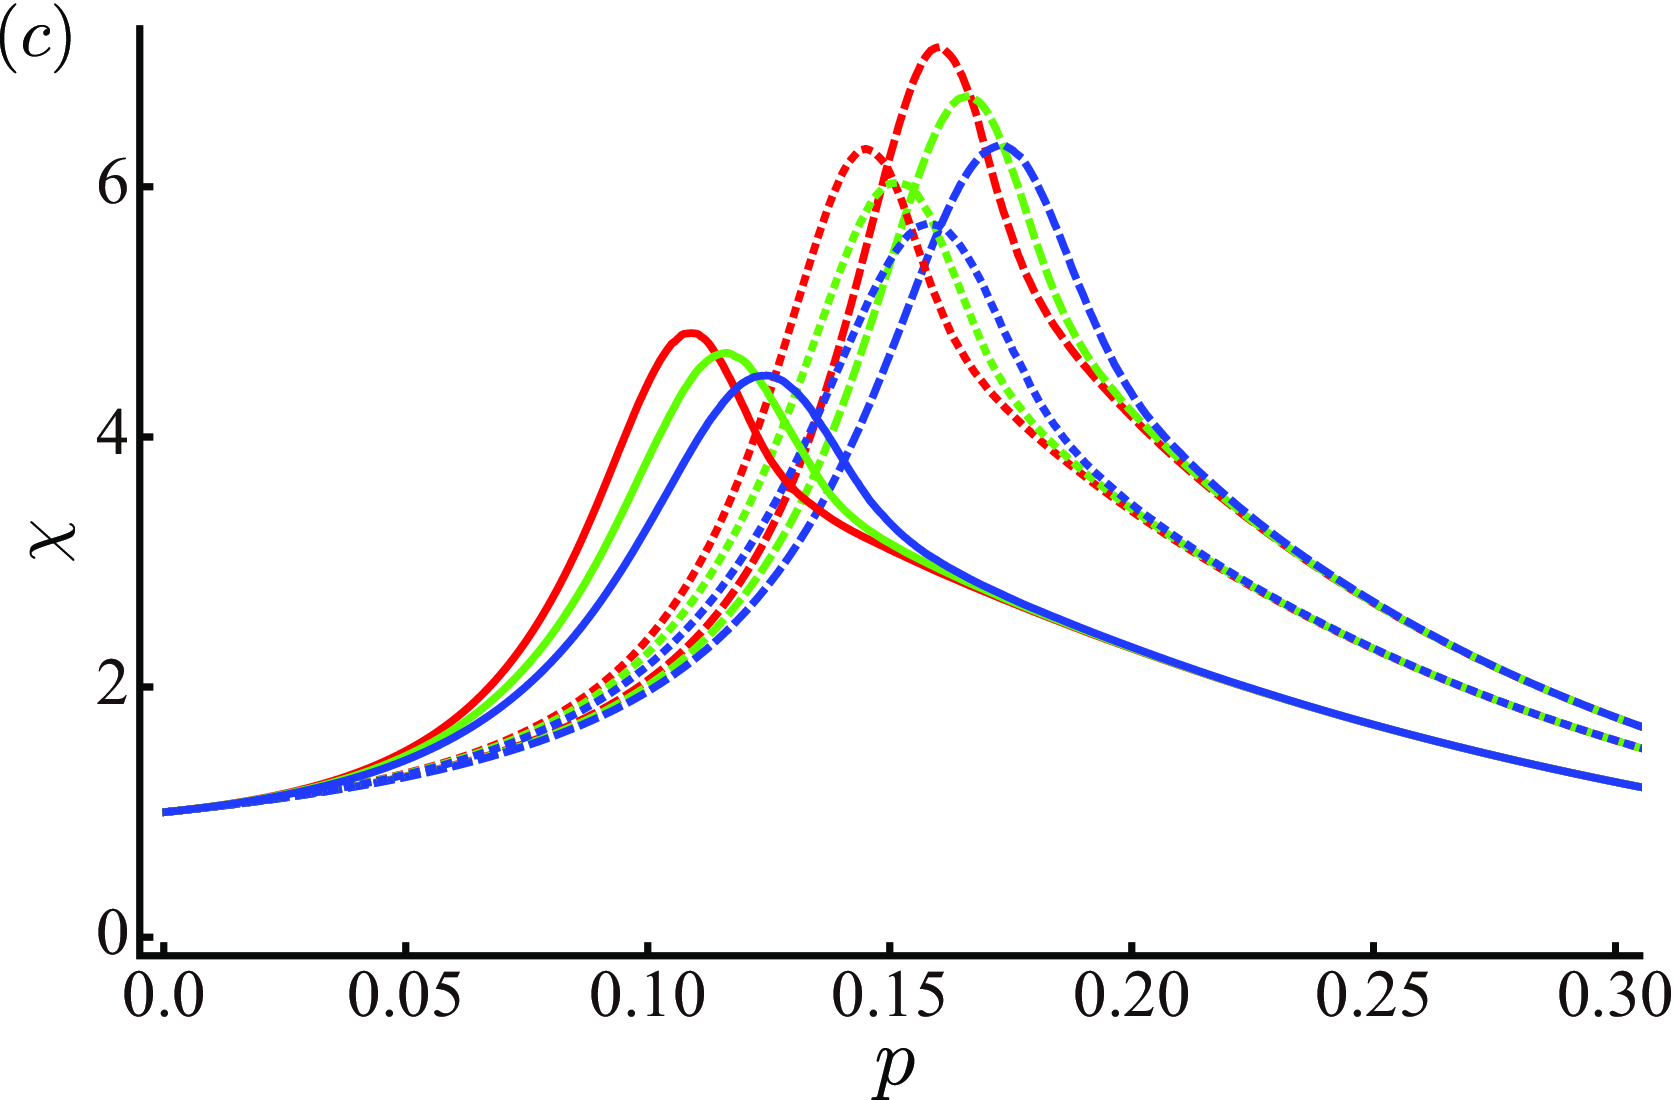
Apparently, the susceptibility apparently has a larger peak when the network is larger (Fig. 14(c)), but it does not diverge in the limit . Analytical results Zalányi et al. (2003) show that the mean cluster size has a finite jump at .
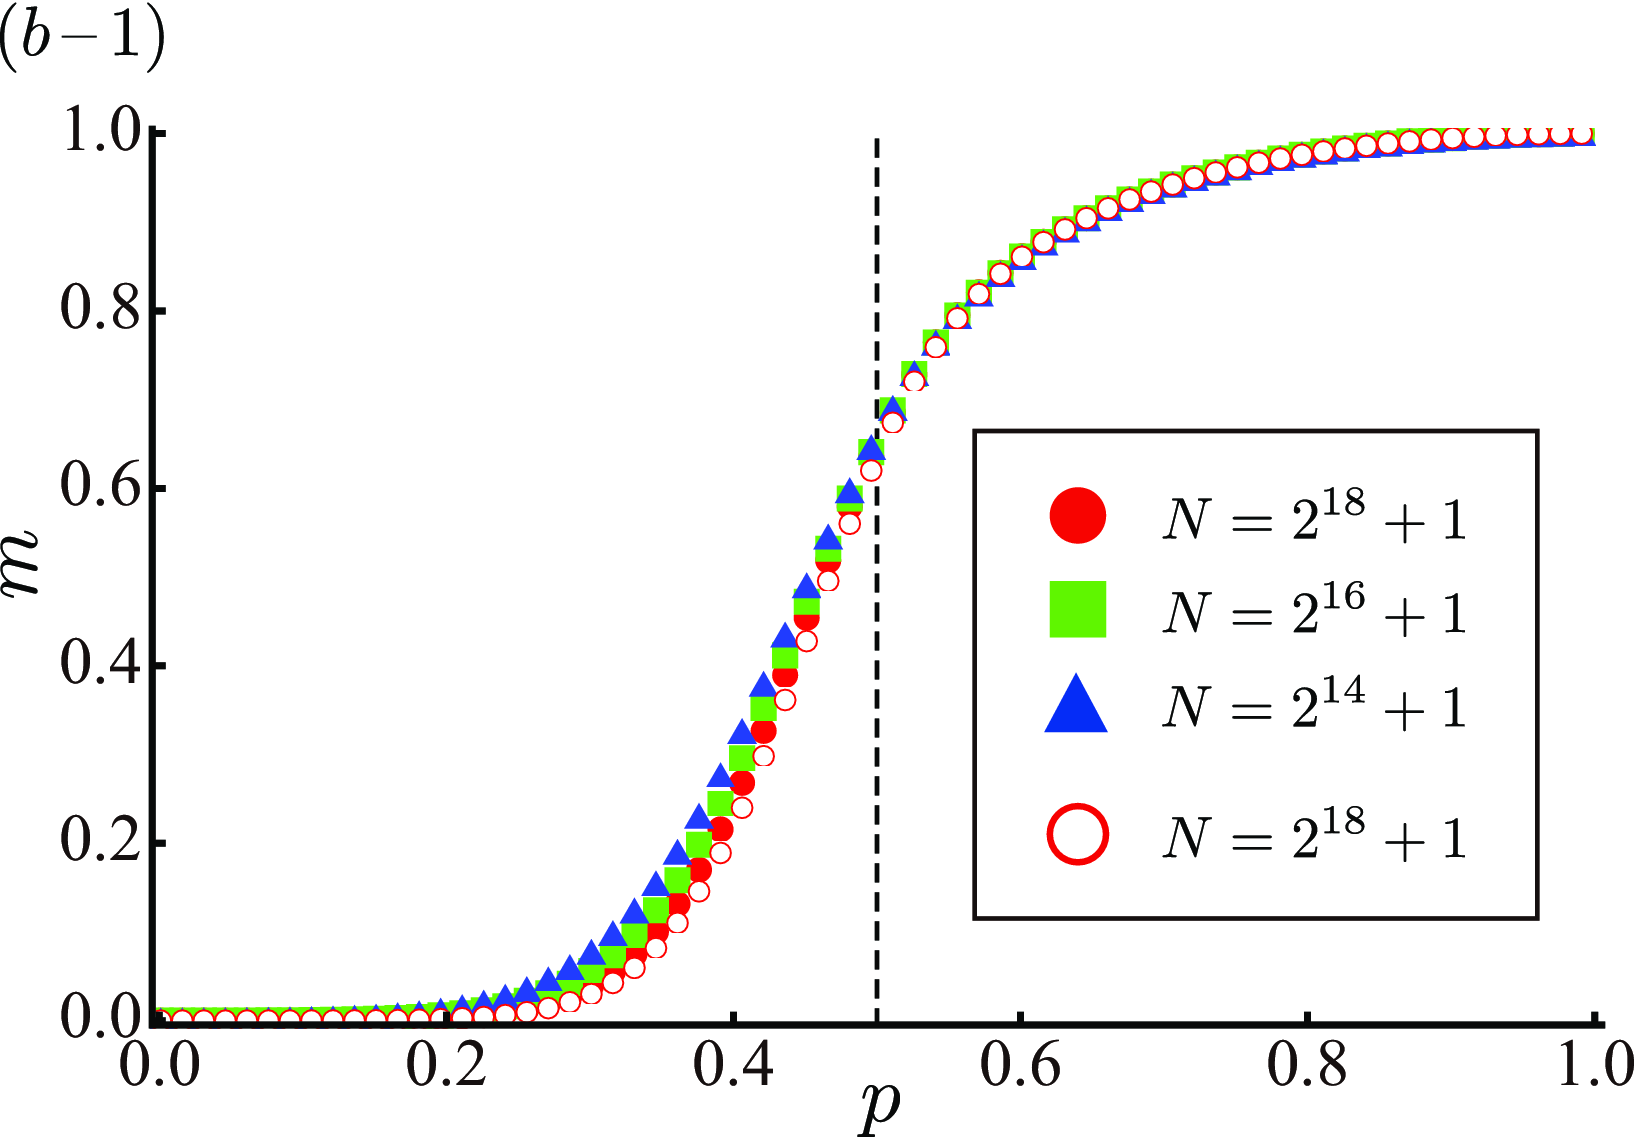
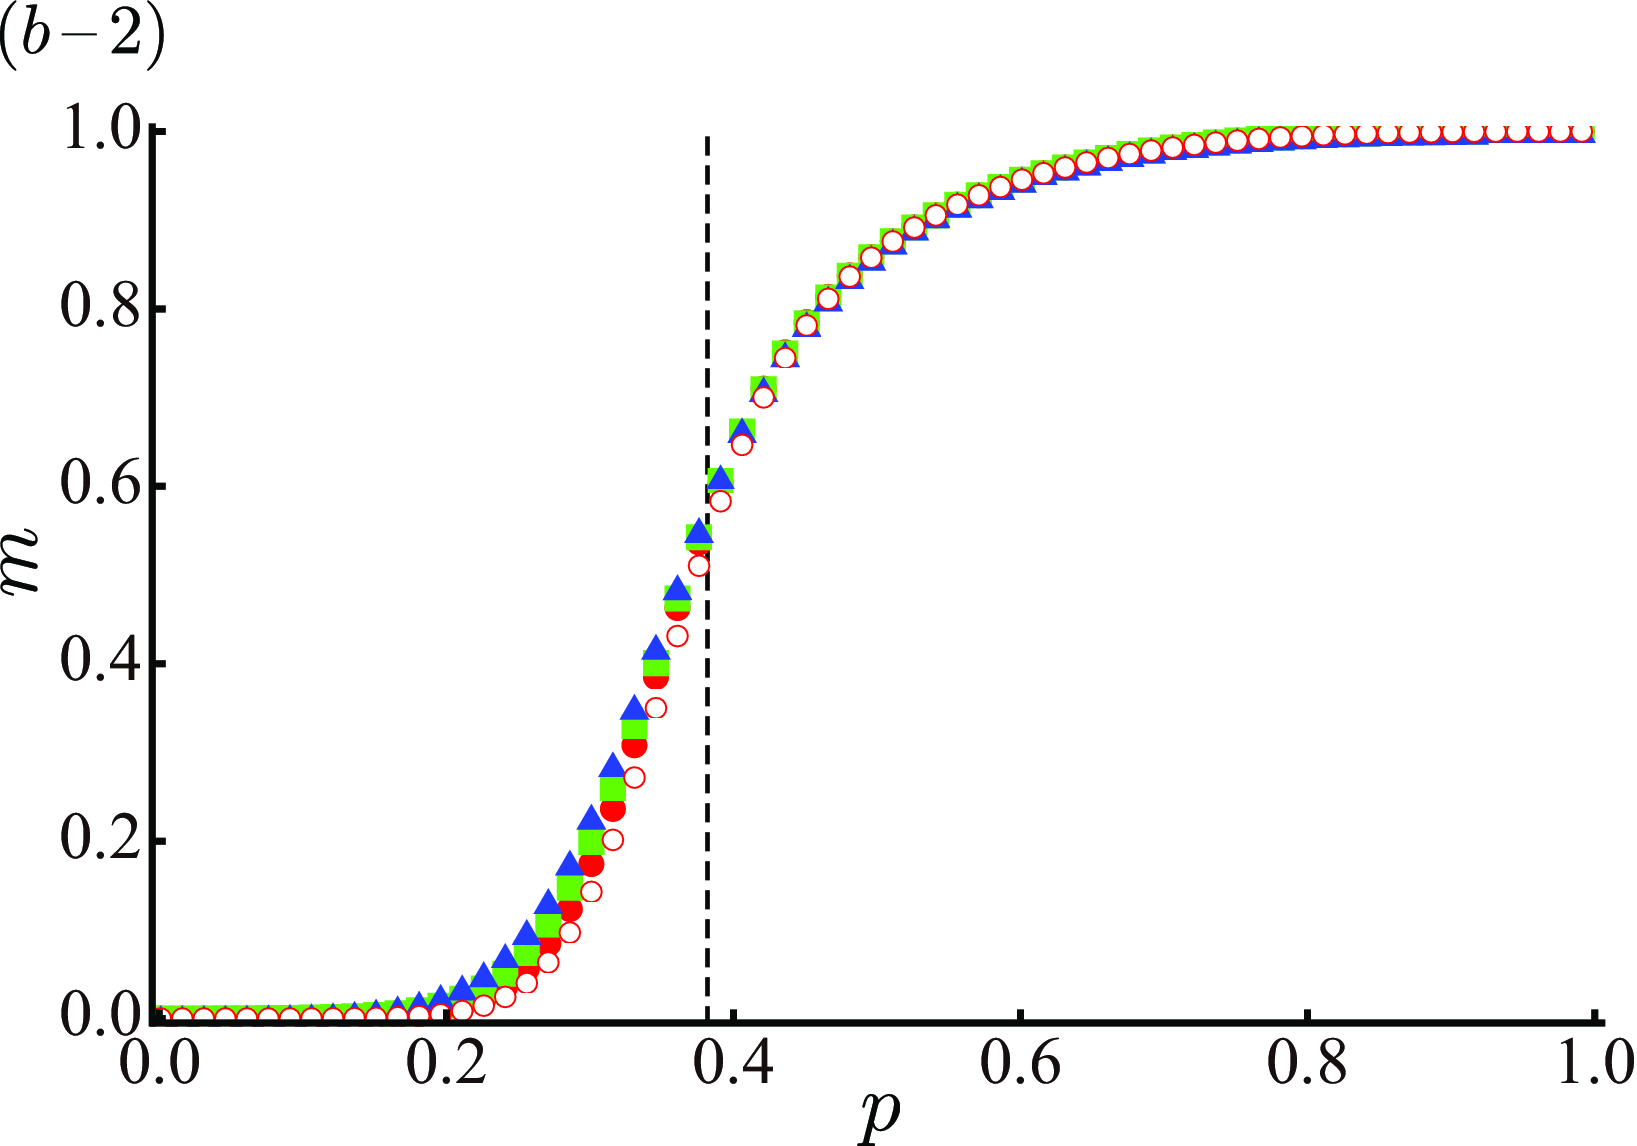
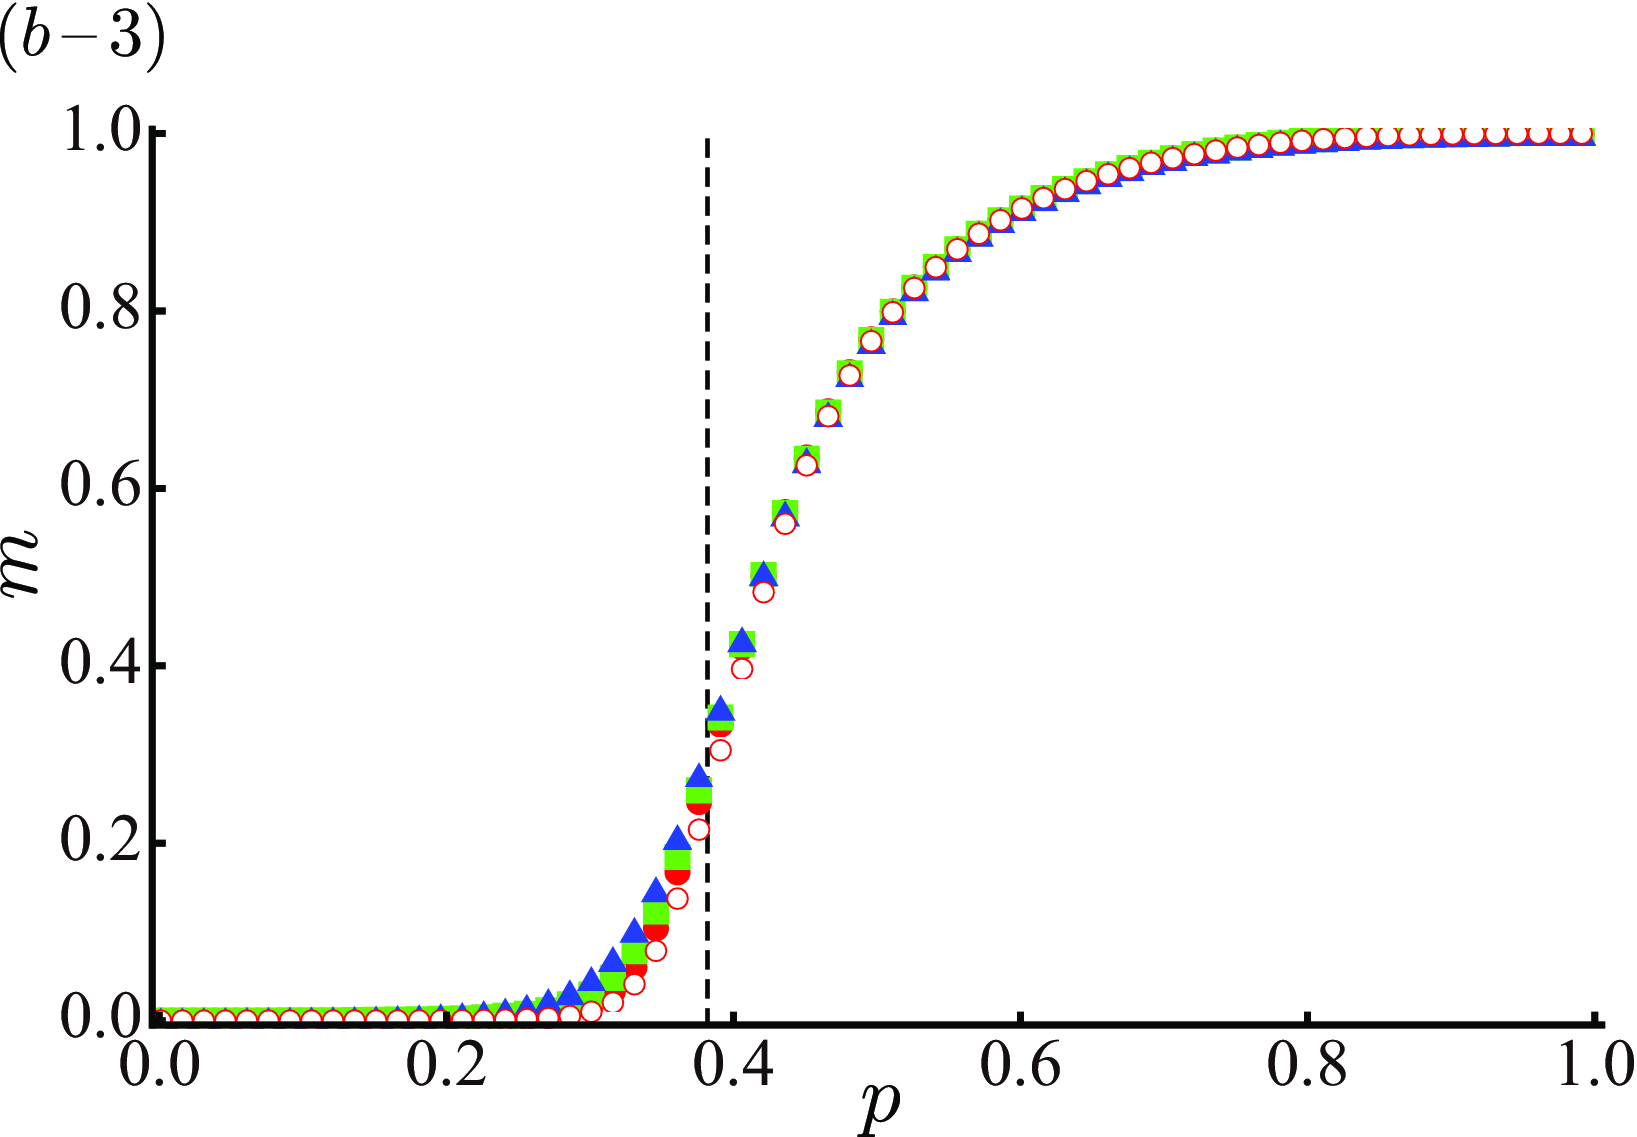
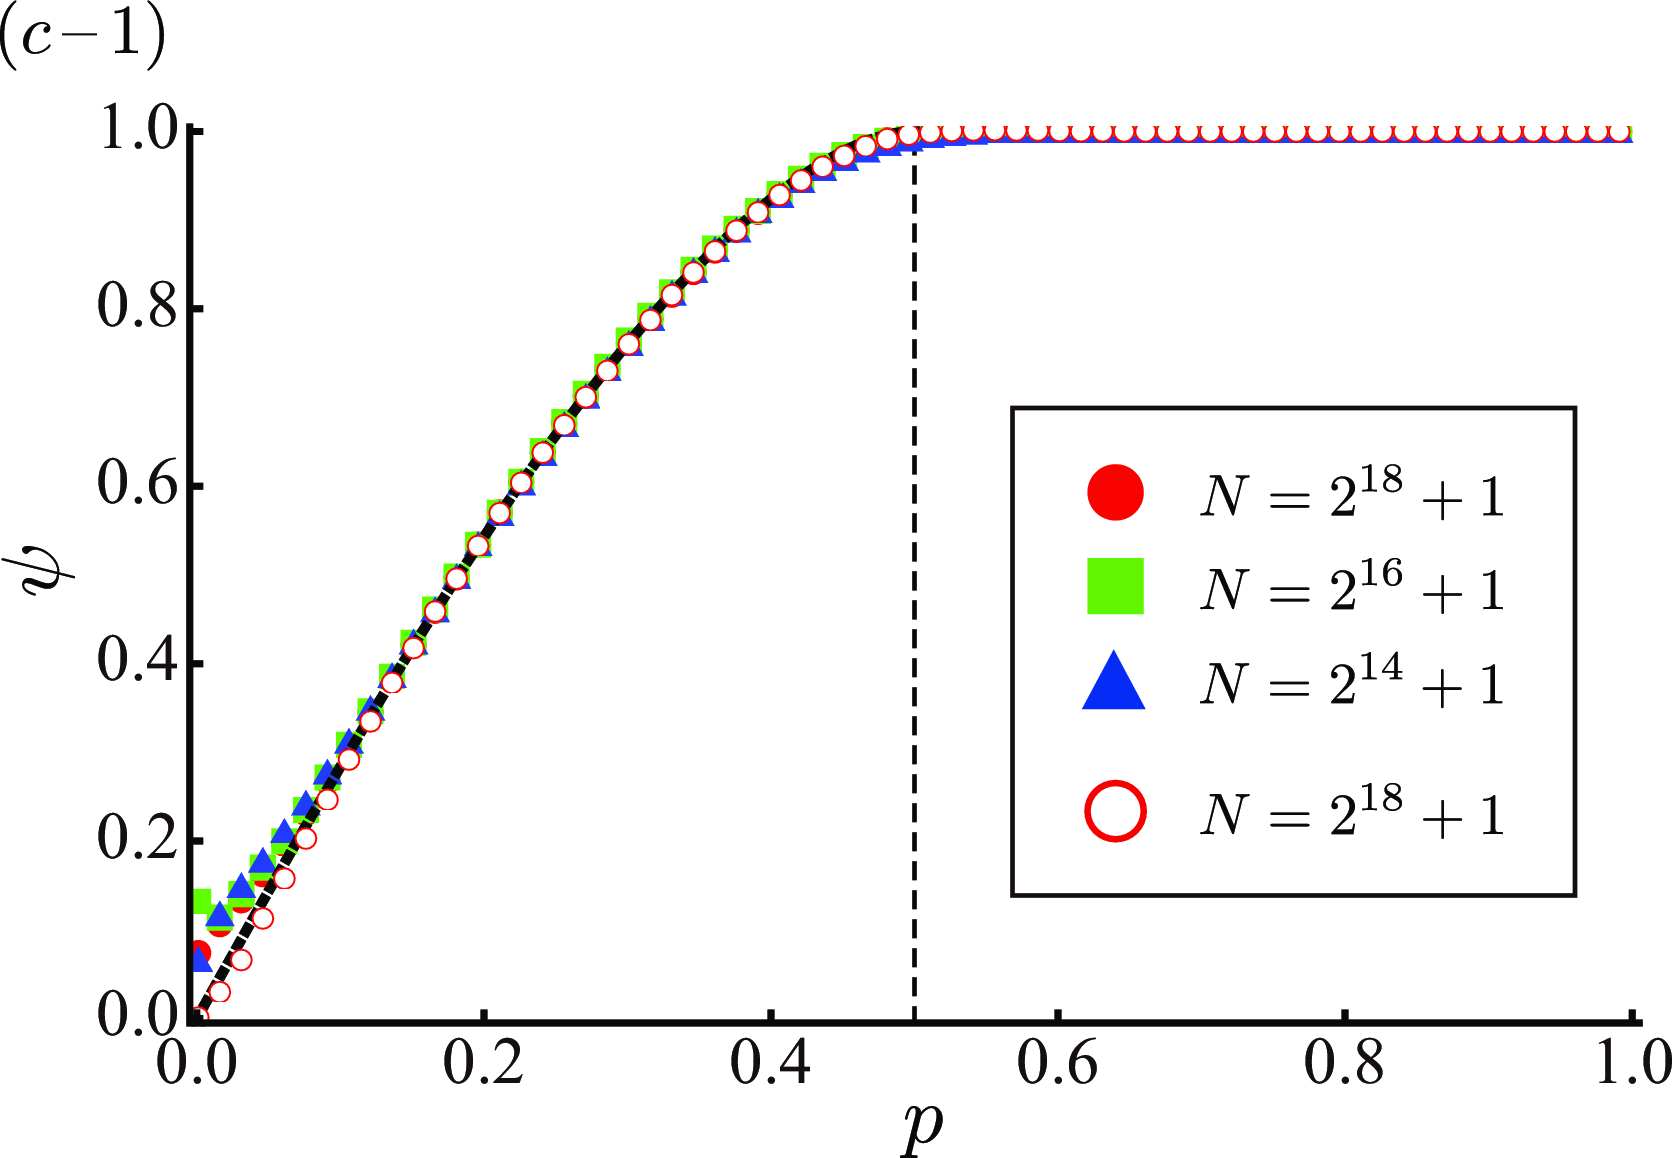
For comparison, we also performed simulations for the configuration model that has the same degree distribution as the -out graph. In this case, the critical phase shrinks to a unique critical point . By using the local tree approximation, we have , and the critical exponents in the mean field universality class, . In Fig. 15, , , and on the configuration model are plotted as a function of . In this model, of various size cross at . Here the largest cluster size, just at the transition point, is of , which is also observed on the Erdös-Rényi model Janson et al. (1993). In the limit , for , which indicates that the transition at is between the nonpercolating phase and the percolating phase. The difference between the -out graph and its randomized version leads us to an interesting question. What is the geometrical origin of the critical phase in complex networks? The present result means that the standard network properties, i.e., the degree distribution, the mean shortest path length, and the clustering coefficient are not the answer because these are essentially the same between the -out graph and the corresponding configuration model. The answer will be proposed in future studies.
In Fig. 16, we show the fractal exponent for GRN with finite . The behavior is same as that of the case without a preferential attachment, except for the value of . As decreases, the fractal exponent approaches one at smaller . As for the case of (the BA model), seems not to converge and to increase with in the whole region of . Similar to the configuration model, may be zero when , although a numerical estimation would be difficult to obtain since is very small (if exists).
IV.2 Deterministically growing networks
The critical phase is understood as a set of fixed points of a renormalization group (RG). Hierarchical networks have a great advantage in analytical treatments because the structural properties of, and cooperative behaviors on, networks can be analyzed from real space RGs. As mentioned before, hierarchical small-world networks (deterministically growing networks) are expected to have only the critical phase and the percolating phase. This is not the case for hierarchical “large-world” networks and also some hierarchical small-world networks, such as the Apollonian network Auto et al. (2008) and the Dorogovtsev-Goltsev-Mendes network Dorogovtsev (2003), which have only the percolating phase due to their strong network heterogeneity. Here, we consider the percolation on the (2,2) flower, also known as the diamond lattice or Migdal-Kadanoff lattice in the field of statistical physics, and the decorated flower, which is generated by adding the shortcuts to the (2,2) flower. The former is a large-world network, whereas the latter a small-world network. In Hasegawa et al. (2010), the authors analyzed these models by using generating functions to obtain the root cluster size and the cluster size distribution. Our results show that the (2,2) flower has nonpercolating and percolating phases, while the decorated flower has critical and percolating phases.


IV.2.1 Construction of flowers
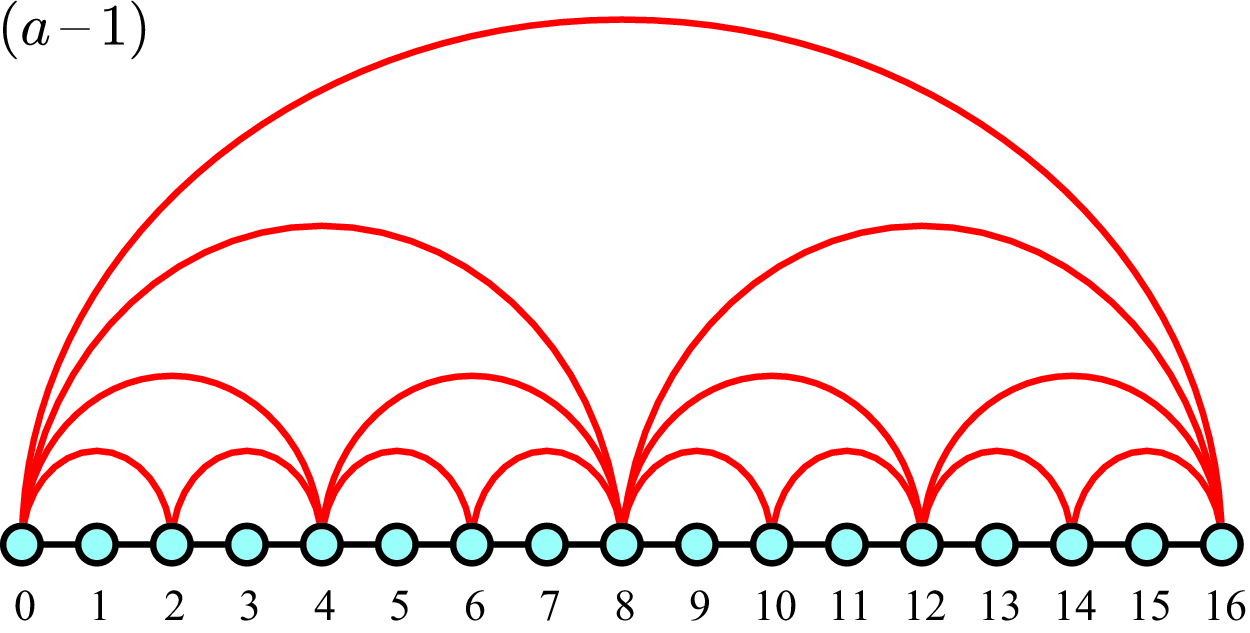
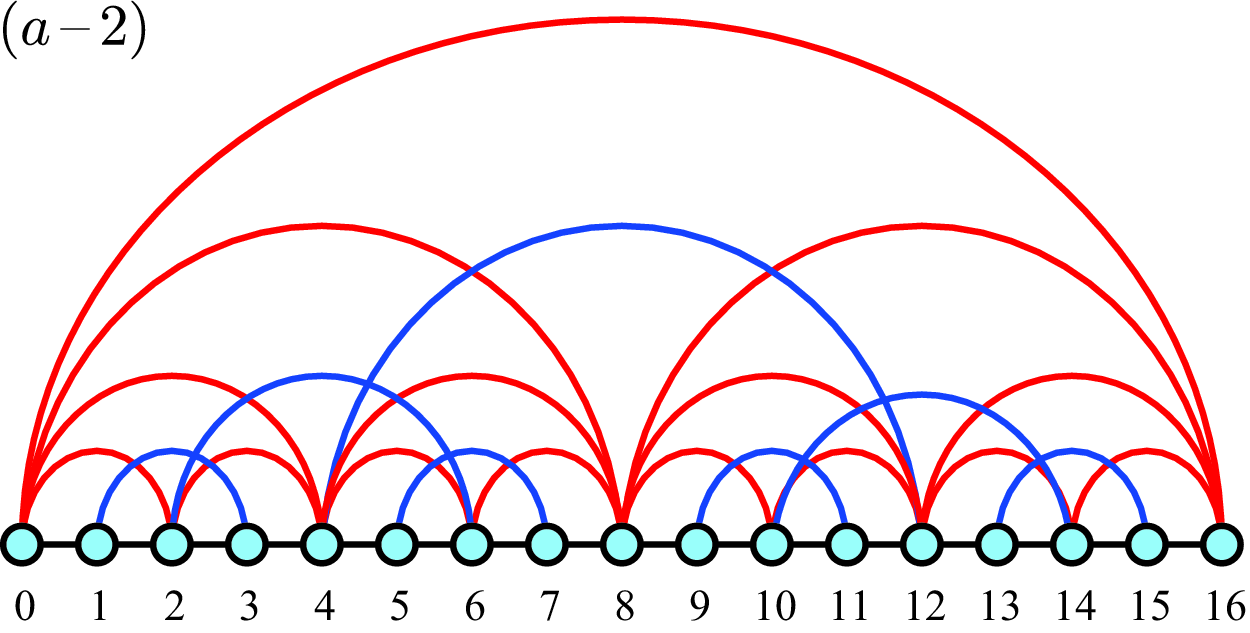
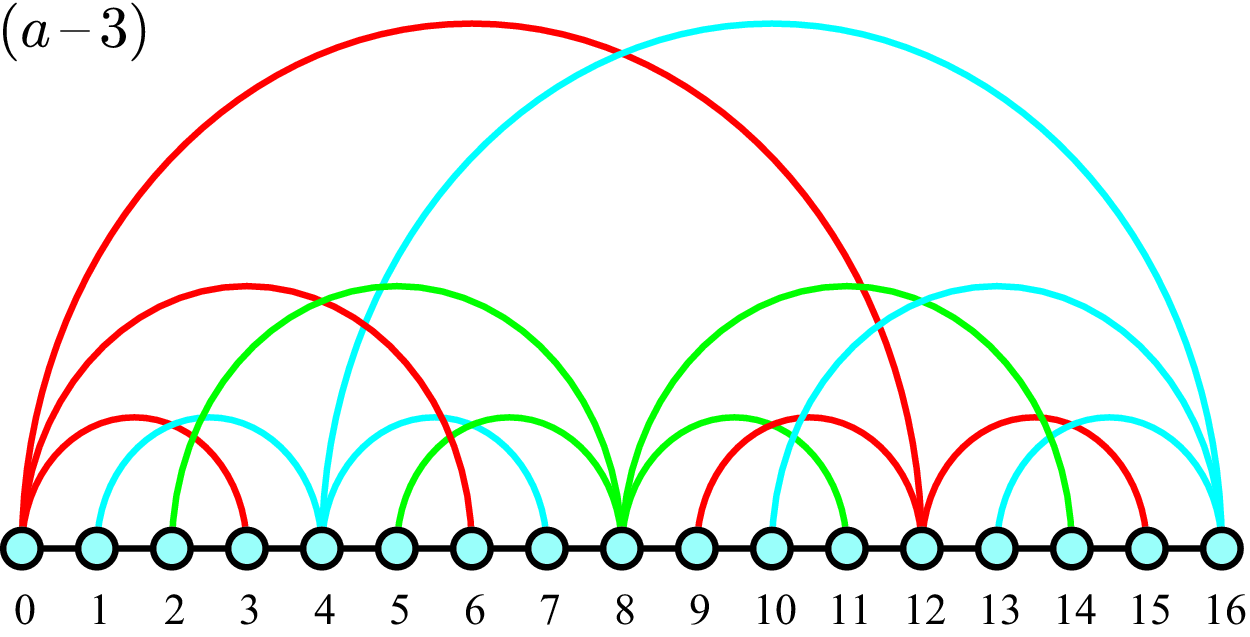
The (2,2) flower with generation , denoted by Fn, is recursively constructed as follows Rozenfeld et al. (2007); Rozenfeld and ben Avraham (2007): At generation , the flower F0 consists of two nodes connected by a bond. We call these nodes the roots. For , Fn is obtained from Fn-1, such that each existing bond in Fn-1 is replaced by two parallel paths consisting of two edges and one node each (Fig. 17(a)). In Fig. 18, we show realizations of Fn with 1, 2, and 3. The network properties of the (2,2) flower are given in Rozenfeld et al. (2007); Rozenfeld and ben Avraham (2007): (i) the number of nodes of Fn, , is , (ii) the number of edges is , (iii) the degree distribution is , (iv) the clustering coefficient is zero, and (v) the network is not small-world because the diameter of Fn is as , which increases as a power of like the finite-dimensional Euclidean lattice. A hierarchical small-world network, which we call the decorated flower , is achieved by adding some long-range bonds to Fn, as shown in Fig. 18. The decorated flower is also regarded as a deterministically growing network: the network starts from single bond between two nodes at time (= generations) , and grows with time such that every edge in at time adds two new nodes, which link to both end nodes of the edge, to create . The decorated flower has both the small-world property and a high clustering coefficient , while also keeping a power-law degree distribution Rozenfeld et al. (2007); Hinczewski and Berker (2006).
IV.2.2 RG analysis
We consider bond percolation on , with open bond probability of the “short-range” bonds constituting Fn and that of the “long-range” bonds , being given independently. The cases of and correspond to the uniform bond percolation on Fn and , respectively.
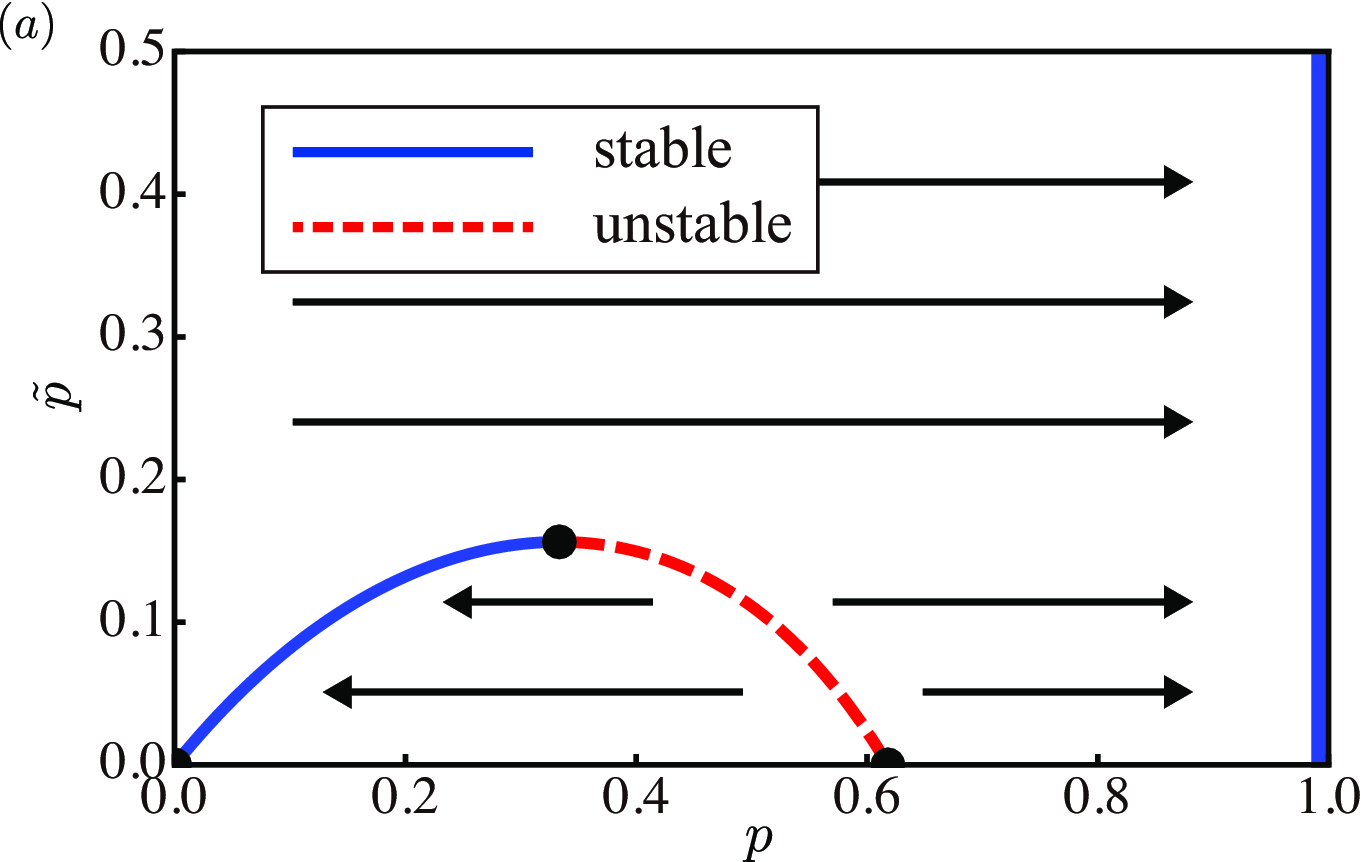
The phase diagram is given by the RG technique Rozenfeld and ben Avraham (2007); Berker et al. (2009); Hasegawa et al. (2010). We denote by the open bond probability of the short-range bonds after renormalizations. The recursion relation for is obtained by replacing each unit of the flower by a renormalized short-range bond (Fig. 17(b)) as
| (38) |
Here, the initial condition is . Note that probability for long-range bonds is not renormalized. This recursion equation has trivial stable fixed points at for arbitrary and . The region where flow converges onto a fixed point at and corresponds to the percolating phase and the nonpercolating phase, respectively. Other nontrivial fixed points, , are given from the solution of
| (39) |
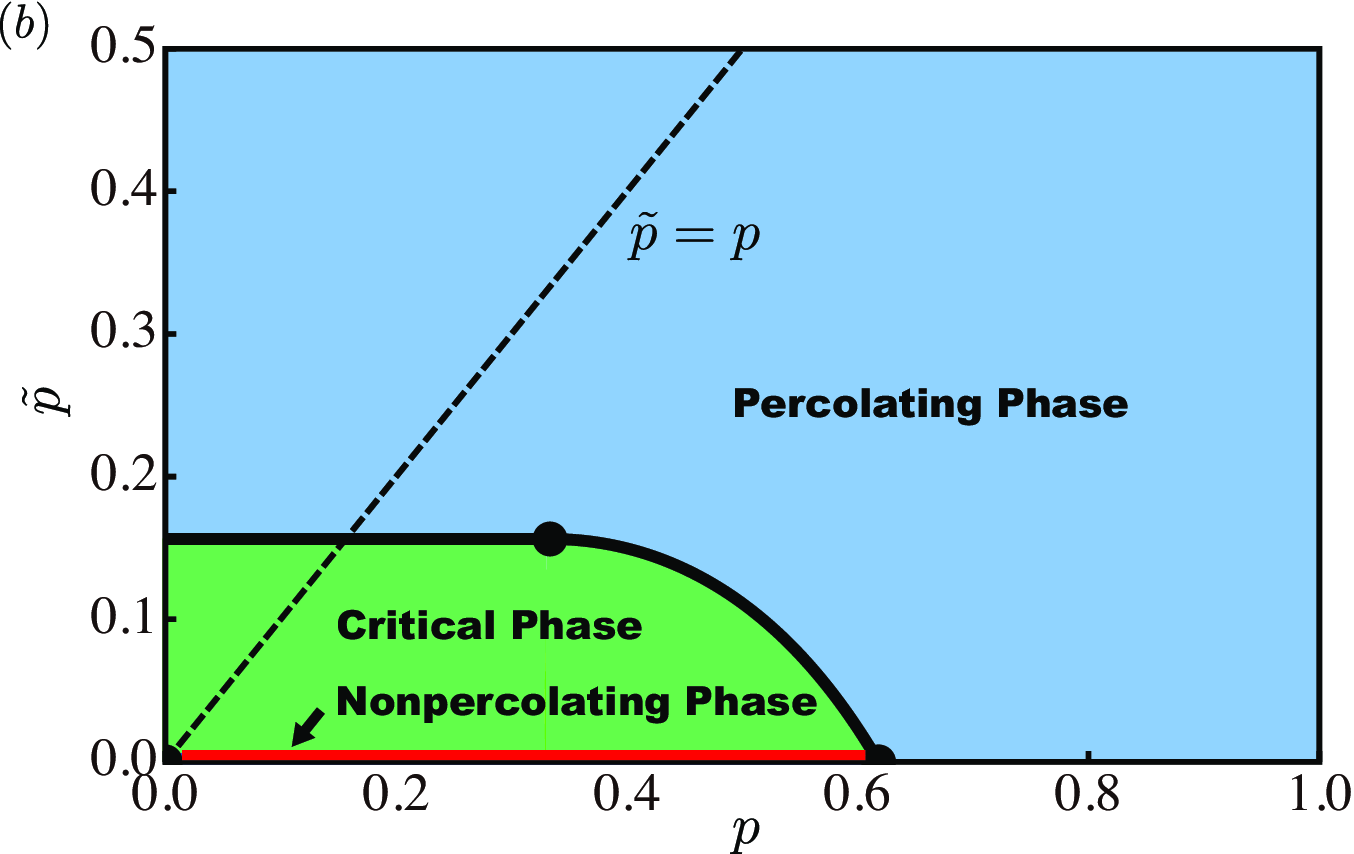
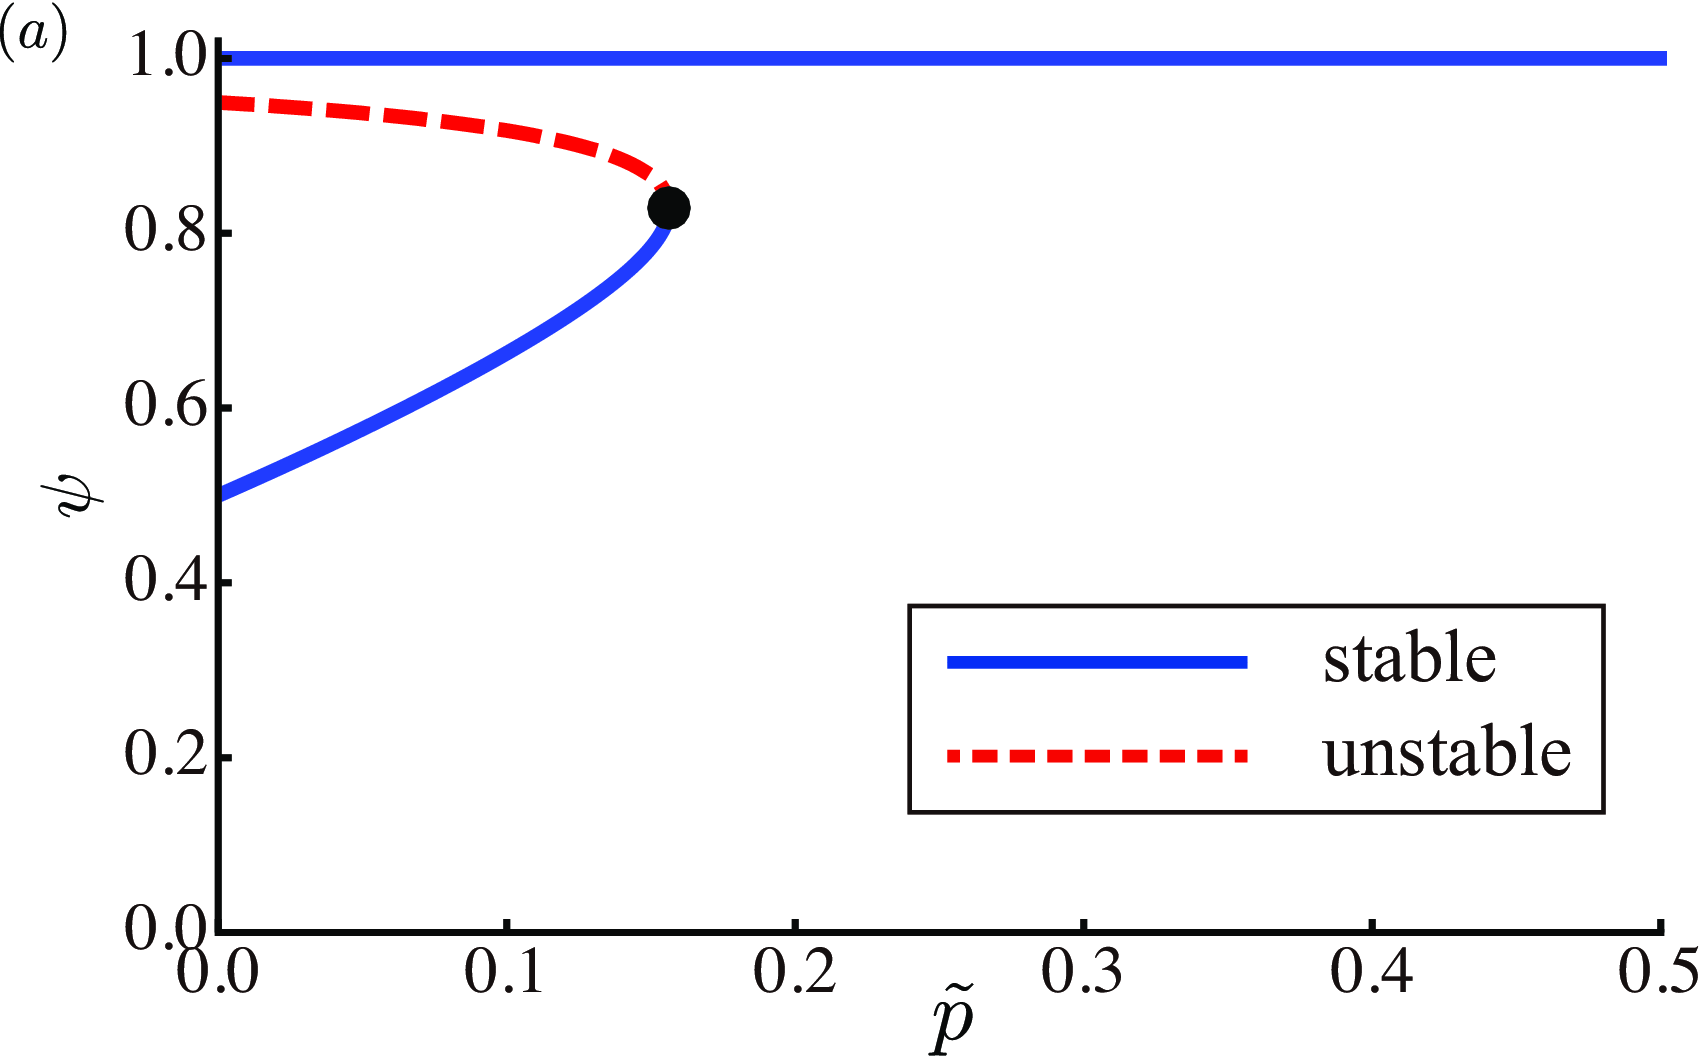
For a fixed in , there is one stable point and one unstable fixed point . RG flow starting at goes to , and thus this region is regarded as the critical phase. The region for , where flow goes to , corresponds to the percolating phase. Thus the curve gives the phase boundary. Two fixed lines of and terminate at . Then, the line from to at also gives the phase boundary. For there is only one stable fixed point at , so that the system is always percolating. In Fig. 19, we show the RG flow diagram and the phase diagram. The case of indicates that bond percolation on has the nonpercolating phase for and the percolating phase for , while the case of indicates that bond percolation on has the critical phase for and the percolating phase for , but no nonpercolating phase, i.e., .
Next, we utilize generating functions to calculate the fractal exponent of the root cluster. The details of the technique are given in Hasegawa et al. (2010) and we can obtain the recursion relations of the mean fraction of the clusters, including two roots, , and including either of the roots, , as
| (40) |
Since the fixed points satisfy Eq. (39), the recursion relation (40) is then reduced to
| (41) |
where . By using the largest eigenvalue of this matrix,
| (42) |
we can calculate the fractal exponent on the fixed points:
| (43) |
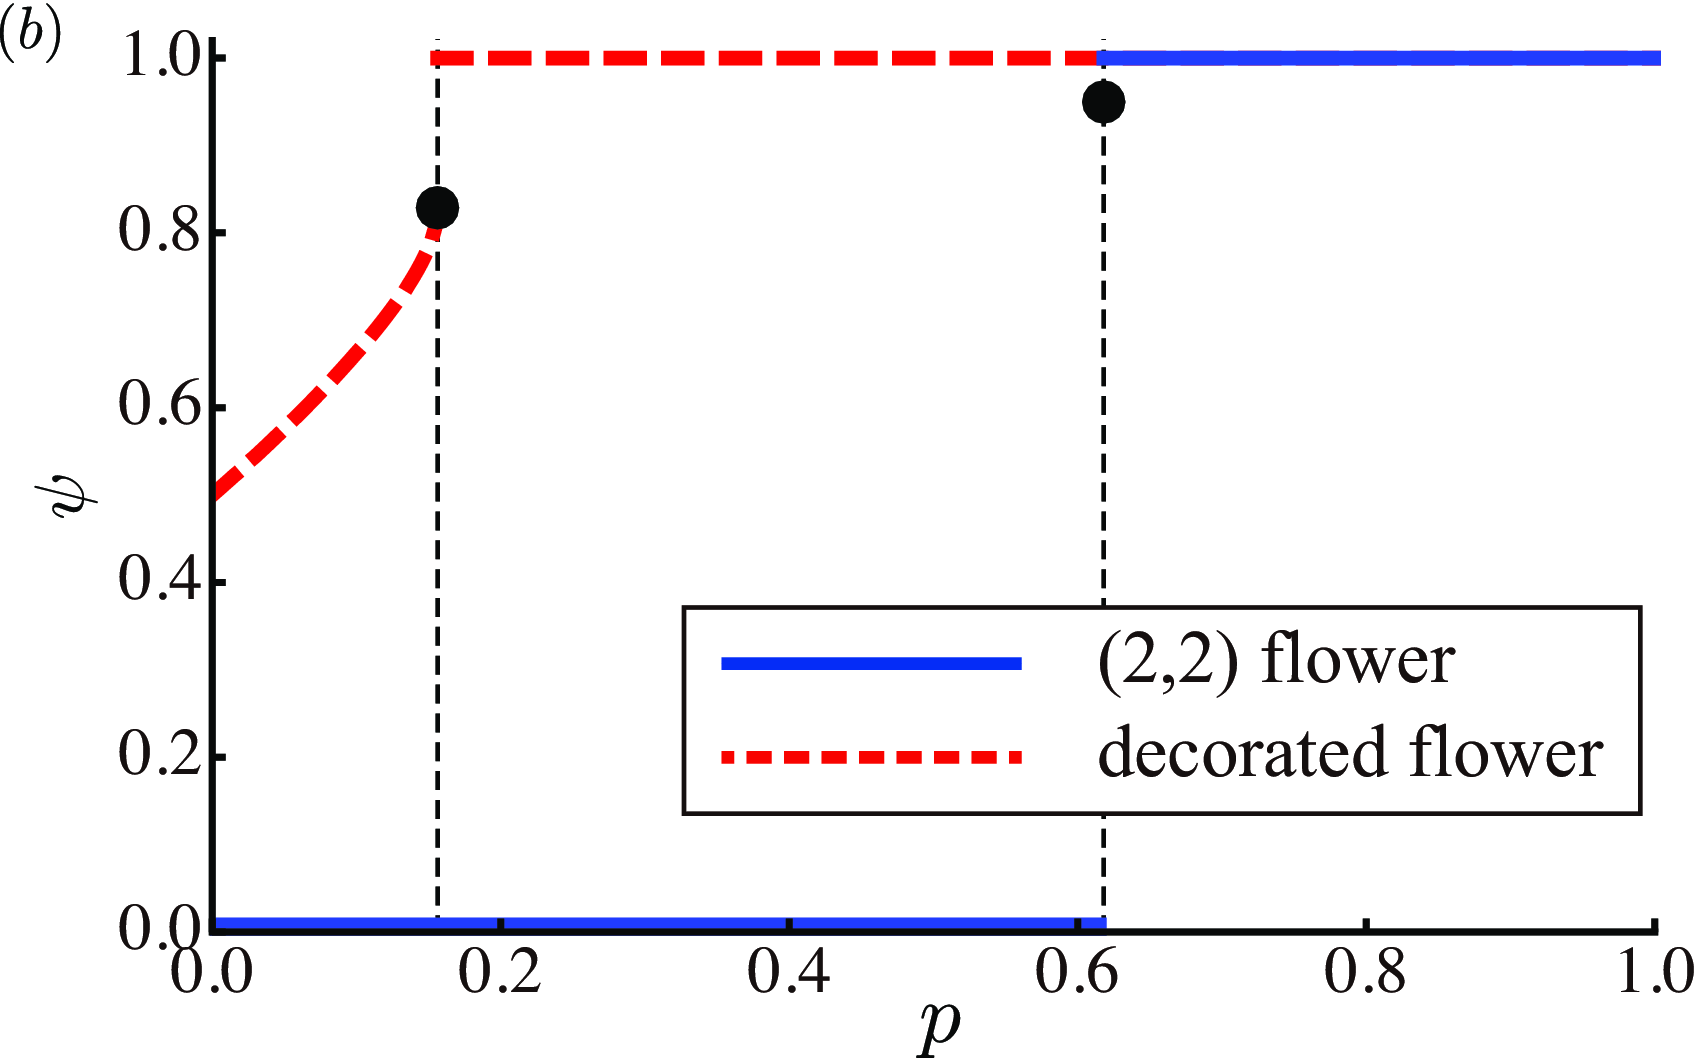
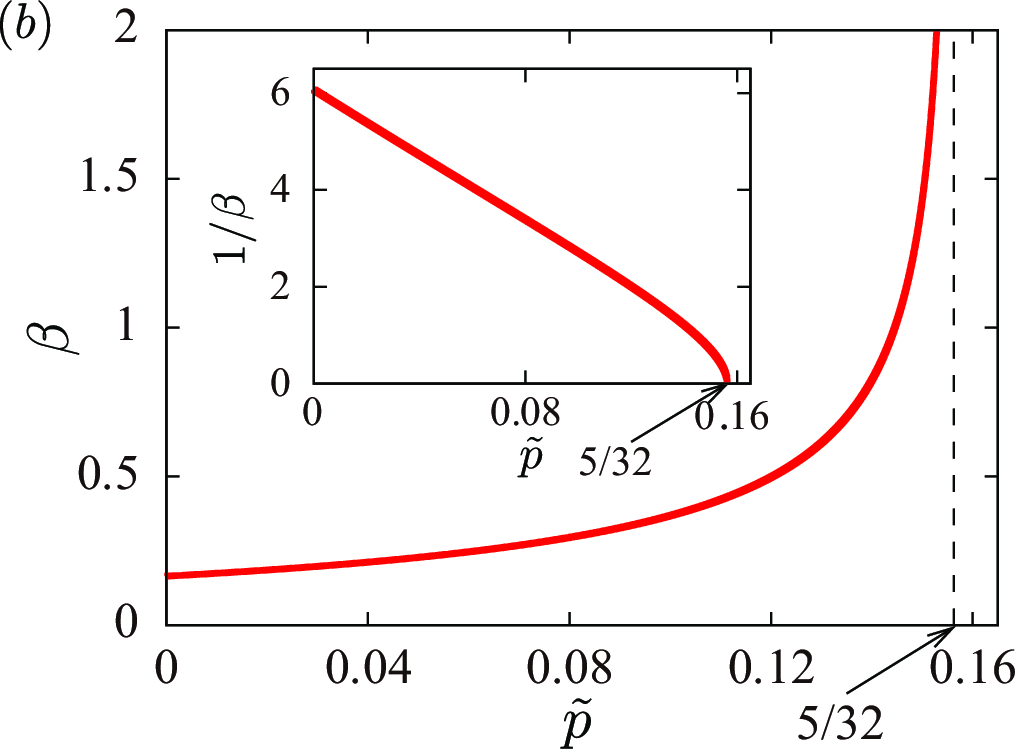
Equation (43) tells us the -dependence of (Fig. 20(a)): (i) for , on the (un)stable fixed points increases (decreases) with increasing , and (ii) for , is equal to one regardless of or . The open bond probability of the long-range bonds essentially determines the degree of the criticality of the system in the critical phase. In Fig. 20(b), we show the fractal exponent on Fn () and (). For the (2,2) flower, is a step function: for , at , and for . For the decorated flower, increases continuously from at to at , and then jumps to unity.
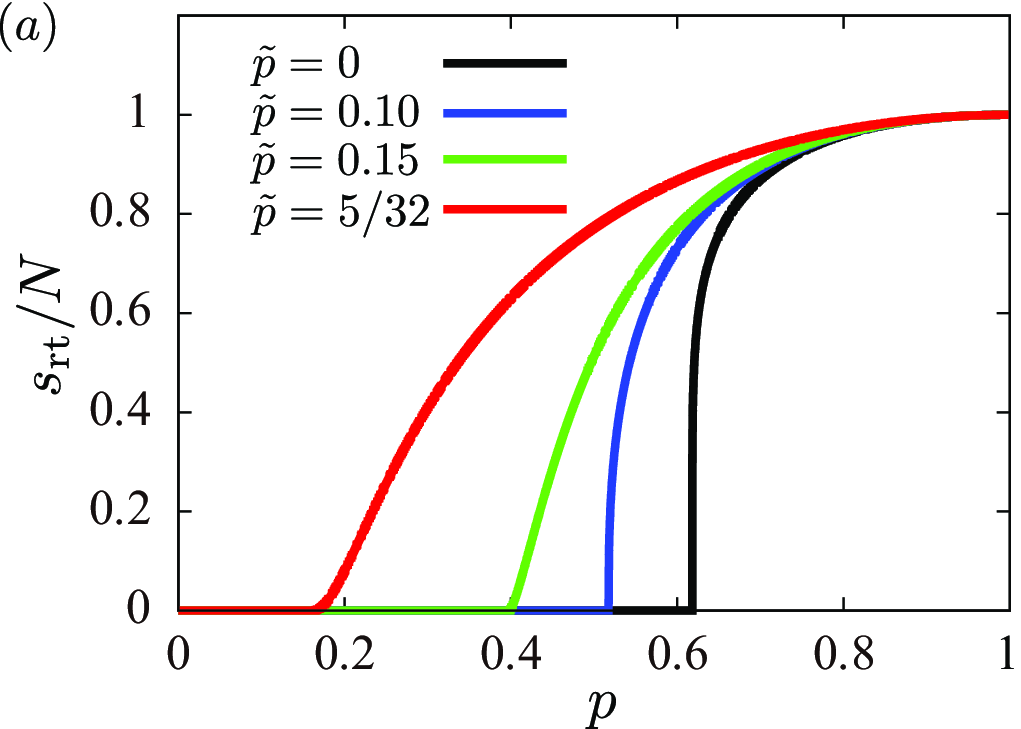
We numerically iterate the generating functions defined in Hasegawa et al. (2010) to obtain the order parameter on with arbitrary combination of and . The result for is shown in Fig. 21(a). The initial growth of the order parameter becomes moderate with increasing . To examine the critical exponent of the order parameter on the phase boundary , we follow the scaling argument in Rozenfeld and ben Avraham (2007) to obtain
| (44) |
where
| (45) |
Figure 21(b) shows the -dependence of . We find that increases continuously with , from at to at . A plausible discussion gives us that the order parameter at indeed follows Eq.(33), i.e., an essential singularity in the order parameter Hasegawa et al. (2010).
In Hasegawa et al. (2010), the authors also numerically evaluate the generating functions to obtain the cluster size distribution on . The result shows that our finite-size scaling for is indeed well fitted on both stable and unstable fixed points. The scaling also works at any in the critical phase, but the convergence is not as rapid as that on the fixed points.
IV.2.3 Remarks on other hierarchical small-world networks
The critical phase appears in other hierarchical small-world networks. Boettcher and his collaborators studied bond percolation on some hierarchical small-world networks, i.e., a hierarchical small-world network with one-dimensional backbone (HSWN) Boettcher et al. (2012) (also known as the Farey graph Zhang and Comellas (2011)), HN5 Boettcher et al. (2009), and HN-NP Boettcher et al. (2009), by RG analysis to discover a critical phase (called “patchy” phase in Boettcher et al. (2009)). In Fig. 22, we show our Monte Carlo results of the order parameter and the fractal exponent for these models. In Boettcher et al. (2012), Boettcher et al. analytically obtained of HSWN as
| (46) |
implying that and . This analytical result corresponds to the numerical results of both and . Boettcher et al. also showed from the RG flow that HN5 has only the critical phase and the percolating phase, and Boettcher et al. (2009). This result is reasonable because HN5 contains HSWN, as a subgraph. Our numerical result in Fig. 22 shows that the fractal exponents of HN5 is always equal or larger than that of HSWN, and approaches continuously unity as approaches . The RG scheme of HN-NP is more complicated than that of HSWN and HN5. In Hasegawa and Nogawa (2013), the authors derived the lower bound of the fractal exponent by considering a subtree of the HN-NP as,
| (47) |
meaning . Our numerical result indicates and , where the latter value was obtained from the RG analysis Boettcher et al. (2009). The phase diagram ( ) of these networks is similar as that of other growing networks discussed in this sections. However, we should note that the type of the transition at is quite different: for these networks, the transition at is not inverted BKT one, but probably is discontinuous one. At least, this is confirmed carefully for HSWN Boettcher et al. (2012), although it is tedious to get an evidence from finite size simulations. The relation between the continuity/discontinuity of the order parameter the and discontinuity/continuity of the fractal exponent was argued in our recent manuscript Nogawa and Hasegawa (2013), although its theory is still limited.
IV.3 Finite-size scaling for complex networks
Finite-size scaling is a powerful tool for extracting transition points, as well as their critical exponents, from numerical data obtained from simulations of various sizes. In fact, it is very successful in analyzing phase transitions of some static networks such as the configuration model Hong et al. (2007). In the case of exhibiting critical phase such as in growing networks, however, we are faced with the following two difficulties in the estimation of the transition point from their critical behaviors. First, as aforementioned in Sec. III.1.2, only the data for should be used to perform scaling analysis, and the data for are useless. Secondly, the singularity at is often infinitely weak (Eq. (33)), for which the standard scaling theory based on power-law behaviors does not work. To overcome this difficulty, the authors proposed a novel finite-size scaling method described in terms of the network size and the fractal exponent Hasegawa et al. (2013). Our finite-size scaling analysis works well for both inverted BKT and second order transitions in network systems.
Let us derive a scaling form with and for with a heuristic method. We consider the -dependence of at slightly larger than by assuming the existence of a crossover size , which diverges as approaches . For , the system behaves as if it were critical even for , so that , where is the fractal exponent at . For , on the other hand, we observe that the behavior is essentially same as that in the thermodynamic limit, i.e., . By connecting these two limits at , we expect to satisfy
| (48) |
and the finite-size scaling form for to satisfy
| (49) |
where is a scaling function satisfying
| (50) |
Or equivalently,
| (51) |
where
| (52) |
The derivative of Eq. (51) with respect to gives us the scaling form for :
| (53) |
where
| (54) |
Similarly, the finite-size scaling form for the susceptibility (as well as the mean cluster size ) can be assumed to be
| (55) |
where
| (56) |
is the fractal exponent of the mean cluster size at , defined as and is related to as (see Sec. III.2).
In the case of a second order transition, the order parameter behaves as for (). Then, the finite-size scaling forms for , , and are
| (57) |
| (58) |
and
| (59) |
respectively.
In the case of an inverted BKT transition, follows Eq. (33). Then, we obtain the scaling form for and by substituting Eq. (48) into Eqs. (49) and (53) as
| (60) |
and
| (61) |
respectively.
Note that the present scaling form includes the conventional finite-size scaling. For -dimensional lattice systems, the fractal exponent satisfies , so that Eq. (49) reduces to the conventional scaling for provided that , where is the linear dimension, and is the critical exponent of the correlation length .

IV.3.1 Example: the decorated flower
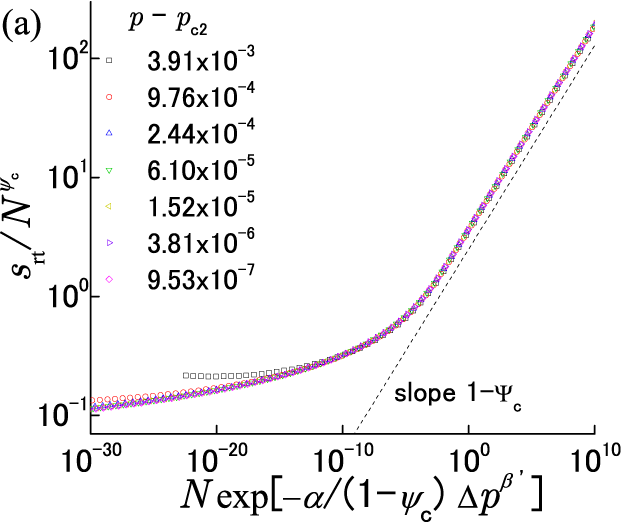
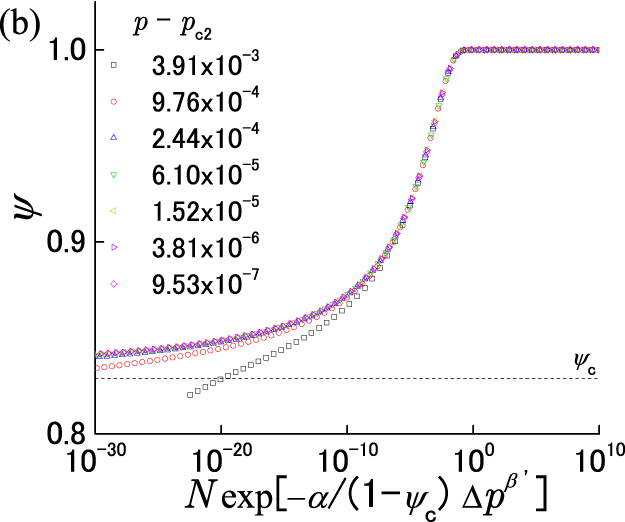
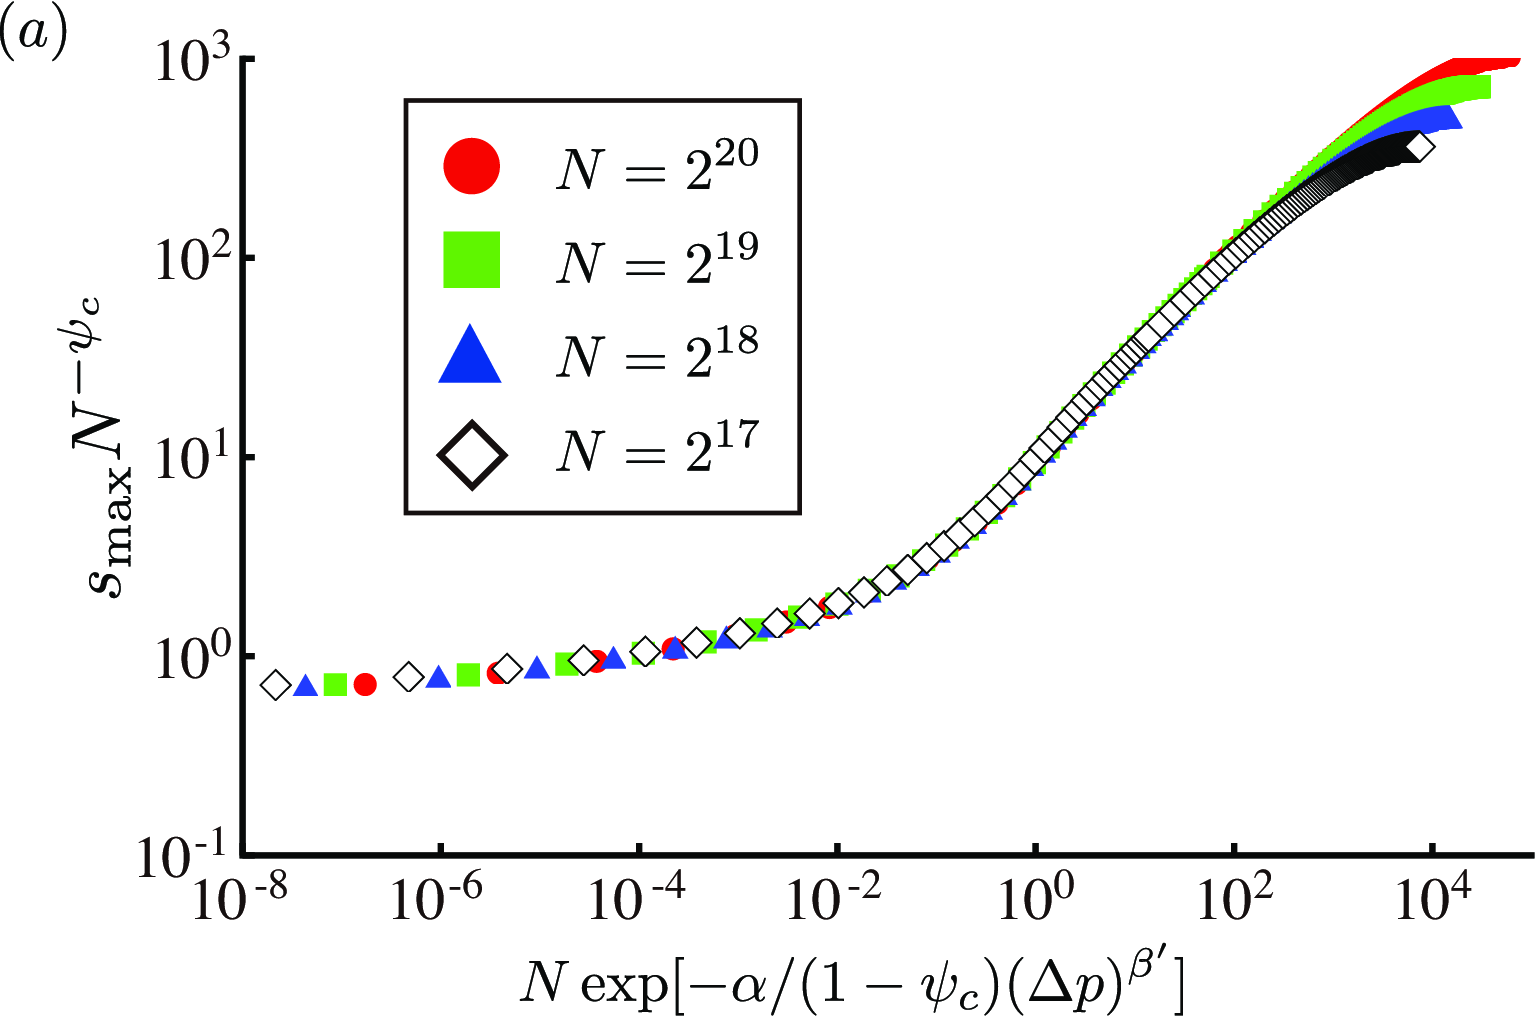
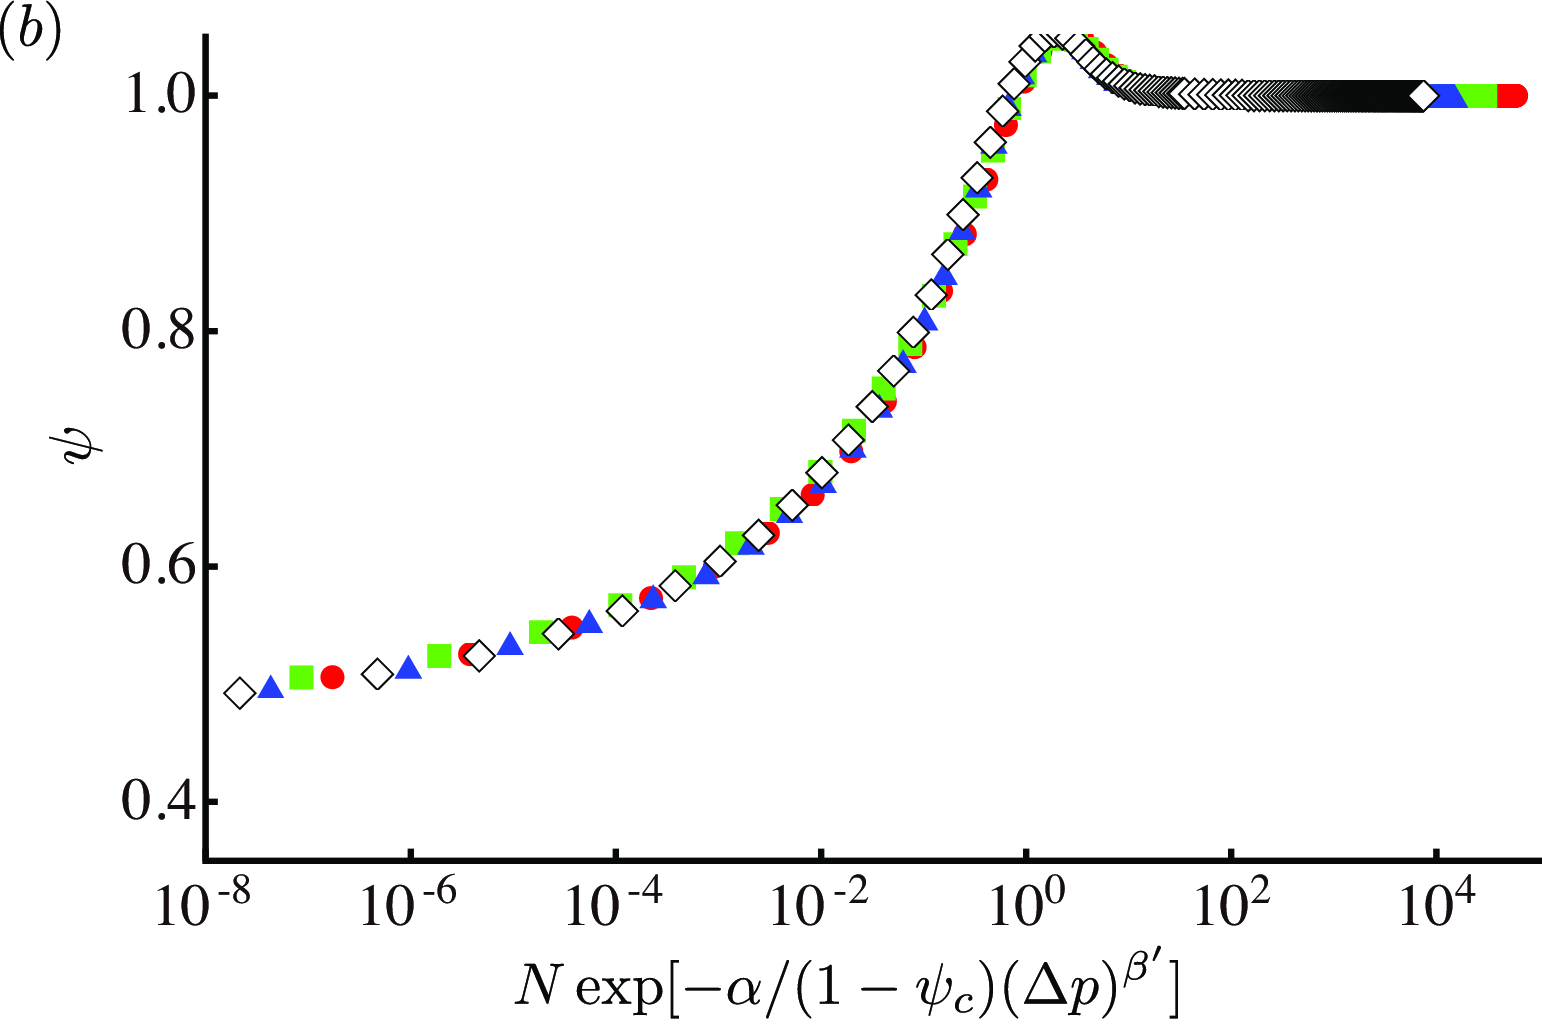
As a demonstration, we apply our method to the decorated flower. We plot and as a function of at several values of in Figs. 23(a) and (b), respectively. For , is proportional to with for large . For , on the other hand, shows a crossover from to around certain , as mentioned in Eqs. (49)-(52). Similarly, converges to for , and shows a stepwise change from to 1 for around . Specifically, we estimate the value of so as to satisfy , and we show its -dependence in Fig. 23(c). It is consistent with our hypothesis , i.e., by assuming . From this plot, we obtain . We then perform the scaling plot of and in Figs. 24(a) and (b), respectively, by using the exponents mentioned above. The collapsing of data to a universal scaling curve is very nice for data with large (as seen in Fig. 23(b), some correction to the scaling cannot be neglected for ).
IV.3.2 Example: the -out graph and the configuration model
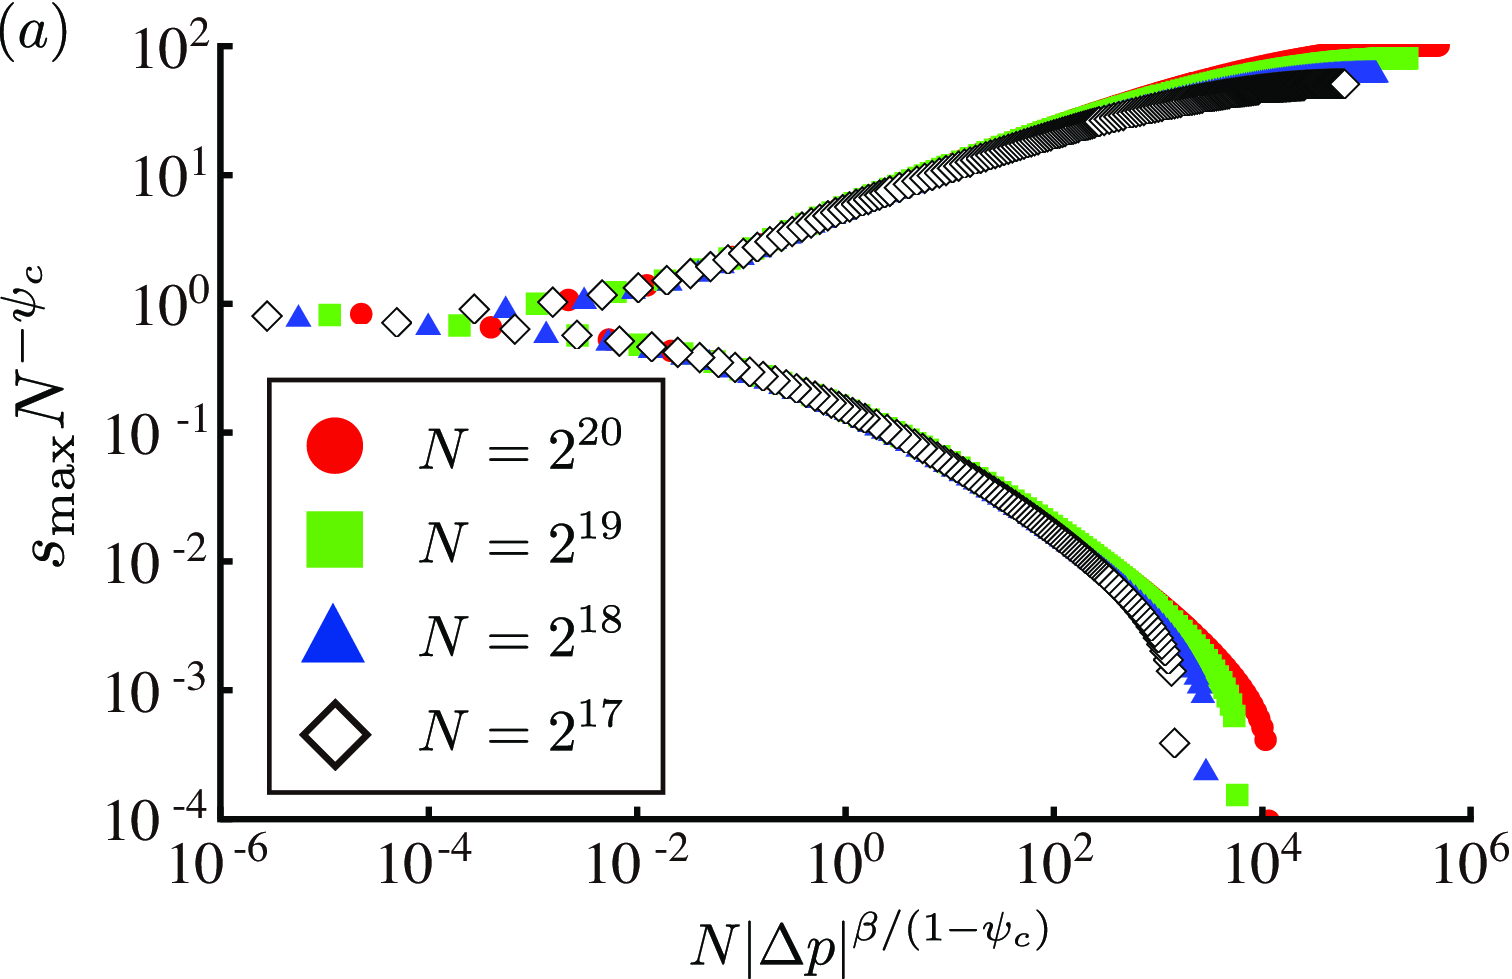
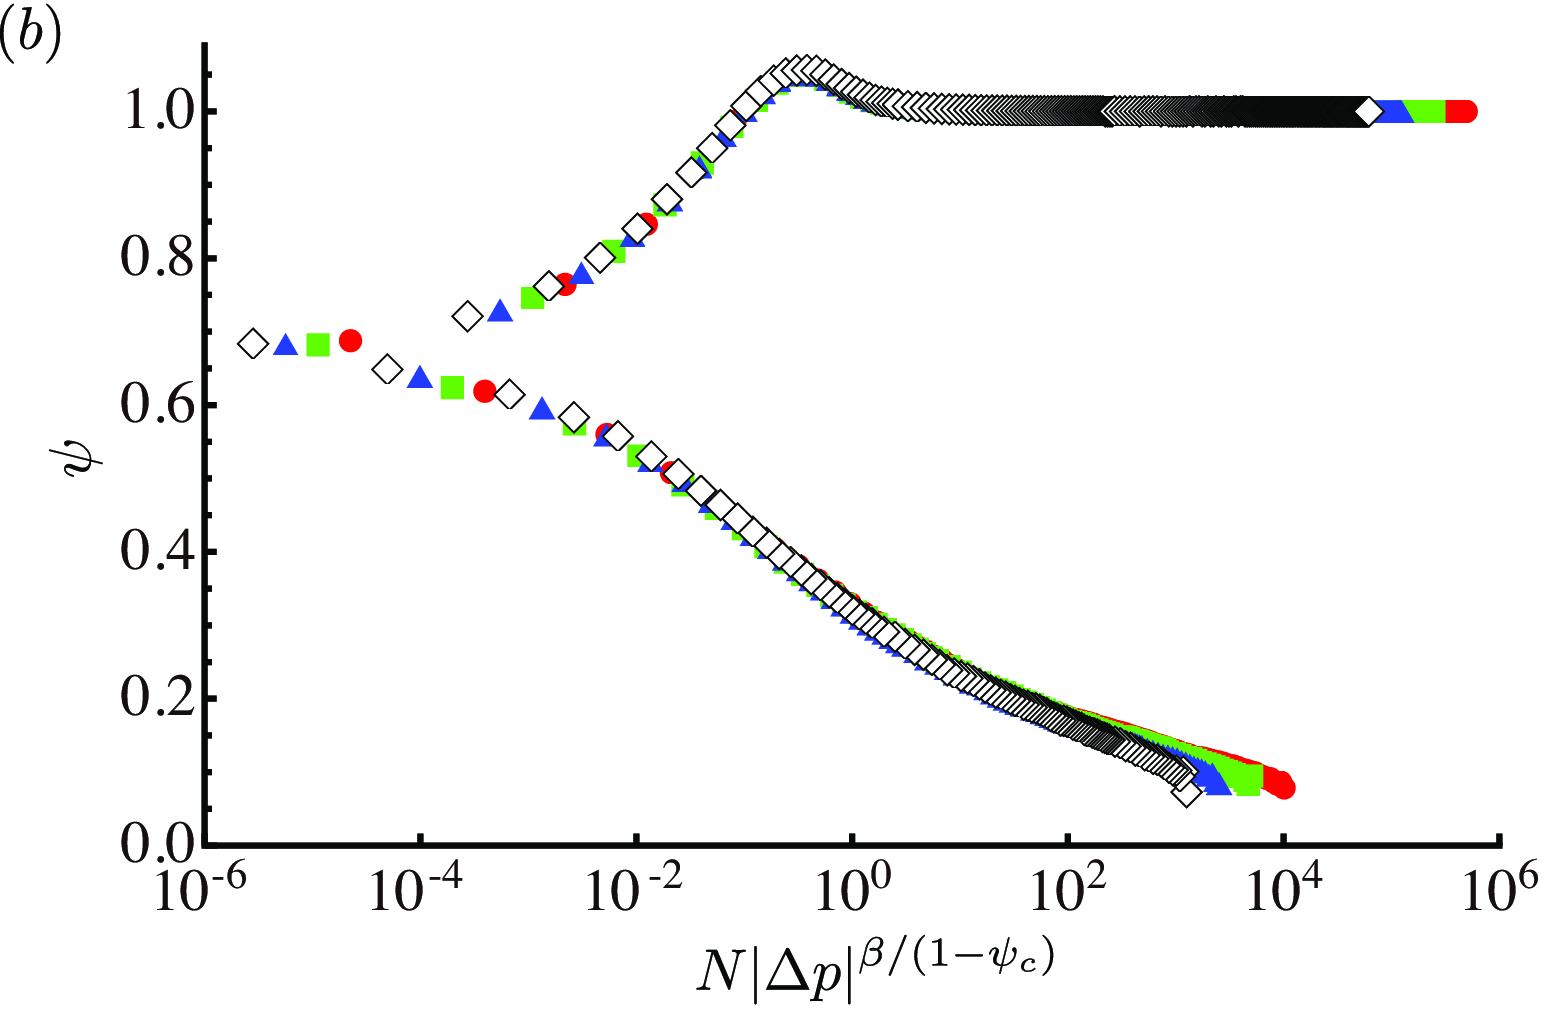
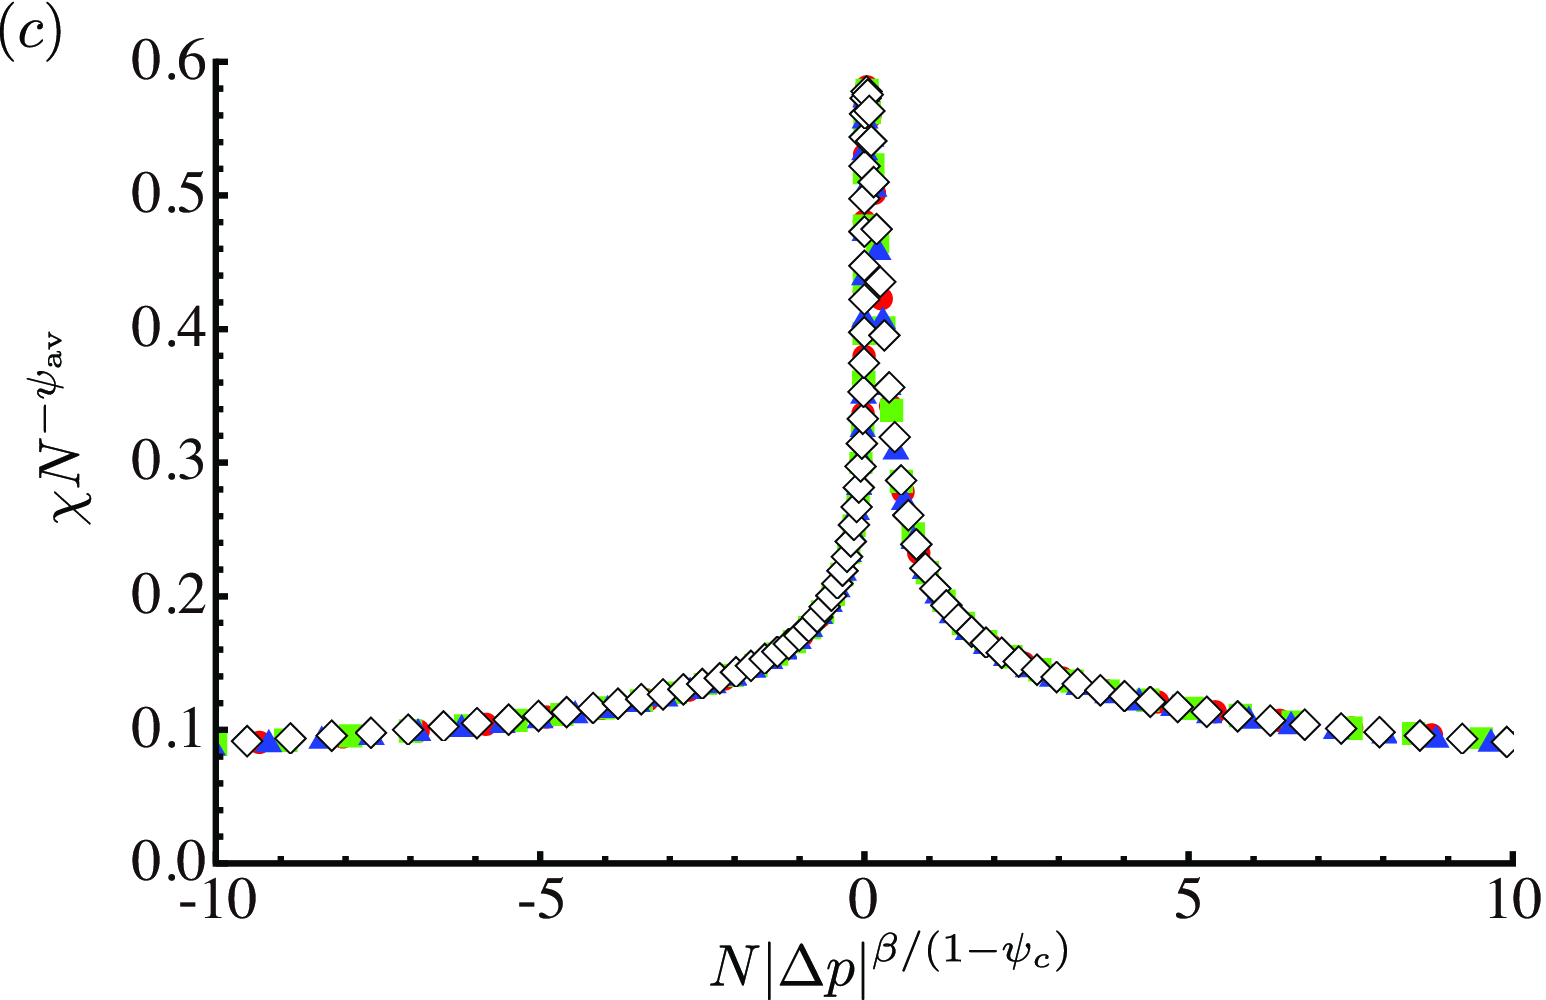
Our second example is the -out graph and the configuration model. We obtain good data collapses for both and by the finite-size scaling, as shown in Fig. 25. We did not perform the finite-size scaling of for the -out graph since our numerical result for the -out graph shows and at the transition point , meaning that the susceptibility of the -out graph does not diverge. Here, parameters and are set to the analytically obtained values.
In Fig. 26, we show the results for finite-size scalings of , , and with on the configuration model that has the same as that of the -out graph. Again, we observe good data collapses for these values.
| graph type | example | scenario |
|---|---|---|
| amenable graph with two ends | chain | |
| amenable graph with one end | -dimensional Euclidean lattice | |
| NAG with infinitely many ends | BT | |
| NAG with one end | EBT Nogawa and Hasegawa (2009a); Baek et al. (2009a); Nogawa and Hasegawa (2009b); Baek (2012); Gu and Ziff (2012), hyperbolic lattice Baek et al. (2009b); Lee and Baek (2012); Gu and Ziff (2012) | |
| stochastic growing tree | GRT Hasegawa and Nemoto (2010); Zhang et al. (2008); Lancaster (2002); Zalányi et al. (2003); Pietsch (2006) | |
| stochastically growing network | GRN Zalányi et al. (2003); Riordan (2005); Bollobás and Riordan (2005), CHKNS model Dorogovtsev et al. (2001a); Callaway et al. (2001) | |
| deterministically growing network | decorated flower Rozenfeld and ben Avraham (2007); Berker et al. (2009); Hasegawa et al. (2010), HN5 Boettcher et al. (2009) | |
| HN-NP Boettcher et al. (2009); Hasegawa and Nogawa (2013), HSWN Boettcher et al. (2012) |
V Discussion
In this paper, we have considered percolation on various types of graphs. Their phase diagrams are summarized in Table 1. The phase boundaries of amenable graphs including the Euclidean lattices and some static uncorrelated networks are and for NAGs, they are . Networks with growth mechanisms lead us to a new scenario: and (see the last three rows in table 1). As for transitive graphs, we already have the condition for the existence of the critical phase (whether a graph is amenable or nonamenable). However, as for non-transitive graphs, i.e., complex networks, the answer is still missing, although the small-world property is presumably a necessary condition because the critical phase can appear when the correlation length and correlation volume diverge at different points. Discovery of the condition for the critical phase in complex networks is the next challenging work.
So far, we have focused on bond percolation. Here, we mention some remarks corresponding to other dynamics. It already has been proven by mathematicians that a critical phase also exists in equilibrium spin systems on infinite NAGs Wu (1996, 2000); Lyons (2000). In addition, the Ising model on hyperbolic lattices has been investigated by means of statistical physics, i.e., Monte Carlo simulations Shima and Sakaniwa (2006a, b); Sakaniwa and Shima (2009) and the transfer-matrix method Ueda et al. (2007); Krcmar et al. (2008); Iharagi et al. (2010); Gendiar et al. (2012). A critical phase and the inverted BKT transition has also been found in the Ising model on an inhomogeneous annealed network Bauer et al. (2005), the decorated flower Hinczewski and Berker (2006), Hanoi networks Boettcher and Brunson (2011a, b, 2012), and the Potts model on the HSWN Nogawa et al. (2012a). Although a critical phase in spin systems has not been well understood, a discussion parallel to that for percolation models may be also possible for these systems and, if so, the fractal exponent will be useful to characterize the critical phase. In spin systems, we have a local disconnected susceptibility , which is directly related to the cluster size in the percolation model, and its fractal exponent defined as . In Nogawa et al. (2012a, b), the average fractal exponent , rather than , was investigated in the Ising and Potts models on hierarchical small-world network. Renormalization group studies lead us to a generalized scaling theory for equilibrium systems that is similar to the finite-size scaling theory shown in this article, which is based on the scale invariance of the free energy (or distribution function) Nogawa et al. (2012a). This theory includes the renormalization of the external field, and therefore the scalings of the order parameter and the susceptibility are derived straightforwardly since these quantities are given by the derivatives of the free energy with respect to the field.
As for the contact process (the susceptible-infected-susceptible model), the model on NAGs may have an intermediate phase between the absorbing phase, where the process dies out, and the active phase, where a finite fraction of nodes is active for all time. In the intermediate phase, the probability that process survives for all time is positive, but an arbitrary node is never infected after a long time, implying that the order parameter remains zero. This is at least the case for tree Pemantle (1992); Liggett (1996); Stacey (1996). However, it is an open problem whether there exists a resemblance of this intermediate phase in finite NAGs with the large size limit or in complex networks presented in this paper.
Acknowledgements
This work was partially supported by the Grant-in-Aid for Young Scientists (B) of Japan Society for the Promotion of Science (Grant No. 24740054 to T.H.) and JST, ERATO, Kawarabayashi Large Graph Project.
References
- Albert and Barabási (2002) R. Albert and A.-L. Barabási, Reviews of Modern Physics 74, 47 (2002).
- Newman (2003a) M. E. J. Newman, SIAM Review 45, 167 (2003a).
- Boccaletti et al. (2006) S. Boccaletti, V. Latora, Y. Moreno, M. Chavez, and D.-U. Hwang, Physics Reports 424, 175 (2006).
- Barrat et al. (2008) A. Barrat, M. Barthélemy, and A. Vespignani, Dynamical processes on complex networks (Cambridge University Press, 2008).
- Watts and Strogatz (1998) D. J. Watts and S. H. Strogatz, Nature 393, 440 (1998).
- Barabási and Albert (1999) A.-L. Barabási and R. Albert, Science 286, 509 (1999).
- Dorogovtsev et al. (2008) S. N. Dorogovtsev, A. V. Goltsev, and J. F. F. Mendes, Reviews of Modern Physics 80, 1275 (2008).
- Nogawa and Hasegawa (2009a) T. Nogawa and T. Hasegawa, Journal of Physics A: Mathematical and Theoretical 42, 145001 (2009a).
- Nogawa and Hasegawa (2009b) T. Nogawa and T. Hasegawa, Journal of Physics A: Mathematical and Theoretical 42, 478002 (2009b).
- Hasegawa and Nemoto (2010) T. Hasegawa and K. Nemoto, Physical Review E 81, 051105 (2010).
- Hasegawa et al. (2010) T. Hasegawa, M. Sato, and K. Nemoto, Physical Review E 82, 046101 (2010).
- Nogawa et al. (2012a) T. Nogawa, T. Hasegawa, and K. Nemoto, Physical Review Letters 108, 255703 (2012a).
- Nogawa et al. (2012b) T. Nogawa, T. Hasegawa, and K. Nemoto, Physical Review E 86, 030102 (2012b).
- Hasegawa and Nogawa (2013) T. Hasegawa and T. Nogawa, Physical Review E 87, 032810 (2013).
- Hasegawa et al. (2013) T. Hasegawa, T. Nogawa, and K. Nemoto, EPL (Europhysics Letters) 104, 16006 (2013).
- Nogawa and Hasegawa (2013) T. Nogawa and T. Hasegawa, arXiv:1312.4697 (2013).
- Stauffer and Aharony (1994) D. Stauffer and A. Aharony, Introduction to percolation theory (Taylor and Francis, 1994).
- Benjamini and Schramm (1996) I. Benjamini and O. Schramm, Electronic Communications in Probability 1, 71 (1996).
- Lyons (2000) R. Lyons, Journal of Mathematical Physics 41, 1099 (2000).
- Schonmann (2001) R. H. Schonmann, Communications in Mathematical Physics 219, 271 (2001).
- Burton and Keane (1989) R. M. Burton and M. Keane, Communications in Mathematical Physics 121, 501 (1989).
- Mohar (1991) B. Mohar, Discrete mathematics 95, 193 (1991).
- Benjamini and Schramm (2001) I. Benjamini and O. Schramm, Journal of the American Mathematical Society 14, 487 (2001).
- Eggarter (1974) T. P. Eggarter, Physical Review B 9, 2989 (1974).
- Müller-Hartmann and Zittartz (1974) E. Müller-Hartmann and J. Zittartz, Physical Review Letters 33, 893 (1974).
- Baek et al. (2009a) S. K. Baek, P. Minnhagen, and B. J. Kim, Journal of Physics A: Mathematical and Theoretical 42, 478001 (2009a).
- Minnhagen and Baek (2010) P. Minnhagen and S. K. Baek, Physical Review E 82, 011113 (2010).
- Gu and Ziff (2012) H. Gu and R. M. Ziff, Physical Review E 85, 051141 (2012).
- Baek (2012) S. K. Baek, Physical Review E 85, 051128 (2012).
- Baek et al. (2009b) S. K. Baek, P. Minnhagen, and B. J. Kim, Physical Review E 79, 011124 (2009b).
- Lee and Baek (2012) J. F. Lee and S. K. Baek, Physical Review E 86, 062105 (2012).
- Albert et al. (2000) R. Albert, H. Jeong, and A.-L. Barabási, Nature 406, 378 (2000).
- Cohen et al. (2000) R. Cohen, K. Erez, D. ben Avraham, and S. Havlin, Physical Review Letters 85, 4626 (2000).
- Cohen et al. (2002) R. Cohen, D. ben Avraham, and S. Havlin, Physical Review E 66, 036113 (2002).
- Molloy and Reed (1995) M. Molloy and B. Reed, Random Structures & Algorithms 6, 161 (1995).
- Callaway et al. (2000) D. S. Callaway, M. E. J. Newman, S. H. Strogatz, and D. J. Watts, Physical Review Letters 85, 5468 (2000).
- Cohen et al. (2001) R. Cohen, K. Erez, D. ben Avraham, and S. Havlin, Physical Review Letters 86, 3682 (2001).
- Goltsev et al. (2008) A. V. Goltsev, S. N. Dorogovtsev, and J. F. F. Mendes, Physical Review E 78, 051105 (2008).
- Tanizawa et al. (2012) T. Tanizawa, S. Havlin, and H. E. Stanley, Physical Review E 85, 046109 (2012).
- Newman (2003b) M. E. J. Newman, Physical Review E 68, 026121 (2003b).
- Gleeson (2009) J. P. Gleeson, Physical Review E 80, 036107 (2009).
- Gleeson and Melnik (2009) J. P. Gleeson and S. Melnik, Physical Review E 80, 046121 (2009).
- Gleeson et al. (2010) J. P. Gleeson, S. Melnik, and A. Hackett, Physical Review E 81, 066114 (2010).
- Callaway et al. (2001) D. S. Callaway, J. E. Hopcroft, J. M. Kleinberg, M. E. J. Newman, and S. H. Strogatz, Physical Review E 64, 041902 (2001).
- Dorogovtsev et al. (2001a) S. N. Dorogovtsev, J. F. F. Mendes, and A. N. Samukhin, Physical Review E 64, 066110 (2001a).
- Lancaster (2002) D. Lancaster, Journal of Physics A: Mathematical and General 35, 1179 (2002).
- Kim et al. (2002) J. Kim, P. L. Krapivsky, B. Kahng, and S. Redner, Physical Review E 66, 055101 (2002).
- Coulomb and Bauer (2003) S. Coulomb and M. Bauer, The European Physical Journal B-Condensed Matter and Complex Systems 35, 377 (2003).
- Zalányi et al. (2003) L. Zalányi, G. Csárdi, T. Kiss, M. Lengyel, R. Warner, J. Tobochnik, and P. Érdi, Physical Review E 68, 066104 (2003).
- Krapivsky and Derrida (2004) P. L. Krapivsky and B. Derrida, Physica A: Statistical Mechanics and its Applications 340, 714 (2004).
- Bollobás and Riordan (2004) B. Bollobás and O. Riordan, 3243, 1 (2004).
- Bollobás et al. (2005) B. Bollobás, S. Janson, and O. Riordan, Random Structures & Algorithms 26, 1 (2005).
- Bollobás and Riordan (2005) B. Bollobás and O. Riordan, Random Structures & Algorithms 27, 1 (2005).
- Riordan (2005) O. Riordan, Combinatorics Probability and Computing 14, 897 (2005).
- Pietsch (2006) W. Pietsch, Physical Review E 73, 066112 (2006).
- Zhang et al. (2008) Z. Zhang, S. Zhou, S. Zhao, and J. Guan, Journal of Physics A: Mathematical and Theoretical 41, 185101 (2008).
- Dorogovtsev et al. (2000) S. N. Dorogovtsev, J. F. F. Mendes, and A. N. Samukhin, Physical Review Letters 85, 4633 (2000).
- Krapivsky et al. (2000) P. L. Krapivsky, S. Redner, and F. Leyvraz, Physical Review Letters 85, 4629 (2000).
- Janson et al. (1993) S. Janson, D. E. Knuth, T. Łuczak, and B. Pittel, Random Structures & Algorithms 4, 233 (1993).
- Auto et al. (2008) D. M. Auto, A. A. Moreira, H. J. Herrmann, and J. S. Andrade Jr, Physical Review E 78, 066112 (2008).
- Dorogovtsev (2003) S. N. Dorogovtsev, Physical Review E 67, 045102 (2003).
- Rozenfeld et al. (2007) H. D. Rozenfeld, S. Havlin, and D. Ben-Avraham, New Journal of Physics 9, 175 (2007).
- Rozenfeld and ben Avraham (2007) H. D. Rozenfeld and D. ben Avraham, Physical Review E 75, 061102 (2007).
- Hinczewski and Berker (2006) M. Hinczewski and A. N. Berker, Physical Review E 73, 066126 (2006).
- Berker et al. (2009) A. N. Berker, M. Hinczewski, and R. R. Netz, Physical Review E 80, 041118 (2009).
- Boettcher et al. (2012) S. Boettcher, V. Singh, and R. M. Ziff, Nature Communications 3, 787 (2012).
- Zhang and Comellas (2011) Z. Zhang and F. Comellas, Theoretical Computer Science 412, 865 (2011).
- Boettcher et al. (2009) S. Boettcher, J. L. Cook, and R. M. Ziff, Physical Review E 80, 041115 (2009).
- Hong et al. (2007) H. Hong, M. Ha, and H. Park, Physical Review Letters 98, 258701 (2007).
- Wu (1996) C. C. Wu, Journal of statistical physics 85, 251 (1996).
- Wu (2000) C. C. Wu, Journal of Statistical Physics 100, 893 (2000).
- Shima and Sakaniwa (2006a) H. Shima and Y. Sakaniwa, Journal of Physics A: Mathematical and General 39, 4921 (2006a).
- Shima and Sakaniwa (2006b) H. Shima and Y. Sakaniwa, Journal of Statistical Mechanics: Theory and Experiment 2006, P08017 (2006b).
- Sakaniwa and Shima (2009) Y. Sakaniwa and H. Shima, Physical Review E 80, 021103 (2009).
- Ueda et al. (2007) K. Ueda, R. Krcmar, A. Gendiar, and T. Nishino, Journal of the Physical Society of Japan 76, 084004 (2007).
- Krcmar et al. (2008) R. Krcmar, A. Gendiar, K. Ueda, and T. Nishino, Journal of Physics A: Mathematical and Theoretical 41, 125001 (2008).
- Iharagi et al. (2010) T. Iharagi, A. Gendiar, H. Ueda, and T. Nishino, Journal of the Physical Society of Japan 79, 104001 (2010).
- Gendiar et al. (2012) A. Gendiar, R. Krcmar, S. Andergassen, M. Daniška, and T. Nishino, Physical Review E 86, 021105 (2012).
- Bauer et al. (2005) M. Bauer, S. Coulomb, and S. N. Dorogovtsev, Physical Review Letters 94, 200602 (2005).
- Boettcher and Brunson (2011a) S. Boettcher and C. T. Brunson, Physical Review E 83, 021103 (2011a).
- Boettcher and Brunson (2011b) S. Boettcher and C. T. Brunson, Frontiers in Physiology 2 (2011b).
- Boettcher and Brunson (2012) S. Boettcher and C. T. Brunson, arXiv:1209.3447 (2012).
- Pemantle (1992) R. Pemantle, The Annals of Probability pp. 2089–2116 (1992).
- Liggett (1996) T. M. Liggett, The Annals of Probability 24, 1675 (1996).
- Stacey (1996) A. M. Stacey, The Annals of Probability pp. 1711–1726 (1996).
- Dorogovtsev et al. (2001b) S. N. Dorogovtsev, J. F. F. Mendes, and A. N. Samukhin, Physical Review E 63, 062101 (2001b).