Support vector machine classification of dimensionally reduced structural MRI images for dementia
Abstract
. We classify very-mild to moderate dementia in patients (CDR ranging from to ) using a support vector machine classifier acting on dimensionally reduced feature set derived from MRI brain scans of the subjects available in the OASIS-Brains dataset. We use image segmentation and principal component analysis to reduce the dimensionality of the data. Our resulting feature set contains 11 features for each subject. Performance of the classifiers is evaluated using -fold cross-validation. Using linear and (gaussian) kernels, we obtain a training classification accuracy of (), test accuracy of (), test precision of (), test recall of (), and test Matthews correlation coefficient of ().
keywords:
support vector machine\sepCDR\sepdementia classification\sepprincipal component analysis\sepdimesional reduction \sepeigenbrain, and
1 Introduction
This is a technical note describing the implementation of linear and non-linear kernel support vector machine (SVM) classifiers to classify MRI scans according to whether or not the patient has a non-zero clinical dementia rating (CDR). We train and test these classifiers on the Open Access Imaging Series (OASIS) dataset [1], which contains subjects, of which have been diagnosed with dementia (clinical dementia rating, CDR > 0).
Previous works have discussed applications of machine learning techniques to classify MRI scans for dementia or Alzheimer’s and depression: Kloppel et al. [2] utilized a support vector machine and structural MRI images to separate healthy subjects from those diagnosed with Alzheimer’s disease (AD) via either neuropathology or Mini Mental State Examination (MMSE) score, and the same work reported to be successful in aiding the differential diagnosis of AD and frontotemporal lobar degeneration. Recent work by Mwangi et al. [3] has also been successful in identifying depression in subjects from structural MRI images. These previous works utilized relatively small samples of subjects, testing and training support vector machines on relatively small samples containing fewer than subjects. Additionally, these works used the raw image data to train and test the classifiers, that is, raw voxel intensity values were fed into the algorithms. An MRI scan with voxels has over million voxels. When replicating the procedure outline in previous works by training a linear-kernel SVM classifier using a subset () of the raw voxel intensities, we observe severe over fitting of the classifier (i.e., training accuracy of ), which may introduce significant bias if applied out of sample.
Therefore, in this work, we aim to improve the generality of the classifier by reducing dimensionality of the feature set. Rather than testing and training on the entire imaged volume, we reduce the dimensionality of the feature set to only features per example by using quantities computed from the images and principal component analysis (PCA), then we assess the performance of the classifiers for various sets of features via 10-fold cross-validation. Dimensional reduction of the data also increases the computational tractability of the problem, enabling one to execute the classifier on a standard laptop computer.
This brief is structured as follows: first, we present a brief overview of a SVM classifier and its implementation; second, we present the data used in the study; third, we summarize and motivate the feature set on which we train and test the classifiers; lastly, we present and discuss our results for classifying mild- to moderate-dementia using a dimensionally reduced dataset.
2 Support Vector Machine
We implement a SVM classifiers to classify subjects into a CDR score moderate dementia using MRI scans. An SVM is able to determine an optimal boundary between to datasets described by features via a linear and non-linear combinations of features; for a thorough review of support vector machines in the context of classification for diagnosis, please see [2] and [3]. We use [4] to implement linear- and radial basis function (i.e., gaussian) SVM classifiers.
3 MRI dataset and features
OASIS [1] provides T1-weighted MRI scans for 416 subjects, aged 18 to 96, including both women and men, and all subjects are right handed. Subjects’ cognitive health has been diagnosed via both mini-mental state exam (MMSE, [5]) and clinical dementia rating (CDR, [6]), and 100 subjects have a CDR greater than , with subjects having a CDR of , with a rating of , and with a rating ; none have scores greater than 2. The dataset also includes the subjects’ age, gender, estimated total intracranial volume (eTIV, [7]), and normalized whole brain volume (nWBV, [8]).
For more details about the data acquisition, content, and processing, we refer you to [1]; a brief synopsis is provided here. For every subject, OASIS provides post-processed images: the non-brain tissue is masked using the fMRIDC Brain Extraction Tool, and the images are gain-field corrected and registered to the 1988 atlas of Talairach and Tournoux [7]. Lastly, using the atlas registered image, a segmented (grey/white/CSF) brain is computed [9]. In this work, we use the masked/gain-field corrected/registered images (referred to as ’masked’ images), and the segmented images (referred to as ’segmented’ images). In the registration, all images are resampled with isotropic voxels resulting in a final imaged volume of voxels [1].
We compute a reduced set of features using data provided in the OASIS-Brains dataset, as well as from the masked and segmented images. We computed a measure of symmetry for a scan using the masked images; we compute the zero-lag () correlation () of each slice with a flipped (left-right or up-down, noted as ) version of itself, and normalizing by the integrated level of signal in that slice
| (1) |
The average value of the symmetry over all axial slices is used as the feature for a given scan. We also compute the sum of white matter, grey matter, and CSF as the sum of the indicator function () of , , and , respectively, with the segmented images.
We also use principal component analysis (PCA to incorporate more of the voxel intensity value while keeping the dimensionality to a minimum. We adopt a strategy well-known for person identification from facial images, where principal components are computed from a set of headshots; the resulting principal components are often referred to as ’eigenfaces’ [10]. Similarly, we compute ’eigenbrains’ for the entire dataset, and consider the component coefficients resulting from OLS projection of each subject onto the eigenbrain basis set. We compute eigenbrains for two separate slices, one axial slice and one coronal slice (figure 1), selecting slices on which gray matter and white matter volume have been shown to correlate with impaired cognitive ability [11]. We select PCA components by parametrically testing the classifers; the combination of coronal and axial components (#4 and #7, respectively) that maximize test accuracy are shown in figure 1.
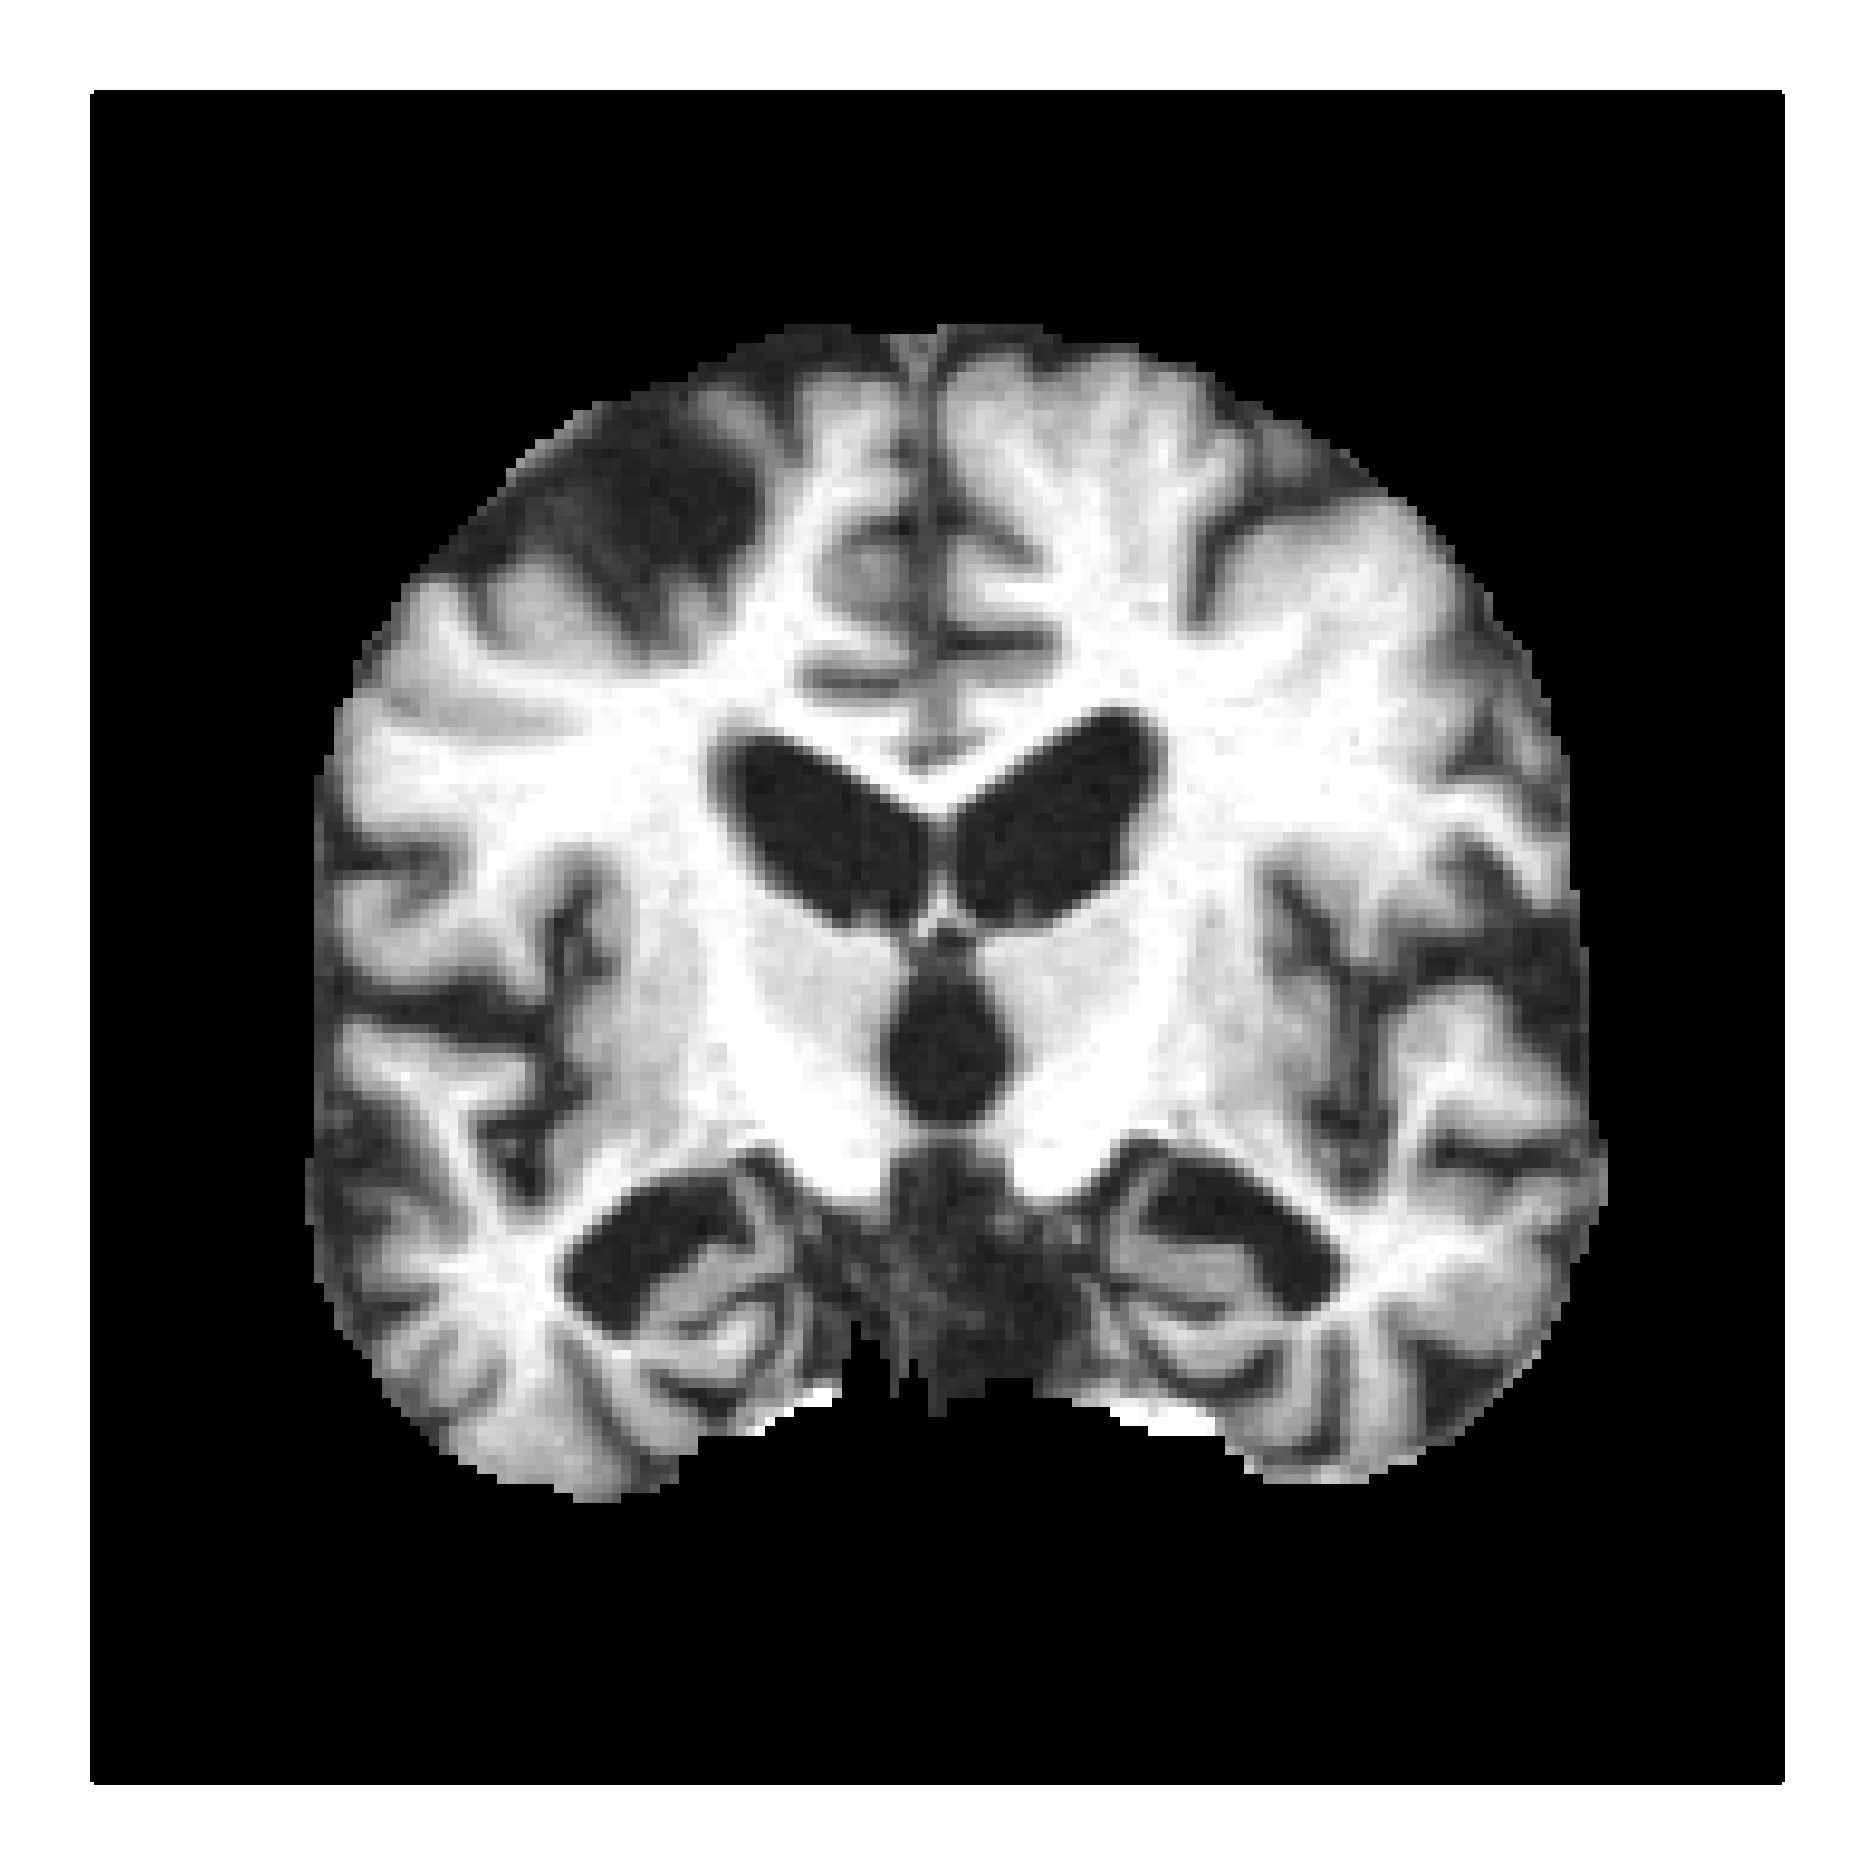
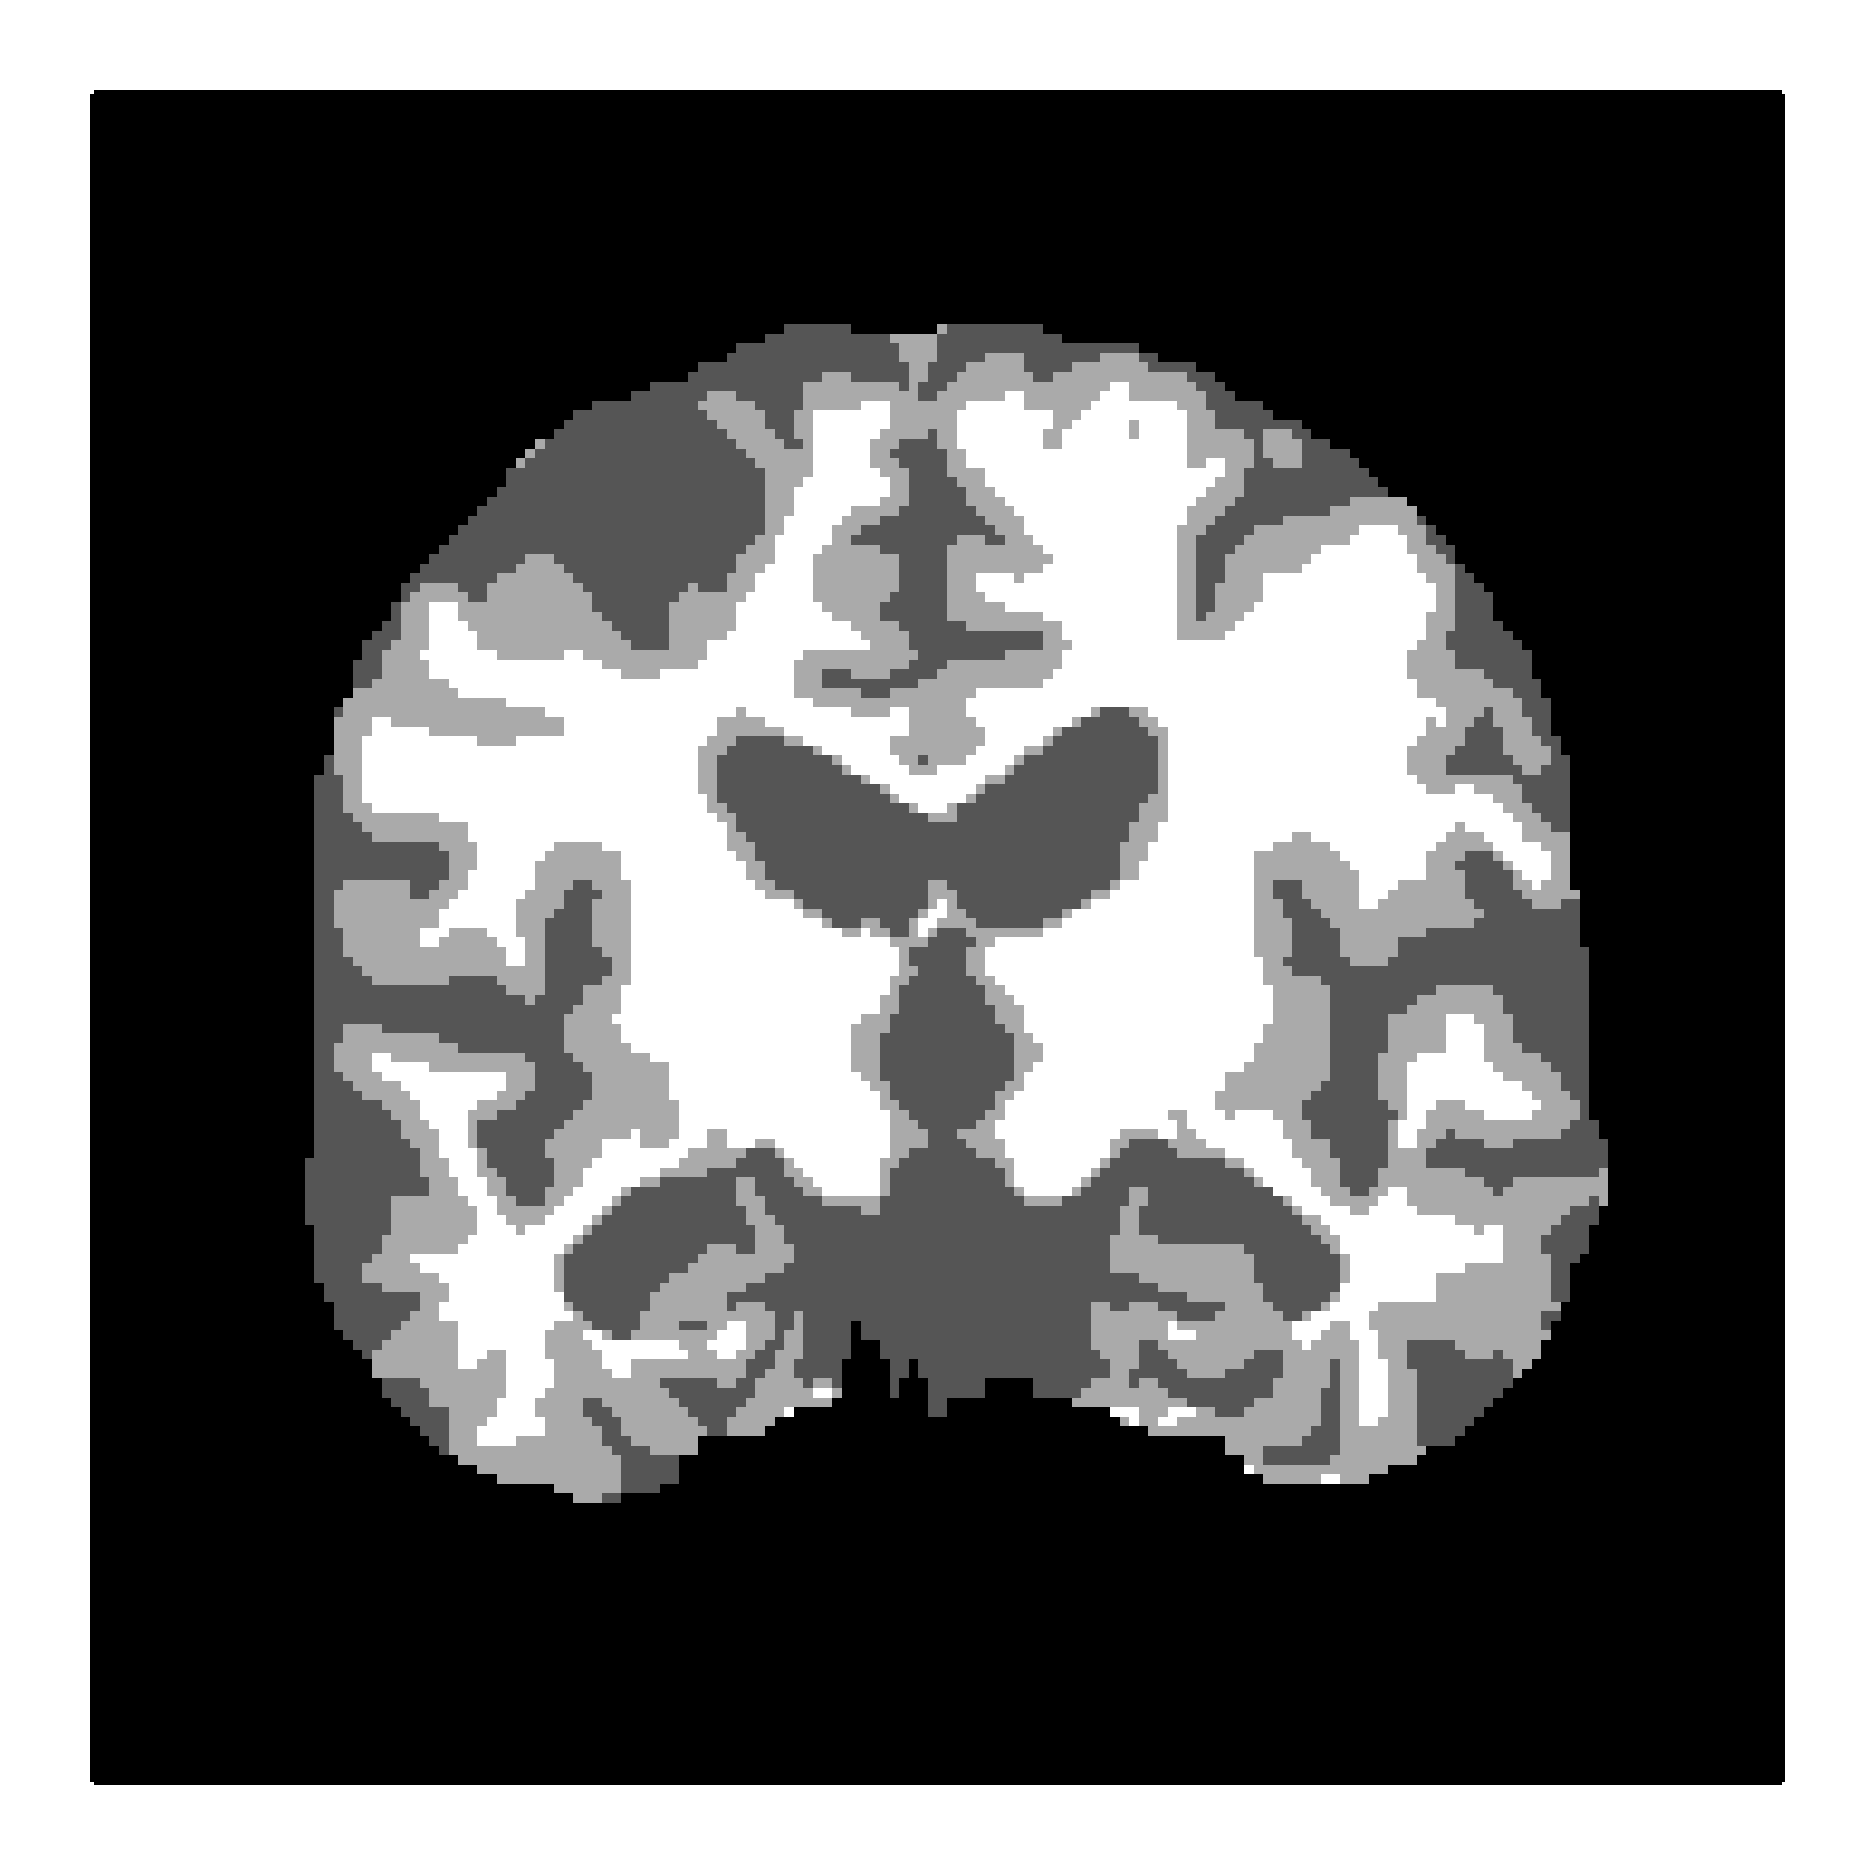
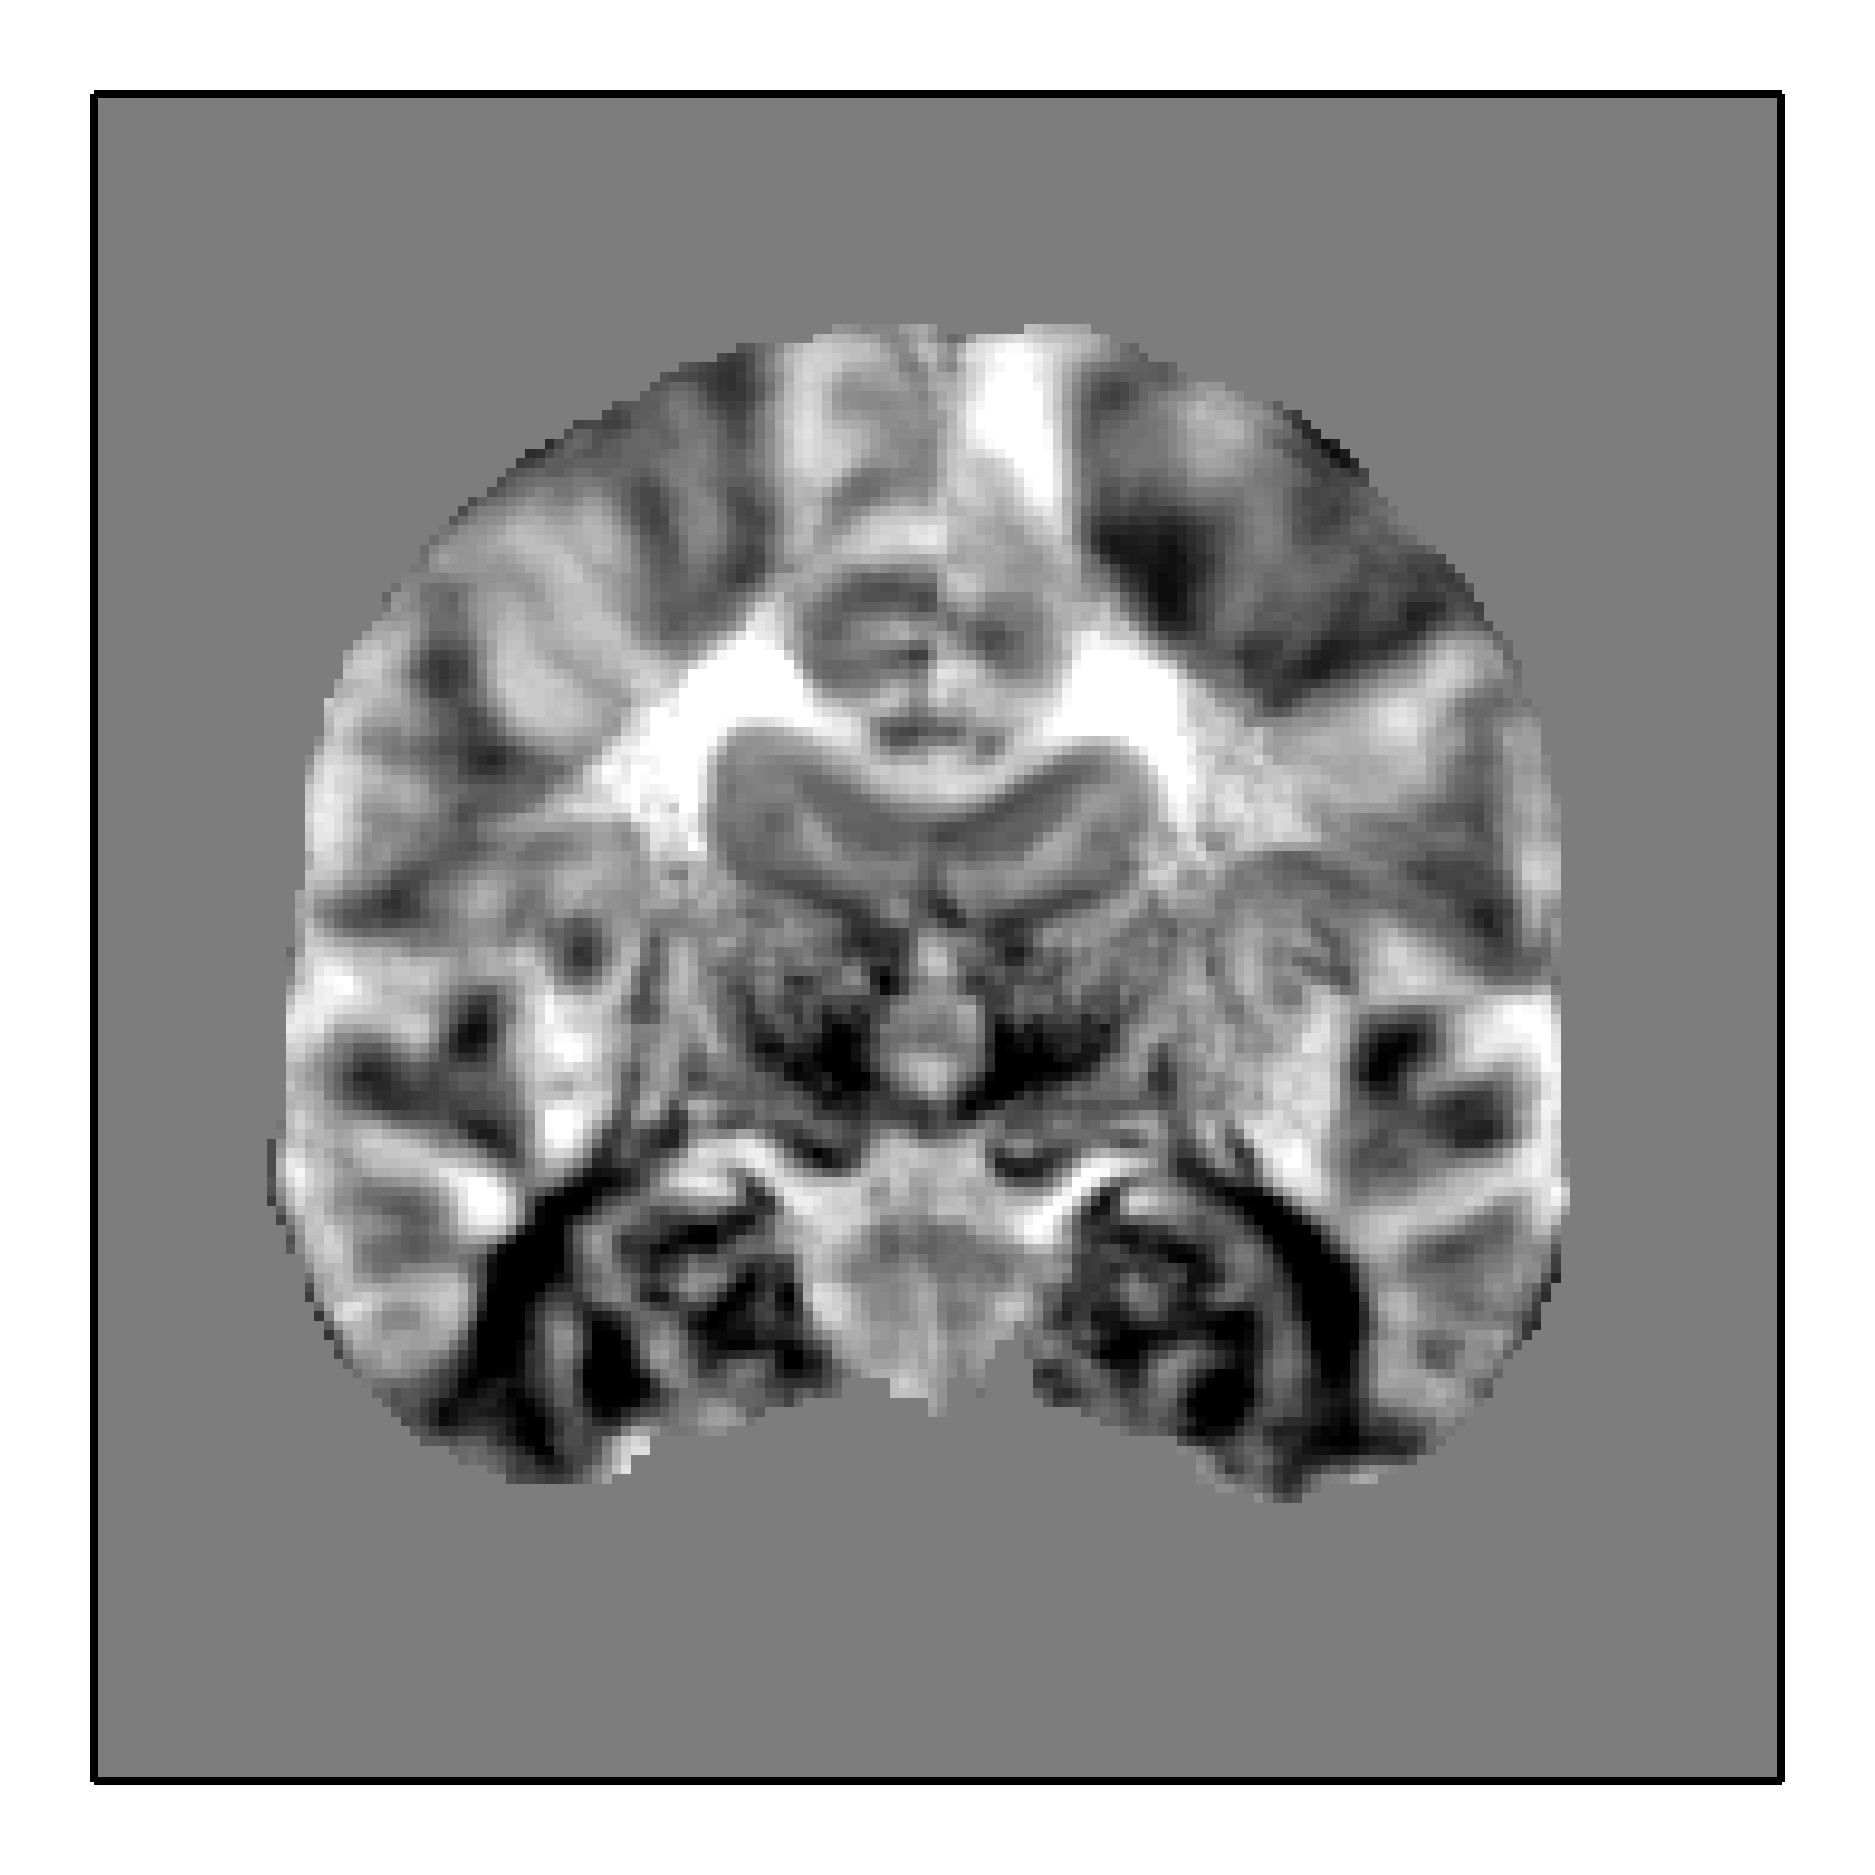
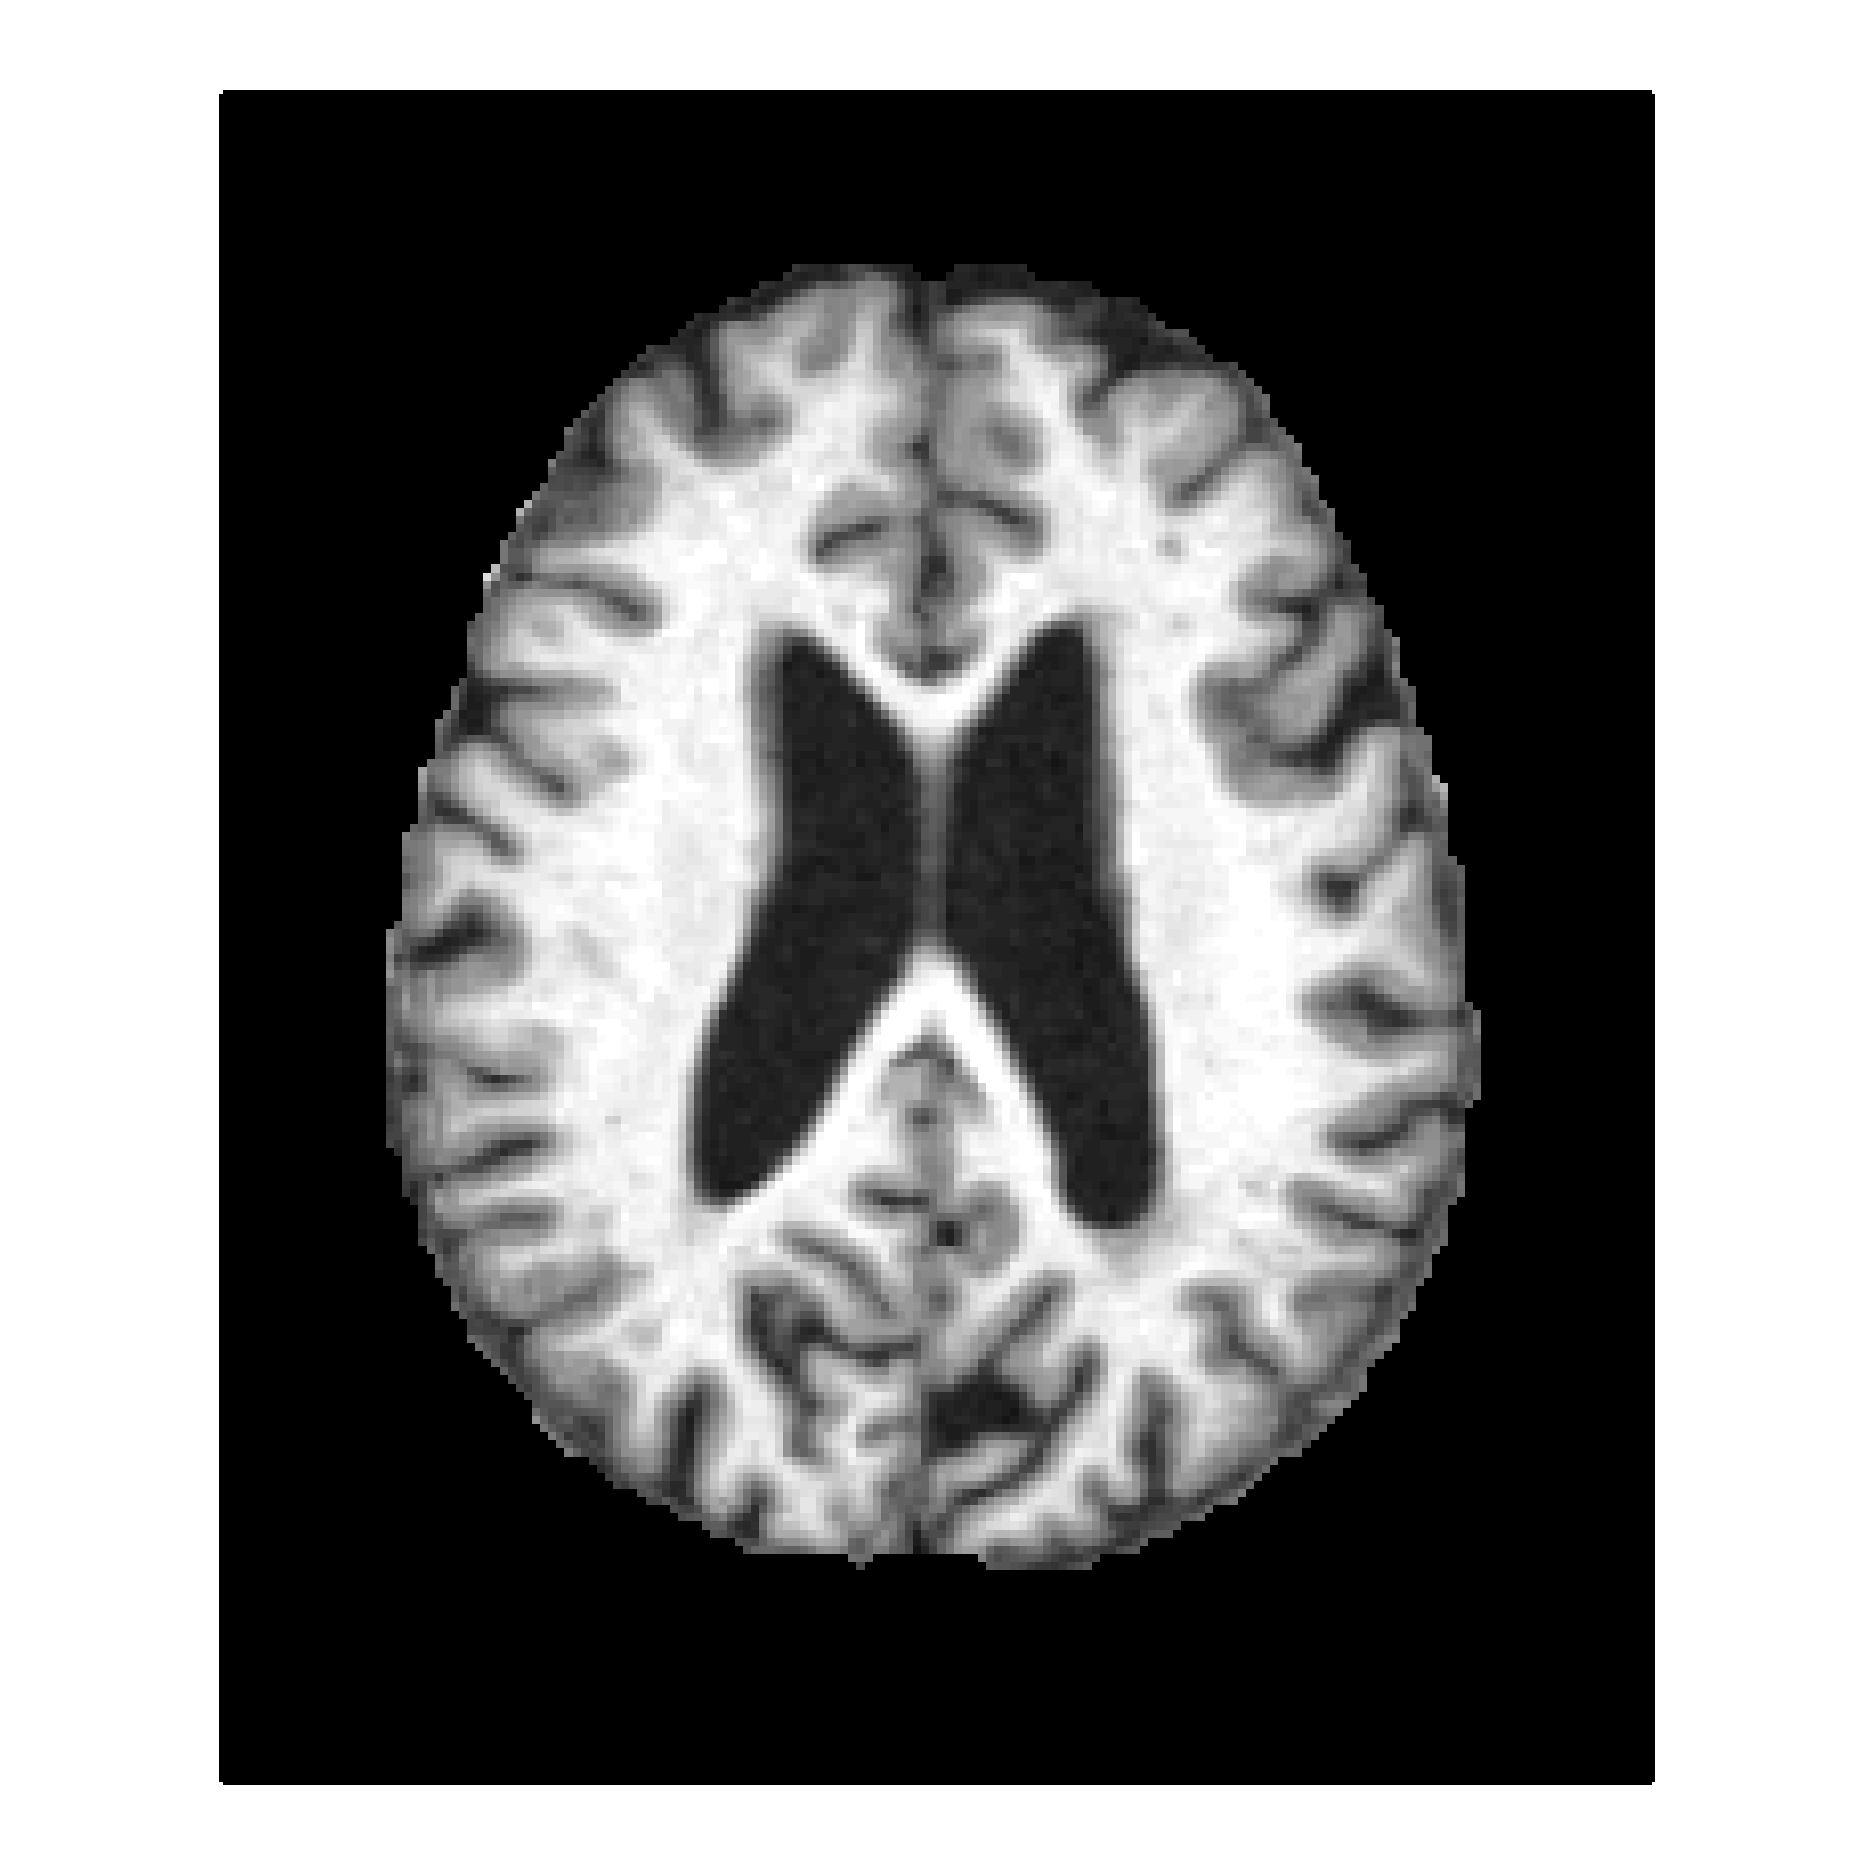
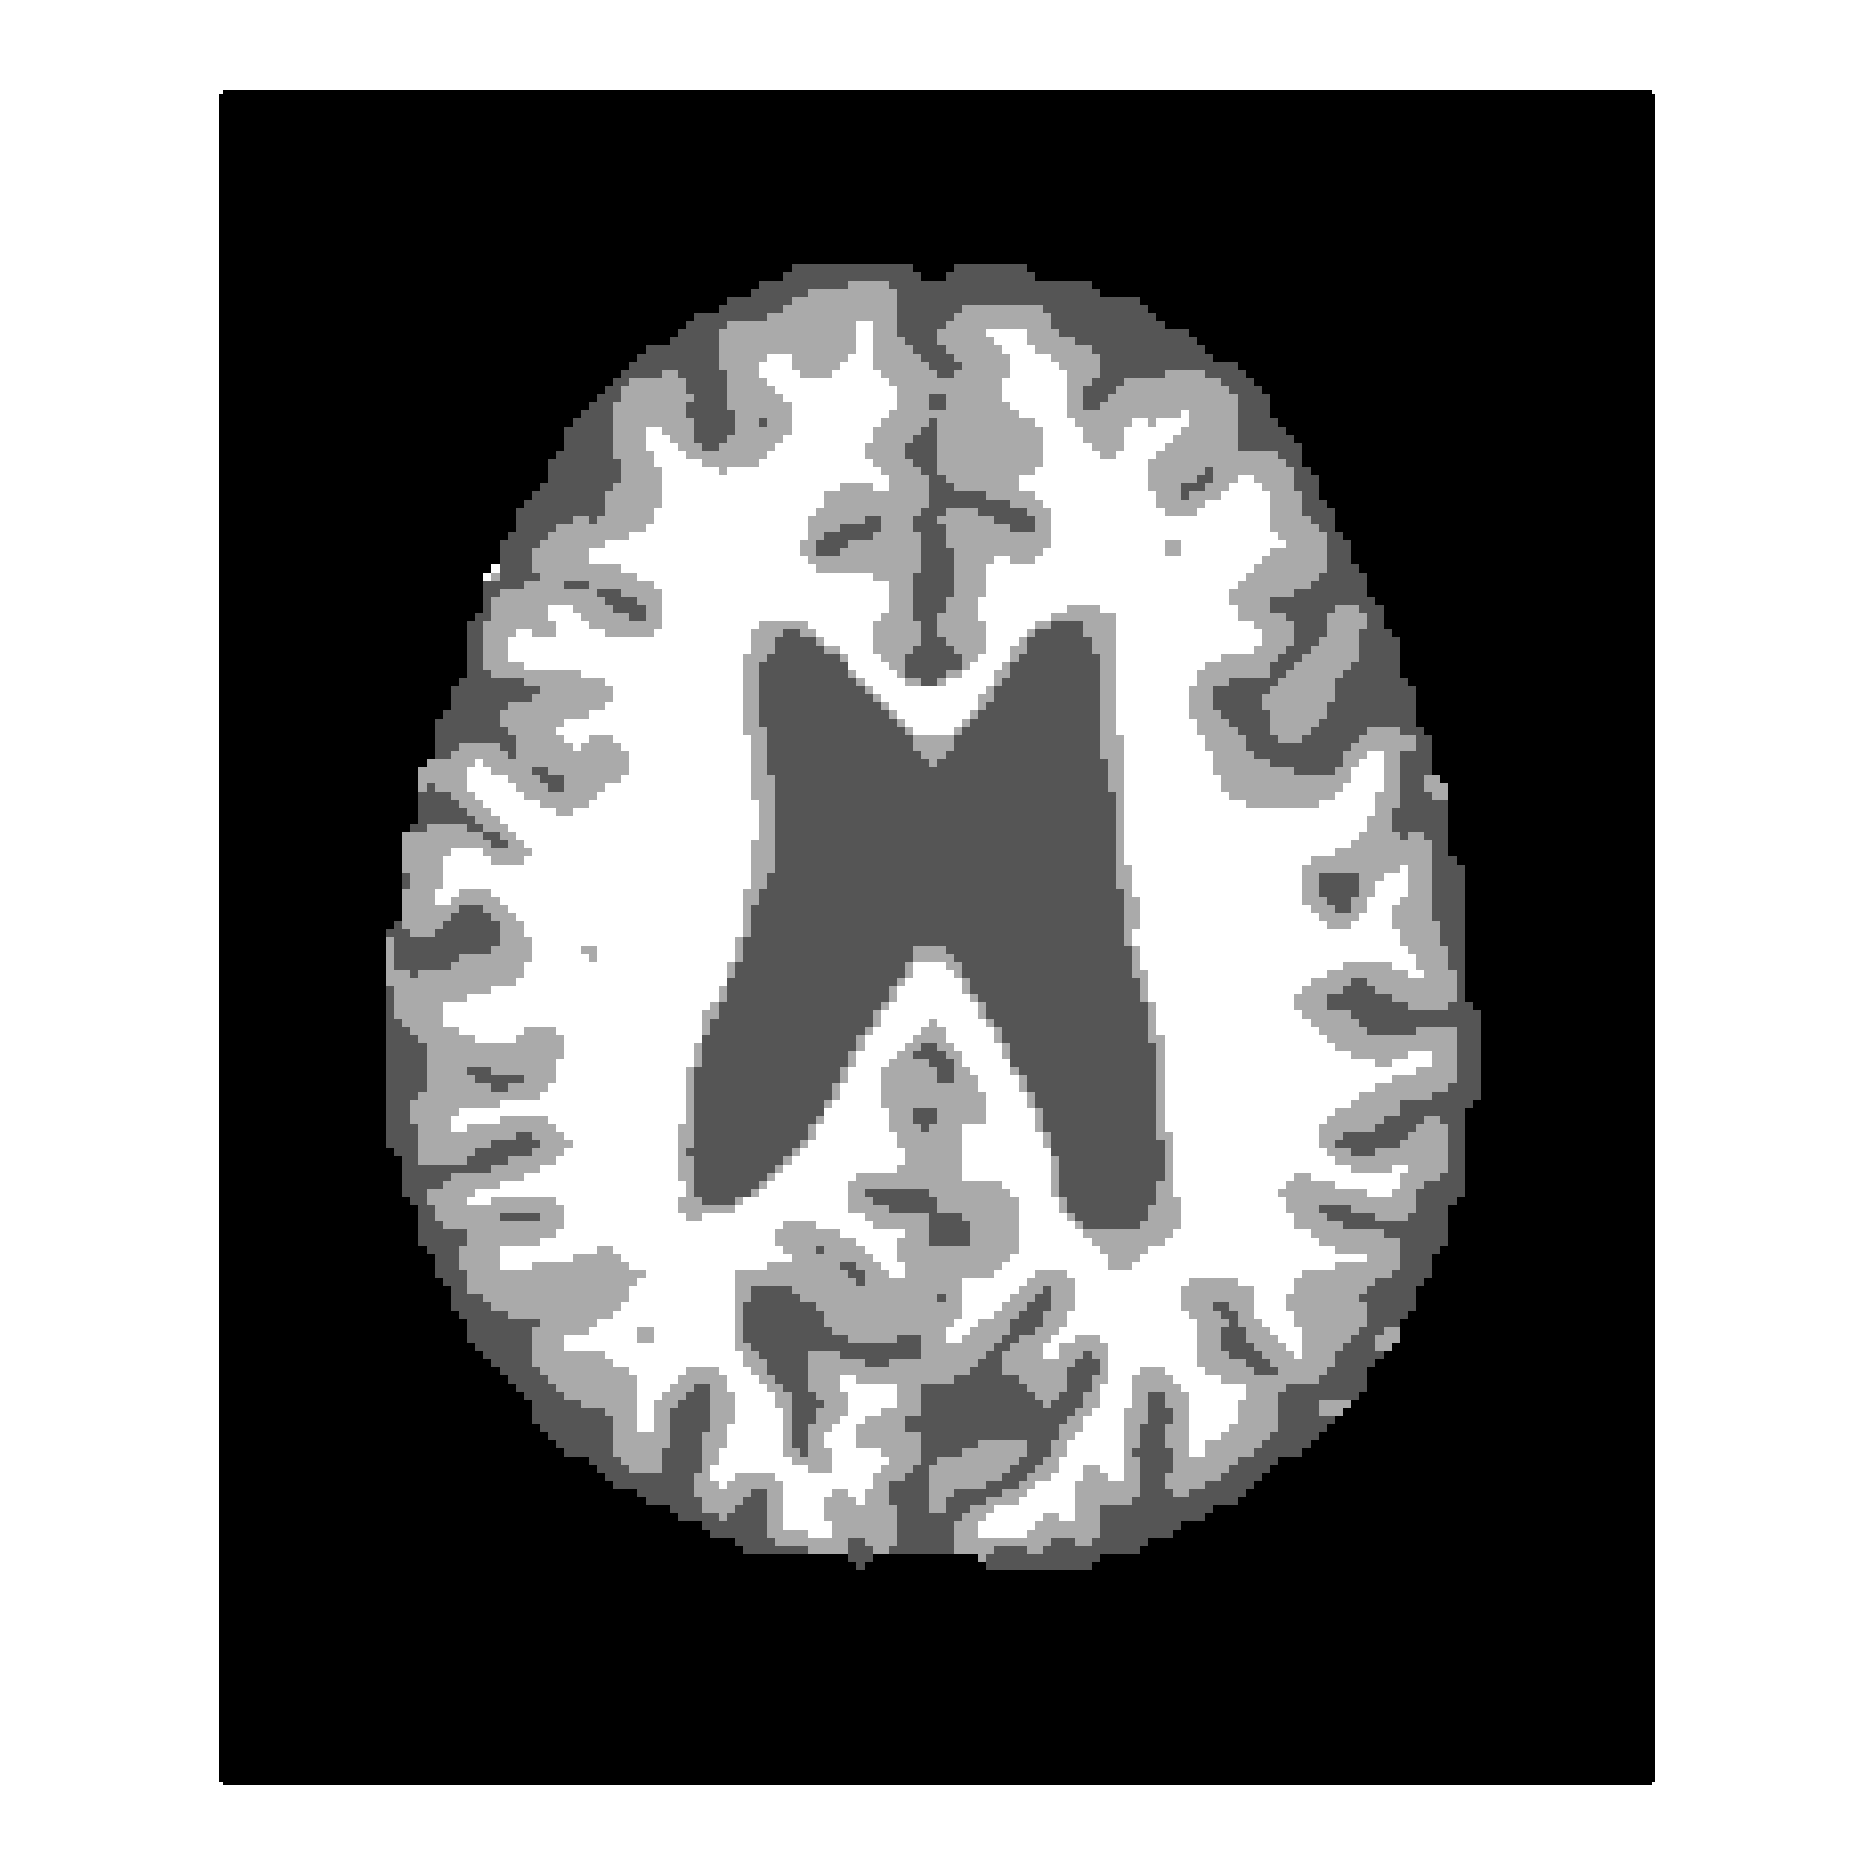
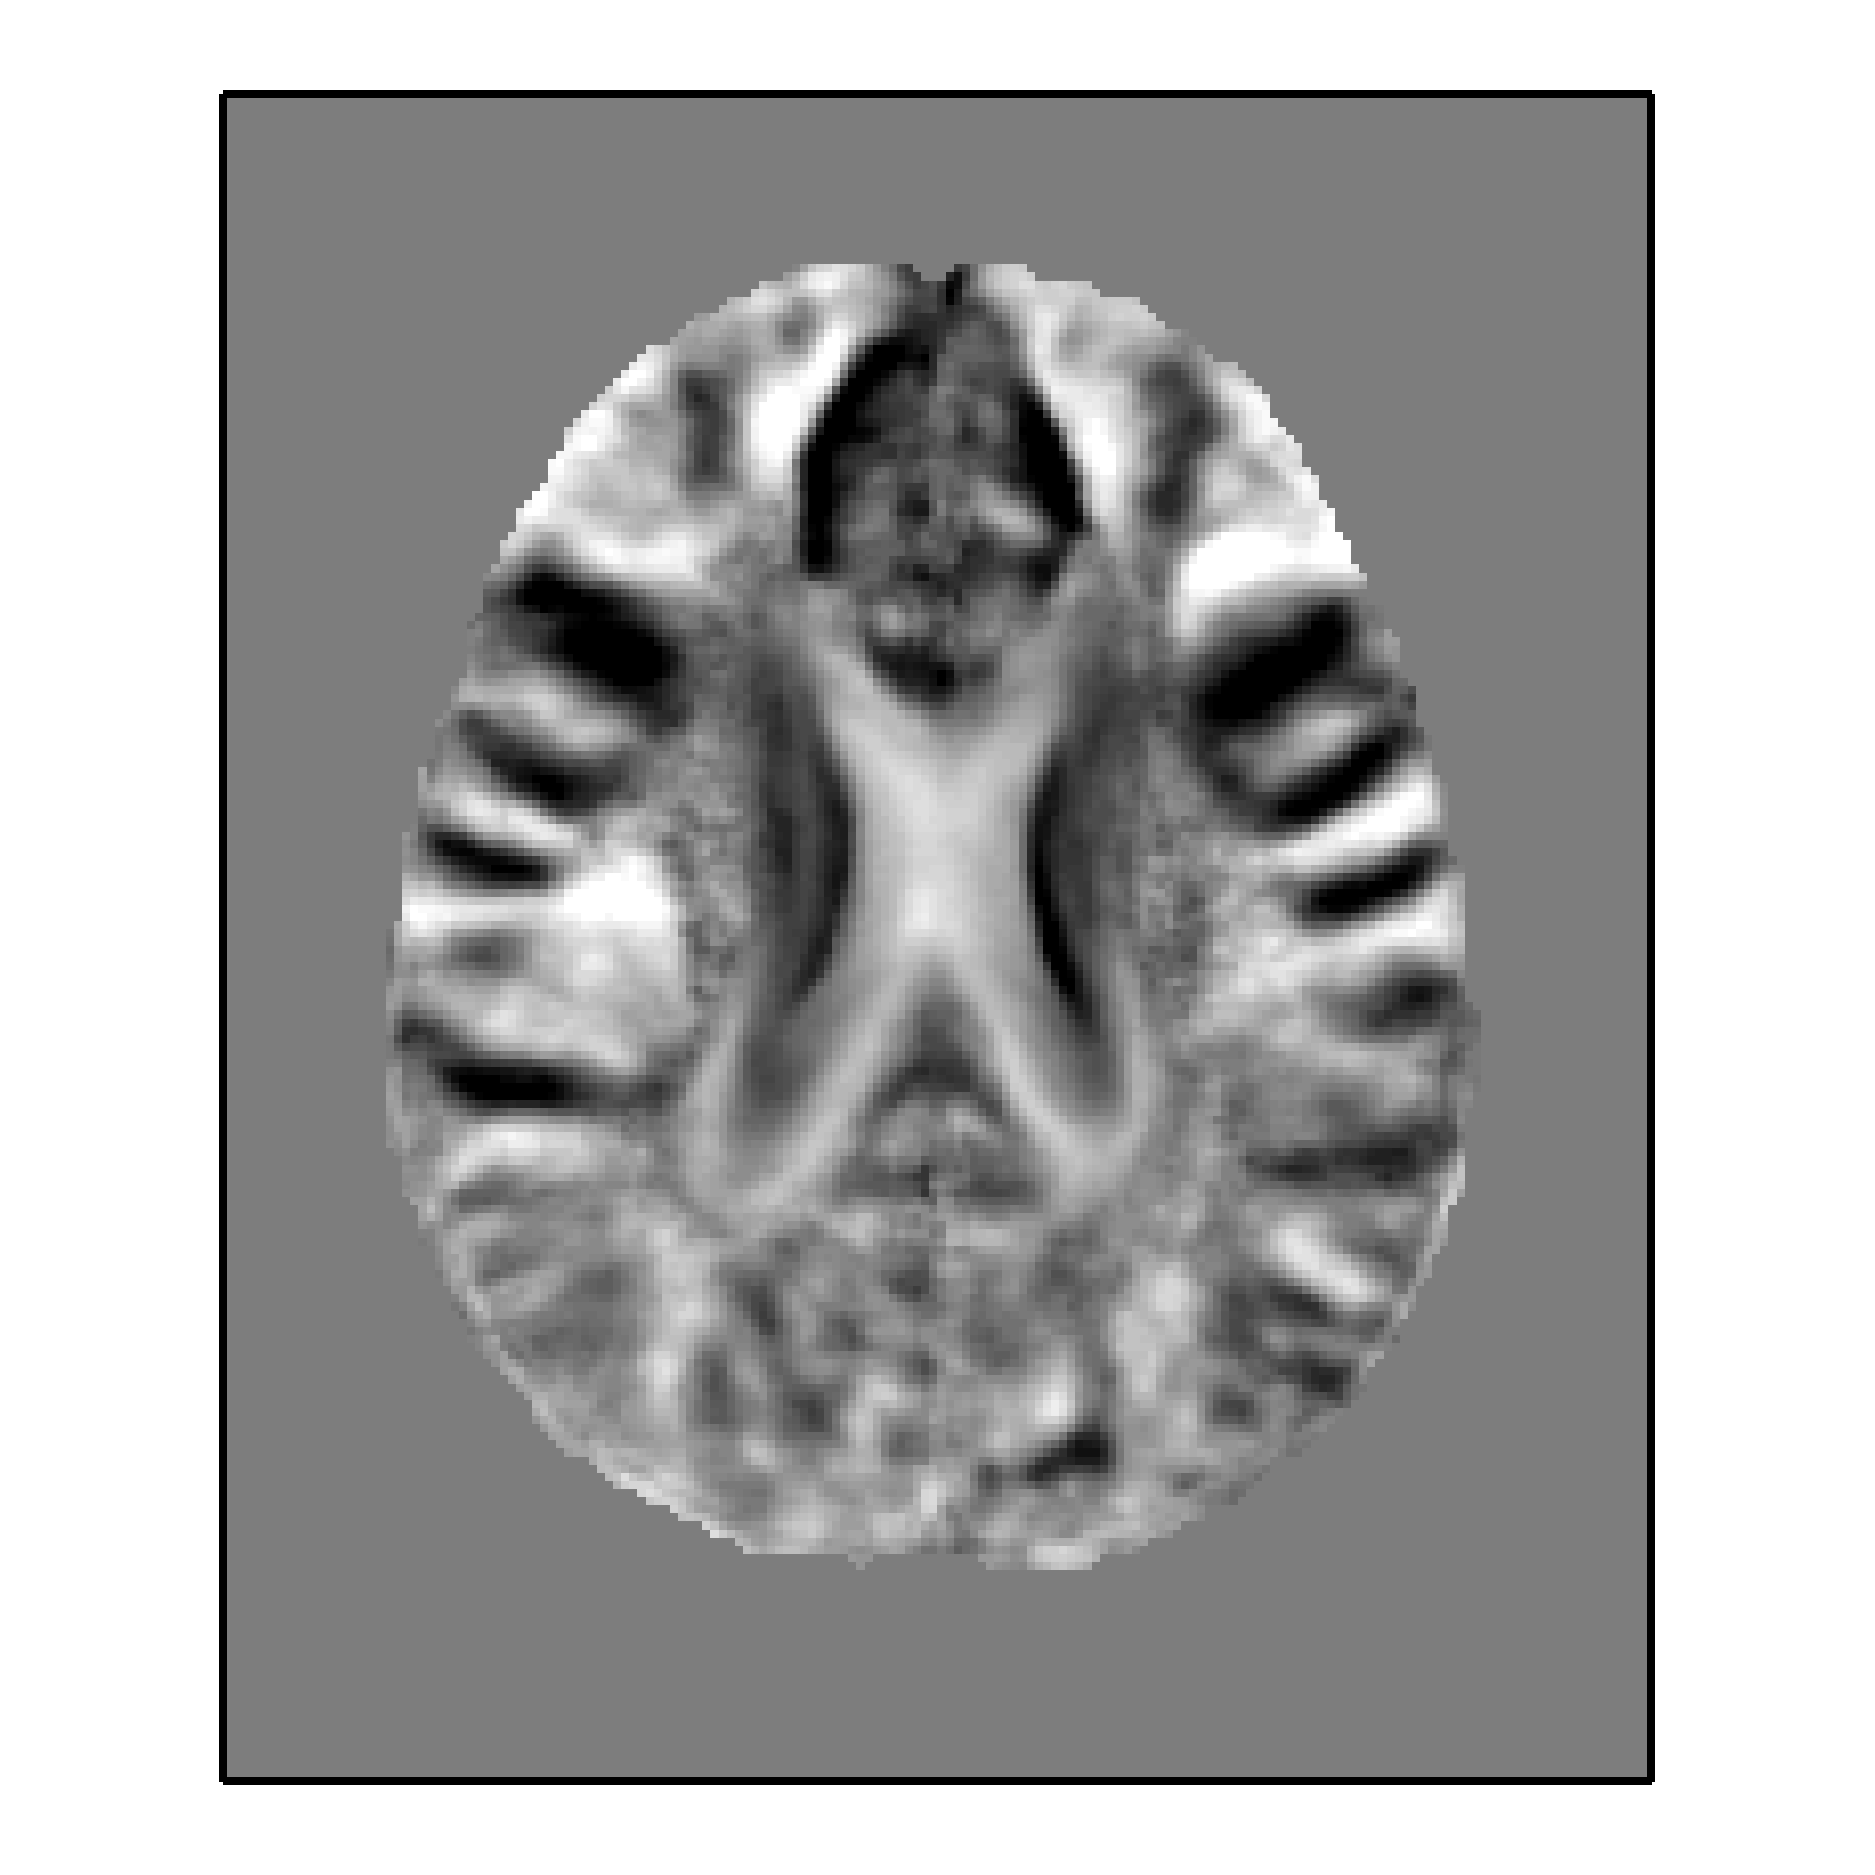
Using these methods, our feature set includes values for each subject, listed in table 1. All features are mean-subtracted and normalized by the variance of each feature. Lastly, we classify subjects with an CDR score greater than as as demented, and so of the subjects classified with dementia.
| No. | Feature | Source |
|---|---|---|
| 1 | Age | OASIS |
| 2 | Gender | OASIS |
| 3 | eTIV | OASIS |
| 4 | nBWV | OASIS |
| 5 | Total white matter | |
| 6 | Total gray matter | |
| 7 | Total CSF | |
| 8 | Up/down axial symmetry | Equation 1 |
| 9 | Left/right axial symmetry | Equation 1 |
| 10 | Coronal PCA coefficient | coefficient for component #4 (coronal) |
| 11 | Axial PCA coefficient | coefficient for component #7 (axial) |
4 Results
We compute training accuracy, test accuracy, recall, precision, and the Matthews correlation coefficient (MCC) to determine performance of the classifier. an MCC score of corresponds to random guessing, and to perfect classification. The classifiers are tested using 10-fold cross validation; the classifier is trained on of the dataset, and then tested on the remaining (roughly subjects), and this is repeated 10 times until every subject has been tested. The average value of performance metrics (e.g., precision) is reported here.
Using more than a single axial and coronal PCA component resulted in an increase in training accuracy with no corresponding increase in test accuracy, suggesting the classifier was over fit; therefore, only a single PCA component was used for the axial and coronal views.
Using the dimensionally reduced feature set (table 1), the SVM classifier performed with a training accuracy of () and testing accuracy of and () for a linear and (gaussian) kernel. The gaussian kernel is a radial basis function of the form , where was (or the inverse of the number of features [4]). The test precision and recall for each classifier was () and (), respectively. The Matthews correlation coefficient [12] for the linear and (gaussian) kernels was ().
In order to ensure the classifiers were not keying off the age feature alone, classifiers were also tested with a feature set that did not include age, and test accuracy decreased by %, indicating that the classifiers were indeed not solely keying off the age feature. Additionally, classifiers were run without the PCA components in the feature set, and recall decreased by () for each classifier, whereas the precision increased by for both classifiers; however, the MCC for each classifier excluding PCA components from the feature set reduced by (), indicating that including PCA coefficients did improve the performance of the classifiers.
Previous work [2] achieved testing accuracy of nearly by using voxel intensity values. Our classifiers do not perform as well, but there is no evidence of severe over fitting, which may make a dimensionally reduced feature attractive for classifying truly out-of-sample subjects.
5 Conclusions
We used an SVM with linear and gaussian kernels to classify for a non-zero CDR score in patients using a dimensionally reduced feature set. Dimensional reduction was accomplished through image segmentation and principal component analysis (decomposition into ’eigenbrains’). We achieved MCC values for our classifiers of approximately , and precision and recall of at least , with the gaussian kernel marginally outperforming the linear kernel indicated by the MCC score. Although performance of the classifier may not equal that of a non-reduced feature set, we have shown that a dimensionally reduced feature set does improve the computational tractability, and also does not over fit the training data, improving the generality of the classification technique.
Acknowledgements
We acknowledge the support for the OASIS project by grants P50 AG05681, P01 AG03991, R01 AG021910, P50 MH071616, U24 RR021382, R01 MH56584. Additionally, we would like to acknowledge Professor Andrew Ng for his lessons and insights into machine learning, and Professor Greg Zaharchuk for his guidance.
References
- Marcus et al. [2007] DS Marcus, TH Wang, and J Parker. Open Access Series of Imaging Studies (OASIS): cross-sectional MRI data in young, middle aged, nondemented, and demented older adults. Journal of Cognitive …, 2007. URL http://www.mitpressjournals.org/doi/abs/10.1162/jocn.2007.19.9.1498.
- Klöppel et al. [2008] Stefan Klöppel, Cynthia M Stonnington, Josephine Barnes, Frederick Chen, Carlton Chu, Catriona D Good, Irina Mader, L Anne Mitchell, Ameet C Patel, Catherine C Roberts, Nick C Fox, Clifford R Jack, John Ashburner, and Richard S J Frackowiak. Accuracy of dementia diagnosis: a direct comparison between radiologists and a computerized method. Brain : a journal of neurology, 131(Pt 11):2969–74, November 2008. ISSN 1460-2156. 10.1093/brain/awn239. URL http://www.pubmedcentral.nih.gov/articlerender.fcgi?artid=2577804\&tool=pmcentrez\&rendertype=abstract.
- Mwangi et al. [2012] Benson Mwangi, Klaus P Ebmeier, Keith Matthews, and J Douglas Steele. Multi-centre diagnostic classification of individual structural neuroimaging scans from patients with major depressive disorder. Brain : a journal of neurology, 135(Pt 5):1508–21, May 2012. ISSN 1460-2156. 10.1093/brain/aws084. URL http://www.ncbi.nlm.nih.gov/pubmed/22544901.
- Chang and Lin [2011] Chih-Chung Chang and Chih-Jen Lin. LIBSVM: A Library for support vector machines. ACM Transactions on Intelligent Systems and Technology, 2(3):1–27, 2011. URL http://www.csie.ntu.edu.tw/~cjlin/libsvm.
- Rubin et al. [1998] EH Rubin, M Storandt, and JP Miller. A prospective study of cognitive function and onset of dementia in cognitively healthy elders. Archives of …, 1998. URL http://archneur.ama-assn.org/cgi/reprint/55/3/395.pdf.
- Morris [1993] JC Morris. The Clinical Dementia Rating (CDR): current version and scoring rules. Neurology; Neurology, 1993. URL http://psycnet.apa.org/psycinfo/1994-19989-001.
- Buckner [2004] RL Buckner. A unified approach for morphometric and functional data analysis in young, old, and demented adults using automated atlas-based head size normalization:. Neuroimage, 2004. URL http://www.miba.auc.dk/~06gr1088d/artikler/Pdf/Aunifiedapproachformorphometricandfunctionaldataanalysisin..Normalization.pdf.
- Fotenos et al. [2005] AF Fotenos, AZ Snyder, and LE Girton. Normative estimates of cross-sectional and longitudinal brain volume decline in aging and AD. Neurology, 2005. URL http://www.neurology.org/content/64/6/1032.short.
- Zhang et al. [2001] Y Zhang, M Brady, and S Smith. Segmentation of brain MR images through a hidden Markov random field model and the expectation-maximization algorithm. Medical Imaging, IEEE …, 2001. URL http://ieeexplore.ieee.org/xpls/abs\_all.jsp?arnumber=906424.
- Turk and Pentland [1991] M Turk and A Pentland. Eigenfaces for recognition. Journal of cognitive neuroscience, 1991. URL http://www.mitpressjournals.org/doi/abs/10.1162/jocn.1991.3.1.71.
- Stout and Jernigan [1996] JC Stout and TL Jernigan. Association of dementia severity with cortical gray matter and abnormal white matter volumes in dementia of the Alzheimer type. Archives of Neurology, 53(8):742–749, 1996. 10.1001/archneur.1996.00550080056013. URL http://archneur.ama-assn.org/cgi/reprint/53/8/742.pdf.
- Baldi et al. [2000] Pierre Baldi, Sø ren Brunak, Yves Chauvin, Claus A F Andersen, and Henrik Nielsen. Assessing the accuracy of prediction algorithms for classification: an overview. Bioinformatics, 16(5):412–424, 2000.