Constraints for the Progenitor Masses of 17 Historic Core-Collapse Supernovae
Abstract
Using resolved stellar photometry measured from archival HST imaging, we generate color-magnitude diagrams of the stars within 50 pc of the locations of historic core-collapse supernovae that took place in galaxies within 8 Mpc. We fit these color-magnitude distributions with stellar evolution models to determine the best-fit age distribution of the young population. We then translate these age distributions into probability distributions for the progenitor mass of each SNe. The measurements are anchored by the main-sequence stars surrounding the event, making them less sensitive to assumptions about binarity, post-main-sequence evolution, or circumstellar dust. We demonstrate that, in cases where the literature contains masses that have been measured from direct imaging, our measurements are consistent with (but less precise than) these measurements. Using this technique, we constrain the progenitor masses of 17 historic SNe, 11 of which have no previous estimates from direct imaging. Our measurements still allow the possibility that all SNe progenitor masses are 20 M⊙. However, the large uncertainties for the highest-mass progenitors also allow the possibility of no upper-mass cutoff.
Subject headings:
Supernovae —1. Introduction
A fundamental question of stellar evolution theory is which stars end their lives as supernovae. Current theory for isolated massive stars makes two basic predictions for SNe. For one, the zero-age-main-sequence mass (MZAMS) and mass-loss history control whether a SN occurs, and secondly, for single stars there is a clear mapping between MZAMS and the type of SN (Woosley et al., 2002; Heger et al., 2003; Dessart et al., 2011). In particular, the lower masses explode with their hydrogen envelopes intact (e.g. II-P, II-L, IIn), and the most massive stars lose much of their envelopes and explode as hydrogen deficient SNe (e.g. IIb, Ib/c). However, given the complexity of the underlying physics, especially binary evolution, winds, and episodic eruptions, it is unclear whether nature obeys the same well-delineated mass-dependence.
In fact,the relatively high observed rates of H-deficient SNe (Smith et al., 2011b) and low upper limits on progenitor masses of Type Ibc SNe (Yoon et al., 2012; Eldridge et al., 2013) imply that binary evolution may figure prominently in producing the H-deficient SNe. Furthermore, theory predicts that binary evolution can significantly affect the mapping between initial stellar mass as SNe type (e.g., Podsiadlowski et al., 1992; Tutukov et al., 1992; Nomoto et al., 1995; De Donder & Vanbeveren, 1998; Yoon et al., 2010; Claeys et al., 2011; Dessart et al., 2011; Eldridge et al., 2011). It is clear that progress in understanding both mass loss and SNe requires observational constraints linking the progenitor mass with the eventual SN.
Unfortunately, of the dozens of SNe that have progenitor mass limits, only 17 have masses measured from a directly detected progenitor (6 of these 17 overlap this work). Smartt (2009) reviewed the mass distribution of 30 core-collapse SNe progenitors (20 type IIP and 10 others), but only eight of these had measurements beyond an upper limit. At that point, there were also 4 other nearby SNe progenitors with full mass constraints (Woosley, 1988; Aldering et al., 1994; Crockett et al., 2008; Fraser et al., 2010), bringing the total to 12. Since 2009, 5 additional SNe have been measured (Maund et al., 2011; Murphy et al., 2011; Fraser et al., 2012; Van Dyk et al., 2012a; Maund et al., 2013; Fraser et al., 2013; Van Dyk et al., 2014), and some measurements improved (Van Dyk et al., 2012b; Maund et al., 2014) making the total 17 measurements.
These mass estimates are based on serendipitous direct imaging of the progenitor. First, one searches through the HST archive for bright evolved stars at the SN position. Then, if a star is found, the endpoints of stellar evolution models which pass through the color and magnitude of the likely progenitor are used to estimate the star’s initial main sequence mass. If a star is not found, an upper limit on the progenitor luminosity is measured.
Even with the limited number of measurements available, there is a hint of a minimum MZAMS for explosion and that the least massive stars explode as SN II-P (Smartt et al., 2009). Interestingly, these measurements also suggested that the maximum mass for SN II-P may be lower than expected, with some perhaps having been merged binaries (Smartt et al., 2009), although circumstellar dust may also explain the observations (Walmswell & Eldridge, 2012). Counter to expectations, some H-rich SNe (in particular IIn) have been associated with very massive stars (Gal-Yam & Leonard, 2009; Smith et al., 2011a, b). While tantalizing, these initial results are poorly constrained, and even the simple 8 M⊙ lower mass limit requires more observational constraints.
While direct imaging of progenitors is the standard method for progenitor mass estimation, it suffers from a number of limitations. First among these is the requirement that the precursor imaging actually exist. The majority of past SNe have neither pre-existing HST imaging, nor sufficiently accurate astrometry. Consequently, of the historic SNe within Mpc, only a handful have identified progenitors. Some future nearby SNe may also lack precursor imaging due to the limited observations in the HST archive.
The second major limitation is that even when precursor imaging is available, interpretation of that imaging depends on modeling of the most uncertain stages of stellar evolution (Gallart et al., 2005; Smartt et al., 2009; Yoon & Cantiello, 2010; Langer, 2012; Eldridge et al., 2013). Existing studies estimate the mass of a precursor by fitting endpoints of stellar evolution models to its color and magnitude; however, an evolved star’s appearance is not well constrained during the final evolutionary stages. Binarity, mass loss, pulsation, internal mixing, the formation of dust in stellar winds, and convective instabilities in shell-burning layers all contribute to systematic and random uncertainties in such model endpoints. Matching individual endpoints of stellar evolution models to a single highly-evolved star on the brink of explosion therefore places weak constraints on the stellar mass once systematic uncertainties are taken into account.
In this paper, we take a complementary approach that obviates both of these limitations. We build on a technique developed by several investigators over the past two decades, starting with measuring ages for host star clusters (Efremov, 1991; Walborn et al., 1993; Panagia et al., 2000; Barth et al., 1996; Van Dyk et al., 1999; Maíz-Apellániz et al., 2004; Wang et al., 2005; Vinkó et al., 2009; Crockett et al., 2008), moving into finding coeval field populations around both SNe and supernova remnants Badenes et al. (SNRs; 2009); Gogarten et al. (SNRs; 2009a); Murphy et al. (SNRs; 2011); Jennings et al. (SNRs; 2012). We note that, while we have applied this approach to many SNR locations, historic SNe are less numerous, but more reliable, targets because they have well-established locations and types, ensuring that every progenitor mass corresponds to a bona fide core-collapse event.
The technique finds the masses of SNe precursors by analyzing the stellar populations of stars surrounding the SNe. Using well-established techniques of stellar population modeling, we can age-date the star formation (SF) event that led to each SN. The resulting age places strong constraints on the mass of the precursor, using the well-understood properties of main-sequence stars. As a result, in cases where the specific stellar population can be identified, our technique provides a more reliable progenitor age than direct imaging, as it does not depend on whether the progenitor was a single star or a binary. Furthermore, the method works even when there is no imaging prior to the SN, or when the SN position is only localized to within a few arcseconds. Hence our technique can be applied to the location of any historic SN that has sufficiently high-resolution and deep imaging to measure resolved stellar photometry of the upper main sequence and/or He-burning sequence.
In § 2, we discuss our sample, the data analyzed in our study, detail our analysis technique, and demonstrate its efficacy in test cases. In §3, we provide our results in the form of age distributions, a table of masses, and a table of probability distributions for each progenitor. Finally, § 4 gives a summary of our findings.
2. Data
2.1. Sample
We selected all positively-typed historic core-collapse SNe within that also have arcsecond accuracy in their positions from the Asiago Supernova Catalog (Barbon et al., 1999); higher positional accuracy is not needed, due to the large size of the aperture within which the CMD is constructed.111One arcsec corresponds to 5 pc for every Mpc of distance. We have shown in Murphy et al. (2011) that our method provides results consistent with direct progenitor detections (as confirmed by Van Dyk et al., 2013) in galaxies as distant as 8 Mpc. Beyond this limit, our method is not tested, and therefore we have confined our sample to be within this distance.
We cross-referenced the SNe catalog with the HST archive and identified SNe that have HST imaging in at least 2 broadband filters in ACS, WFPC2, or UVIS. Even relatively shallow data can provide constraints given that, for the most massive 50 M⊙ progenitors, the surrounding populations are likely to have other very massive stars with M5. We found 22 SNe that match these requirements. Another SN, 2011dh, has already been analyzed by our technique in Murphy et al. (2011). Of our sample there are two that are possibly SN impostors. These are SN1954J (Smith et al., 2001) and SN2002kg (Weis & Bomans, 2005). We still include these impostors because the classification as SN impostors are not definitive and it is likely that these transients are associated with the last stages of stellar evolution, in which our proposed method to derive progenitor masses is still of interest. Table 1 shows these SNe for which we can attempt to derive the SFH and progenitor mass, along with the proposal ID for the dataset used for out photometry.
There were five SNe which we attempted to analyze, but were not able to constrain with confidence. These had relatively shallow data for quite distant events (SN 1980K, SN1985F, SN2002ap, SN2002bu, and SN2003gd) with fewer than 5 stars detected within a 50 pc physical radius. We do not consider these due to the sparsity of data, although it is likely that deeper imaging of these locations would yield photometry that would result in reliable mass estimates. However it is also possible these progenitors were runaway stars exploding some distance from their co-eval population (c.f., Eldridge et al., 2011).
2.2. Analysis Method
Our method has been described in several other publications, including its application to SN 2011dh (Murphy et al., 2011), 121 SN remnants (SNRs) in M31 and M33 (Jennings et al., 2012, 2013), and an unusual transient in NGC 300 (Gogarten et al., 2009b). We provide a description of the method here as well for convenience.
In brief, we fit SFHs to CMDs of the population surrounding the site of the SN to determine the age, and thus mass, of the SN progenitor. The measurements are anchored by the main-sequence stars surrounding the event; thus, our age estimates do not depend on whether a binary or single-star progenitor is assumed. Furthermore, the measurements are not sensitive to any circumstellar dust present around the progenitor itself.
In the following subsections we first summarize how well the method works and provide a proof of concept. Then we detail how our photometry was performed, how the stellar samples were generated, and how their age distributions were derived.
2.2.1 Overview
The method takes advantage of the fact that most stars form in stellar clusters (Lada & Lada, 2003) with a common age () and metallicity. Indeed, over 90% of stars form in rich clusters containing more than 100 members with M⊙ (Lada & Lada, 2003). The stars that formed in a common event remain spatially correlated on physical scales up to during the lifetimes of M⊙ stars, even if the cluster is not gravitationally bound (Bastian & Goodwin, 2006); we have confirmed this expectation empirically in several test cases (Gogarten et al., 2009b; Murphy et al., 2011). Thus, it is reasonable to assume that most young stars within a 50 parsecs of many SN are coeval. However, we note that our assumption breaks down for SNe from runaway stars (Eldridge et al., 2011), which would not be coeval with their surrounding population.
The age of a SN’s host stellar population can be recovered from its color-magnitude diagram (CMD). In the simplest method, one can fit a single isochrone to an observed CMD and estimate the turnoff mass of the youngest stars. However, due to the small numbers of massive stars, one can easily underestimate the mass, since CMDs can show an apparent turnoff that is fainter than the true turnoff luminosity simply because of poor Poisson sampling of the upper end of the IMF. Instead, we adopt more sophisticated methods that take advantage of the entire CMD. These methods fit superpositions of stellar populations to reproduce the observed CMD, using the recovery of artificial stars to generate realistic distributions of stars from theoretical isochrones. The recovered recent SFH therefore fits not just the turnoff luminosity, but the full luminosity function of the main sequence and the blue and red core Helium-burning sequences as well. Including the well-populated lower end of the main sequence adds significant statistical weight when interpreting the sparsely sampled population of massive upper main sequence stars.
The method allows dust extinction to be reliably taken into account. The main sequence has a well defined color, such that any shift towards redder colors must be produced by foreground reddening, allowing the dust extinction to be inferred from the CMD itself. Differential extinction can be constrained as well, using the observed widening of the main sequence over what is expected from photometric errors. The resulting reddening constraints are dominated by the young stars in which we are most interested.
2.2.2 Method Validation
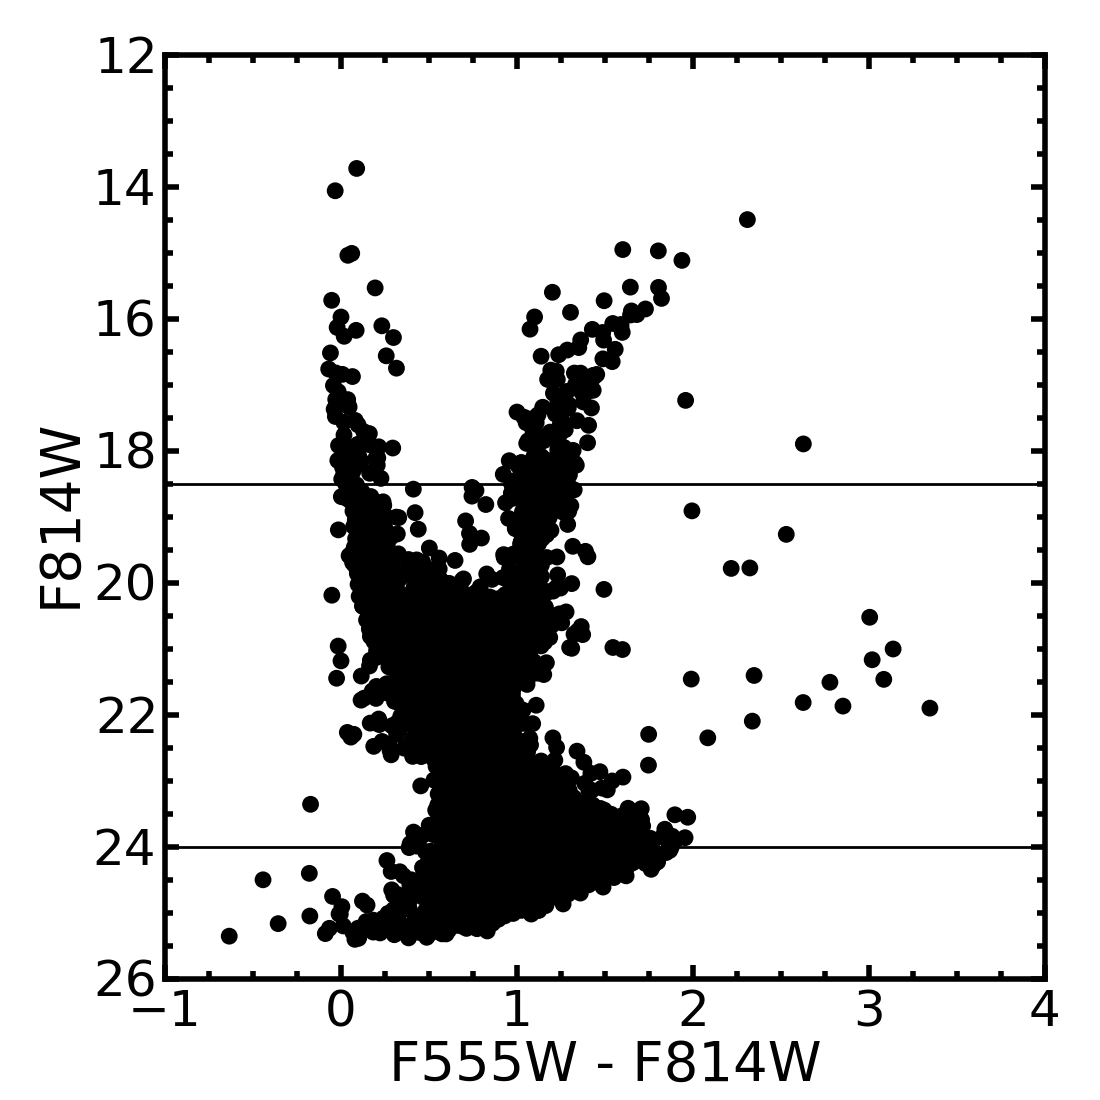
An example of the efficacy of the method is in its application to SN 1987A. We have run our model fits on deep WFPC2 photometry measured from the archival data of proposal ID 7434 (PI: Kirshner). We fit the F555W-F814W CMD in the range 12F814W25 as shown in Figure 1, and get a well-constrained median (22.0 M⊙), which is consistent with the mass (19 M⊙) derived in direct imaging studies (Woosley & Phillips, 1988), and with the combined mass of the binary merger scenario (16319; Podsiadlowski et al., 1990, 1992). This comparison between techniques provides strong verification of our proposed method.
While this test is encouraging, the data for 1987A is significantly deeper than that of our more distant objects. Two more tests, however, suggest that our technique works even with much shallower data. First, we ran our model fits on 1987A only including the photometry for stars brighter than apparent magnitude of 18.5 (absolute magnitude of 0), comparable to the depth of most of our more distant targets. The resulting median mass was more poorly constrained (22.8 M⊙), but was still consistent with the known mass. Thus, we may lose precision with shallower data, but we can still obtain useful constraints.
In addition to our tests on SN 1987A, we have verified our technique out to 8 Mpc by applying it to SN 2011dh in M51 (Murphy et al., 2011), for which we found a progenitor mass of 13 M⊙. Maund et al. (2011) identified a progenitor in archival HST images, which has since vanished (Van Dyk et al., 2013), and fit the bolometric luminosity to stellar-evolution models and derived a progenitor mass of 13 M⊙, consistent with our constraints.
2.3. Resolved Stellar Photometry
To generate the CMD, we measure resolved stellar photometry of the HST field containing the location of the historic SN. This photometry was performed using the packages HSTPHOT (for WFPC2 data) or DOLPHOT (Dolphin, 2000, for ACS data;). These packages perform point spread function fitting optimized for the undersampled flat-fielded images that come from HST. All of the photometry we use has been publicly released to the High-Level Science Products in the HST archive through the ANGST and ANGRRR programs (GO-10915 and AR-10945; PI: Dalcanton). The details of the fitting and culling parameters used are provided in Dalcanton et al. (2009) and the ANGRRR public data archive 222https://archive.stsci.edu/prepds/angrrr/. As part of these programs, hundreds of thousands of artificial star tests were also performed to assess completeness and photometric accuracy. These tests consist of inserting a single star into the data, rerunning the the data reduction, and assessing whether the fake star was recovered, and if so, how close its measured brightness was to the input brightness.
2.3.1 CMD Sample Selection
To isolate the subset of stars from our catalogs that were co-spatial with the historic supernovae, we used the coordinates for the SNe from the Asiago Supernova Catalog (Barbon et al., 1999), and galaxy distances from Dalcanton et al. (2009). We corrected the astrometry in our catalogs by cross-correlating 2MASS positions for the bright stars in our catalogs with our positions. Our catalog astrometry is then corrected such that the star positions agree with those of 2MASS as precisely as our centroiding for these bright stars will allow (typically 0.1′′). This correction to our catalog astrometry made sure that our positions were at least as precise as those in the SNe catalog (within a few tenths of an arcsecond).
With the location and the distance well-measured, we were able to pull stars measured within a projected radius of 50 pc of each SNe. In the most distant cases, this radius is only a bit more than 1 arcsecond, making the necessary precision of astrometry only 1′′.
To provide fake star statistics for the photometric completeness and precision appropriate to our sample, we required a minimum of ten thousand fake stars into our images. To reach this number, we included fake stars from a region of up to a factor of 7 larger than the real stars. In fields where the quality of the data varies quickly with position, such as near the center of M82, we applied additional computing resources to obtain more artificial star tests within the same radius as the stellar sample. However, for almost all of our fields, changes in stellar density, and therefore photometric quality, were small over the field, making it possible to use a large suite of artificial star tests to improve statistics on our CMD fitting.
2.3.2 CMD Fitting
Our CMD fitting process was very similar to that performed in Jennings et al. (2012). We used the CMD-fitting package MATCH (Dolphin, 2002, 2013) to fit each CMD with the stellar evolution models of Girardi et al. (2002) with updates in Marigo et al. (2008) and Girardi et al. (2010). The package allows models to be shifted in temperature and luminosity space to mimic systematic uncertainties, and it allows differential extinction to be applied to the models during fitting.
First, we determined the best-fitting amount of differential extinction to apply when fitting each SN. We fitted the data with a grid of values for the differential extinction () and foreground extinction AV. We chose the value that provided the best fit to the data without requiring an value below the known foreground extinction from Schlegel et al. (1998). We show an example plot summarizing this extinction determination method in Figure 2.
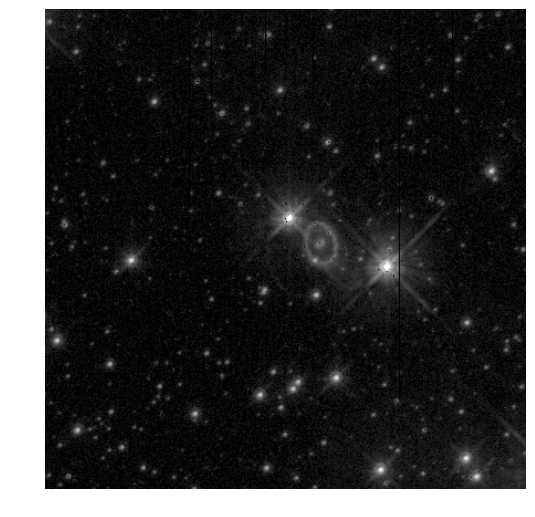
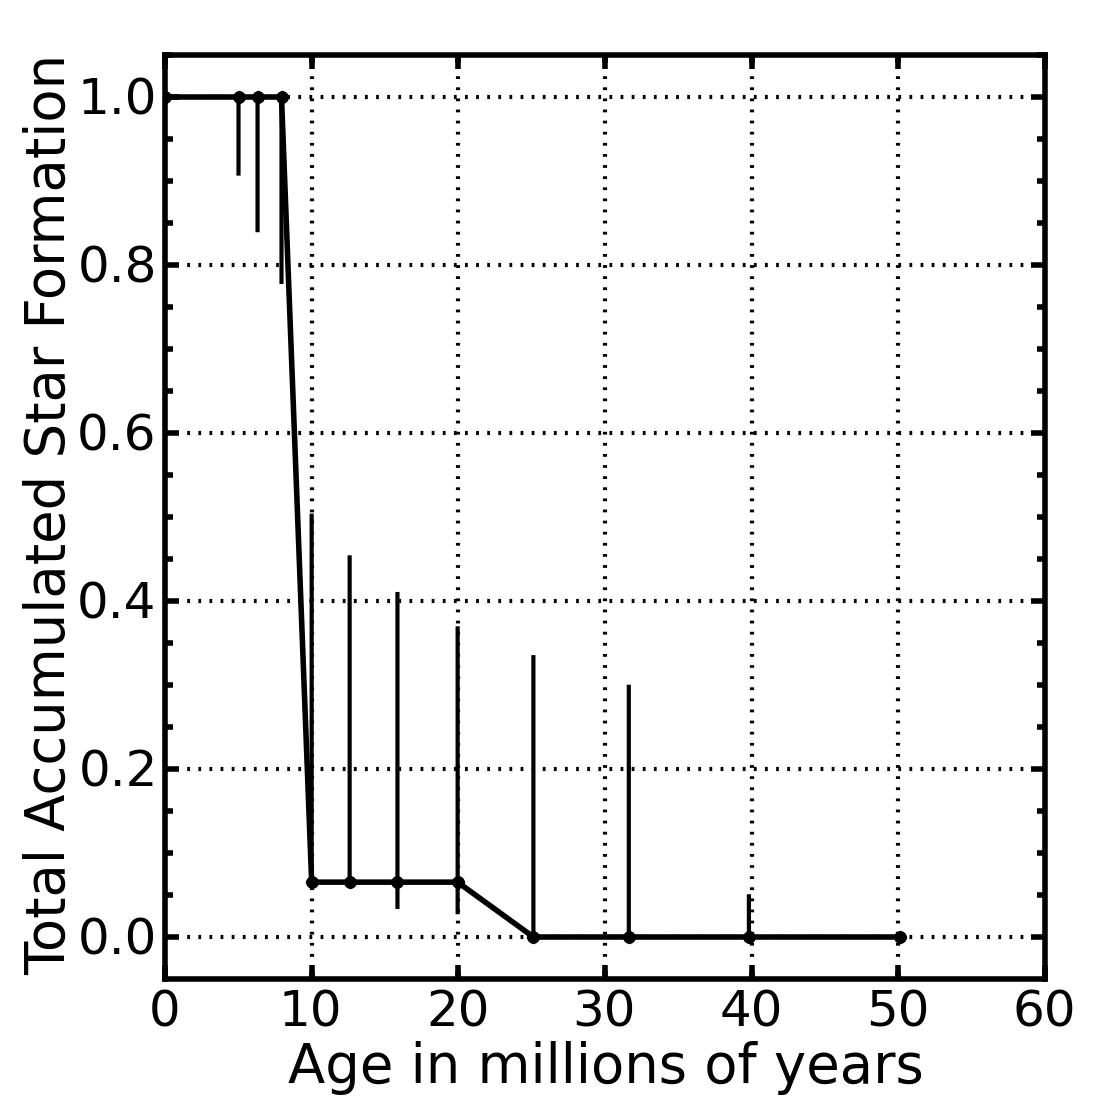
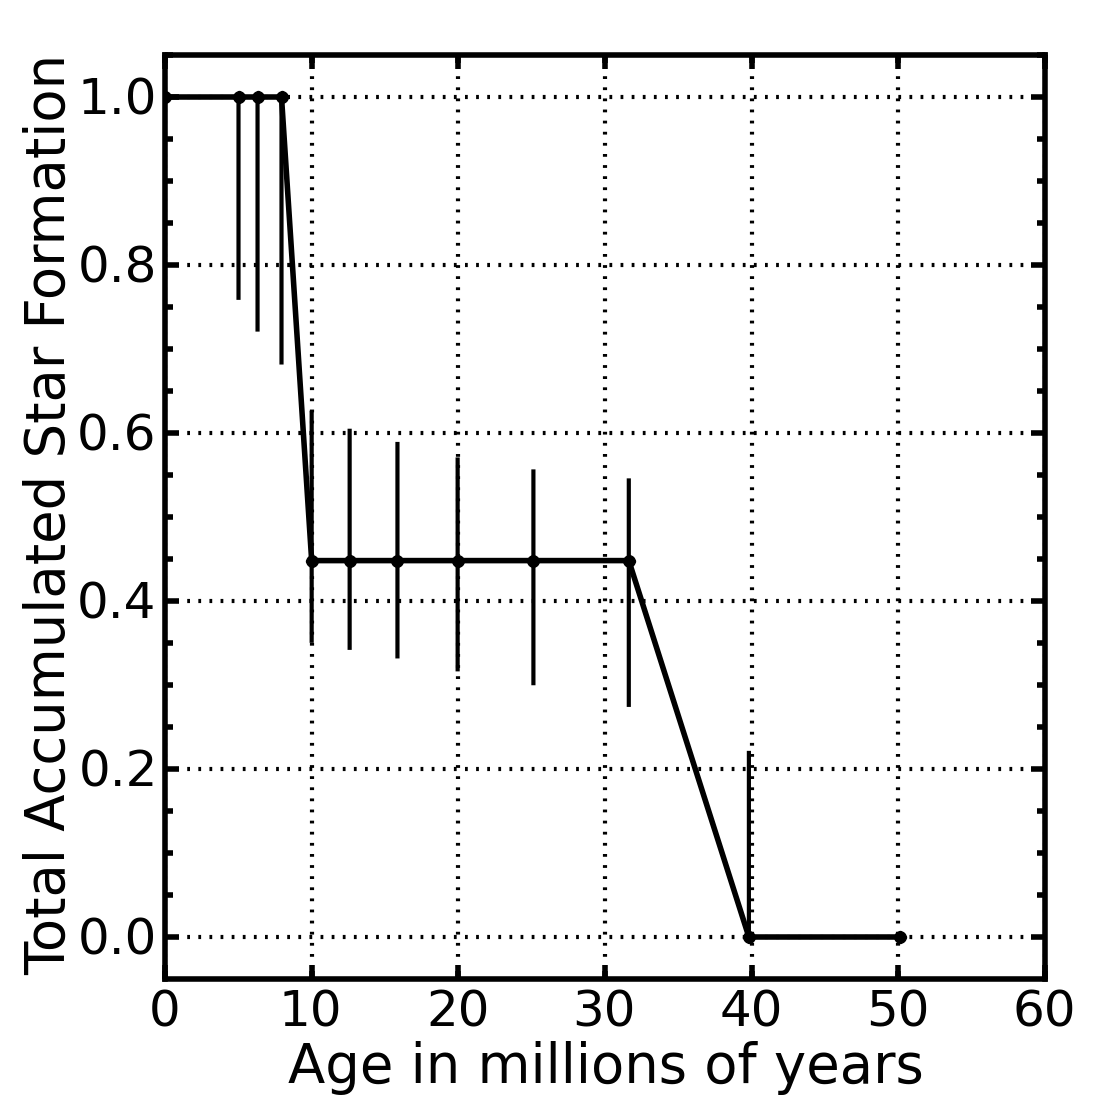
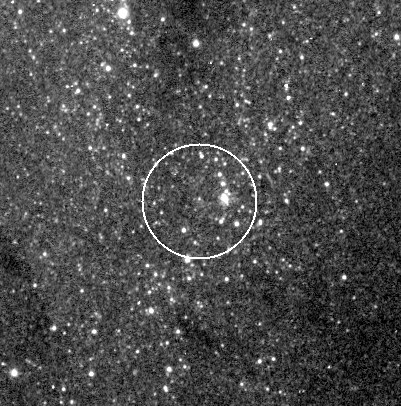
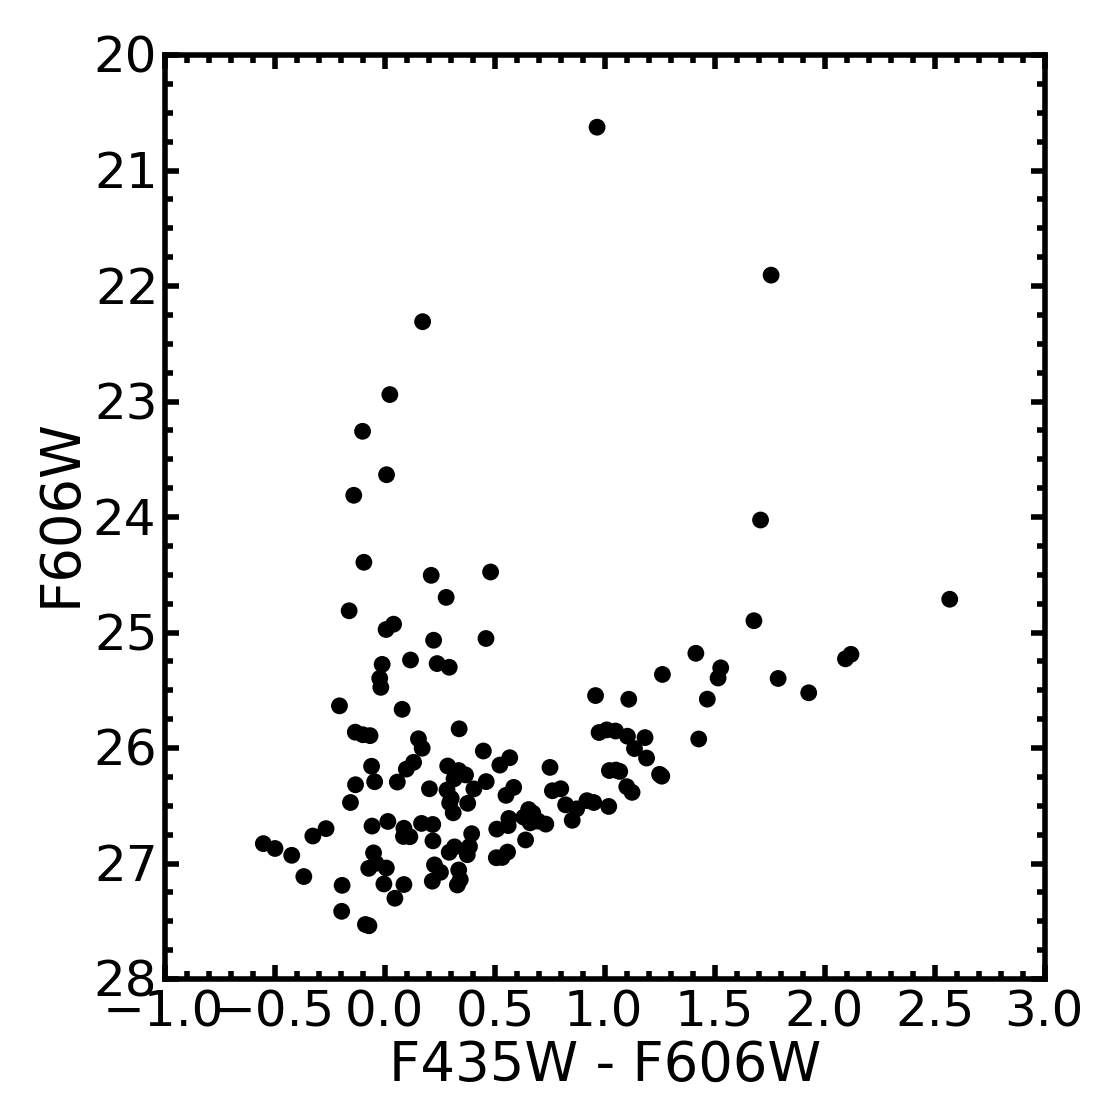
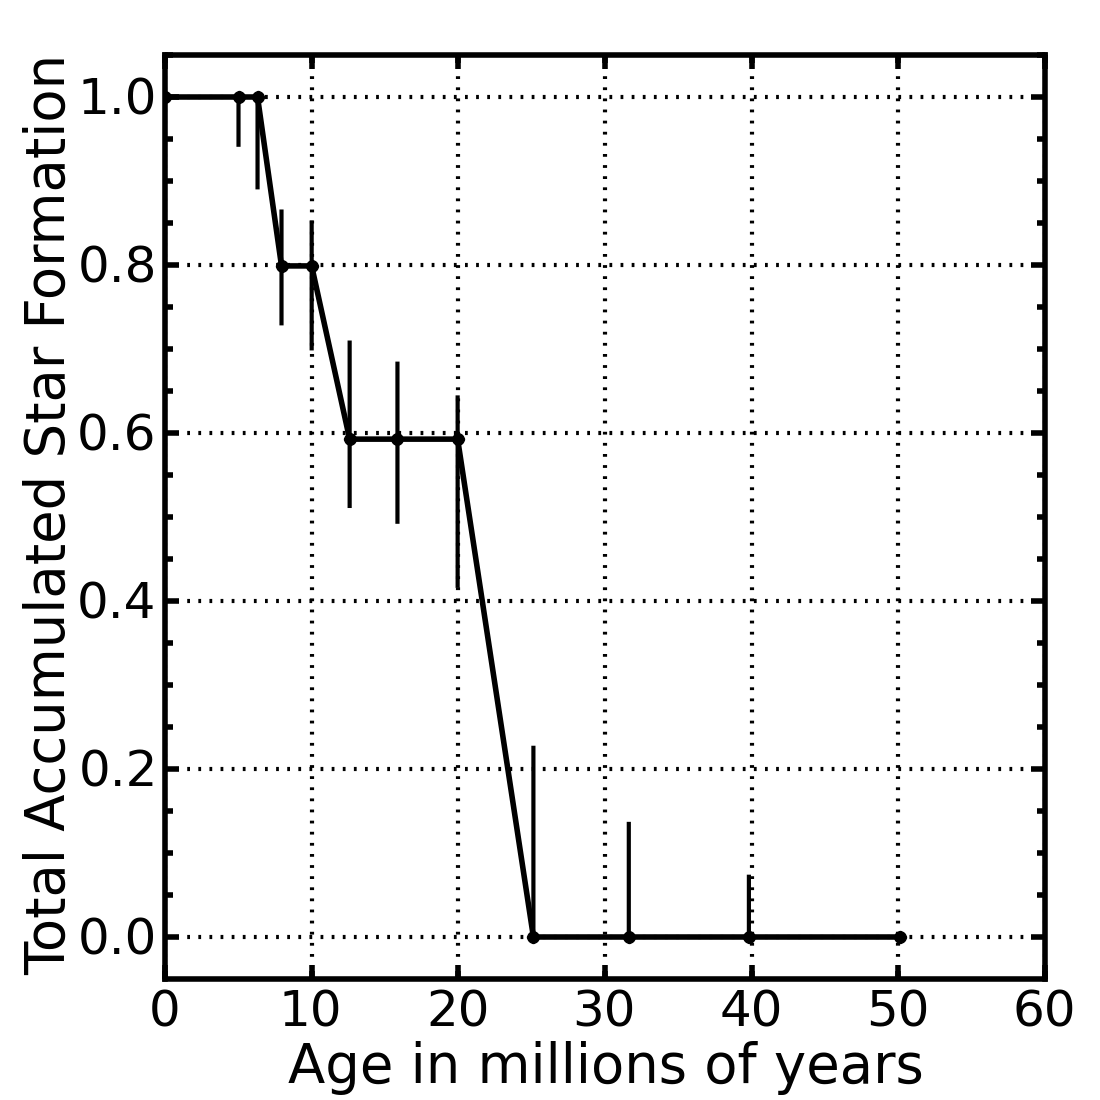
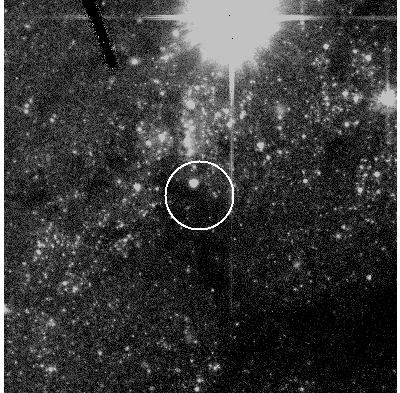
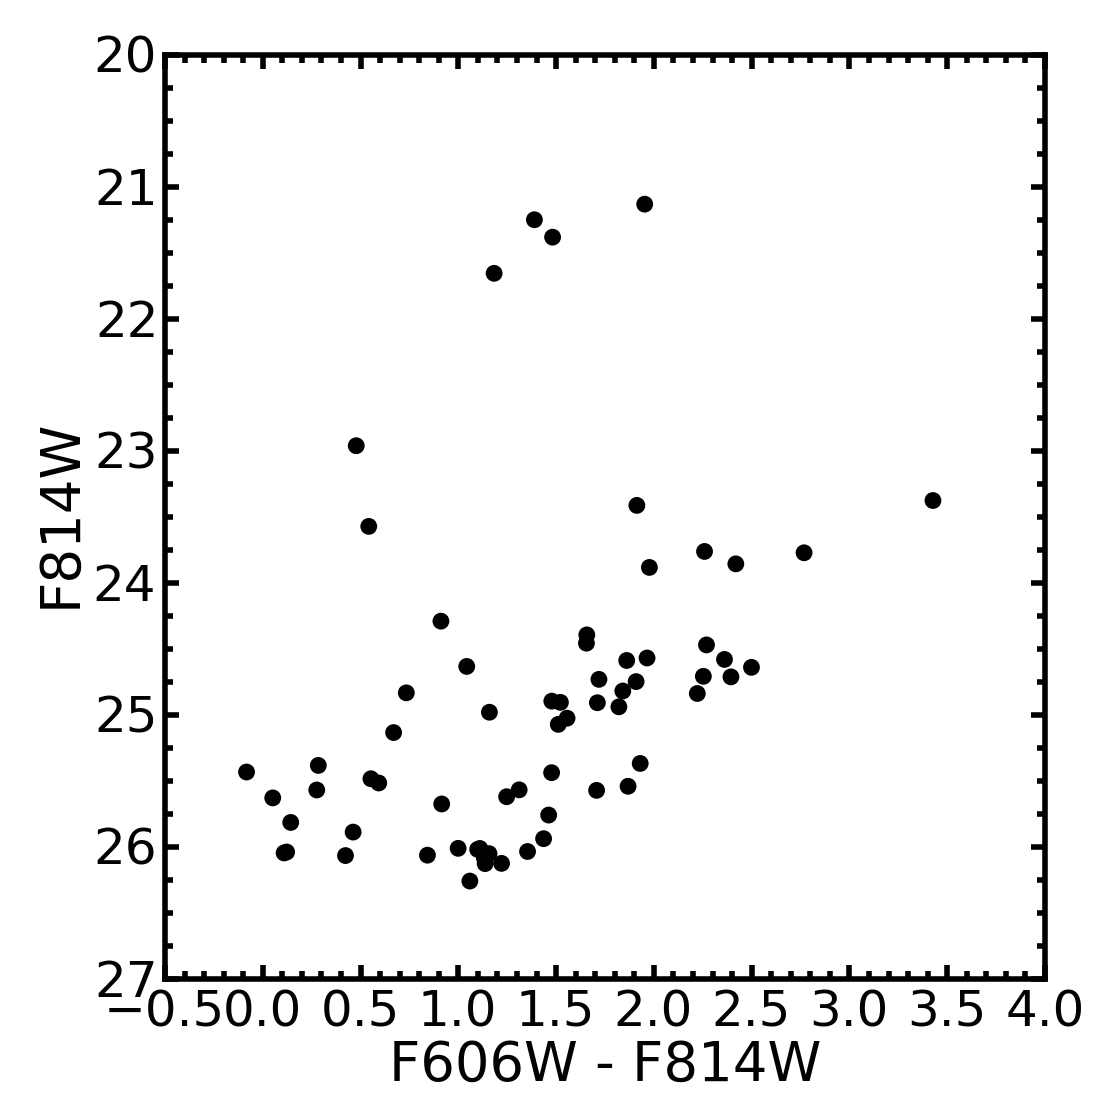
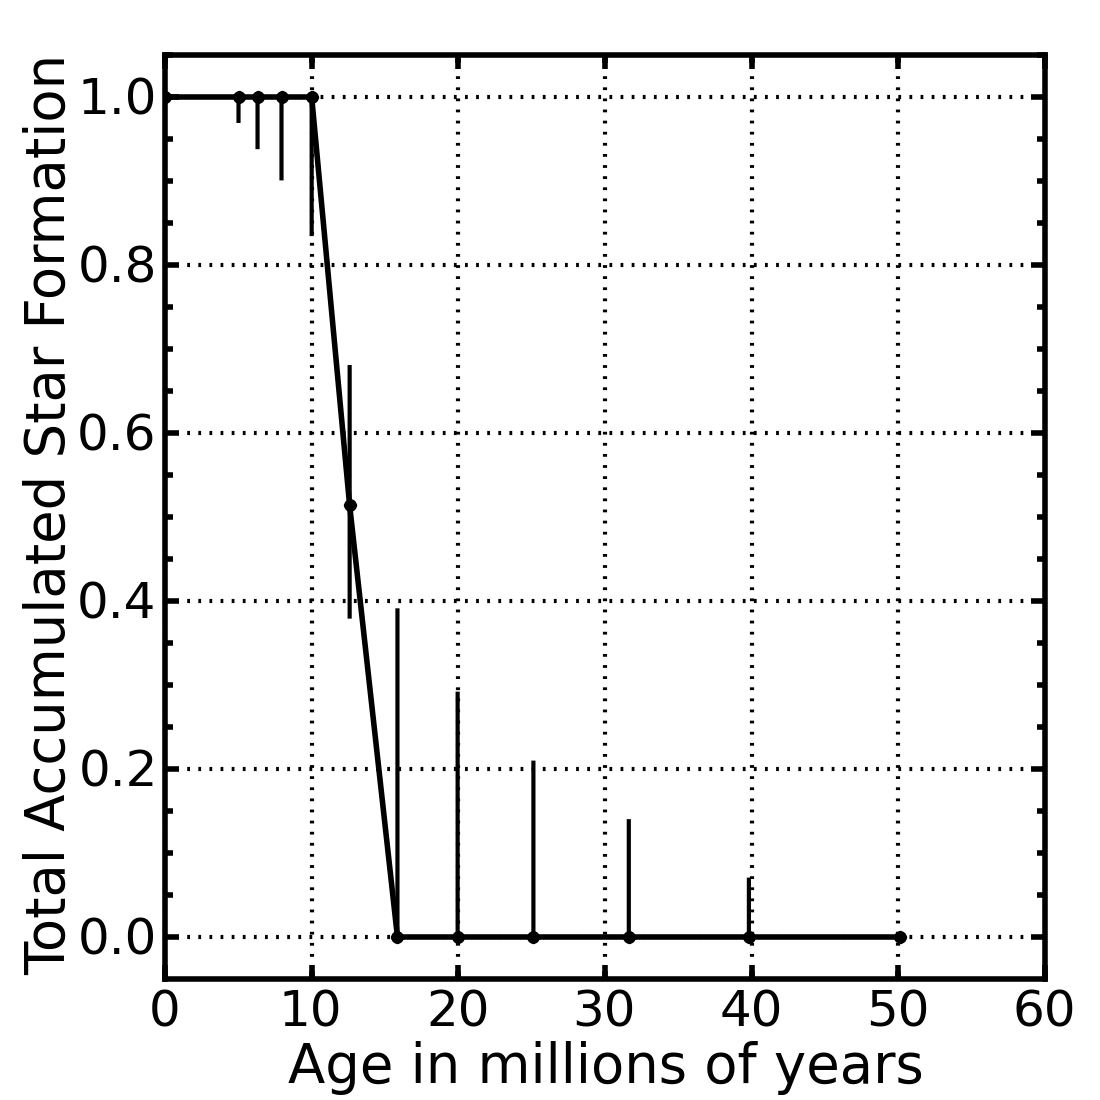
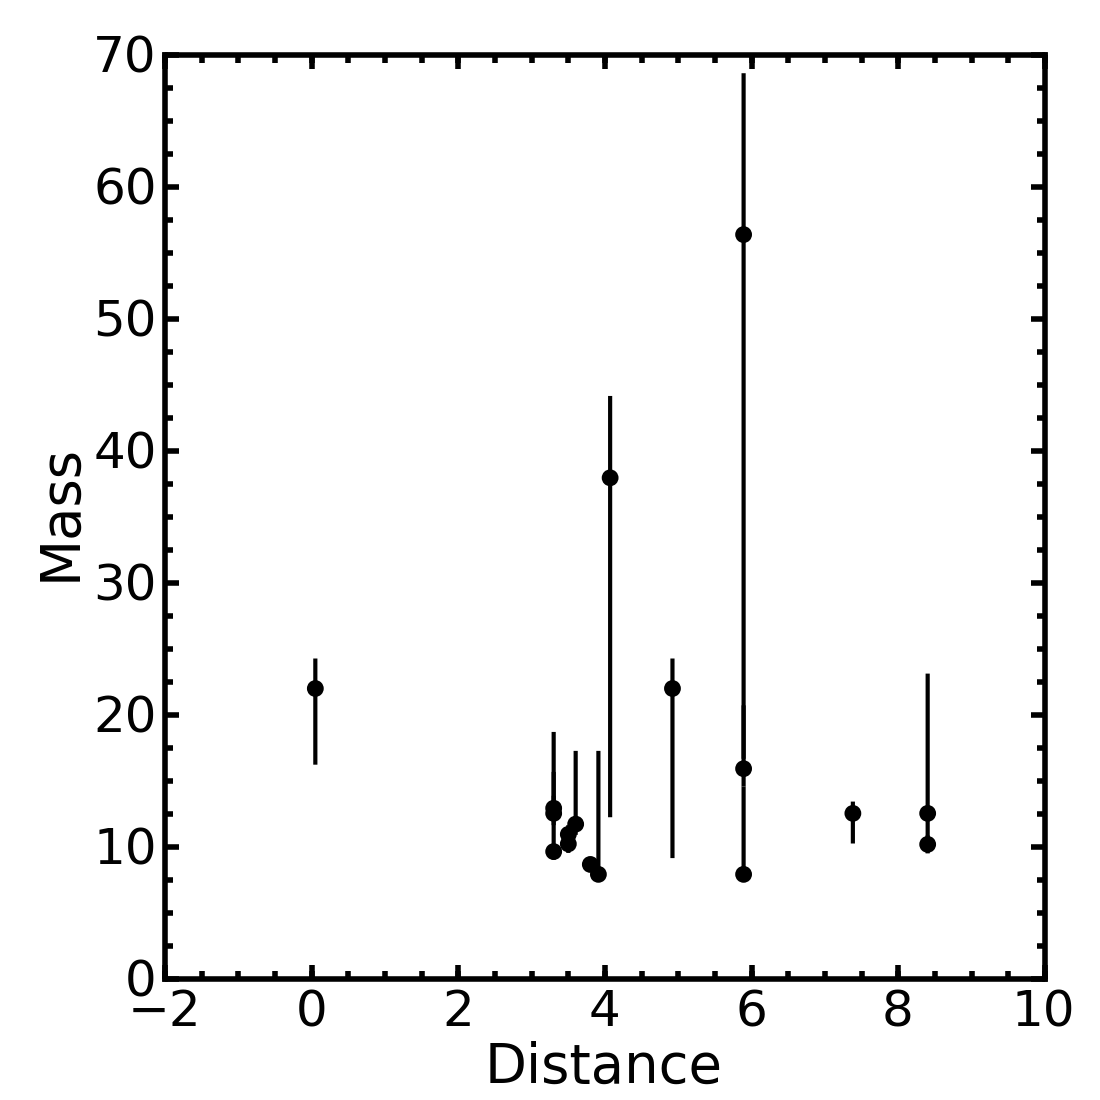
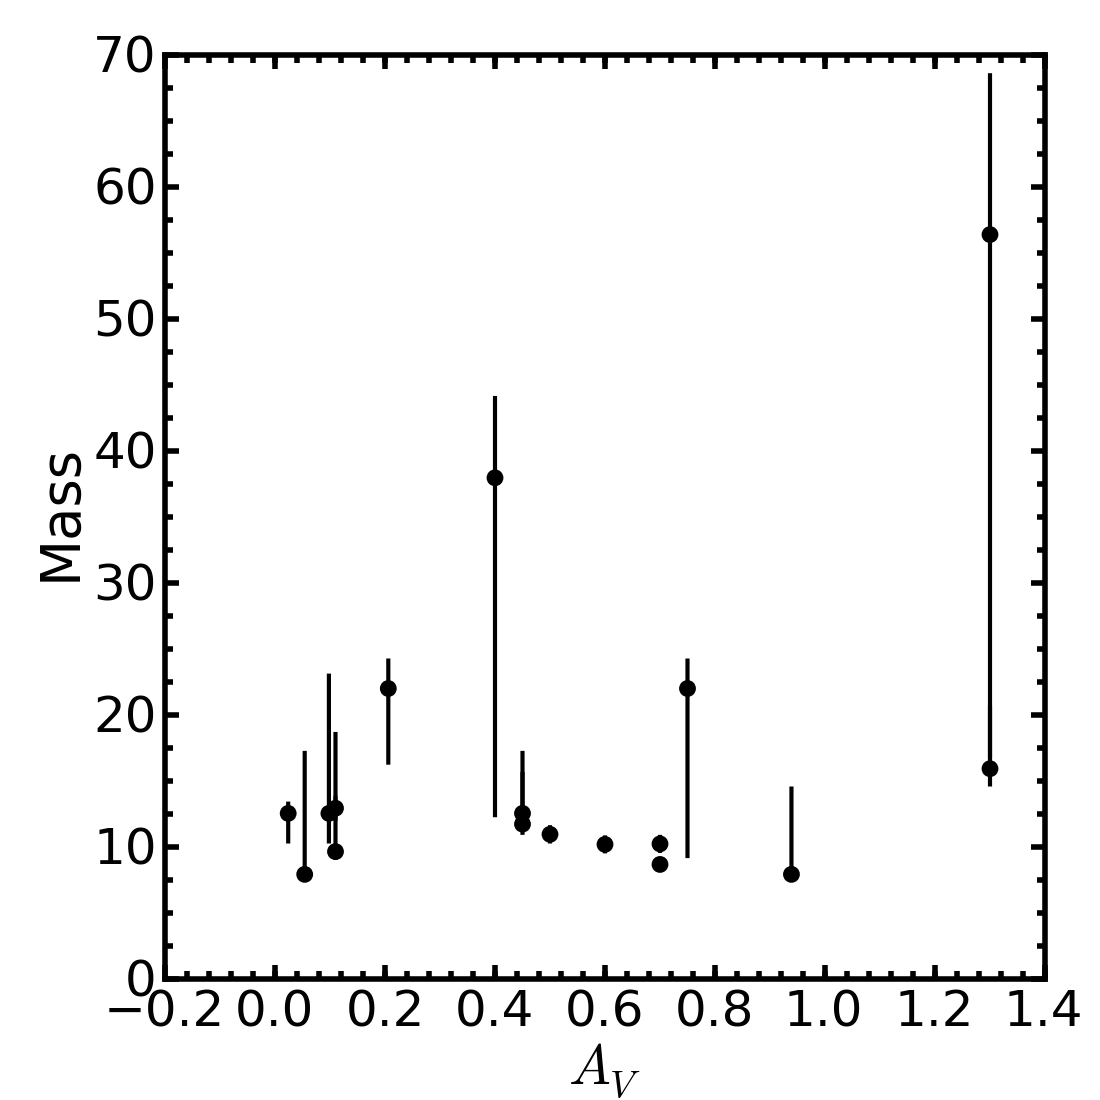
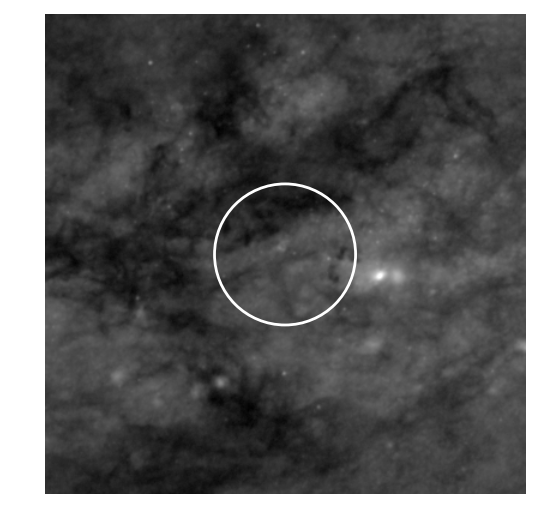
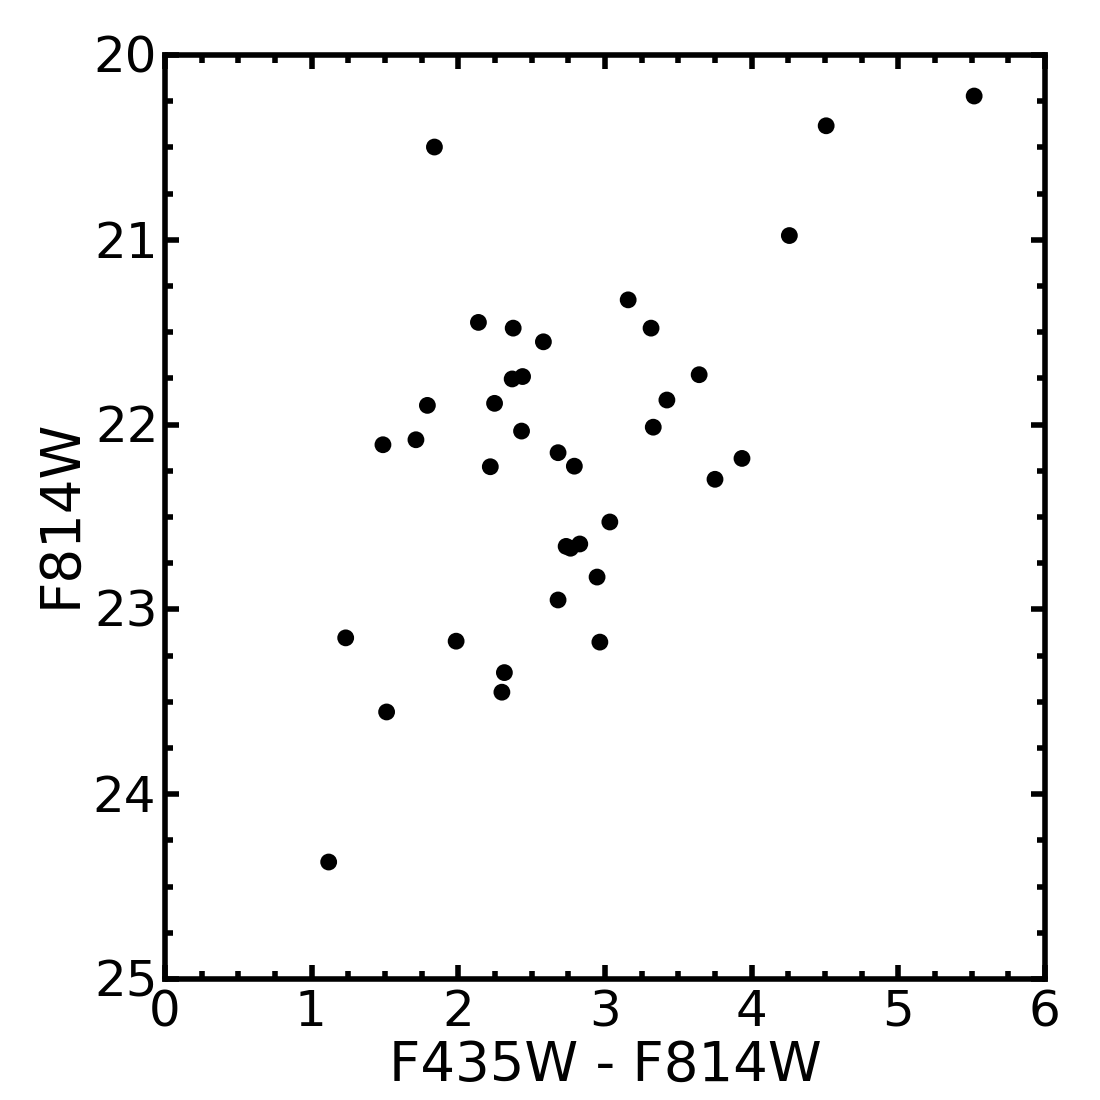
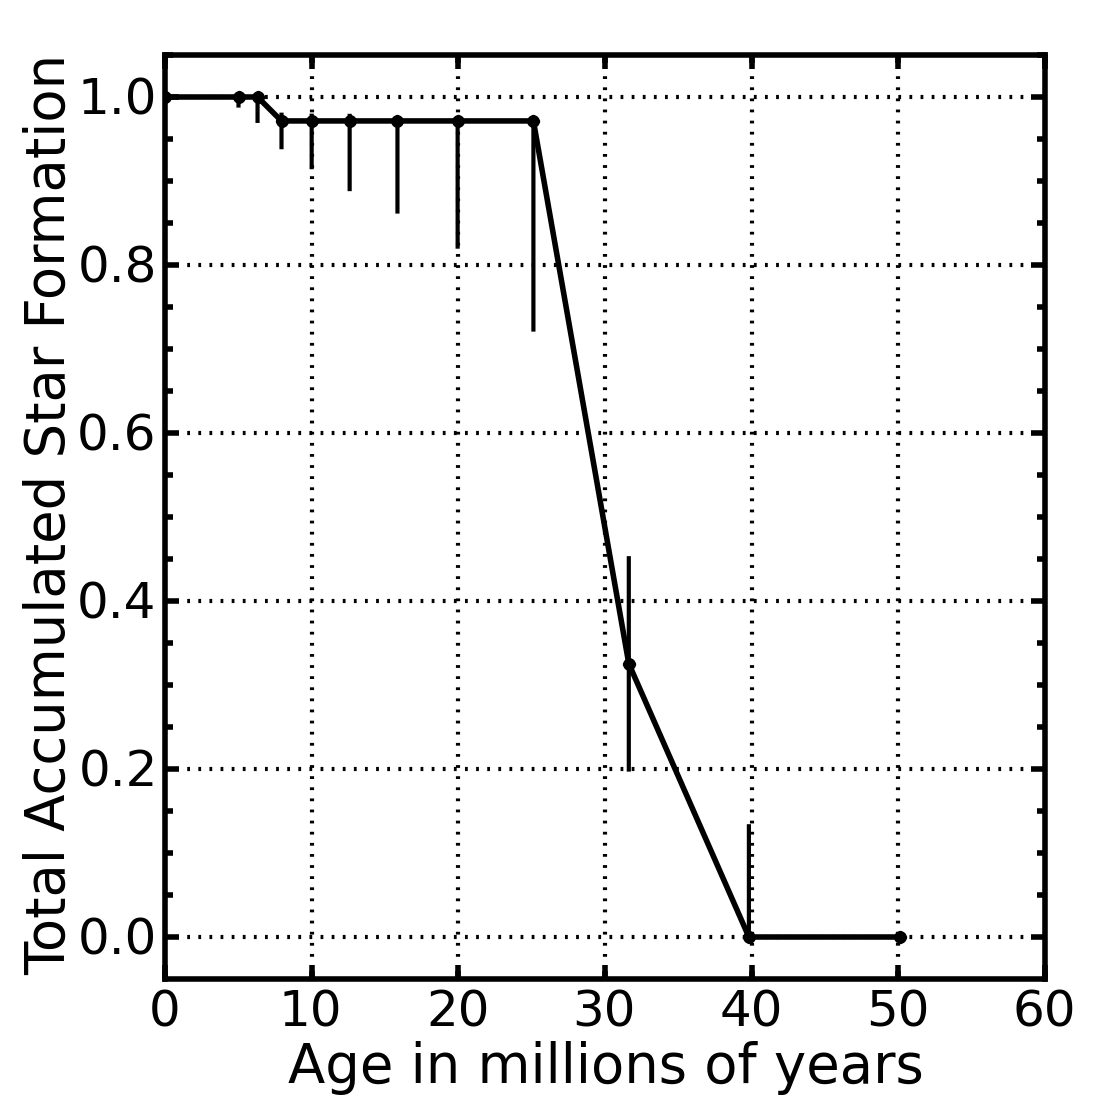
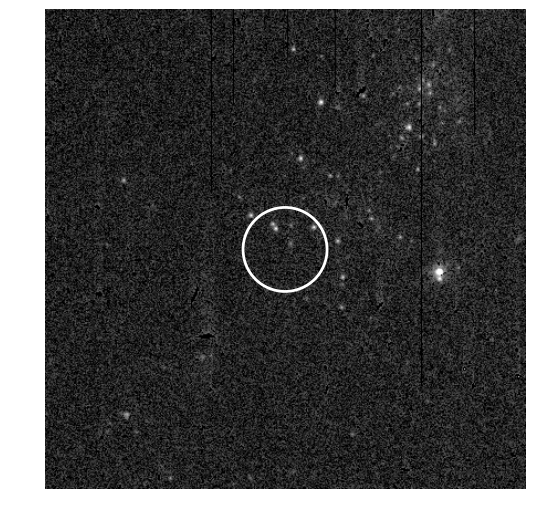
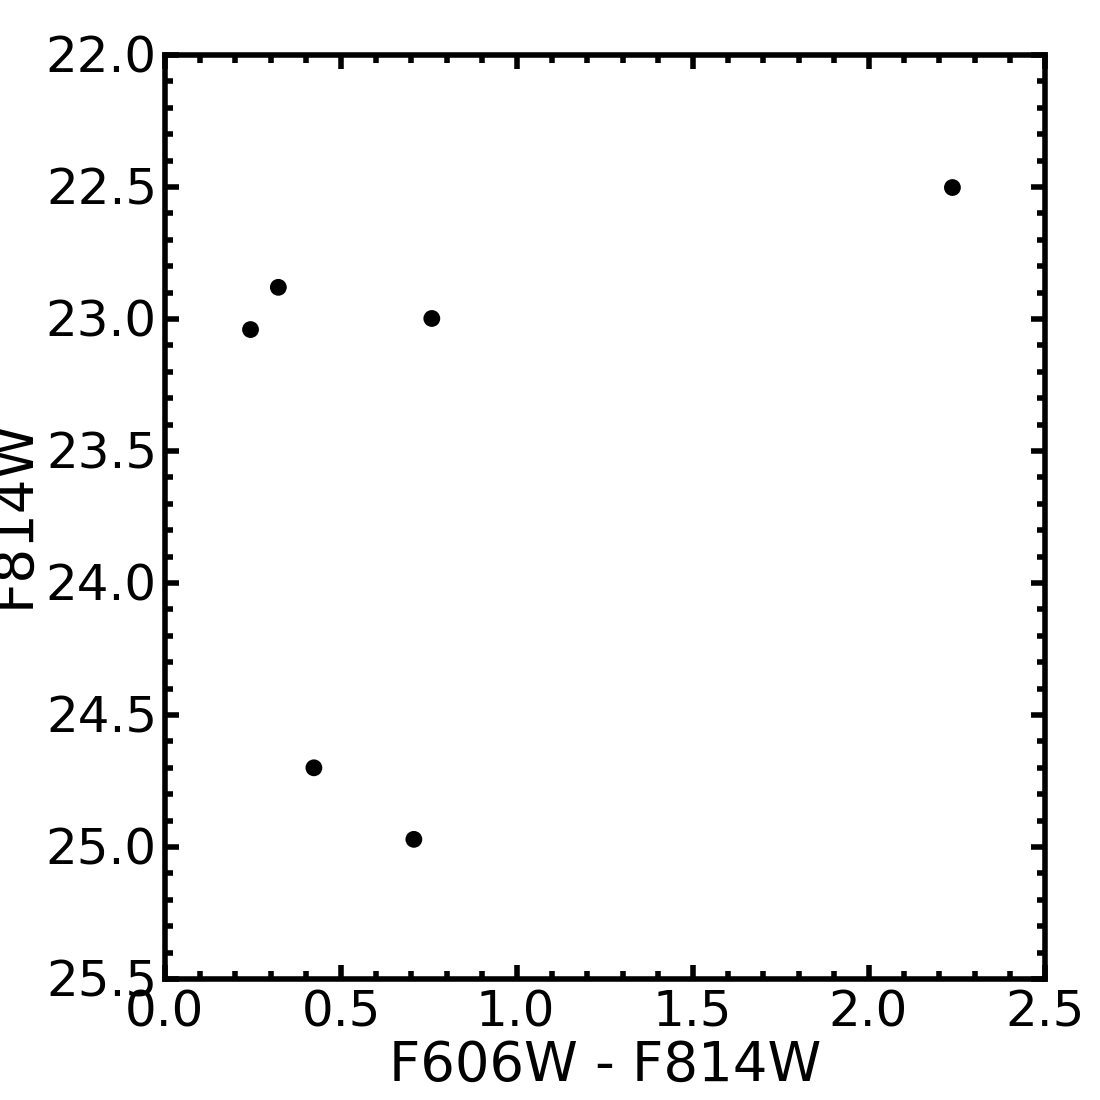
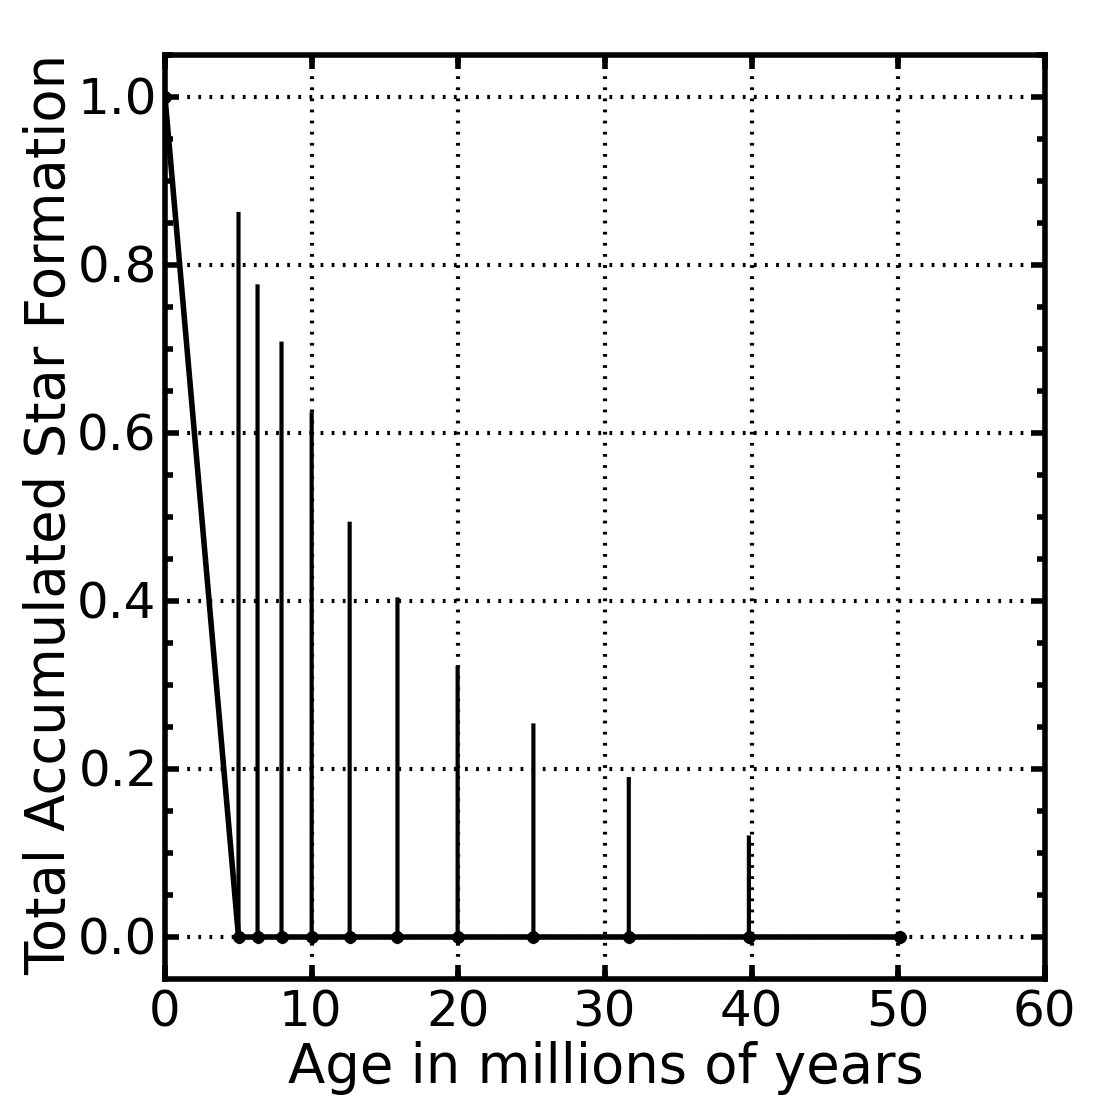
With the distance, extinction, and differential extinction values fixed, we fitted the CMD to find the most likely age distribution, allowing metallicities for the young population in the range of -0.6[Fe/H]0.1. Examples for objects with data quality typical of most of our sample are shown in Figure 3-4, where we show an image of our extraction region, a plot of the CMD of the 50 pc region, and a final cumulative star formation history from the fitting routine. In Figure 5 we plot our final derived masses against distance and . The lack of correlations in the derived masses as a function of these parameters suggests they do not introduce any significant bias into our measurements.
To assess systematic uncertainties (due to any model deficiencies), we reran the fitting with several changes to the models, following Dolphin (2012). We allowed the effective temperature of the models to vary by log(Teff)=0.02. We allow the bolometric luminosity of the models to vary by log(Lbol)=0.17. Furthermore, we allow the differential extinction applied to the model to vary by =0.2 in cases of high (0.4). We run 100 fits to 100 realizations of the model, varying all of these parameters to account for systematic uncertainties resulting from our stellar evolution models and our treatment of the extinction.
Then, to measure the random uncertainties due to number of stars and depth of the photometry, we use the hybridMC task within the MATCH package as described in Dolphin (2013). This task determines the star formation rate that would allow an acceptable fit to the data for each age bin, thus providing robust upper-limits for bins where the best-fit star formation rates were 0. With both uncertainty determinations complete, we combine the random and systematic uncertainties in quadrature using the MATCH routing zcmerge to calculate our final uncertainties on the star formation rates in each age bin.
Next, we use our total uncertainties on the star formation rates in each age bin to determine the uncertainty on the fraction of stellar mass present in each age bin back to 50 Myr. We perform 1000 Monte Carlo realizations of the measured SFH from 50 Myr to the present. We then calculate the 16% and 84% ranges in stellar mass fraction in each age bin from these tests. We adopt these percentiles as the uncertainties on fraction of stellar mass formed in each age bin relative to the total stellar mass produced in the past 50 Myr.
3. Progenitor Masses
Once we have the mass fraction (and associated mass fraction uncertainty) in each age bin, we calculate our first estimate of the progenitor mass by determining the median age of the best fit. We then use our uncertainties to determine the age bins consistent with containing the median to assign uncertainties on that median age. Finally, we convert these ages to masses by taking the most massive star remaining in the model isochrone corresponding to the each age (see Jennings et al., 2012, for more details). These values provide our the nominal progenitor mass and associated uncertainties for each SN. These median masses and associated uncertainties () are provided in Table 2.
Although the assignment of a single progenitor age is of interest, many of our SFHs contain multiple coeval populations, making a more complex distribution of the mass probability desirable for some purposes. We therefore have also tabulated the uncertainty for each progenitor due to the spread in the recovered age distribution (). These uncertainties encompass 68% of the total population mass (about the median value of the best fit) with ages 50 Myr including uncertainties and account for the full distribution ages present at the SN location, similar to the technique adopted in earlier work (Murphy et al., 2011; Jennings et al., 2012). In most cases, the stellar mass is relatively well confined to a small age range, but including this second set of uncertainties shows where there are multiple ages present. For example, the median age of the young population surrounding SN1994I is well-determined, providing a high-precision mass measurement of 10.20.7 M⊙; however, there is also a younger population present that represents a significant fraction of the stellar mass. If the presence of this population is taken into account, the uncertainties on the progenitor mass increase substantially to 10.2. Thus, in this case, only under the assumption that progenitor was a member of the dominant young population is the mass of the progenitor well-constrained. Otherwise, it is only a lower limit.
Looking at these uncertainties, one can determine which SNe would benefit most from improved photometry data. Large spreads in the 68% population mass accompanied by small errors on the median seem to occur for SNe with few stars in the CMD. For example, SN1951H has only 11 stars for fitting, a 10% error on the median, but values that encompass the full mass range of the models. Thus, the well-constrained median suggests that the mass should also be well constrained, but the small number of stars results in large uncertainties for other age bins which would likely be reduced with deeper data and a larger number of detected stars.
Finally, to provide detailed probability distributions for all SN, we tabulate the probability that the progenitor was in each age/mass bin, given the SFH and associated uncertainties. These probability distributions are given in Table 3, where each mass bin is assigned a probability which comes from the most likely SFH, and an associated uncertainty on the probability, which comes from applying the uncertainties in the SFH to the mass probability distribution. Thus, in order to account for both sources of uncertainty on the progenitor mass (the fitting uncertainty and the uncertainty associated with the intrinsic range of ages), it is necessary to assign uncertainties to our probabilities. However, in many cases, the median mass is relatively well defined (%), and provides a simple, though less thorough, constraint on the progenitor mass.
Six of the events in our sample have previously-measured progenitor masses from direct imaging (SN1987A, SN1993J, SN2004dj, SN2004et, SN2005cs, SN2008bk, see Table 2), and while our measurements are less precise in some cases, they are consistent with the previous measurements in all cases, as shown in Figure 6. Indeed, in all cases the previous measurements are consistent with our most optimistic uncertainties—the uncertainty on the median age of the young population.
3.1. Extreme Cases
A few SNe in our samples stand out as extremely challenging of our ability to measure star formation histories. For example, in Figure 7 we show the image, photometry, and fitting results for our most heavily extincted location, SN2004am. In this case, even though there is a very high amount of differential extinction (=2.5), the relatively large number of stars provides a good constraint on the age distribution. Unfortunately, with this much dust, there is clearly the possibility of a significant number of more massive stars being completely hidden from the sample, which would not be accounted for by our method. We cannot account for stars that are extincted out of our photometry sample. Thus, this amount of dust may make this result less reliable than many of the others. Such examples are unlikely to improve without much deeper data to probe to very high extinctions.
Another extreme case is SN2004et, where we only have 6 stars in the CMD due to shallow imaging and a far distance (meaning a small extraction region on the sky). We show our results for this SN in Figure 8, where the lack of stars results in very large uncertainties. Although the uncertainties on the progenitor mass are large, the full range of masses are not allowed by our uncertainties, which suggest the mass is 16 M⊙. These uncertainties are reliable, as the best-mass is well away from (but within the large errors of) the mass measured from direct imaging. Interestingly, even with the large uncertainties, the mass constraint is useful since it rules out masses lower than the best-fit mass from direct imaging. This example confirms that our uncertainty estimates are reliable, but also demonstrates that attempting this technique with any fewer stars is of little value.
Finally, our results in this work add further validation to our method. For the 6 SNe with we measure here that have literature measurements, we plot our measurements against those from the literature in Figure 6. In all cases our measurements are consistent with previous measurements within the uncertainties, and no systematic bias is seen.
3.2. Progenitor Mass Distribution
We note that our results are consistent with no SN progenitors 20 M⊙, as are all of the progenitor mass measurements currently available in the literature (see references in Section 1). While we do have some best estimates that are higher mass, their uncertainties all extend below 20 M⊙. Our most massive central values are for SN2004et and SN1962M, but these only have 75% and 82% probability of being 20 M⊙. Furthermore, the direct imaging mass for SN2004et has an upper limit of 20 M⊙, suggesting that the correct mass is indeed at the low end of our uncertainties. Figure 9 plots the masses in ranked order, along with the expected distribution of masses for a Salpeter (1955) IMF with different upper-mass cutoffs. The large uncertainties on the high progenitor masses severely limit our ability to determine the existence of such a cutoff. Thus, our current sample and data quality does not provide any conclusive evidence that high-mass stars produce core-collapse supernovae. This lack of conclusive 20 M⊙ progenitors is consistent with findings of several other studies (Smartt et al., 2009; Jennings et al., 2012), hinting that there could be a ceiling to SN production or a mass range that under-produces SNe. However, if we can measure a single progenitor mass 20 M⊙ with even 20% precision, constraints on the progenitor mass distribution would be greatly improved.
4. Conclusions
We have constrained the progenitor masses of 17 historic SNe using CMD fitting of stellar populations measured from HST archival data. Eleven of these are new constraints, making the total number of historic SN progenitor masses 28. Even with this dramatic increase in mass measurements, there is still not a single high-precision measurement of a progenitor 20 M⊙, making characterization of the progenitor mass distribution difficult.
This work represents all that is possible with the current state of the HST archive. The power of the technique is clear, and we hope that future studies will be made possible by more and deeper HST imaging of nearby galaxies containing historic SNe.
Support for this work was provided by NASA through grants AR-13277, GO-10915, and Hubble Fellowship grant 51273.01 from the Space Telescope Science Institute, which is operated by the Association of Universities for Research in Astronomy, Inc., for NASA, under contract NAS 5-26555. Z.G.J. is supported in part by a National Science Foundation Graduate Research Fellowship.
References
- Aldering et al. (1994) Aldering, G., Humphreys, R. M., & Richmond, M. 1994, AJ, 107, 662
- Badenes et al. (2009) Badenes, C., Harris, J., Zaritsky, D., & Prieto, J. L. 2009, ApJ, 700, 727
- Barbon et al. (1999) Barbon, R., Buondí, V., Cappellaro, E., & Turatto, M. 1999, A&AS, 139, 531
- Barth et al. (1996) Barth, A. J., van Dyk, S. D., Filippenko, A. V., Leibundgut, B., & Richmond, M. W. 1996, AJ, 111, 2047
- Bastian & Goodwin (2006) Bastian, N., & Goodwin, S. P. 2006, MNRAS, 369, L9
- Claeys et al. (2011) Claeys, J. S. W., de Mink, S. E., Pols, O. R., Eldridge, J. J., & Baes, M. 2011, A&A, 528, A131
- Crockett et al. (2008) Crockett, R. M., et al. 2008, MNRAS, 391, L5
- Dalcanton et al. (2009) Dalcanton, J. J., et al. 2009, ApJS, 183, 67
- De Donder & Vanbeveren (1998) De Donder, E., & Vanbeveren, D. 1998, A&A, 333, 557
- Dessart et al. (2011) Dessart, L., Hillier, D. J., Livne, E., Yoon, S.-C., Woosley, S., Waldman, R., & Langer, N. 2011, MNRAS, 414, 2985
- Dolphin (2000) Dolphin, A. E. 2000, PASP, 112, 1383
- Dolphin (2002) Dolphin, A. E. 2002, MNRAS, 332, 91
- Dolphin (2012) Dolphin, A. E. 2012, ApJ, 751, 60
- Dolphin (2013) Dolphin, A. E. 2013, ApJ, 775, 76
- Efremov (1991) Efremov, Y. N. 1991, Soviet Astronomy Letters, 17, 173
- Eldridge et al. (2013) Eldridge, J. J., Fraser, M., Smartt, S. J., Maund, J. R., & Crockett, R. M. 2013, MNRAS, 436, 774
- Eldridge et al. (2011) Eldridge, J. J., Langer, N., & Tout, C. A. 2011, MNRAS, 414, 3501
- Fraser et al. (2012) Fraser, M., et al. 2012, ArXiv e-prints
- Fraser et al. (2013) Fraser, M., et al. 2013, MNRAS
- Fraser et al. (2010) Fraser, M., et al. 2010, ApJ, 714, L280
- Gal-Yam & Leonard (2009) Gal-Yam, A., & Leonard, D. C. 2009, Nature, 458, 865
- Gallart et al. (2005) Gallart, C., Zoccali, M., & Aparicio, A. 2005, ARA&A, 43, 387
- Girardi et al. (2002) Girardi, L., Bertelli, G., Bressan, A., Chiosi, C., Groenewegen, M. A. T., Marigo, P., Salasnich, B., & Weiss, A. 2002, A&A, 391, 195
- Girardi et al. (2010) Girardi, L., et al. 2010, ApJ, 724, 1030
- Gogarten et al. (2009a) Gogarten, S. M., Dalcanton, J. J., Murphy, J. W., Williams, B. F., Gilbert, K., & Dolphin, A. 2009a, ApJ, 703, 300
- Gogarten et al. (2009b) Gogarten, S. M., Dalcanton, J. J., Murphy, J. W., Williams, B. F., Gilbert, K., & Dolphin, A. 2009b, ApJ, 703, 300
- Heger et al. (2003) Heger, A., Fryer, C. L., Woosley, S. E., Langer, N., & Hartmann, D. H. 2003, ApJ, 591, 288
- Jennings et al. (2013) Jennings, Z. G., Williams, B. F., Murphy, J. W., Dalcanton, J. J., Gilbert, K. M., & Dolphin, A. E. 2013, ApJ, submitted
- Jennings et al. (2012) Jennings, Z. G., Williams, B. F., Murphy, J. W., Dalcanton, J. J., Gilbert, K. M., Dolphin, A. E., Fouesneau, M., & Weisz, D. R. 2012, ApJ, 761, 26
- Lada & Lada (2003) Lada, C. J., & Lada, E. A. 2003, ARA&A, 41, 57
- Langer (2012) Langer, N. 2012, ARA&A, 50, 107
- Li et al. (2005) Li, W., Van Dyk, S. D., Filippenko, A. V., & Cuillandre, J.-C. 2005, PASP, 117, 121
- Li et al. (2006) Li, W., Van Dyk, S. D., Filippenko, A. V., Cuillandre, J.-C., Jha, S., Bloom, J. S., Riess, A. G., & Livio, M. 2006, ApJ, 641, 1060
- Maíz-Apellániz et al. (2004) Maíz-Apellániz, J., Bond, H. E., Siegel, M. H., Lipkin, Y., Maoz, D., Ofek, E. O., & Poznanski, D. 2004, ApJ, 615, L113
- Marigo et al. (2008) Marigo, P., Girardi, L., Bressan, A., Groenewegen, M. A. T., Silva, L., & Granato, G. L. 2008, A&A, 482, 883
- Mattila et al. (2008) Mattila, S., Smartt, S. J., Eldridge, J. J., Maund, J. R., Crockett, R. M., & Danziger, I. J. 2008, ApJ, 688, L91
- Maund et al. (2013) Maund, J., Reilly, E., & Mattila, S. 2013, ArXiv,1302.7152
- Maund et al. (2011) Maund, J. R., et al. 2011, ApJ, 739, L37
- Maund et al. (2014) Maund, J. R., Mattila, S., Ramirez-Ruiz, E., & Eldridge, J. J. 2014, MNRAS
- Maund et al. (2014) Maund, J. R., Reilly, E., & Mattila, S. 2014, MNRAS, 438, 938
- Murphy et al. (2011) Murphy, J. W., Jennings, Z. G., Williams, B., Dalcanton, J. J., & Dolphin, A. E. 2011, ApJ, 742, L4
- Nomoto et al. (1995) Nomoto, K. I., Iwamoto, K., & Suzuki, T. 1995, Phys. Rep., 256, 173
- Panagia et al. (2000) Panagia, N., Romaniello, M., Scuderi, S., & Kirshner, R. P. 2000, ApJ, 539, 197
- Podsiadlowski et al. (1992) Podsiadlowski, P., Joss, P. C., & Hsu, J. J. L. 1992, ApJ, 391, 246
- Podsiadlowski et al. (1990) Podsiadlowski, P., Joss, P. C., & Rappaport, S. 1990, A&A, 227, L9
- Salpeter (1955) Salpeter, E. E. 1955, ApJ, 121, 161
- Schlegel et al. (1998) Schlegel, D. J., Finkbeiner, D. P., & Davis, M. 1998, ApJ, 500, 525
- Smartt (2009) Smartt, S. J. 2009, ARA&A, 47, 63
- Smartt et al. (2009) Smartt, S. J., Eldridge, J. J., Crockett, R. M., & Maund, J. R. 2009, MNRAS, 395, 1409
- Smith et al. (2001) Smith, N., Humphreys, R. M., & Gehrz, R. D. 2001, PASP, 113, 692
- Smith et al. (2011a) Smith, N., et al. 2011a, ApJ, 732, 63
- Smith et al. (2011b) Smith, N., Li, W., Silverman, J. M., Ganeshalingam, M., & Filippenko, A. V. 2011b, MNRAS, 415, 773
- Stancliffe & Eldridge (2009) Stancliffe, R. J., & Eldridge, J. J. 2009, MNRAS, 396, 1699
- Tutukov et al. (1992) Tutukov, A. V., Yungelson, L. R., & Iben, I., Jr. 1992, ApJ, 386, 197
- Van Dyk et al. (2012a) Van Dyk, S. D., et al. 2012a, ArXiv e-prints
- Van Dyk et al. (2012b) Van Dyk, S. D., et al. 2012b, AJ, 143, 19
- Van Dyk et al. (1999) Van Dyk, S. D., Peng, C. Y., Barth, A. J., & Filippenko, A. V. 1999, AJ, 118, 2331
- Van Dyk et al. (2013) Van Dyk, S. D., et al. 2013, ApJ, 772, L32
- Van Dyk et al. (2014) Van Dyk, S. D., et al. 2014, AJ, 147, 37
- Vinkó et al. (2009) Vinkó, J., et al. 2009, ApJ, 695, 619
- Walborn et al. (1993) Walborn, N. R., Phillips, M. M., Walker, A. R., & Elias, J. H. 1993, PASP, 105, 1240
- Walmswell & Eldridge (2012) Walmswell, J. J., & Eldridge, J. J. 2012, MNRAS, 419, 2054
- Wang et al. (2005) Wang, X., Yang, Y., Zhang, T., Ma, J., Zhou, X., Li, W., Lou, Y.-Q., & Li, Z. 2005, ApJ, 626, L89
- Weis & Bomans (2005) Weis, K., & Bomans, D. J. 2005, A&A, 429, L13
- Woosley (1988) Woosley, S. E. 1988, ApJ, 330, 218
- Woosley et al. (2002) Woosley, S. E., Heger, A., & Weaver, T. A. 2002, Reviews of Modern Physics, 74, 1015
- Woosley & Phillips (1988) Woosley, S. E., & Phillips, M. M. 1988, Science, 240, 750
- Yoon & Cantiello (2010) Yoon, S.-C., & Cantiello, M. 2010, ApJ, 717, L62
- Yoon et al. (2012) Yoon, S.-C., Gräfener, G., Vink, J. S., Kozyreva, A., & Izzard, R. G. 2012, A&A, 544, L11
- Yoon et al. (2010) Yoon, S.-C., Woosley, S. E., & Langer, N. 2010, ApJ, 725, 940
| SN | Type | RA | DEC | Galaxy | PID | m-M | Mpc | d | Nstars | |
|---|---|---|---|---|---|---|---|---|---|---|
| SN1917A | II | 20:34:46.90 | 60:07:29.00 | NGC 6946 | 11229 | 28.9 | 6.0 | 0.939 | 0.0 | 7 |
| SN1923A | II P | 13:37:09.20 | -29:51:04.00 | NGC 5236 (M83) | 11360 | 28.5 | 5.0 | 0.75 | 1.6 | 142 |
| SN1951H | II | 14:03:55.30 | 54:21:41.00 | NGC 5457 (M101) | 9490 | 29.3 | 7.2 | 0.024 | 0.0 | 11 |
| SN1954J | II pec | 07:36:55.36 | 65:37:52.1 | NGC 2403 | 10182 | 28.0 | 4.0 | 0.45 | 0.2 | 212 |
| SN1962M | II P | 03:18:12.20 | -66:31:38.00 | NGC 1313 | 9796 | 28.0 | 4.0 | 0.4 | 0.0 | 125 |
| SN1980K | II L | 20:35:30.07 | 60:06:23.75 | NGC 6946 | 11229 | 28.9 | 6.0 | 2 | ||
| SN1985F | Ib | 12:41:33.01 | 41:09:05.94 | NGC 4618 | 9042 | 29.5 | 7.9 | 4 | ||
| SN1987A | II pec | 05:35:28.01 | -69:16:11.61 | LMC | 7434 | 18.5 | 0.05 | 0.206 | 0.7 | 11800 |
| SN1993J | IIb | 09:55:24.95 | 69:01:13.38 | NGC 3031 (M81) | 10584 | 28.0 | 4.0 | 0.45 | 0.0 | 143 |
| SN1994I | Ic | 13:29:54.07 | 47:11:30.50 | NGC 5194 | 10452 | 29.6 | 8.3 | 0.6 | 0.0 | 42 |
| SN2002ap | Ic pec | 01:36:23.85 | 15:45:13.20 | NGC 0628 | 10272 | 29.3 | 7.2 | 1 | ||
| SN2002bu | IIn | 12:17:37.18 | 45:38:47.40 | NGC 4242 | 10272 | 29.5 | 7.9 | 0 | ||
| SN2002hh | II P | 20:34:44.29 | 60:07:19.00 | NGC 6946 | 10607 | 28.9 | 6.0 | 1.3 | 0.0 | 66 |
| SN2002kg | IIn | 07:37:01.83 | 65:34:29.30 | NGC 2403 | 10182 | 28.0 | 4.0 | 0.11 | 0.0 | 267 |
| SN2003gd | Ic pec | 01:36:42.65 | 15:44:19.90 | NGC 0628 | 10272 | 29.3 | 7.2 | 4 | ||
| SN2004am | II P | 09:55:46.61 | 69:40:38.10 | NGC 3034 (M82) | 10776 | 28.0 | 4.0 | 0.7 | 2.5 | 37 |
| SN2004dj | II P | 07:37:17.02 | 65:35:57.80 | NGC 2403 | 10607 | 28.0 | 4.0 | 0.11 | 0.0 | 127 |
| SN2004et | II P | 20:35:25.33 | 60:07:17.70 | NGC 6946 | 11229 | 28.9 | 6.0 | 1.3 | 1.4 | 6 |
| SN2005af | II | 13:04:44.06 | -49:33:59.80 | NGC 4945 | 10877 | 27.9 | 3.8 | 0.7 | 0.0 | 6 |
| SN2005cs | II P | 13:29:52.85 | 47:10:36.30 | NGC 5194 | 10452 | 29.6 | 8.3 | 0.098 | 0.0 | 33 |
| SN2008bk | II P | 23:57:50.42 | -32:33:21.50 | NGC 7793 | 12196 | 28.0 | 4.0 | 0.054 | 0.0 | 248 |
| SN2008iz | II | 09:55:51.55 | 69:40:45.80 | NGC 3034 (M82) | 10776 | 28.0 | 4.0 | 0.5 | 0.3 | 56 |
| SN | Median Mass | Direct Imaging Mass | ||||
|---|---|---|---|---|---|---|
| SN1917A | 7.9 | 6.7 | 0.5 | 25.1 | 0.5 | |
| SN1923A | 22.0 | 2.3 | 12.8 | 45.6 | 13.8 | |
| SN1951H | 12.5 | 0.9 | 2.3 | 6.2 | 5.2 | |
| SN1954J | 12.5 | 3.1 | 0.9 | 16.7 | 4.4 | |
| SN1962M | 38.0 | 6.2 | 25.7 | 6.2 | 30.6 | |
| SN1987A (shallow) | 22.8 | 2.5 | 14.4 | 47.4 | 15.5 | 193 (Woosley & Phillips, 1988) |
| SN1987A (deep) | 22.0 | 2.3 | 5.8 | 8.6 | 13.8 | 193 (Woosley & Phillips, 1988) |
| Binary merger 16319 | ||||||
| (Podsiadlowski et al., 1990, 1992) | ||||||
| SN1993J | 11.7 | 5.5 | 0.8 | 21.3 | 2.2 | 17 (Aldering et al., 1994) |
| Two stars, each 14–17 | ||||||
| (Stancliffe & Eldridge, 2009) | ||||||
| SN1994I | 10.2 | 0.7 | 0.7 | 59.2 | 1.8 | |
| SN2002hh | 15.9 | 4.8 | 1.3 | 9.9 | 6.4 | |
| SN2002kg | 9.7 | 9.1 | 0.6 | 13.5 | 2.3 | |
| SN2004am | 10.2 | 0.7 | 0.7 | 4.3 | 1.8 | |
| SN2004dj | 12.9 | 0.9 | 0.9 | 17.7 | 4.7 | 12 (Wang et al., 2005) |
| SN2004et | 56.4 | 12.2 | 39.7 | 12.2 | 48.1 | 15 (Li et al., 2005) |
| SN2005af | 8.7 | 0.5 | 0.5 | 5.2 | 1.3 | |
| SN2005cs | 12.5 | 10.6 | 2.3 | 54.0 | 4.4 | 103 (Li et al., 2006) |
| 9.5 (Maund et al., 2014) | ||||||
| SN2008bk | 7.9 | 9.4 | 0.5 | 25.1 | 0.5 | 12.9 (Maund et al., 2014) |
| 8.51 (Mattila et al., 2008) | ||||||
| SN2008iz | 11.0 | 0.7 | 0.7 | 4.7 | 2.8 |



| SN | Mass High | Mass Low | Probability | uncertainty | uncertainty |
|---|---|---|---|---|---|
| SN1917A | 68.6 | 45.3 | 0.0 | 5.7 | 0.0 |
| SN1917A | 45.3 | 33.0 | 0.0 | 11.0 | 0.0 |
| SN1917A | 33.0 | 25.9 | 10.6 | 9.9 | 10.6 |
| SN1917A | 25.9 | 20.7 | 0.0 | 20.7 | 0.0 |
| SN1917A | 20.7 | 17.3 | 0.0 | 27.2 | 0.0 |
| SN1917A | 17.3 | 14.6 | 0.0 | 34.7 | 0.0 |
| SN1917A | 14.6 | 12.5 | 0.0 | 42.4 | 0.0 |
| SN1917A | 12.5 | 10.9 | 0.0 | 50.4 | 0.0 |
| SN1917A | 10.9 | 9.6 | 0.0 | 59.2 | 0.0 |
| SN1917A | 9.6 | 8.4 | 0.0 | 73.1 | 0.0 |
| … | … | … | … | … | … |