New Address: ]Institut für Funktionelle Materialien und Quantentechnologien (IFMQ), Universität Stuttgart, Pfaffenwaldring 57, 70550 Stuttgart, Germany
Simulation of Laser Ablation in Aluminum: The Effectivity of Double Pulses
Abstract
Lasers are becoming a more and more important tool in cutting and shaping materials. Improving precision and effectivity is an ongoing demand in science and industry. One possibility are double pulses. Here we study laser ablation of aluminum by the two-temperature model. There the laser is modeled as a source in a continuum heat conduction equation for the electrons, whose temperature then is transferred to a molecular dynamics particle model by an electron-phonon coupling term. The melting and ablation effectivity is investigated depending on the relative intensity and the time delay between two Gaussian shaped laser pulses. It turns out that at least for aluminum the optimal pulse shapes are standard Gaussian pulses. For double pulses with delay times up to 200 ps we find a behavior as observed in experiment: the ablation depth decreases beyond a delay of 10 ps even if one does not account for the weakening at the second pulse due to laser-plasma interaction.
I Introduction
Improving precision and effectivity of laser ablation is an ongoing demand in industry and science. One possibility is given by double (or multiple) pulses which have been studied intensively in experiment and numerical simulations.
I.1 Application of lasers
Drilling holes with femtosecond laser pulses is assumed to deliver higher quality than for example ps or ns-pulses semerok . The drawback is that for a single hole tens of thousands of pulses are required. With typical repetition rates in the kHz-regime this leads to pulse intervals in the range of microseconds. From a molecular dynamics simulations point of view two such subsequent pulses can be considered as independent since the sample cools down completely between two pulses and the ablation plume vanishes. The only difference is that the second pulse is applied to a damaged sample.
The situation changes if the repetition rate increases and the time interval between the pulses shortens. Studies of two subsequent femtosecond pulses show that especially between about 10 ps and 10 ns the ablation depth is strongly reduced semerok ; axente ; mildner . Several models exist which try to explain this effect semerok ; axente ; pova . To get more insight from molecular dynamics simulations combined with a two-temperature model explained below we will study double femtosecond pulses at delay times up to 200 ps. The absorption of the laser pulses may be increased by an ablation plume which cannot be modeled directly in molecular dynamics simulations. To take this effect into account we have studied double pulses of different height.
Shorter delay times between two pulses have to be produced in experiment by special methods. First a single Gaussian pulse is generated and sent through a pulse shaper where it is modified with a liquid crystal modulator to produce a sequence of femtosecond laser pulses with increasing or decreasing intensity weiner ; englert . The sequences can then be interfered by birefringent optical elements to generate Gaussian pulses with any desired time delay.
If the delay time is very short, the pulses become overlapping and can be used to model non-standard pulse shapes which are not Gaussian in time. In covalent materials it is obvious that the pulse shape plays an important role, since if the front of the pulse is steep, it will produce many charge carriers which can transport the laser energy into the bulk while if the front of the pulse is slowly increasing it will only heat the sample locally. The question we will address is how strong this effect will be in a metal where free electrons are already present. For this goal we have studied overlapping Gaussian pulses where the first pulse is lower or higher than the second pulse, thus called increasing and decreasing pulses, respectively.
I.2 Studies of pulse sequences
Semerok and Dutouquet semerok find in experiments that the crater depths generated by double pulses are twice as deep as from a single pulse for delay times less than 1 ps, while they are only as deep as from a single pulse for delays larger than 10 ps with a transient regime in between. They attribute this result to reheating of the plume. Axente et al. axente confirm this result by studying the brightness of the ablation plume. Papadopoulou et al. papa obtained opposite results for the ablation of oxides: up to 1 ps the effectivity rises sharply and stays constant up to 10 ps. Longer time delays have not been considered. Povarnitsyn et al. pova studied double pulses theoretically with a continuum model, and could reproduce the results obtained by Semerok and others. They attribute the reduced effectivity of double pulses with delays longer than 10 ps between the two pulses to the fact that every pulse generates a shock wave followed by a rarefaction wave. The ablation depth will be reduced if the shock wave of the second pulse interferes with the rarefaction wave of the first pulse. If no rarefaction wave is present, they attribute the reduced ablation depth to the pressure exerted by heating the ablated materialpova2 . Very recently Mildner et al. mildner have studied laser ablation in aluminum by laser-induced breakdown spectroscopy (LIBS) spectroscopy with time delayed double pulse from femtoseconds to nanoseconds. They observe that four regimes exist: delay times less than 1 ps (I), up to 10 ps (II), up to 100 ps (III) and above 100 ps (IV). These regimes agree with those found by Semerok and Dutouquet semerok in experiments and by Povarnitsyn et al. pova in theory.
It is not possible to carry out simulations in a range far above ablation threshold as it is done in experiment. The reason is that the ablation depth is of the same order of magnitude as our sample size and it would take many nanoseconds to achieve a steady state of ablation and melting. Together with the number of simulations for the required data points this is out of reach for our computational capacity. Therefore we have studied two cases: one set of simulations where we have determined the ablation threshold for pulse shapes and double pulses. We could also derive information about the melting depth, the electron and lattice temperature and the distribution of kinetic energy. In another set of simulations we applied fixed laser energies per area (i.e. fixed laser fluence) above the ablation threshold as in experiment. Here we are limited to a regime far below the experimental range, nonetheless a more direct comparison to experiment is feasible.
The paper is organized as follows. We first present the two-temperature model (TTM) coupled to molecular dynamics simulations (MD). After some simulation details we describe the pulse types studied in this work. Following are results and a discussion of the two cases: double pulse ablation close to the ablation threshold, and double pulse ablation at fixed fluence above the threshold. The paper is concluded with a summary.
II Two temperature model coupled to molecular dynamics simulations
II.1 Equations
In femtosecond laser ablation the laser radiation acts directly on the free electrons of the metal, exciting them to a non-equilibrium state. If the electrons are equilibrated fast enough it is possible to define a temperature for them. This is the base of the two-temperature model (TTM) of Anisimov et al. Anisimov1974 where separate temperatures for the electrons and the lattice are introduced. The equation for the electron temperature is:
| (1) |
and are the electron and ion temperatures, is the heat capacity, the heat conductivity, the electron-phonon coupling constant and the external laser field. To work on an atomistic scale the equation for the lattice temperature is replaced by the Newtonian equation of motion of the atoms extended by a coupling term which acts on the velocities (for more details see ivanov ):
| (2) |
is the interaction potential, are the coordinates, the atom masses, the thermal velocities of the atoms. The coupling parameter has to be translated to atomistic observables by , the atomistic heat capacity which is computed directly from the simulations. and are determined locally by averaging over slabs containing several hundreds of atoms.
Instead of the electronic heat capacity which is a linear function of temperature, for metals at moderate temperatures the heat capacity coefficient is introduced which is constant over a broad temperature range.
II.2 Simulation details, boundary conditions
All simulations have been carried out with IMD, the ITAP Molecular Dynamics simulation package imd1 ; imd2 . The simulations were run on our local computing nodes with up to 12 CPU, and on the Cray XE6 Hermit of the Stuttgart computing center using 640 compute cores. The total number of runs was 423, each lasting about one day.
The material studied in all simulations was aluminum. The interaction of the atoms has been modeled by the EAM potential of Ercolessi and Adams Ercolessi1994 . For the electronic parameters of Al we set the coefficient for the specific heat of the electrons to J/(m3 26 , the electron-phonon coupling constant J/(m3Ks) 26 , and the electronic heat conductivity J/(sKm) 33 .
The sample size for the simulations at the ablation threshold was a box with 241.924.844.84 nm3 containing about 350’000 atoms. At the beginning the sample was equilibrated at 305 K. The sample size for the simulations with high fluence was a box with 364.4612.1512.15 nm3 containing 3’240’000 atoms. At the beginning the sample was equilibrated at 293 K.
The boundary conditions are periodic in the transverse direction and open along the direction of the laser beam. The samples for short pulse delay time are chosen long enough that during observation time no interaction occurs between the ablation procedure and the waves which are emitted towards the rear end of the sample, are reflected back and return to the surface. This limits the simulation time for a 1000 nm sample to about 300 ps since the speed of sound in solid Al is about 6400 m/s. The time is reduced to about 200 ps if the sample melts due to a lower speed of sound of about 4700 m/s.
For long delay times prohibitively long samples would be required. Fortunately, the pressure waves can be removed by applying a ramp at the rear end of the sample with the following properties: starting at 70% of the length of the probe a damping force is added to the equations of motion which increased quadratically towards the end of the probe and removes the kinetic energy of the wave (for details see Ref. imdlas ).
II.3 Determination of melting and ablation depth.
Melting and ablation depths are determined from - histograms of the density (see Fig. 2). We monitor the motion of the detached layer. If its distance to the bulk is constantly increasing we note that ablation has set in. This procedure may be somewhat imprecise if the samples are very large and thus the required simulation time to obtain a steady state is very long. Furthermore, the formation and collapse of bubbles below threshold may interfere with the true ablation threshold. Preuss et al. preuss104 determine the ablation threshold and the inverse absorption length by fitting the observed ablation depth at an applied fluence to the equation
| (3) |
This method could give more accurate results, but it would also require many time-consuming simulation runs to determine a single ablation threshold. Therefore we stick here to our simpler visual method. The melting and ablation depths are given with respect to the unexpanded sample. Therefore, and since the ablated material is molten, the melting depths include the ablation depths (see also Fig. 2).
The literature values for the single pulse ablation threshold of Al vary in a broad range. In experiments Guo et al. guo52 have observed first damage of Al samples occurring at a fluence (energy per area) of 340 J/m2 already, while Vorobyev vorobyev130 determine an ablation threshold of J/m2 in air and 580 J/m2 in vacuum. Le Harzic et al. leharzic73 on the other hand find as high as 1200 J/m2. In numerical studies Anisimov et al. anisimov6 computed a value of J/m2.
With the method of Preuss et al. preuss104 in previous work SonntagAPA we had obtained J/m2, for the Ercolessi and Adams potentials. This threshold seems to be much lower than the values which we find in this article. Several reasons are responsible for this fact: first of all, in Ref. SonntagAPA there are large error bars in the determination of the ablation threshold which would justify an ablation threshold up to 1200 to 1400 J/m2 instead of the reported J/m2. Second, the ablation threshold of J/m2 is an extrapolation to an ablation depth nm, whereas in simulations we always need to observe a finite ablation depth to detect the process. Thus our method will overestimate the ablation threshold. Third, the ablation threshold is difficult to determine precisely since it depends crucially on the initial conditions. To get good statistics many simulations with different initial conditions would have to be carried out. It is known that the threshold obtained in simulation depends on the size of the samplezhigileiprep . The transverse dimension of the sample plays an important role since it determines if the ablated material still forms a layer or if it breaks up into droplets. Larger transverse dimensions would be desirable, but this would lead to huge runtime demands.
III Simulation Procedure and Pulse types
III.1 Properties of two-Pulse Sequences
The cross sections of the simulated samples are small compared to the typical half width of a laser spot studied in experiment. Therefore we used a constant illumination of our samples with no transverse beam dependence. The laser beam intensity distribution in Eq. (1) is . The reflectivity and the inverse absorption depth are set to the typical values of aluminum: and nm for a wave length of 800 nm SonntagAPA ; 33 . is the temporal shape of the laser pulse. The fluence of the laser beam is given by . The original pulse has Gaussian shape with width ps:
The general formula for the shape of the simulated pulses is
with amplitudes and and time interval . Three scenarios were studied with the following :
The technical parameter ps is used to shift the pulse such that it hits the sample surface after the simulation starts.
Sequences of simulations were carried out by increasing the parameter at intervals of J/m2 until ablation occurs. Thus the data given for the ablation thresholds are accurate only within about .


IV Results
First we report results from simulations where the ablation threshold was determined for a standard Gaussian pulse and the non-Gaussian increasing and decreasing pulse shapes. This section includes the detailed analysis of one double pulse with the parameters , and . Double pulses with variable are treated later in Sec. IV.2.
IV.1 Simulations close to the ablation threshold
Melting and ablation behavior. In general, the samples start to melt, then ablation sets in and the samples continue to melt down to a constant depth. Modifications occur for non-Gaussian pulses and the double pulse: the ablated layers are not generated in one step but split up. For the double pulse there is a clear distinction between the action of the first and second pulse (see Fig. 2).
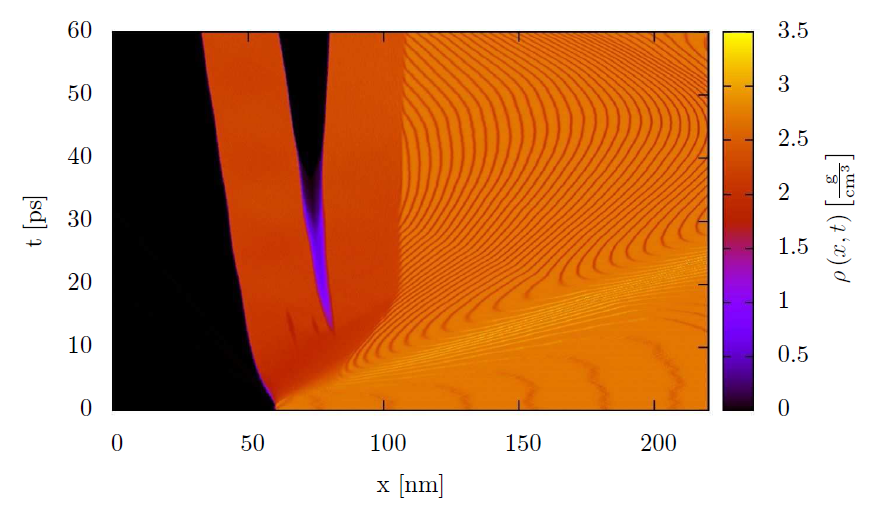
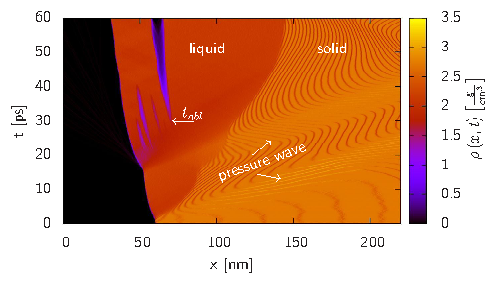
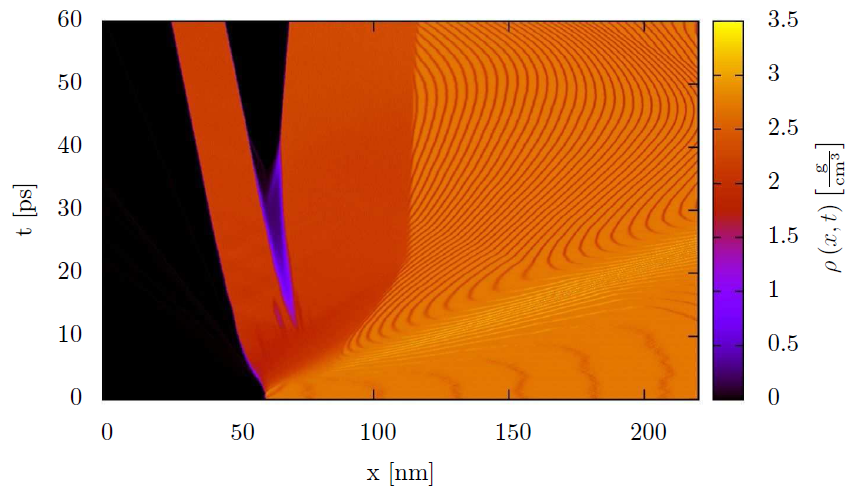
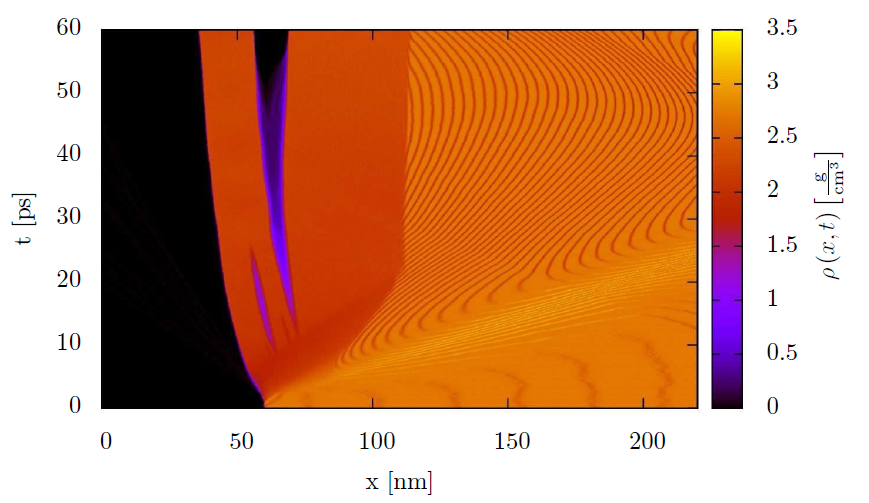
The quantitative results are summarized in Tab. 1. Ablation typically occurs about 12 to 15 ps after the laser beam has hit the sample. Thus there is no interaction with the shock wave emitted into the bulk since the wave returns to the surface much later.
| Pulse type | single | double | increasing | decreasing | |
|---|---|---|---|---|---|
| [J/m2] | 1260 | 1648 | 1439 | 1367 | |
| [ps] | 12.6 | 29.8 | 11.9 | 12.2 | |
| [nm] | 21.2 | 26.0 | 20.0 | 20.3 | |
| [nm] | 45.3 | 79.6 | 54.0 | 51.0 | |
We note that the double pulse requires a fluence of 1648 J/m2 to achieve ablation which is less than twice the fluence of 1260 J/m2 for ablation by a single pulse. It means that the fluence of a pulse can be reduced if a second pulse follows, but with respect to the total applied fluence this is not advantageous. The fluence goes down to less than 1461 J/m2 if the time delay between the pulses is reduced to 10 or 8 ps. The ablation threshold fluence further decreases continuously to the value of a single pulse if the time delay goes to ps.
The effective applied laser fluence is reduced by the interaction of the laser beam with the ablation plume which is equivalent to the increase of the reflectivity of the sample. This effect cannot be simulated directly. To mimic it, we have lowered the height of the second pulse in four steps down to half the height of the first pulse. The total applied fluence necessary for ablation rises slightly to 1710 J/m2 which means that the first pulse nearly reaches the fluence of a single pulse (855 and 1260 J/m2, respectively). There seems to be no significant and systematic change in the ablation depth and the starting time of ablation while the melting depth increases due to the higher fluence.
Temperatures. The electron and phonon temperatures of the samples have been determined as function of time at a position nm deep in the bulk.
For the double pulse the electron and lattice temperature have nearly reached equilibrium when the second pulse hits the sample (see Fig. 3). Since this temperature is about the same as the temperature reached for a single pulse at 35 ps, we can consider the two pulses as separate pulses. The temperature at the end of the double pulse simulation at 50 ps is significant higher than for the single pulse due to the larger fluence applied.


For the increasing pulse (Fig. 3) the evolution of electron and lattice temperature follows the signature of the pulse shape, although the minimum of the pulse is smeared out. The overall behavior is rather similar to the single pulse, the electron energy is slightly lower and the maxima are broader.
For the decreasing pulse the slope of the electron temperature is as sharp as for a single pulse, but then it continues to rise further at a slower pace. This behavior is caused by the onset of the second pulse maximum at that time. The lattice temperature behaves similar to the one of the increasing pulse but it is broadened further. The second lower maximum leads to a further decrease in the peak of the electron energy and in a stronger broadening of the maximum.
In conclusion we find that the non-Gaussian overlapping maxima behave similar to a Gaussian with the same fluence but a broader with .
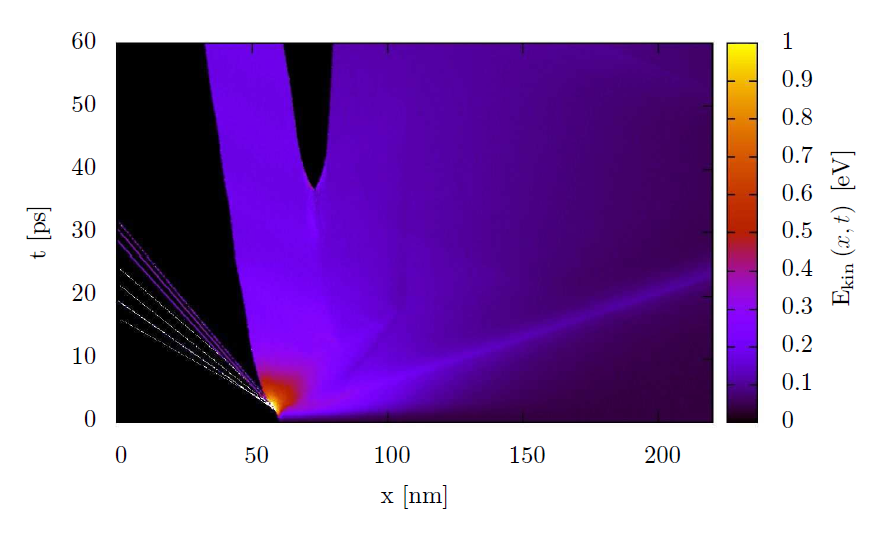
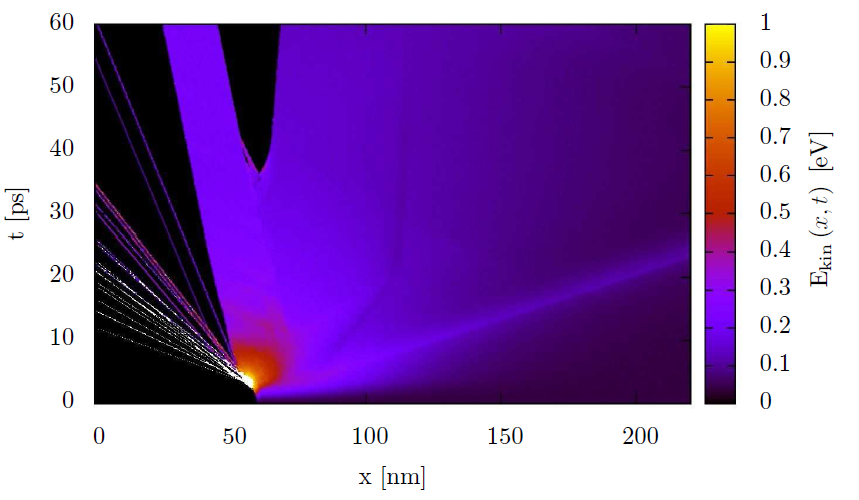
Kinetic energies. Fig. 4 shows the distribution of the local kinetic energy vs. time. The laser pulse is applied at the hot spot. It is clearly visible that jets of single atoms are emitted immediately after excitation and prior to full layer ablation. This indicates that the samples are indeed damaged already far below the ablation threshold.


Pressure waves. Each laser pulse generates a sharp shock wave moving into the bulk of the sample which is followed by a broad rarefaction wave. Povarnitsyn et al. papa find that the rarefaction wave of the second pulse is attenuated with respect to the rarefaction wave of the first pulse. Furthermore, the depth of the rarefaction wave of the first pulse stays constant whereas the rarefaction wave of the second pulse gets weaker with increasing delay time.
The intensity of the rarefaction wave in our simulations is 3.6 GPa for the single pulse. The height of the shock wave is about 15.6 GPa at a sample depth of 100 nm and a fluence of 810 J/m2. For the double pulses at a delay of 15 ps we find at the same depth that the rarefaction wave of the second pulse is reduced to 2.3 GPa but is stronger than the rarefaction wave of the first pulse at 1.2 GPa. Unfortunately, we do not know the strength of the rarefaction wave of the second pulse for longer delay times, but for shorter delays it is similar to the 10 ps case. The total fluence of the double pulses was 1647 J/m2 and the peak intensity of the shock wave of the first pulse was 9.5 GPa. Interestingly, we observe that the shock wave of the second pulse is strongly attenuated by the rarefaction wave of the first pulse; from 7.1 GPa at 15 ps delay to 4.6 at 10 ps delay. Furthermore, an intermediate very sharp shock wave is generated by interference of the shock waves of the first and second pulse with peak heightd 6.5 GPa for 10 ps delay.
IV.2 Simulations at fixed fluence
Single pulses and general remarks: Ablation at fixed fluence and variable time delay between the two pulses has been studied with the larger sample of about 3 million atoms.
Full ablation for single pulses has been observed at 2095 J/m2. Large bubbles start to grow already at 1848 J/m2 but collapse after 100–150 ps. Thus the ablation threshold should be somewhere between these two fluences. The determination of the ablation depth is problematic since it shows strong random fluctuations and no systematic increase for higher fluences as would be expected. Improving statistics would require many simulations with different initial conditions. For single pulses an average ablation depth of 27 5 nm was obtained in the range from 2000 to 3700 J/m2.
The initial goal was to simulate fixed fluences at variable time delay far above ablation threshold and time delays as large as possible. For reasons given in the introduction (Sec. I.2) this goal could not be achieved fully. In experiments pulses have been used with fluences that are 20 to 60 times the ablation thresholdmildner . In simulations a total fluence above 3700 J/m2 leads to a complete destruction of the sample. Therefore we could study only double pulses at fluences of 1848 and 2218 J/m2.
Possible delay intervals between pulses are also shorter than in experiment. We have studied delay intervals up to 200 ps, with good statistics up to 10 ps. Longer delay intervals lead to very long simulation times even if the damping ramp is applied since the molten material slows down the simulation speed additionally due to the increased mobility of the atoms in the melt as compared to atoms in a solid.
Thus the simulations are still close to the ablation threshold, but now we can scan are large set of intervals systematically.
Double pulses: Both cases (1848 and 2218 J/m2) behave quite similar (see Fig. 5). For the lower fluence a plateau is observed at an ablation depth of nm up to a pulse delay of ps, followed by a decreasing ablation depth up to ps. For the higher fluence the plateau is slightly lower and ranges only up to about 5 ps. The decrease is then observed up to ps. The ablation threshold appears to converge to a second plateau at about nm for longer time delays in the range between ps and 60 ps, but for this range the statistics is rather weak. The behavior of the ablation depth for delay times up to 200 ps is rather inconclusive, but it certainly does not increase again to the value of short time delays.


Pulse attenuation: We are not (yet) able to model the full interaction of the laser beam with the ablation plume including the plasma. In Fig. 6 it is clearly seen how the second pulse interacts with the ablated material by vaporizing it. This scenario is not realistic since the beam has to be applied above the surface of the sample, and the intensity is reduced globally.


A more realistic approach is the following: we can determine a scattering cross section with the absorption length , and atom mass and the density for aluminum if we assume for simplicity that the laser beam interacts with the ablated material in the same way as with the bulk. Measuring the mass and density of the ablated material it is thus possible to determine an attenuation factor for the second pulse. This is certainly a crude model which can be improved in future. In our simulations it results in a material and sample dependent attenuation factor of which has been applied directly after measuring the distribution of the ablated material during simulation. The resulting difference can be seen in Fig. 6 right.
V Summary and Discussion
In the first part with simulations close to the ablation threshold we find that two separate pulses require much more fluence than a single pulse to achieve ablation while the final melting depth is much larger for two pulses than for a single pulse. The reason is that the energy of the pulses adds up but ablation is initiated by the first pulse only. If the height of the second pulse is between 75 and 87.5 % of the first pulse we find that the fluence has to rise up to about 1785 J/m2 to achieve ablation. For the overlapping pulses the ablation threshold is about 15 % higher than twice that for the single pulse. This is due to the lower maximum and shows that it is better to concentrate the laser energy into a very short pulse. The melting depths are larger for the overlapping pulses than for the single pulse which reflects the fact that more energy has been added to the system. This result is in good agreement with our previous study of the melting depth of aluminum Sapporo where we found that the melting depth, which is more robust than the ablation depth, is largely independent of the pulse duration and depends linearly on the applied fluence.
In the second study with fixed fluences and variable time delay we find that within the range of fluences accessible by simulations the ablation depth is more or less constant up to about 3700 J/m2 with rather large errors. The reason for the uncertainty has been explained in Sec. II.3.
In general our results are in good qualitative agreement with experiments semerok ; mildner and hydrodynamical modeling pova . For the double pulses we observe a behavior similar to that obtained in simulations for example by Povarnitsyn et al. pova up to a time delay of 500 ps. In accordance with them we find an attenuation of the rarefaction wave of the second pulse for delay times starting at least at 15 ps, but in contrast to papa this wave is still deeper than the rarefaction wave of the first pulse. Thus we could agree that the attenuation is responsible for the reduction of ablation efficiency. On the other hand we observe an additional effect, namely that for short times the shock waves of the first and second pulse interfere constructively, thus enhancing ablation efficiency or at least keeping it on a high level.
Our results may also be compared to the work of Rosandi and Urbassek Rosandi2010 . The pulses they study are half as wide as ours, and they vary the time between the two pulses. Unfortunately they did not report melting depths and ablation thresholds; thus a quantitative comparison is not possible. They claim that the second pulse increases the formation of voids and ablation if it returns during a pressure maximum while the opposite the pulse acts during a pressure minimum. The modulation of the pressure occur for pulse delays of 10 ps and 2.5 ps, but not for 4 ps. We do not find evidence of such an influence in our simulations.
The major shortcoming of the simulations which limits the comparability to experiment is the limitation of the simulations to ”low” fluences rather close to the ablation threshold. Although there is some space to improve the performance our simulation the only solution is to study much larger samples and to carry out many more simulations to improve statistics.
Other experimental results for covalent materials show that the most effective way to ablate material by multi-pulses is a decreasing sequence of pulses with very short distance between them, almost overlapping. For increasing sequences the small peaks at the beginning do not lead to melting or ablation and thus this pulse shape is not as effective as decreasing pulses. The most effective pulse shape, however, seems to be a single sharply rising pulse with a slow decay Cola11 .
VI Conclusion
We have presented a study of a combined molecular dynamics simulation and two-temperature model applied to femtosecond laser ablation. We find that the specific pulse shape is rather insignificant for metals, shorter pulses lead to higher electron temperatures and require less fluence since the energy is more concentrated. Double pulses have no advantage over single pulses at delays up to hundreds of picoseconds, and this is even more significant if the second pulse is reduced through absorption.
VII Acknowledgment
This work has been supported by the German Research Foundation DFG as part of the Collaborative Research Center SFB 716 in subproject B.5.
References
- (1) A. Semerok, and C. Dutouquet Thin Solid Film 453-454, 501 (2004).
- (2) E. Axente, N. Mihailescu, J. Hermann, and T.E. Itina, Appl. Phys. Lett. 99, 081502 (2011).
- (3) J. Mildner, C. Sarpe, N. Götte, M. Wollenhaupt, and T. Baumert Appl. Surf. Sci. 302, 291 (2014).
- (4) M.E. Povarnitsyn, T.E. Itina, K.V. Khishchenko, and P.R. Levashov Phys. Rev. Lett. 103, 195002 (2009).
- (5) L. Englert, B. Rethfeld, L. Haag, M. Wollenhaupt, C. Sarpe-Tudoran, and T. Baumert, Opt. Express 15 17855 (2007).
- (6) A.M. Weiner, Rev. Sci. Inst. 71 1929 (2000).
- (7) E.L. Papadopoulou, E. Axente, E. Magoulakis, C. Fotakis, and P.A. Loukakos Appl. Surf. Sci. 257, 508 (2010).
- (8) M.E. Povaritsyn, T.E. Itina, P.R. Levashov, K.V. Khishchenko, Appl. Surf. Sci. 257 5168 (2011).
- (9) S. I. Anisimov, B. L. Kapeliovich, and T. L. Perel’man, Sov. Phys. JETP 39, 375 (1974).
- (10) D.S. Ivanov, and L.V. Zhigilei, Phys. Rev. B 68, 064114 (2003).
- (11) J. Stadler, R. Mikulla, and H.-R. Trebin, Int. J. Mod. Phys. C 8, 1131 (1997).
- (12) J. Roth, F. Gähler, and H.-R. Trebin, Int. J. Mod. Phys. C 11, 317 (2000).
- (13) F. Ercolessi and J. B. Adams, Europhys. Lett. 26, 583 (1994).
- (14) Z. Lin, L.V. Zhigilei, and V. Celli, Phys. Rev. B 77 075133 (2008).
- (15) D. Bäuerle, Laser Processing and Chemistry, Springer, 2000.
- (16) J. Roth, C. Trichet, H.-R. Trebin, and S. Sonntag in High Performance Computing in Science and Engineering ’10, eds. W. E. Nagel, D. B. Kröner, M. M. Resch, Springer, Heidelberg 2010, pp. 159–168.
- (17) Guo, C., Rodriguezm G., Lobad, A., and Taylor, A.J. Physical Review Letters, 84 (2000) 4493–4496.
- (18) Vorobyev, A. Kuzmichev, V., Kokdy, N., Kohns, P., Dai, J., and Guo, C. Applied Physics A, 82 (2005) 357–362.
- (19) Le Harzic, R., Breitling, D., Weikert, M., Sommer, S., Föhl, C., Dausinger, F., Valette, S., Donnet, C., and Audouard, E. Applied Physics A, 80 (2005) 1589–1593.
- (20) Anisimov S.I., Inogamov, N.A., Petrov, Y.V., Khklov, V.A., Zhakhovskii V.V., Nishihara, K., Agranat M.B., Ashitkov, S.I., and Komarov P.S. Applied Physcs A, 92 (2008) 797–801.
- (21) Preuss, S., Demchuk, A., and Stuke, M. Applied Physics A, 61 (1995) 33–37.
- (22) S. Sonntag, C. Trichet, J. Roth, and H.-R. Trebin, Appl. Phys. A 104, 559 (2011).
- (23) L.V. Zhigilei, W. Chengping. Microscopic mechanisms of laser spallation and ablation of metal targets from large-scale molecular dynamics simulations, Applied Phys A, accepted for publication, http://dx.doi.org/10.1007/s00339-013-8086-4.
- (24) S. Sonntag, J. Roth, F. Gähler, and H.-R. Trebin, Appl. Sur. Sci. 255, 9742 (2009).
- (25) Y. Rosandi, and H. M. Urbassek, App. Phys. A 101, 509 (2010).
- (26) J. Siegel, Talk at the 11th Conference on Laser Ablation, Cancun, Mexico, 2011.