Toward Description of and Interactions at High Energies: Problems of Fritiof-based Models
V. Uzhinsky
Laboratory of Information Technologies, JINR, Dubna, Russia
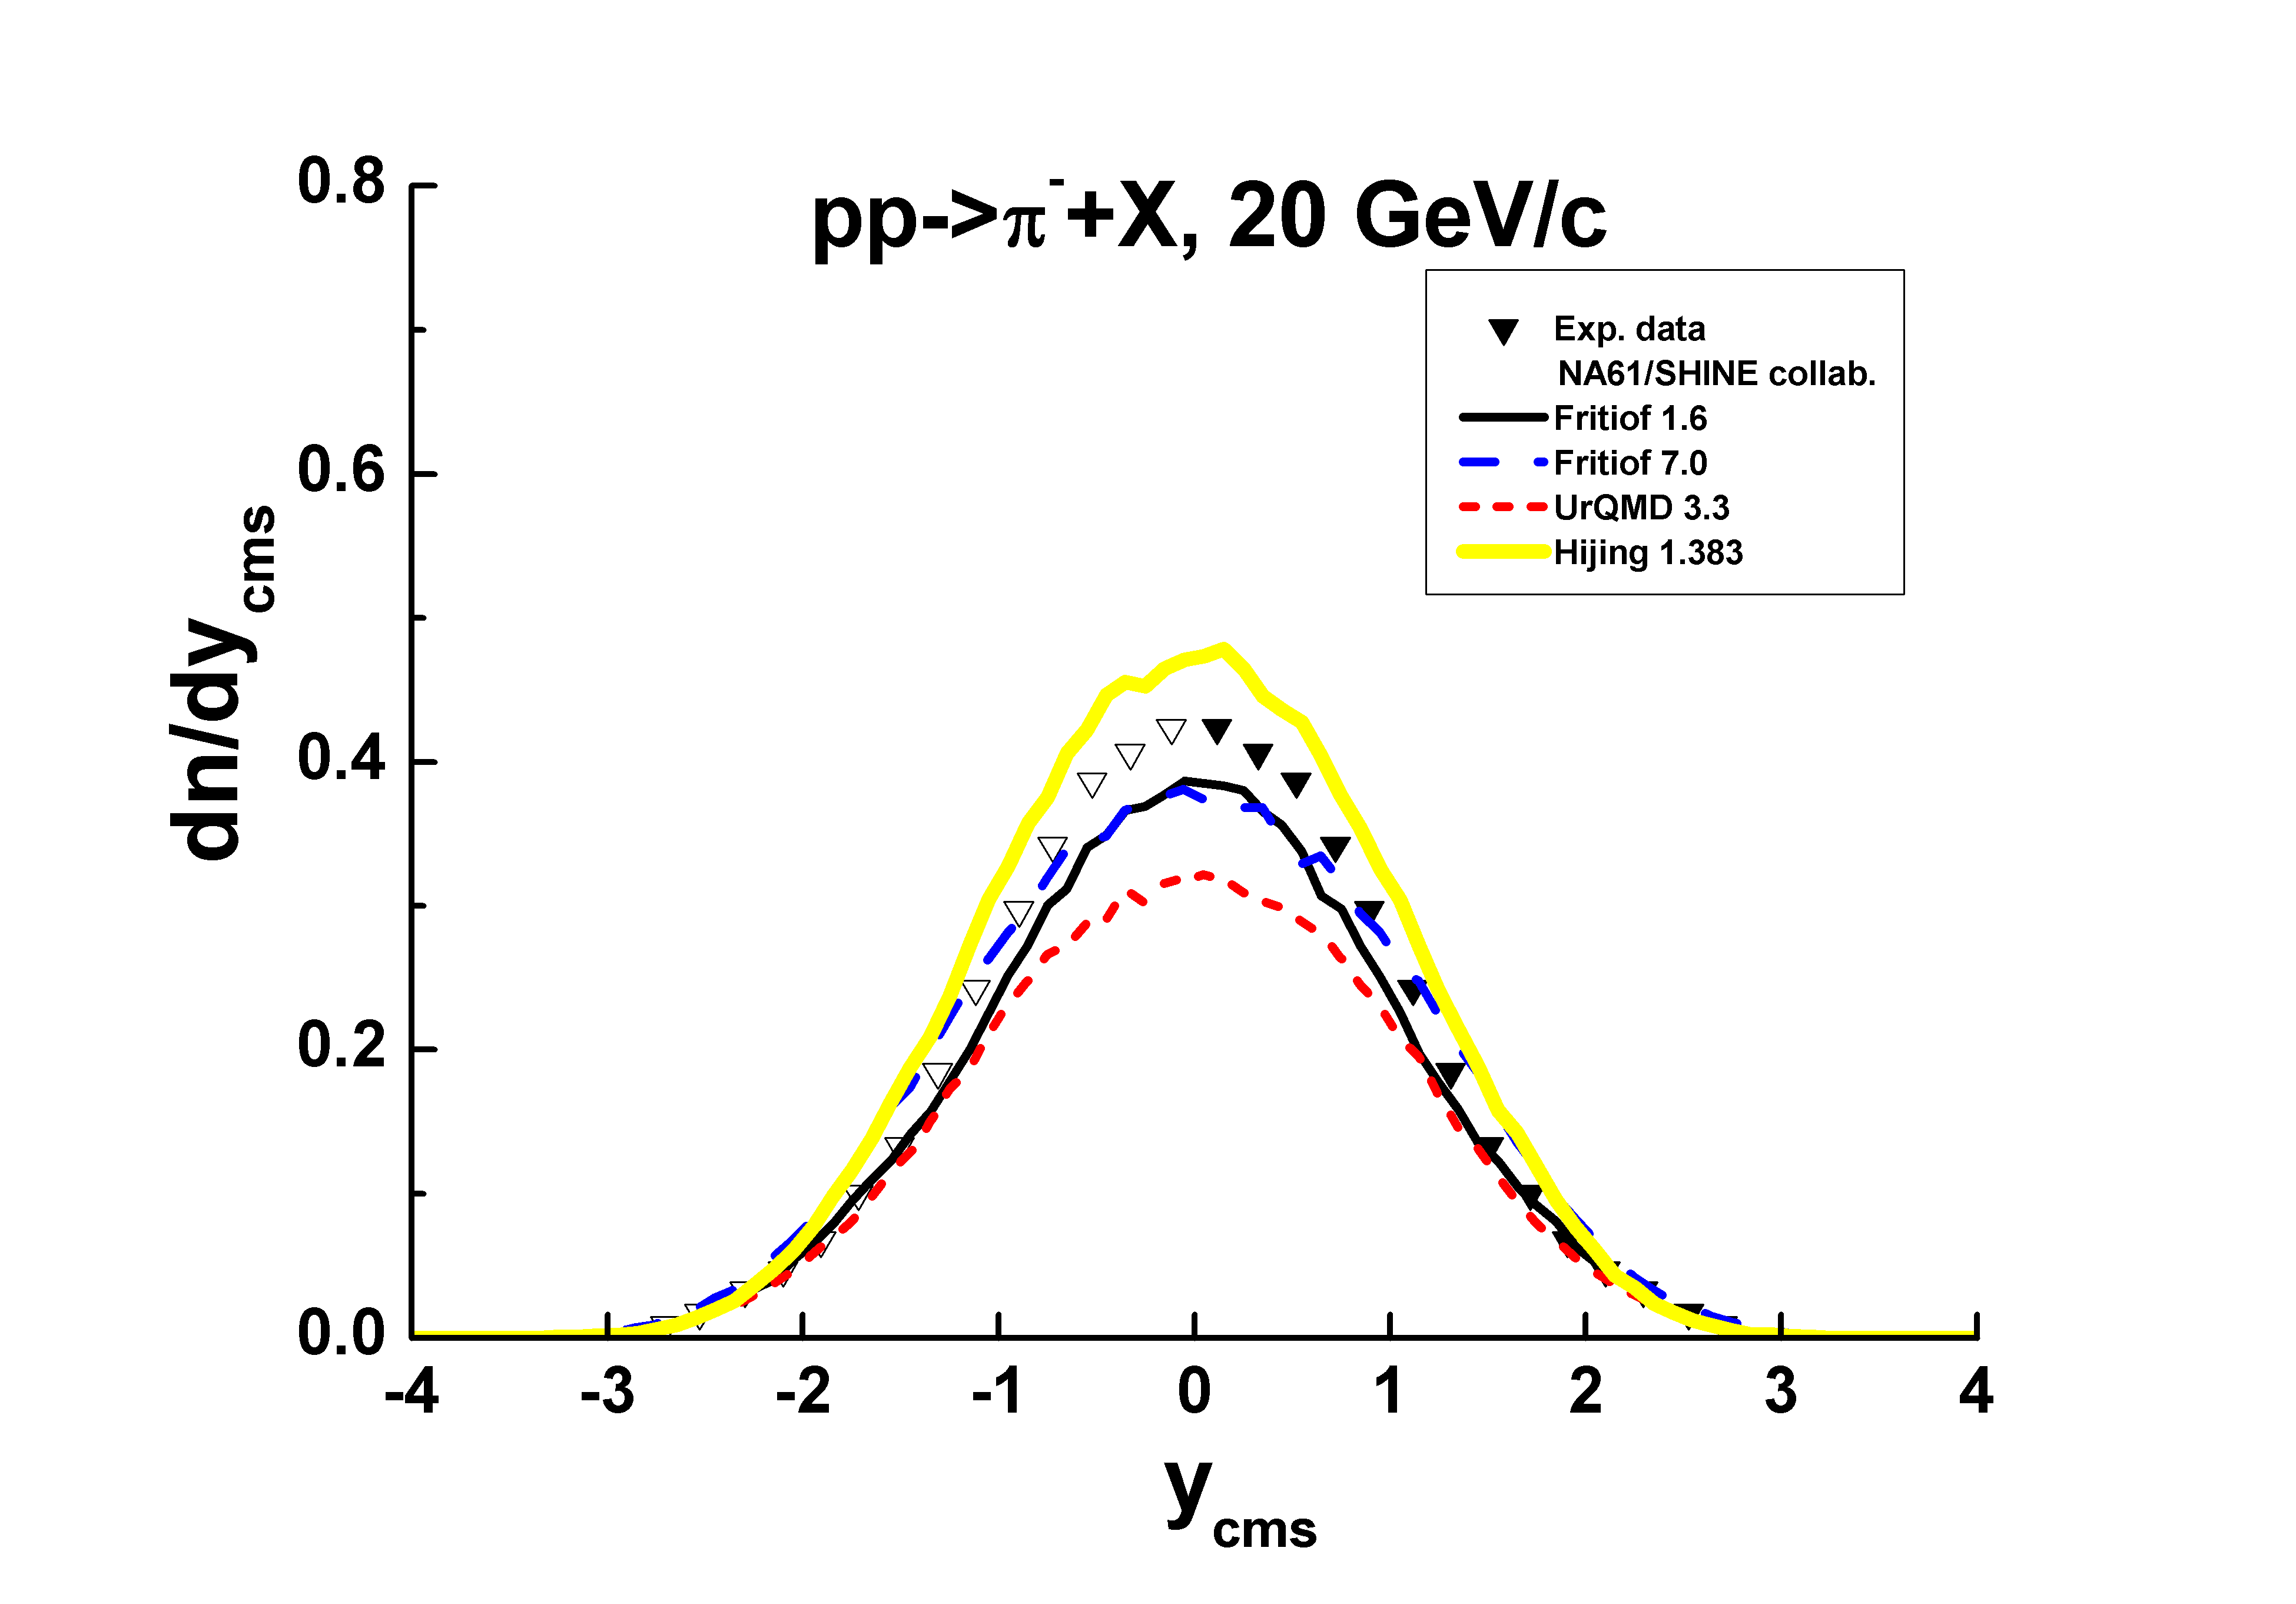
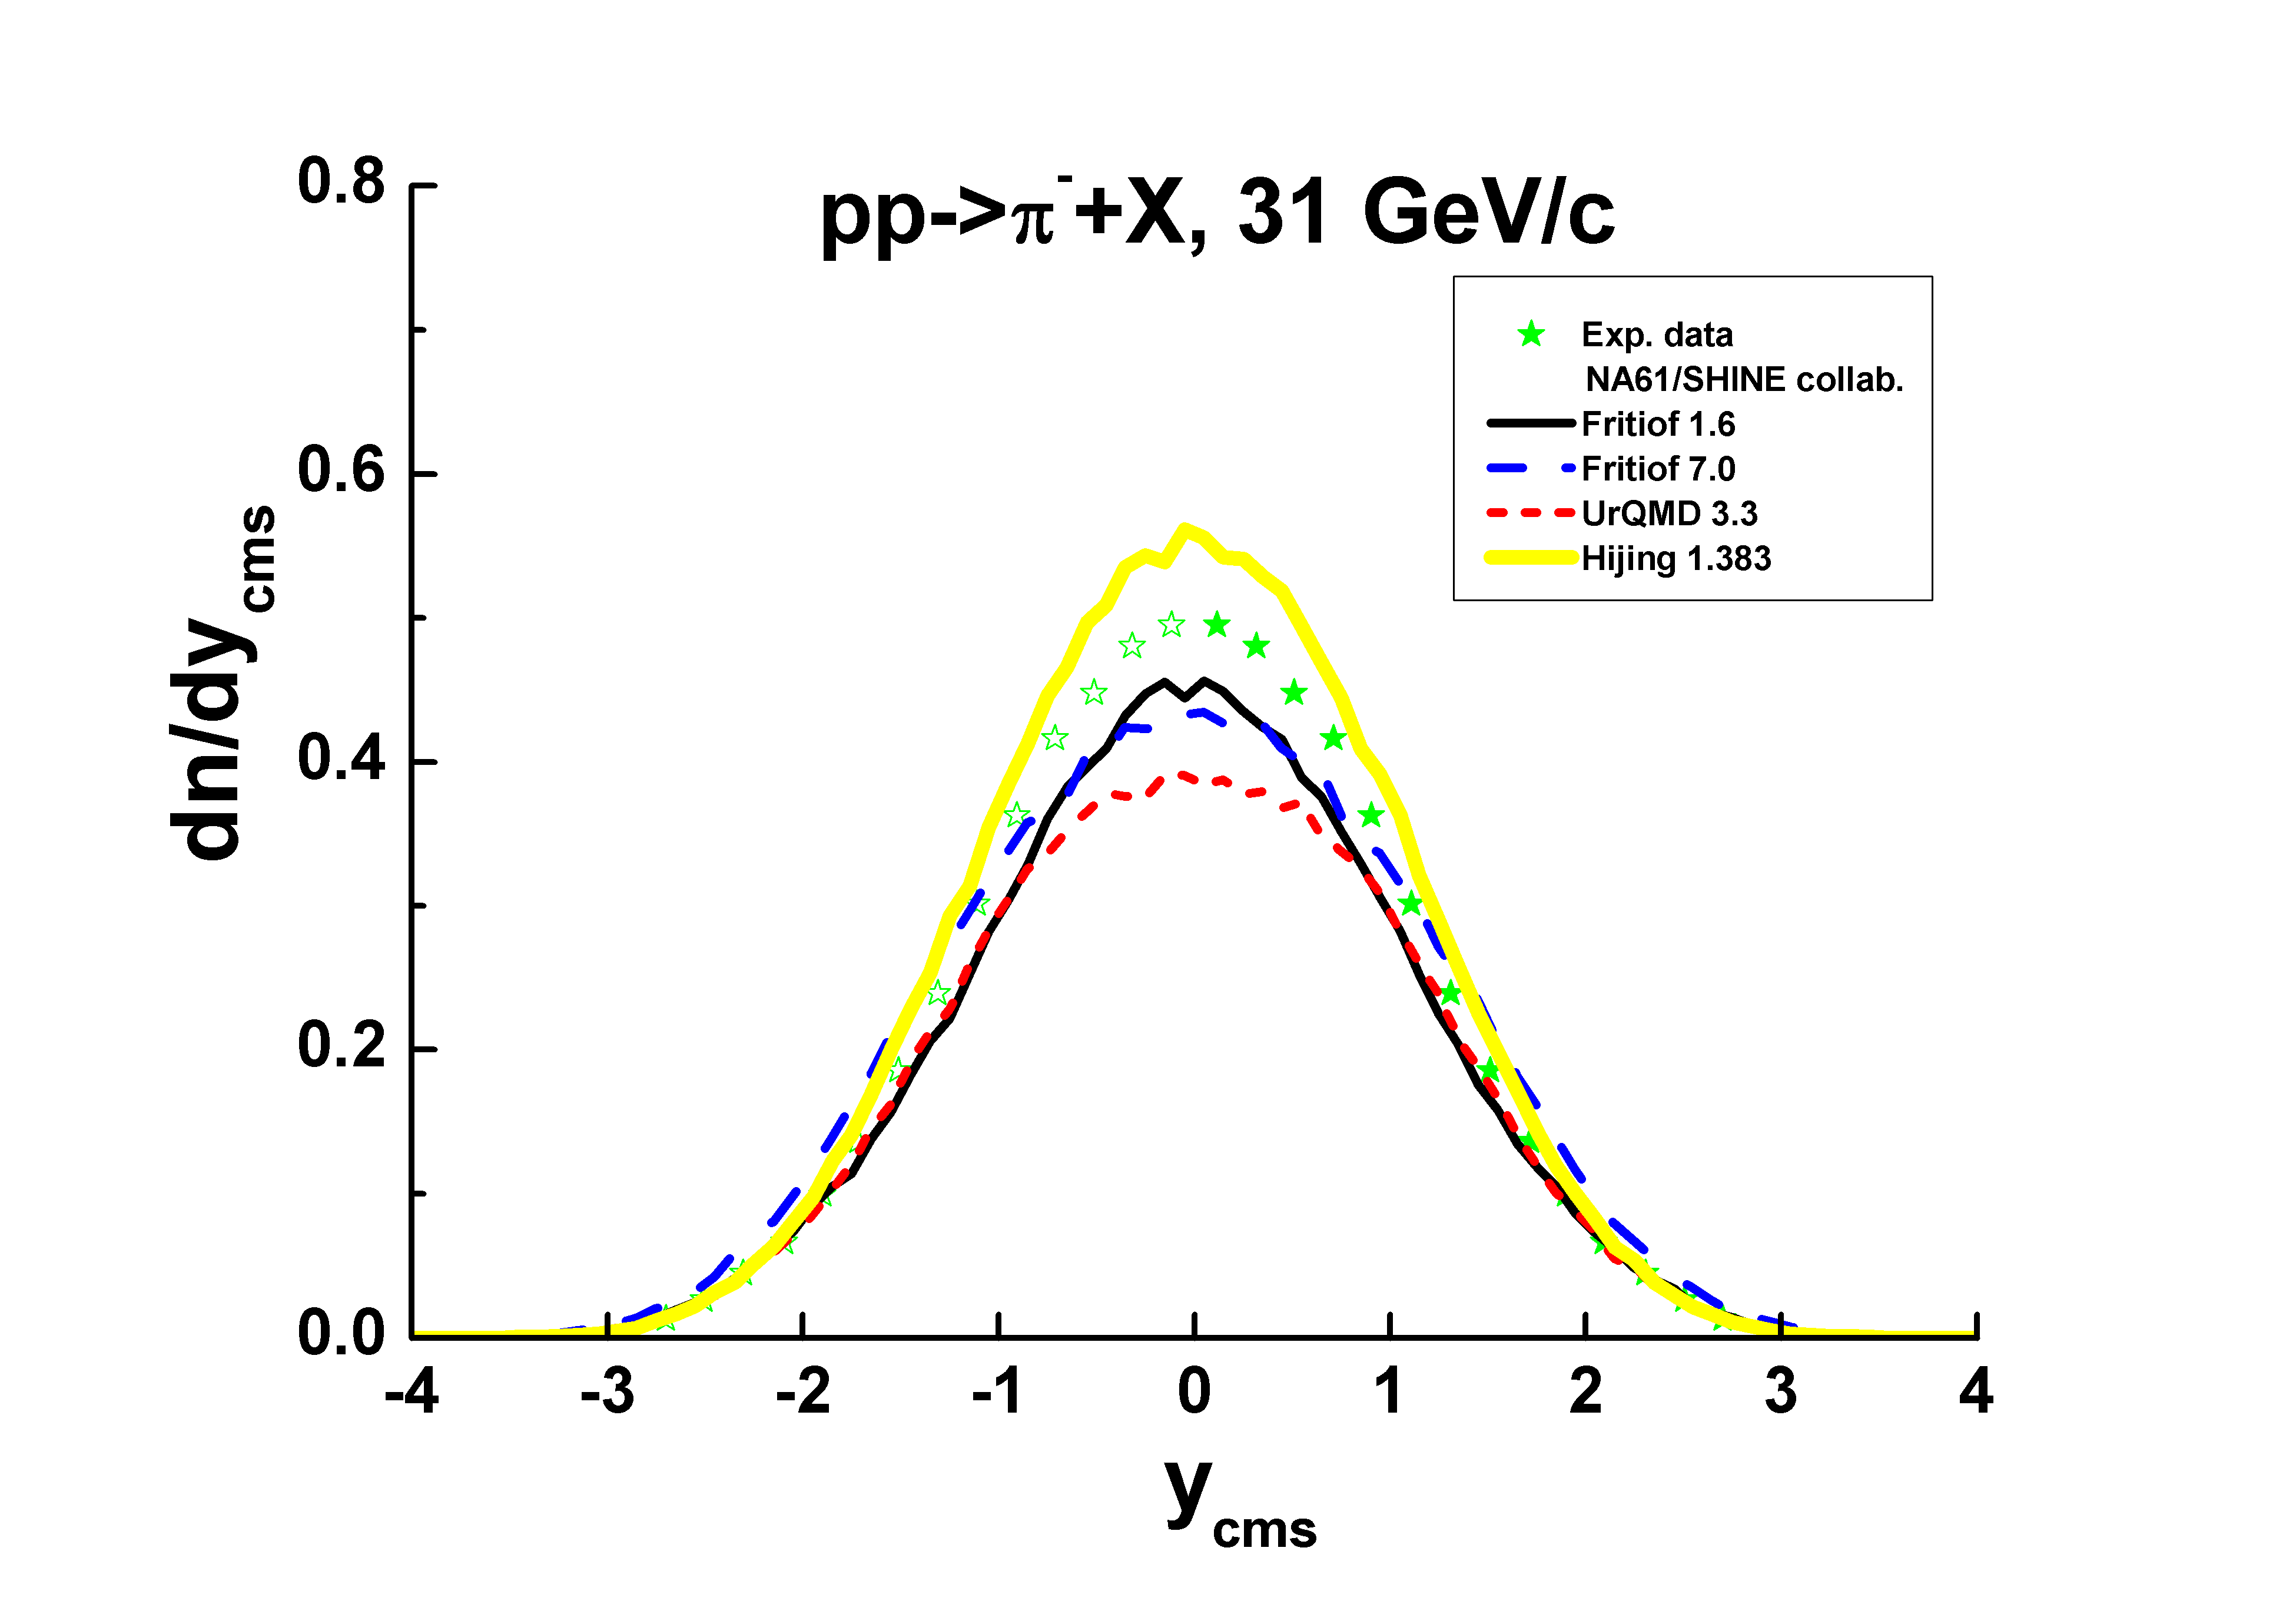
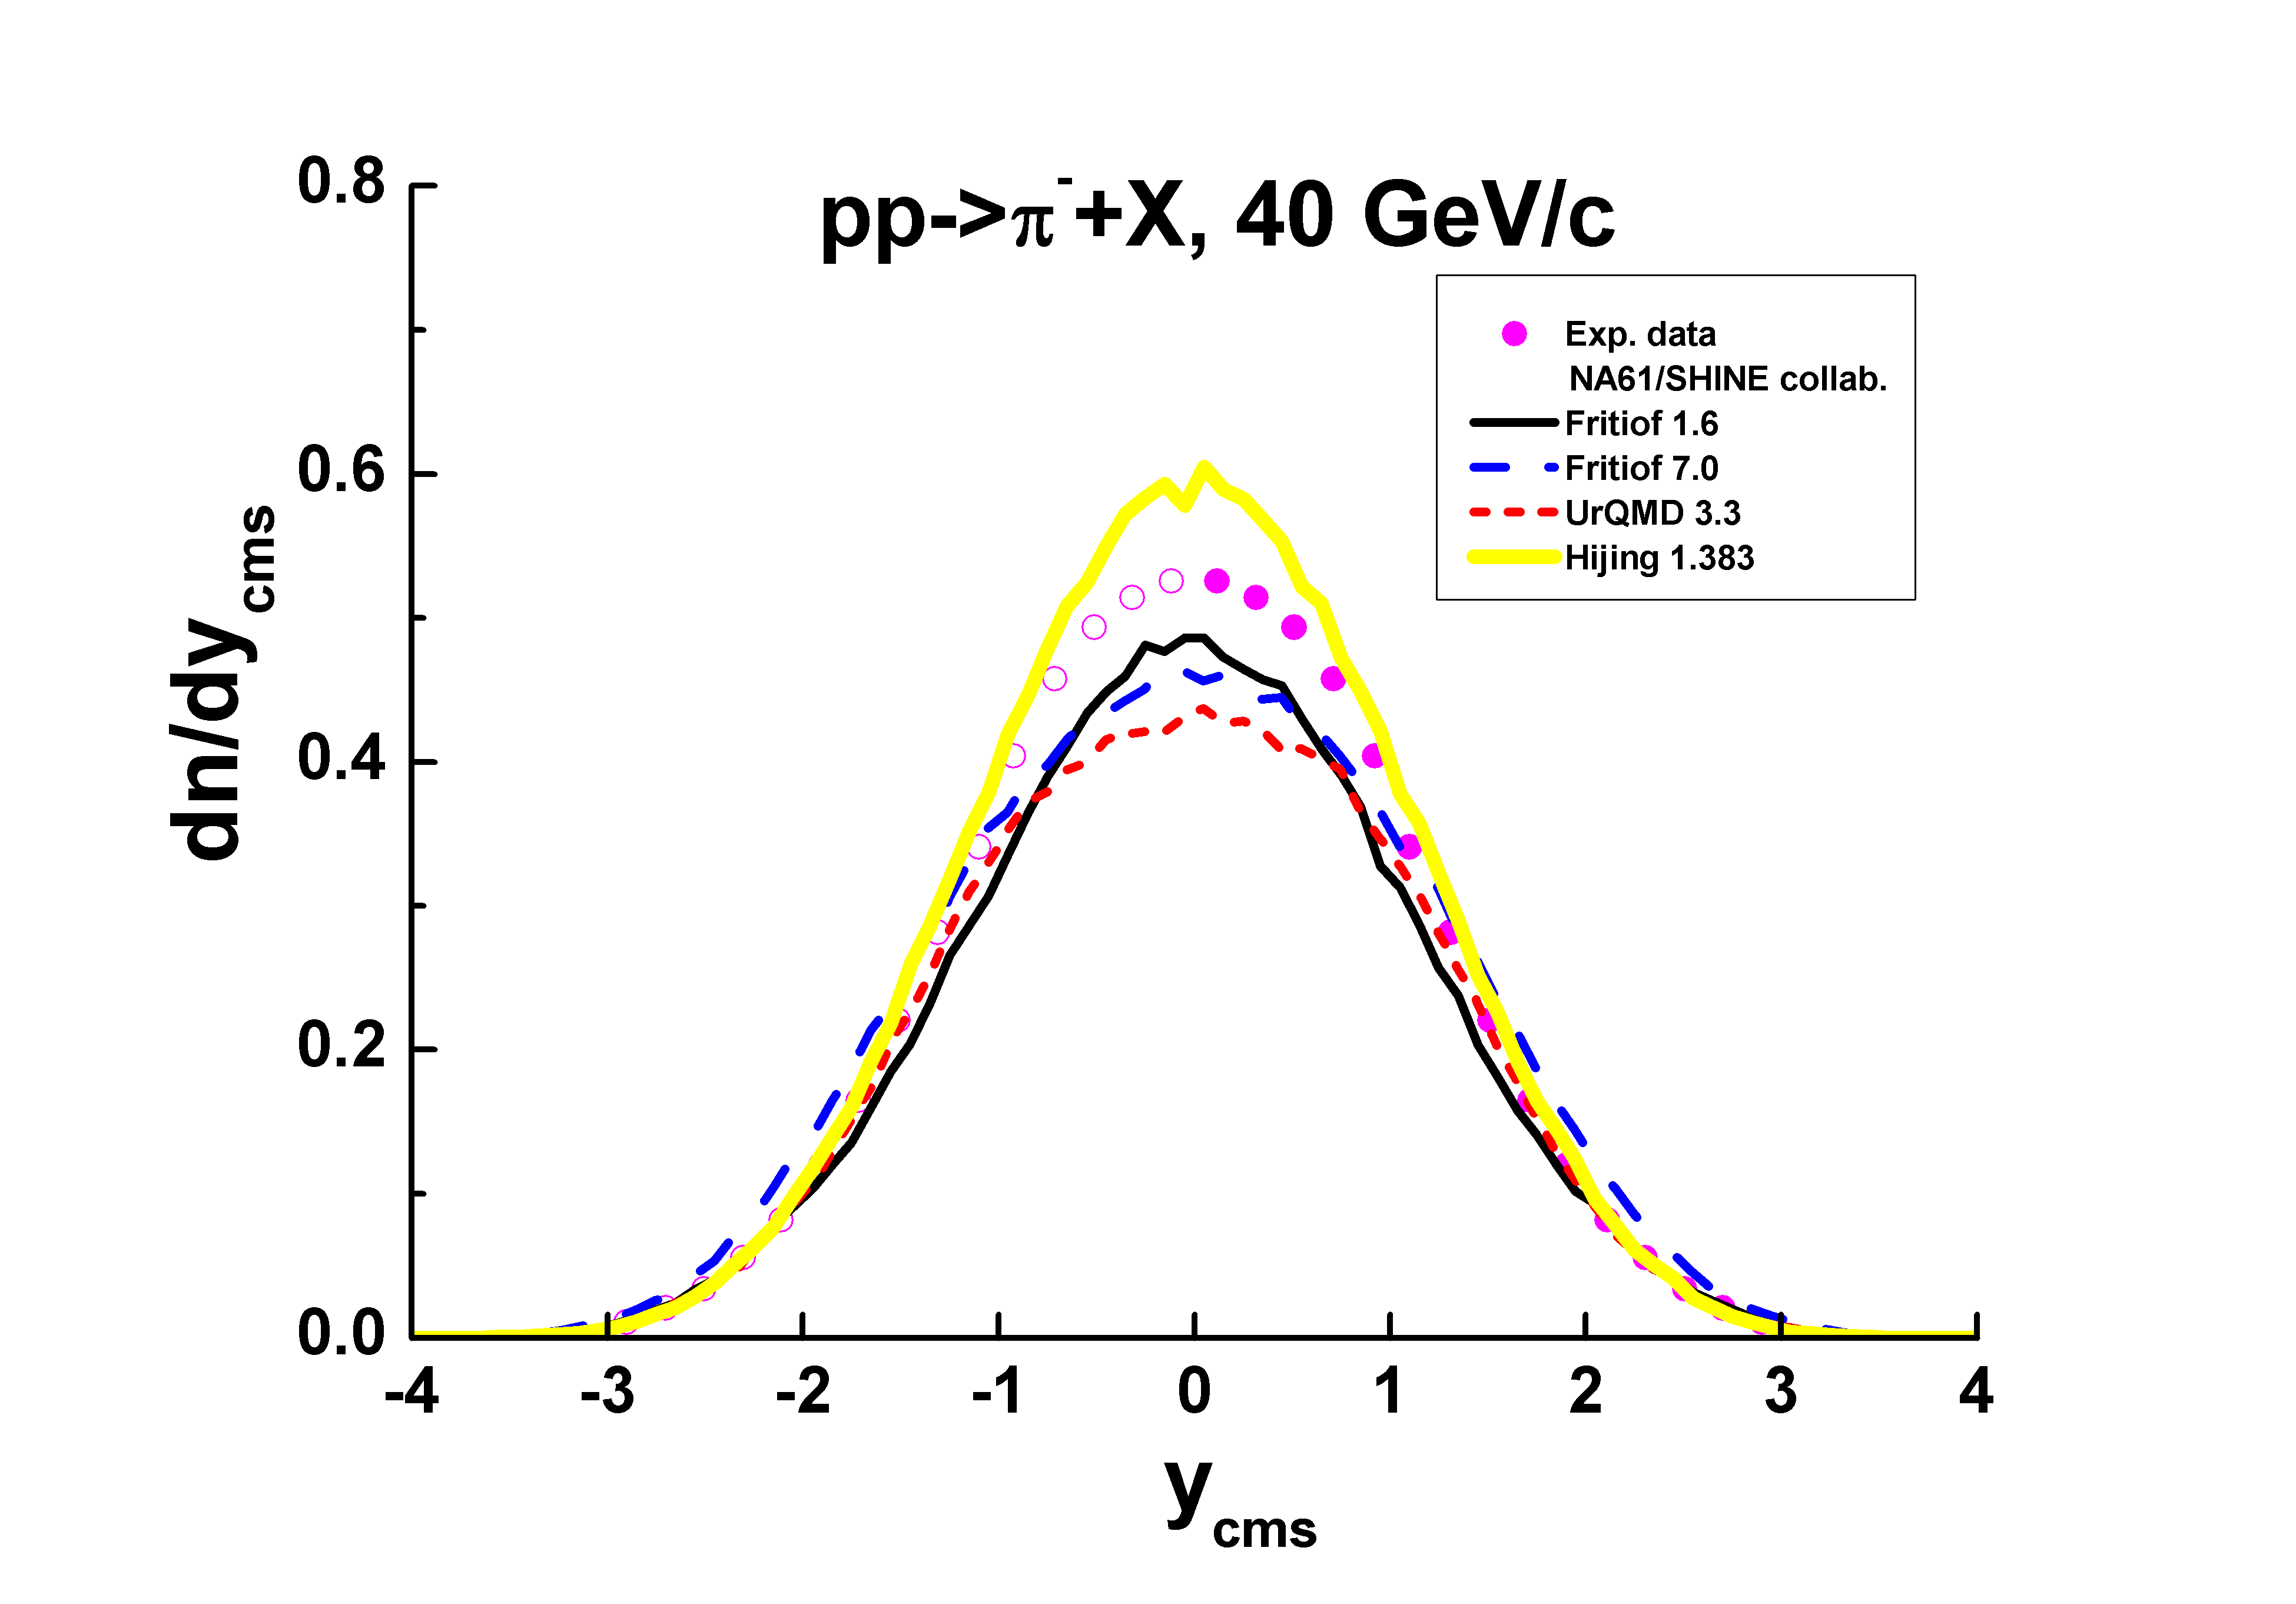
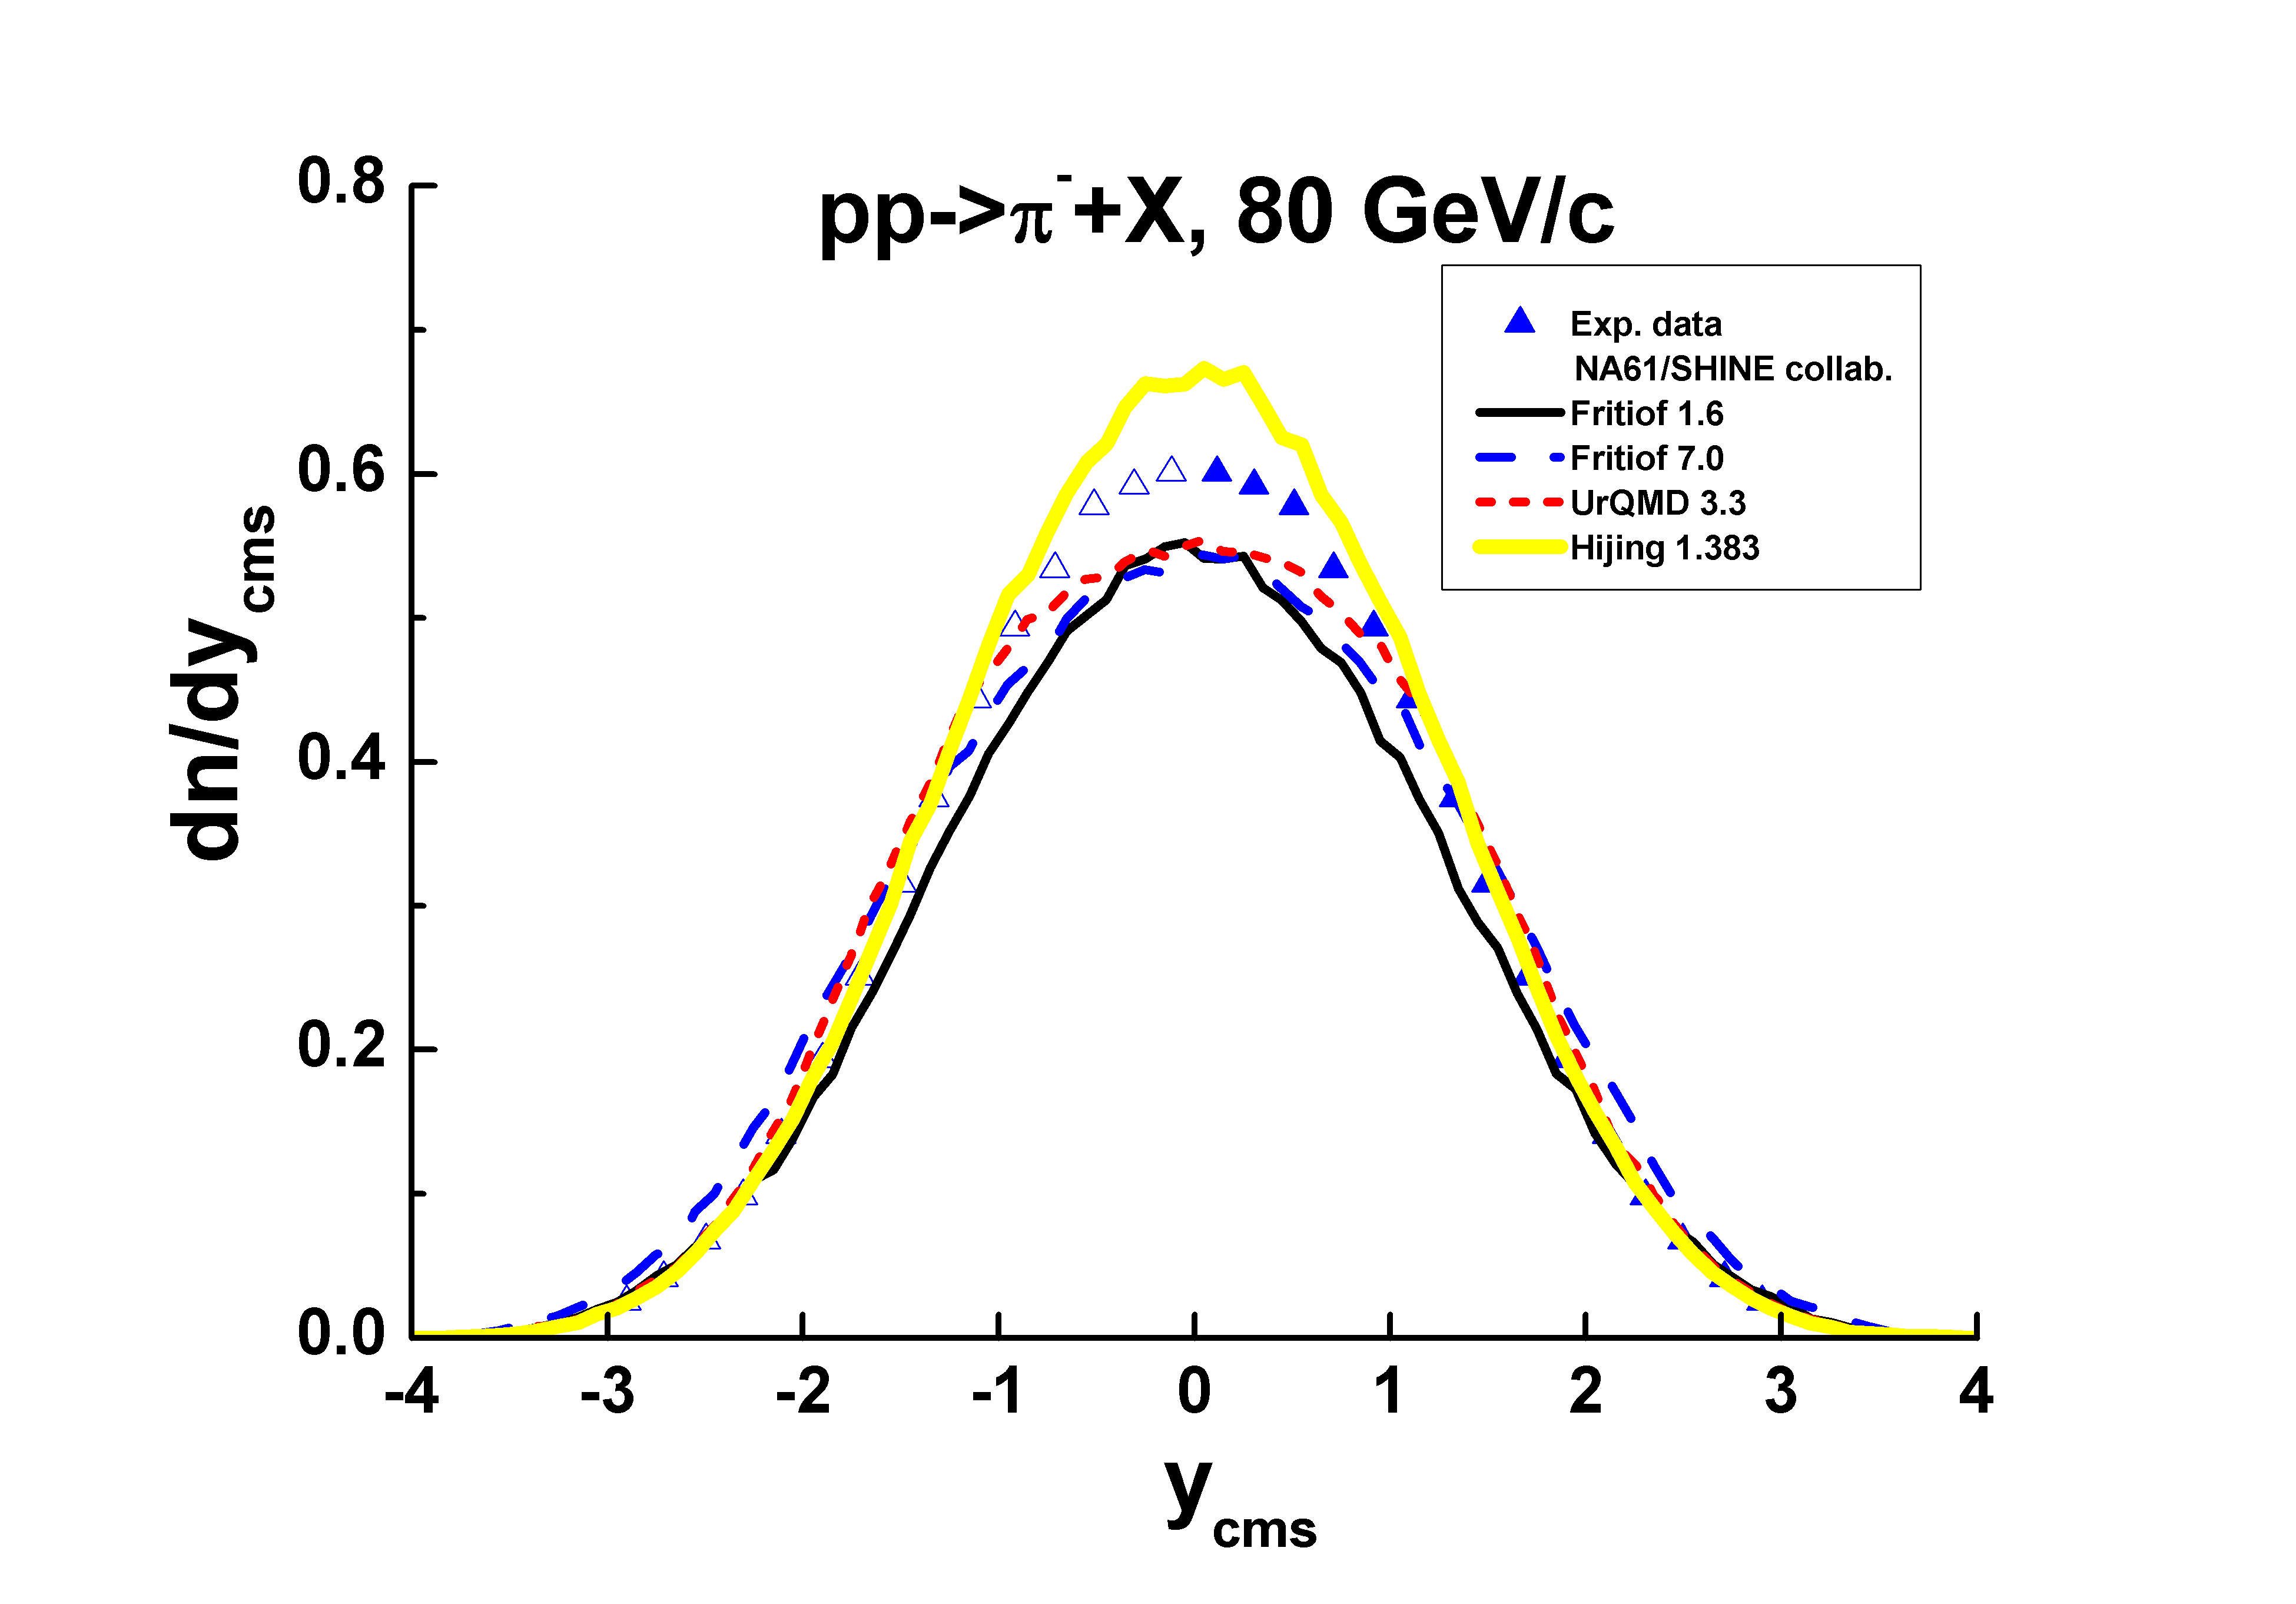
How do the models (Fritiof 1.6, Fritiof 7.0, UrQMD 3.3 and Hijing 1.383) describe experimental data of NA61/SHINE and NA49 Collaborations on and interactions at high energies? An answer on this question is given in the paper. It is shown that the UrQMD model does not reproduce the energy dependence of meson production in -interactions; the Fritiof 1.6 and the Fritiof 7.0 models underestimate the meson production on 10 %; the Hijing model overestimates the data on 10 %. A change of a LUND fragmentation function parameter in the Fritiof models 1.6/7.0 allows to describe the data. A decreasing of probabilities of binary processes in the UrQMD model like and so on, allows one to describe the data, thus a problem of a correct accounting of the processes arises. An increasing of a probability of the single diffraction dissociation in the Hijing model from 35 % to 50 % allows to describe the data, though a spectrum of masses produced in the diffraction is not satisfactory. A description of the diffraction is a problem in all the models.
Introduction
The NA61/SHINE Collaboration has presented a high precision data on -meson inclusive distributions in interactions at 20, 31, 40, 80 and 158 GeV/c [1]. The NA49 Collaboration has published data on , , proton and antiproton spectra in [2, 3, 4] and [5] interactions at 158 GeV/c. The NA61/SHINE Collaboration has the analogous data for interactions at 31 GeV/c [6]. There were some attempts to describe the last data in the modern Monte Carlo models – FLUKA, VENUS, UrQMD (see [6]) and FTF of Geant4 [7, 8]. Recently, a description of the data [1, 2, 3, 4] in the UrQMD model was given in paper [9]. As it was shown there, the model does not reproduce energy dependence of the -meson production in the central region (see Fig. 1). A natural question arises – How do the other models describe the data? In the presented paper, Fritiof-based models will be considered.
The Fritiof model [10, 11] is in the basis of well-known event generators, Hijing and UrQMD. It is explained by its clear physical ideas, and a defined beauty of its code [11] by itself. The Hijing model [12, 13] was used at design of RHIC and LHC setups for a study of nucleus-nucleus interactions at super high energies. Validation of the model is presented at a web-page [14, 15]. The Ultra-relativistic Quantum Molecular Dynamic model (UrQMD) [16]111) The code of the model version 3.3 see at [17]., 222) Validation of the model see at a web-page [18].) is now applied at a design of future experiments at FAIR [19] and NICA [20] facilities. The Fritiof model is also implemented in the Geant4 toolkit [21] under the name – FTF model. Thus, correctness of the Fritiof-based models is very important for experimental studies and practical applications.
As it is shown in Fig. 1 the models give various predictions for -meson rapidity spectra in interactions. As seen, the Hijing model overestimates the spectra in the central region. The UrQMD model does not reproduce the energy dependence of the spectra. Only at 158 GeV/c there is an agreement between the UrQMD model calculations and the NA49 data. The Fritiof 1.6 and 7.0 models underestimate the data on 10 %. In all calculations, the yield of decays into -meson production (%) was not accounted.
The worst situation takes place with a description of proton spectra presented in Fig. 2. As seen, the models essentially underestimate a height of the diffraction peak at except the UrQMD model. Outside the peak, the models give various predictions.
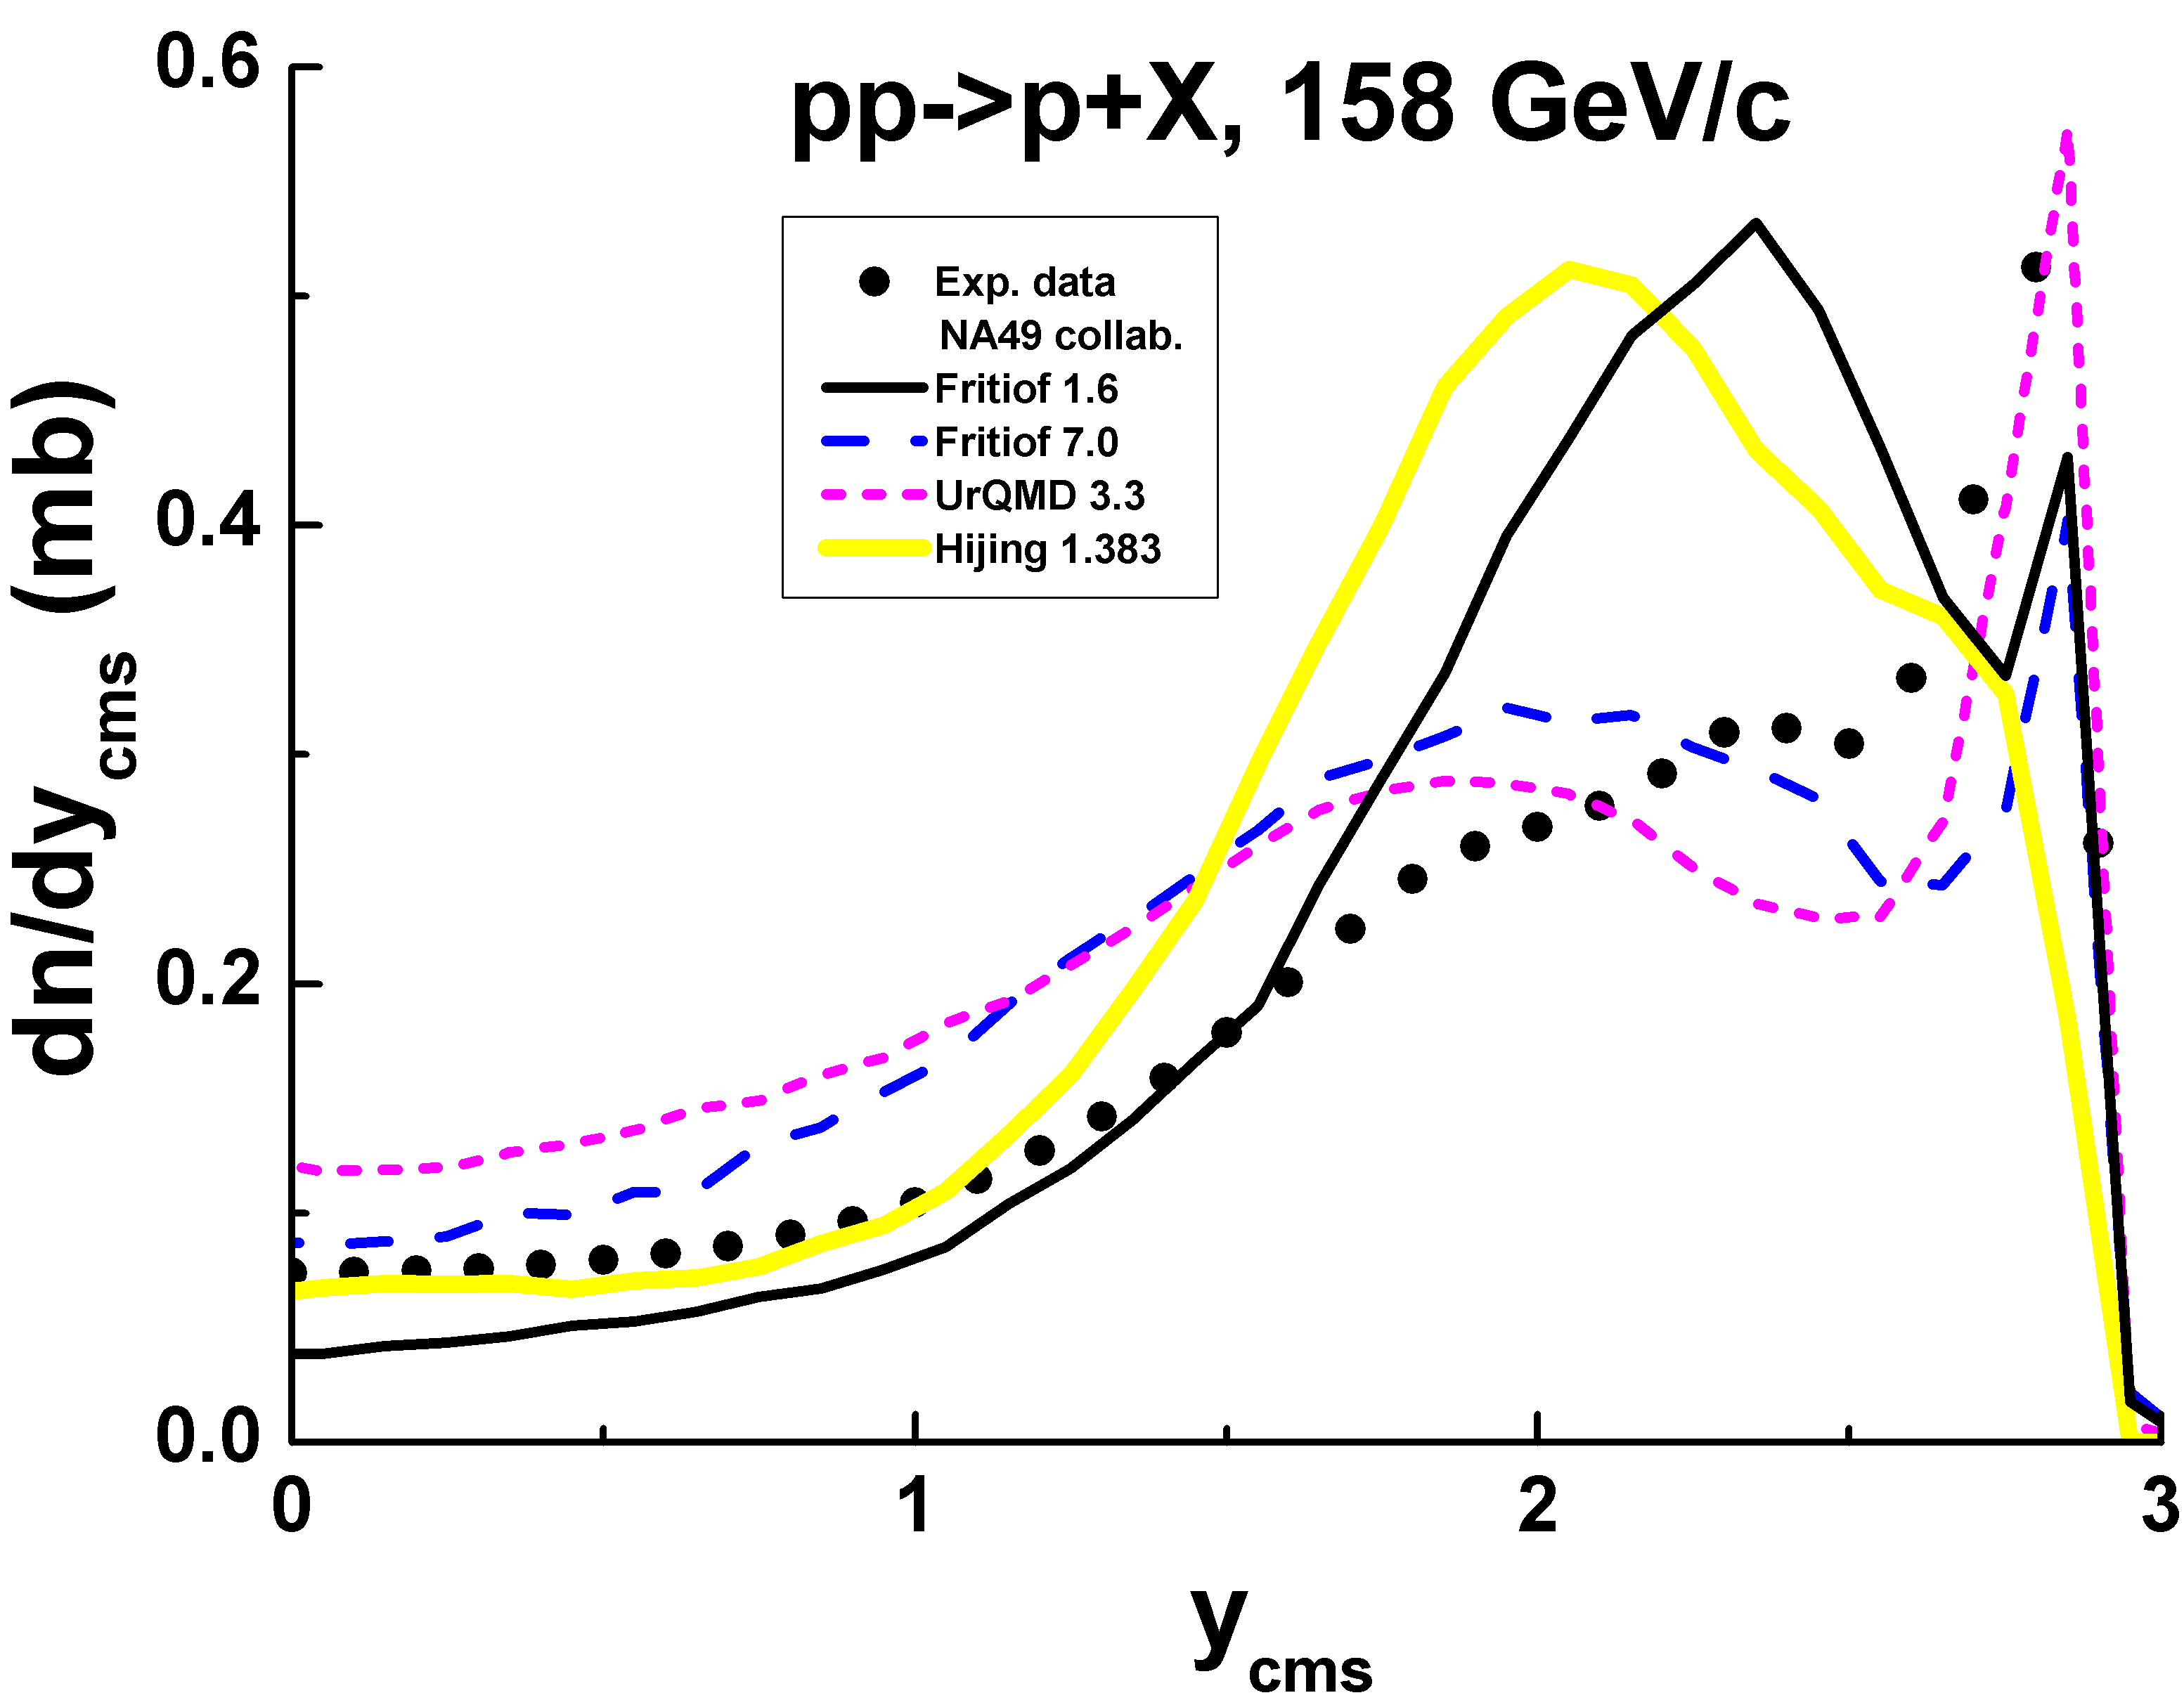
In order to understand such results one needs to know the main ideas of the Fritiof model and their program implementations. The main ideas will be presented in Sec. 1, and the program implementations are considered in Sec. 2.
Possibilities of model’s improvements are considered in Sec. 3. All of them include a change of a single diffraction dissociation cross section. Necessity of the change is studied in Sec. 4 where experimental data on the diffraction dissociation and model’s calculations are analyzed. Results for interactions are given in Sec. 5.
A general conclusion is – simulations of the diffraction dissociation and their cross sections must be improved in the model.
1 Main ideas of the Fritiof model
The Fritiof model [10, 11] assumes that all hadron-hadron interactions are binary reactions, , where and are excited states of the hadrons with discrete or continuous mass spectra (see Fig. 3). If one of the final hadrons is in its ground state () the reaction is called ”single diffraction dissociation”, and if neither hadron is in its ground state it is called a ”non-diffractive” interaction.

The excited hadrons are treated as QCD-strings, and the corresponding LUND-string fragmentation model is applied in order to simulate their decays.
The key ingredient of the Fritiof model is a sampling of the string masses. In general, the set of final state of interactions can be represented by Fig. 4, where samples of possible string masses are shown. There is a point corresponding to elastic scattering, a group of points which represents final states of binary hadron-hadron interactions like and so on, lines corresponding to the diffractive interactions, and various intermediate regions. The region populated with the red points is responsible for the non-diffractive interactions. In the model, the mass sampling threshold is set equal to the ground state hadron masses, but in principle the threshold can be lower than these masses. The string masses are sampled in the triangular region restricted by the diagonal line corresponding to the kinematical limit where and are the masses of the and hadrons, and also of the threshold lines. If a point is below the string mass threshold, , it is shifted to the nearest diffraction line.
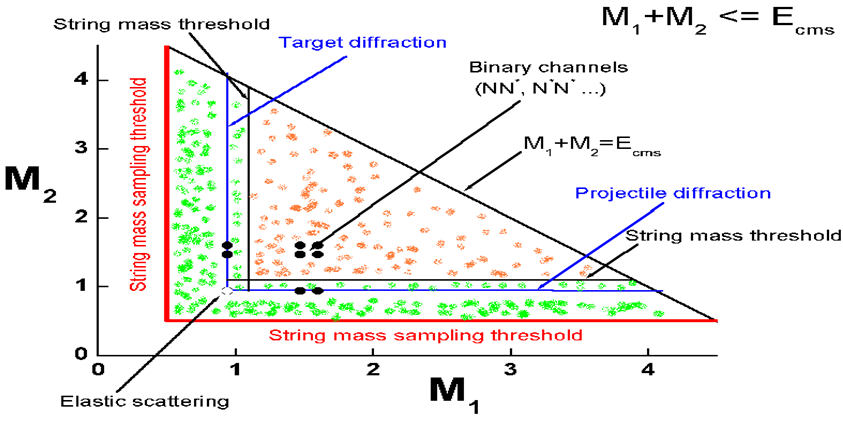
The original Fritiof model had no points corresponding to elastic scattering and to the binary final states. As it was known at the time of its creation, the mass of an object produced by diffraction dissociation, , for example from the reaction , is distributed as , so it was natural to assume that the object mass distributions in all inelastic interactions obeyed the same law. This can be re-written using the light-cone momentum variables, or ,
where is an energy of a particle, and is its longitudinal momentum along the collision axis. At large energy and positive , . At negative , . Usually, the transferred transverse momentum, , is small and can be neglected. In the case, and . Thus, it was assumed that and of a projectile and a target associated hadron, respectively, are distributed as
| (1) |
A gaussian distribution was used for a sampling of .
In the case of hadron-nucleus or nucleus-nucleus interactions it was assumed that the created objects can interact further with other nuclear nucleons and create new objects. Assuming equal masses of the objects, the multiplicity of particles produced in these interactions will be proportional to the number of participating nuclear nucleons. Due to this, the multiplicity of particles produced in hadron-nucleus or nucleus-nucleus interactions is larger than that in hadron-hadron ones. The probabilities of multiple intra-nuclear collisions were sampled with the help of a simplified Glauber model. Cascading of secondary particles was not considered.
Because the Fermi motion of nuclear nucleons was simulated in a simple manner, the original Fritiof model [11] could not work at 10–20 GeV/c.
It was assumed in the model that the created objects are quark-gluon strings with constituent quarks at their ends originating from the primary colliding hadrons. The LUND string fragmentation model (JETSET 6.3 [22]) was applied for a simulation of the object decays. It was assumed also that the strings with sufficiently large masses have ”kinks” – additional radiated gluons (see subroutine TORSTE in the program code [11]). This was very important for a correct reproduction of particle multiplicities in the interactions.
2 Program implementations of the Fritiof model
Fritiof 1.6
In this model implementation 1.2 GeV for nucleons and the average 0.282 GeV/c. All objects are considered as strings and processed by JETSET 6.3 independently!
It is rather easy to improve the description of the data of Fig. 1 changing the parameter ”a” in the LUND string fragmentation function, , from 0.5 to 1.25 (PAR(31)=1.25).
Rather complicated algorithm of a baryon production by a string is used in the LUND model. It is implemented in JETSET 6.3 and JETSET 7.3.
Fritiof 7.0
1.2 GeV and the average 0.1 GeV/c in this model implementation. Due to the lower than in the original model, the diffraction peak (see Fig. 2) is more narrow than in the Fritiof 1.6 model. Strings are not considered, instead quarks of the objects, and sometimes saved hadrons and gluons are processed by the JETSET 7.3 [23] as a unit system. Thus, there can be in the system after a diffraction dissociation a saved baryon, a quark and a diquark. Rather often, there can be a gluon. If the system mass is small enough ( 3 GeV), JETSET 7.3 erases the gluon, and projects the quark and the diquark on a nearest baryonic state. Very often the state is . After a sampling of the mass, a momentum of the saved baryon is re-defined. This is reflecting on spectra of saved hadrons.
UrQMD 3.3
In the code of the model, where is a nucleon mass, and GeV (CTParam(2)=0.52). The average 1.6 GeV/c (CTParam(31)=1.6). Such large value of is caused by another algorithm of the mass sampling (see subroutine STREXCT in make22.f of the corresponding source file).
Instead of the complicated algorithm of a baryon production in the LUND model implemented in JETSET 6.3 and JETSET 7.3, the following fragmentation function of a string into a baryon is used:
| (2) |
where is a fraction of light-code momentum of the string given to a created baryon.
There is a possibility to consider a diquark as a unit in other Fritiof model implementations setting, for example, an option MST(10)=0 in JETSET 6.3. In the case, the Feynman-Field fragmentation function will be used for diquarks.
UrQMD models considers also the following binary reaction: , , , , , , . They are very important at low energies.
Hijing 1.383
In the model, where MeV is a di-quark mass, and GeV (HIPR1(1)=1.5). Though, the value is not used for a separation of the diffractive and non-diffractive interactions. Instead if this, a probability of the single diffraction dissociation for nucleon-nucleon interactions is setting to 35 % for the considered energies (see BLOCK DATA HIDATA, line – DATA (HIDAT0(4,I),I=1,10)/0.35, 0.35, 0.3, 0.3, 0.3, 0.3,), and a mass of a diffractive produced system is sampled along the diffraction lines of Fig. 3 (see SUBROUTINE HIJSFT, lines – 222 X2=HIRND2(6,XMIN,XMAX), and 242 X1=HIRND2(6,XMIN,XMAX)). A lower bound of the mass is about 2 GeV.
A creation of kinky strings is implemented in the model as well as a production of jets and mini-jets. But they are not important for our aims.
3 Tuning of the models
3.1 Hijing model with increased probability of the diffraction dissociation
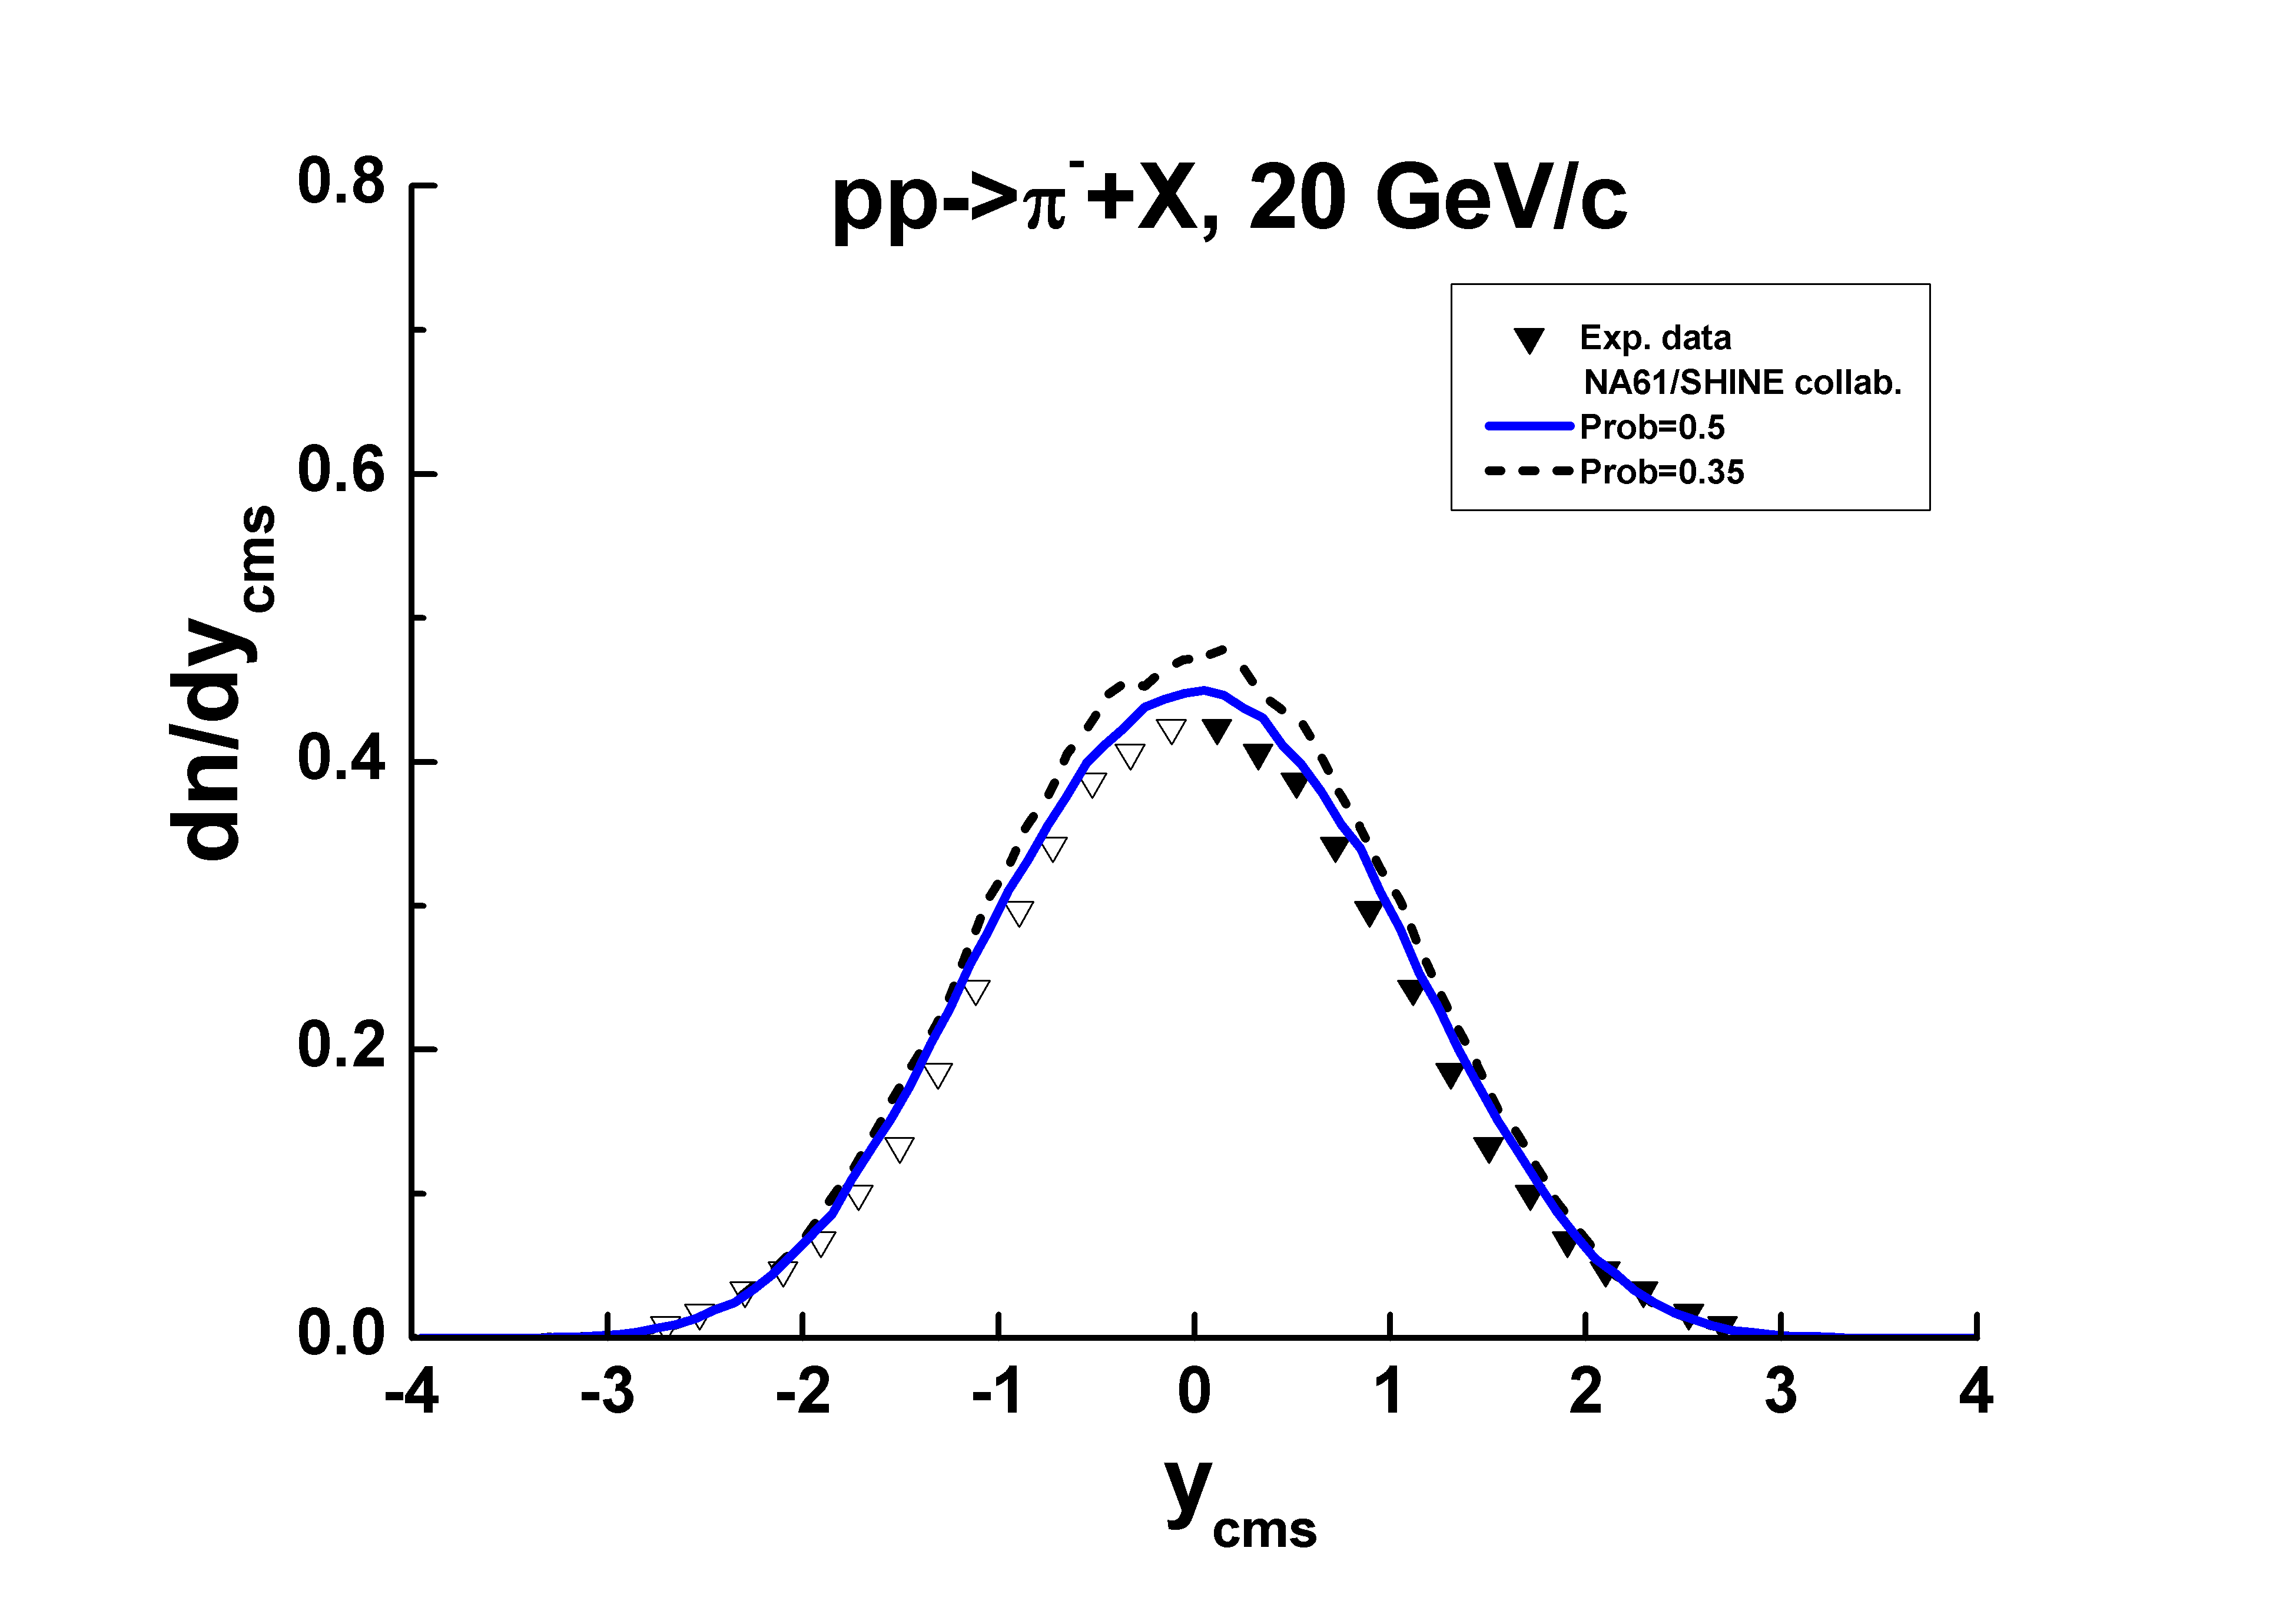
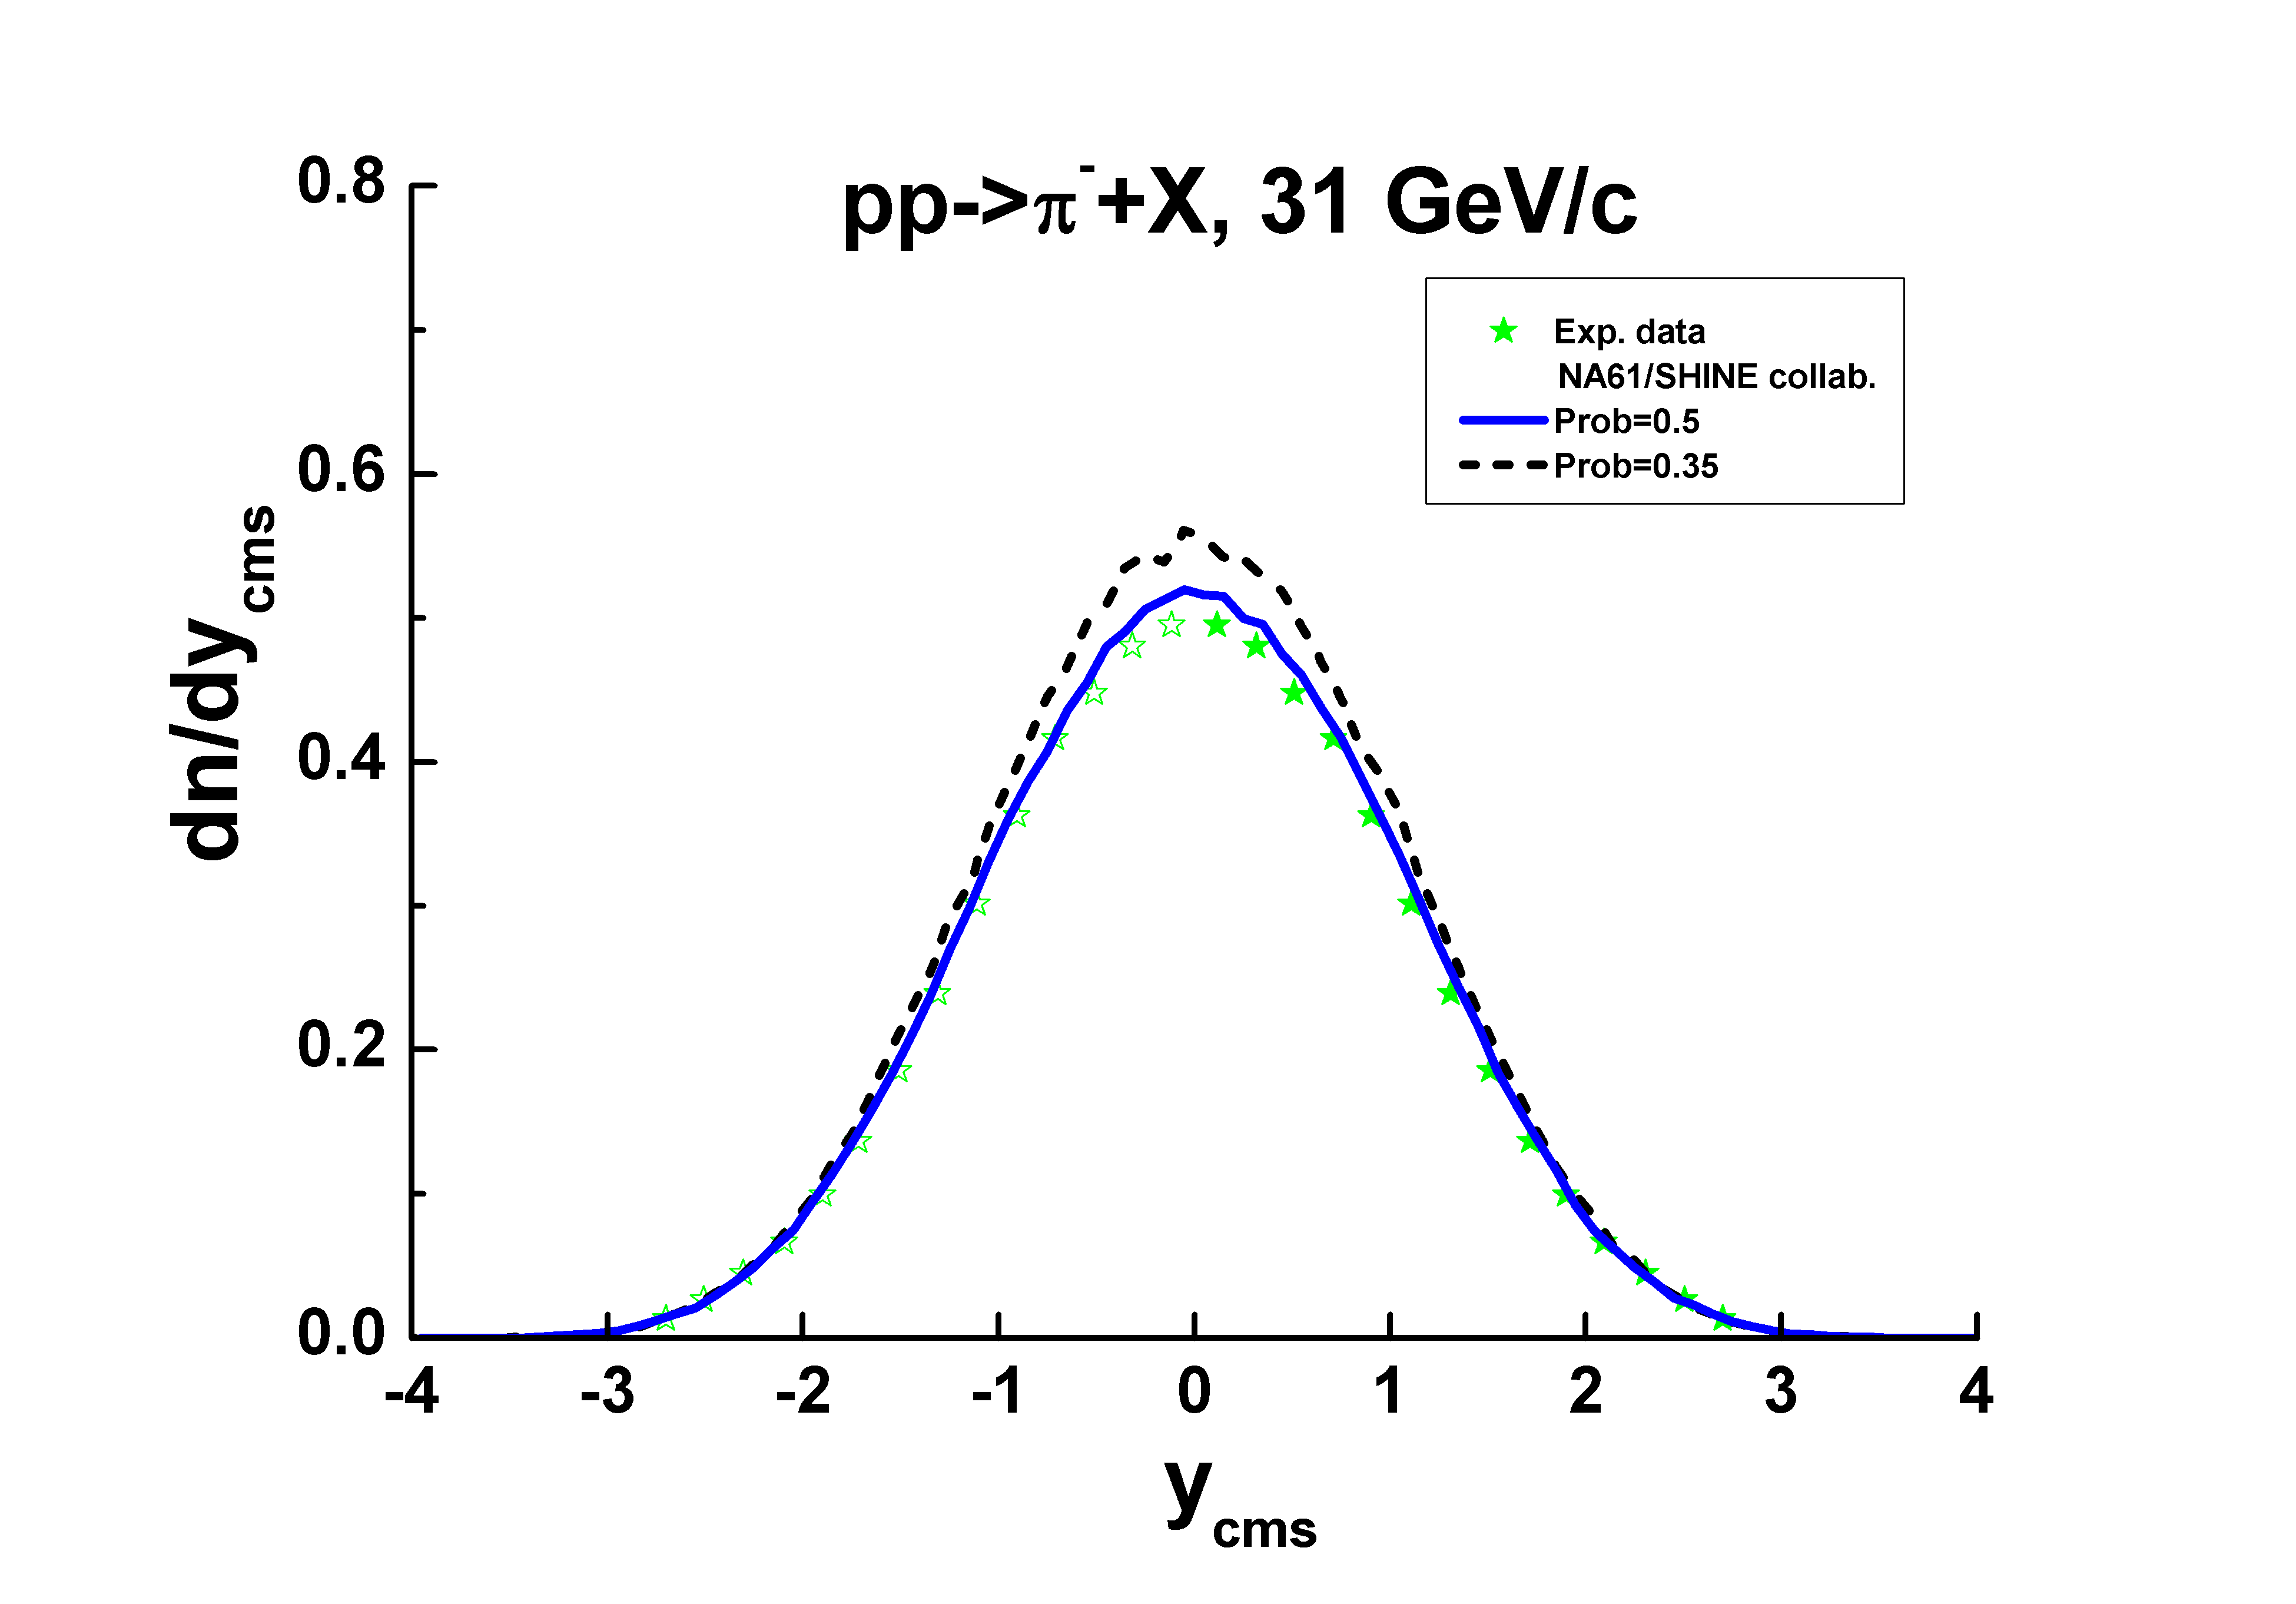
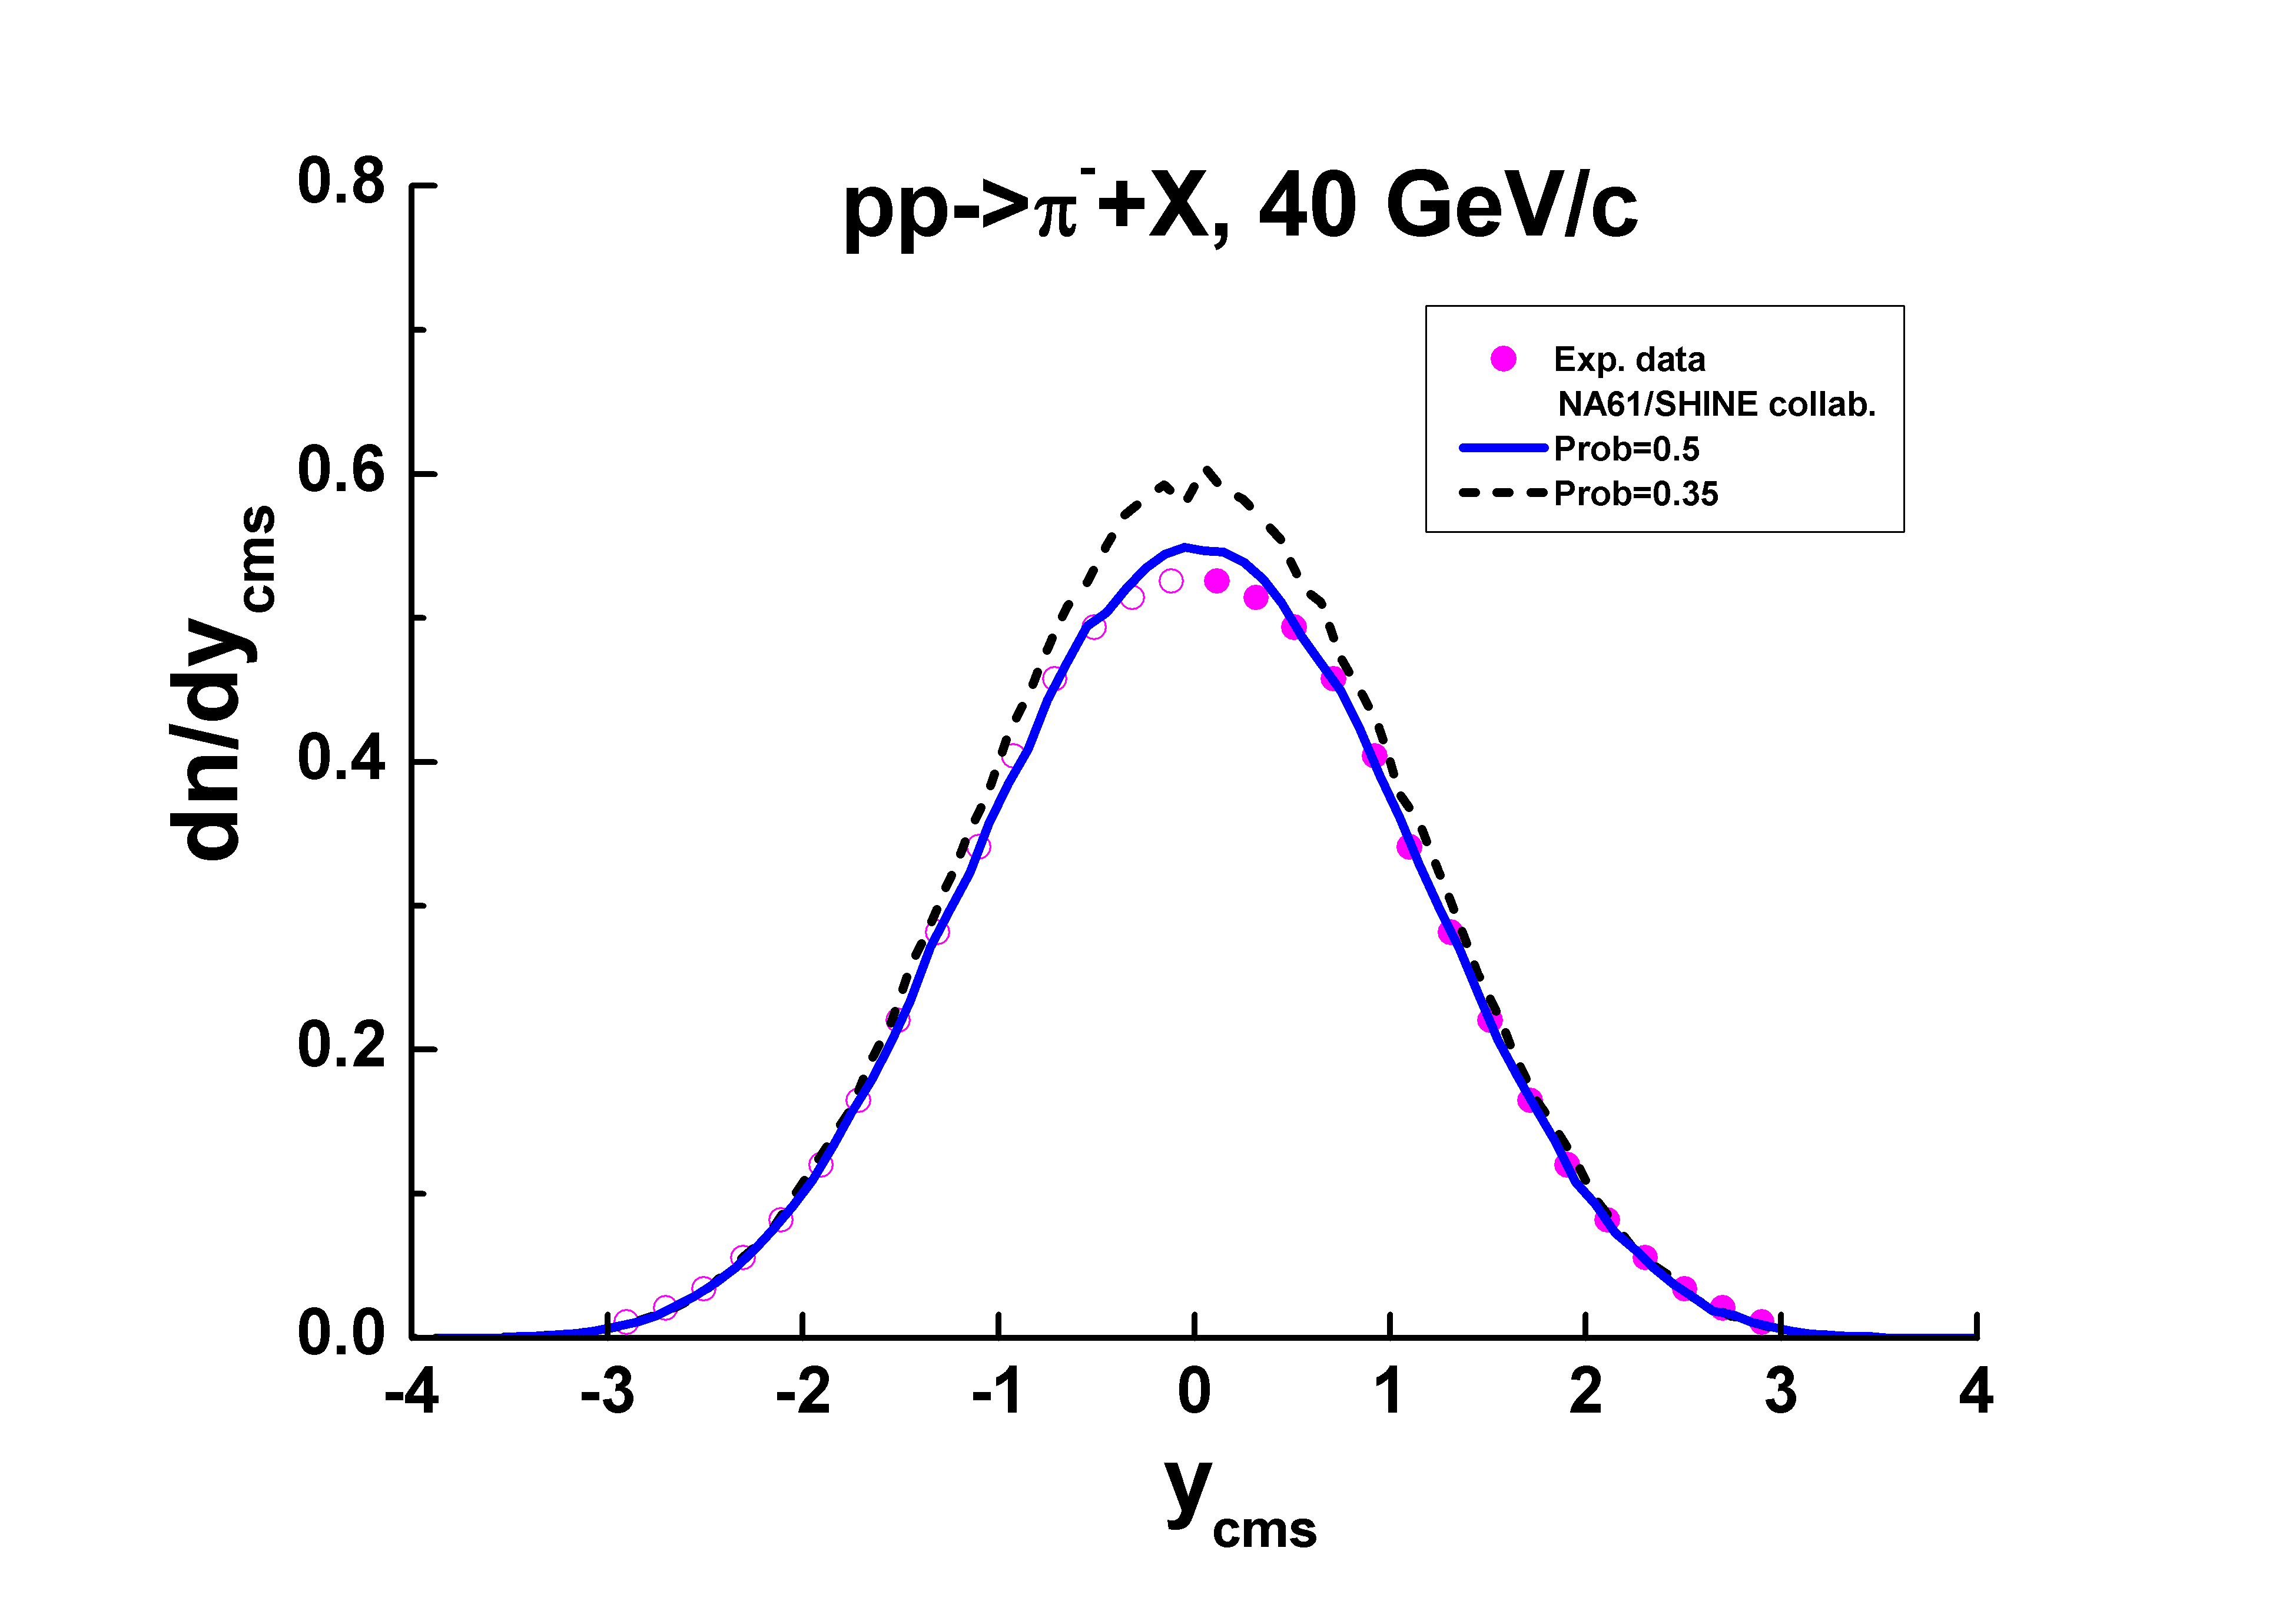
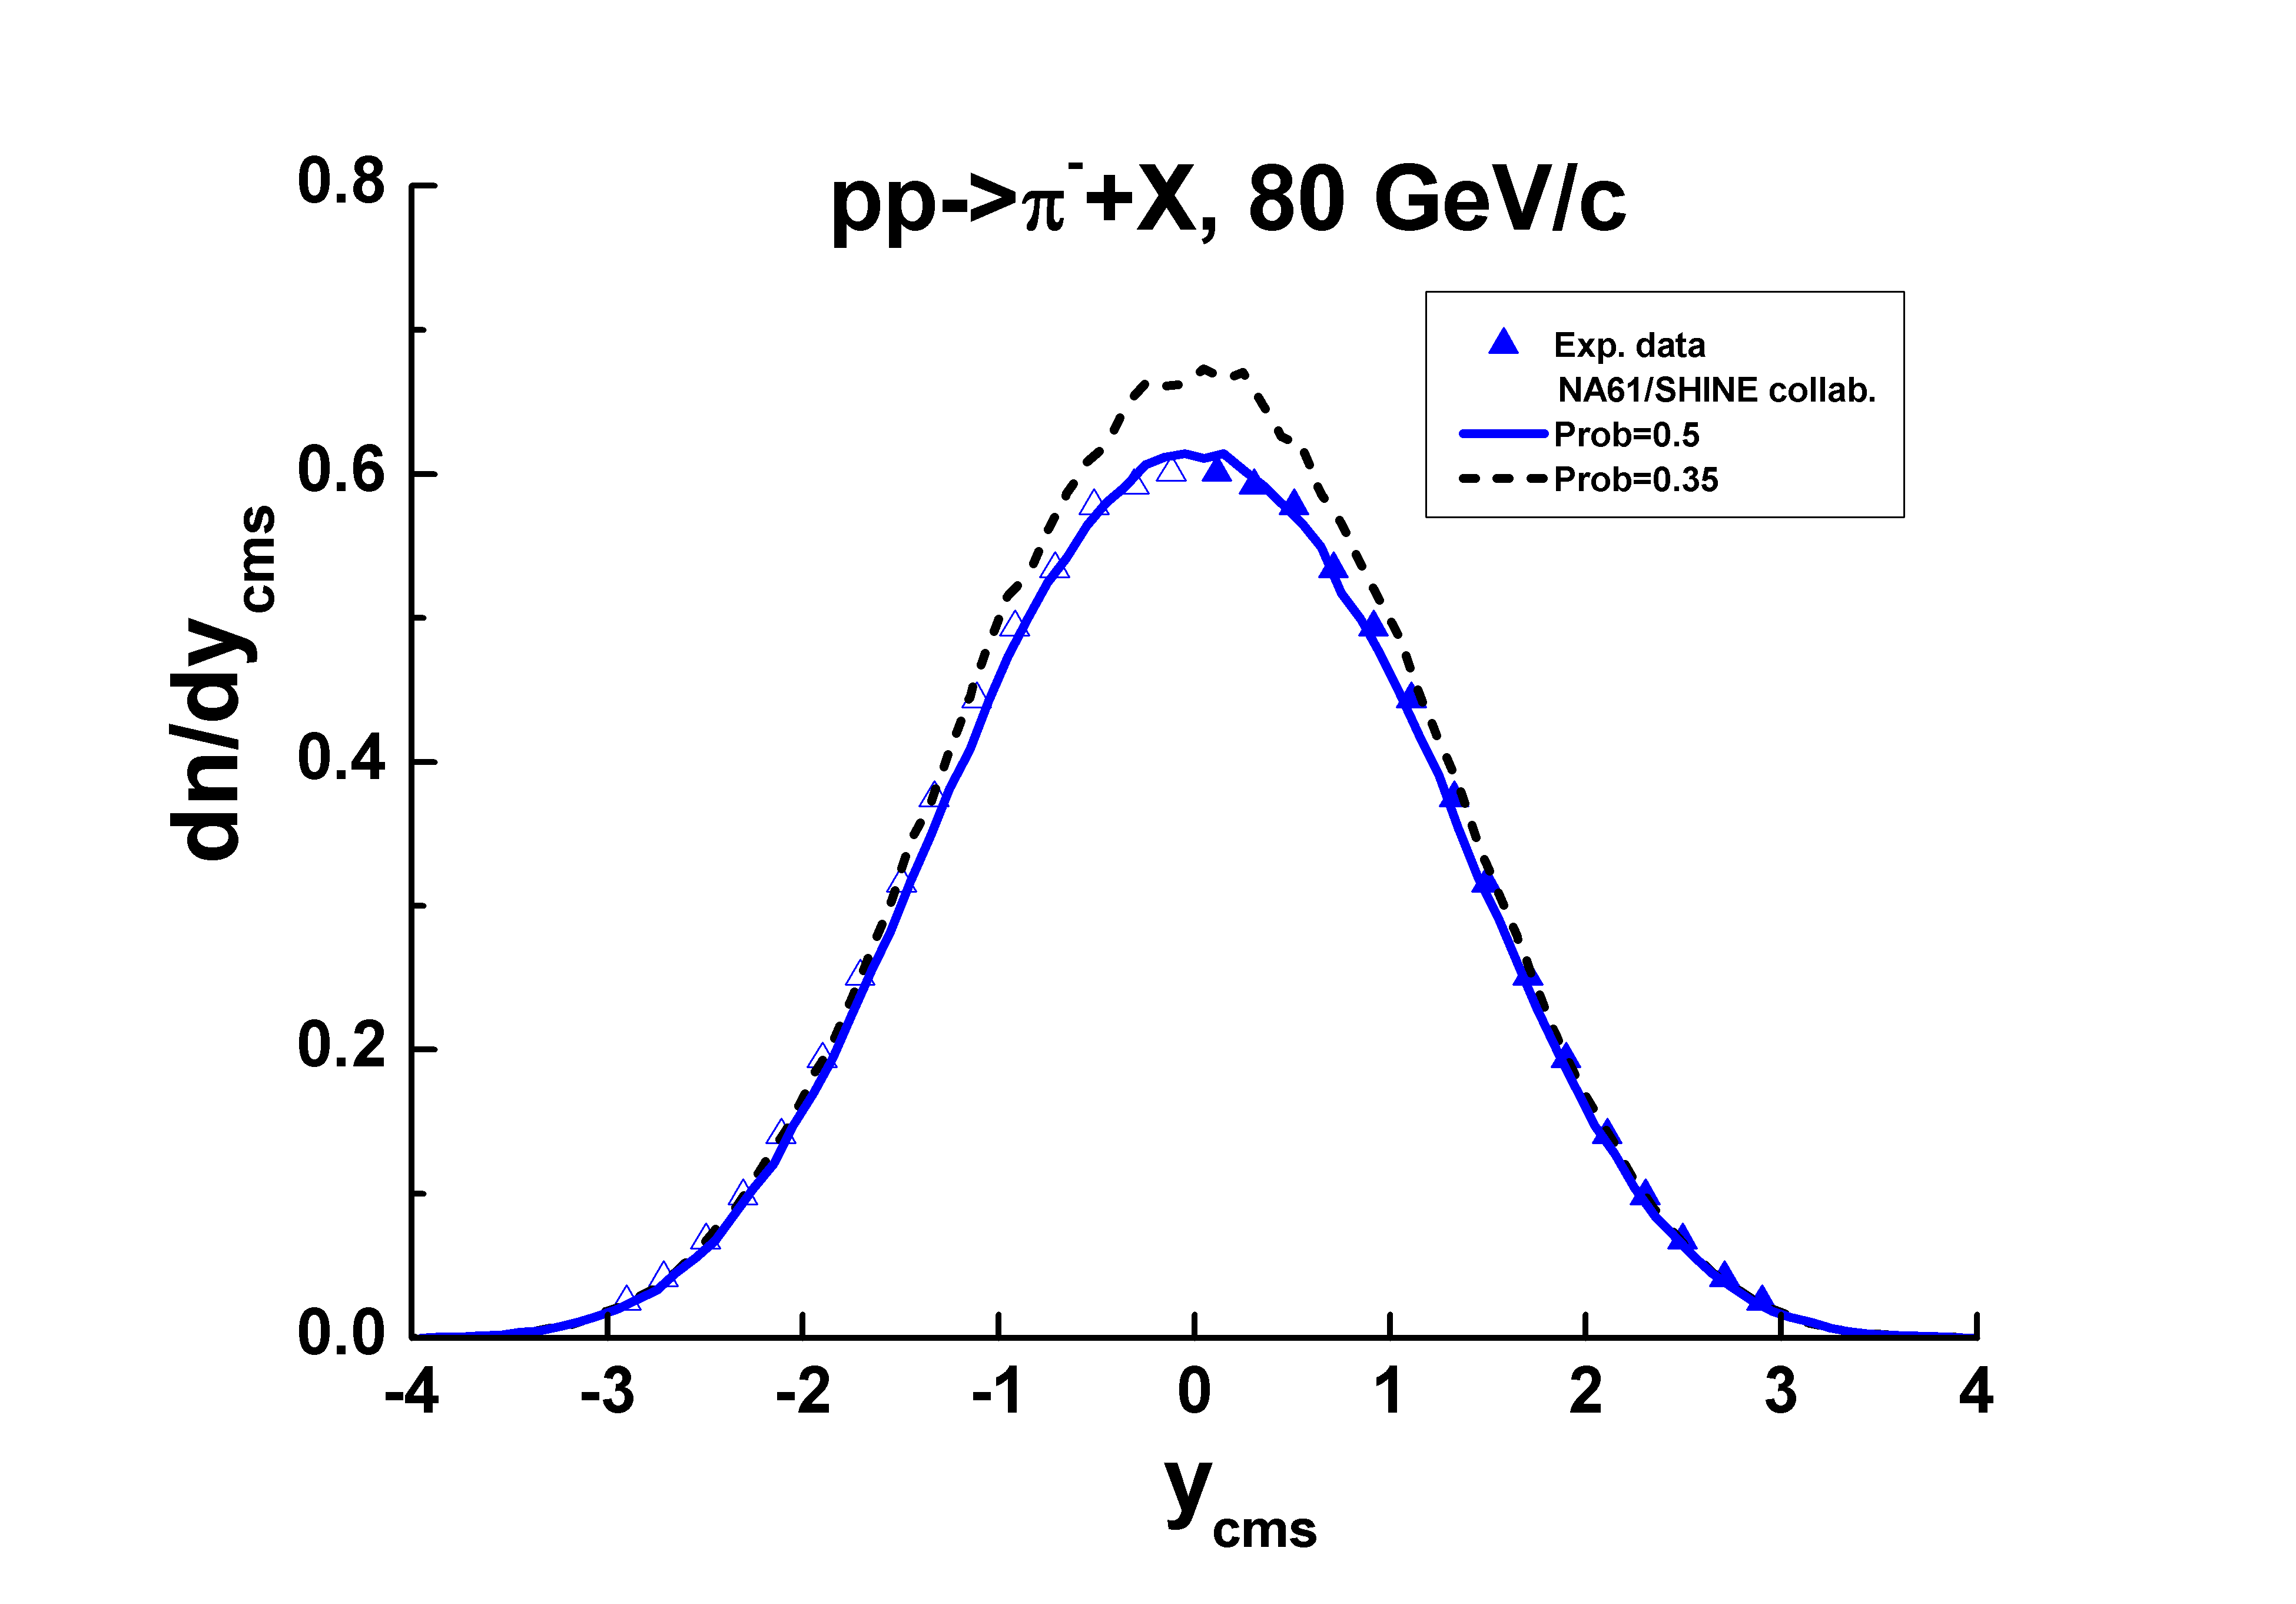
A simple way to decrease the Hijing model results and reach an agreement with the experimental data is an increasing of the probability of the diffraction dissociation. This can be done inserting a change in BLOCK DATA HIDATA:
* DATA (HIDAT0(4,I),I=1,10)/0.35,0.35,0.3,0.3,0.3,0.3, ! Uzhi
DATA (HIDAT0(4,I),I=1,10)/0.5 ,0.5 ,0.3,0.3,0.3,0.3, ! Uzhi
The results are presented in Fig. 5. As seen, there is a good opportunity to improve the model results tuning more exactly the probability.
3.2 Tuning of the Fritiof 1.6 model
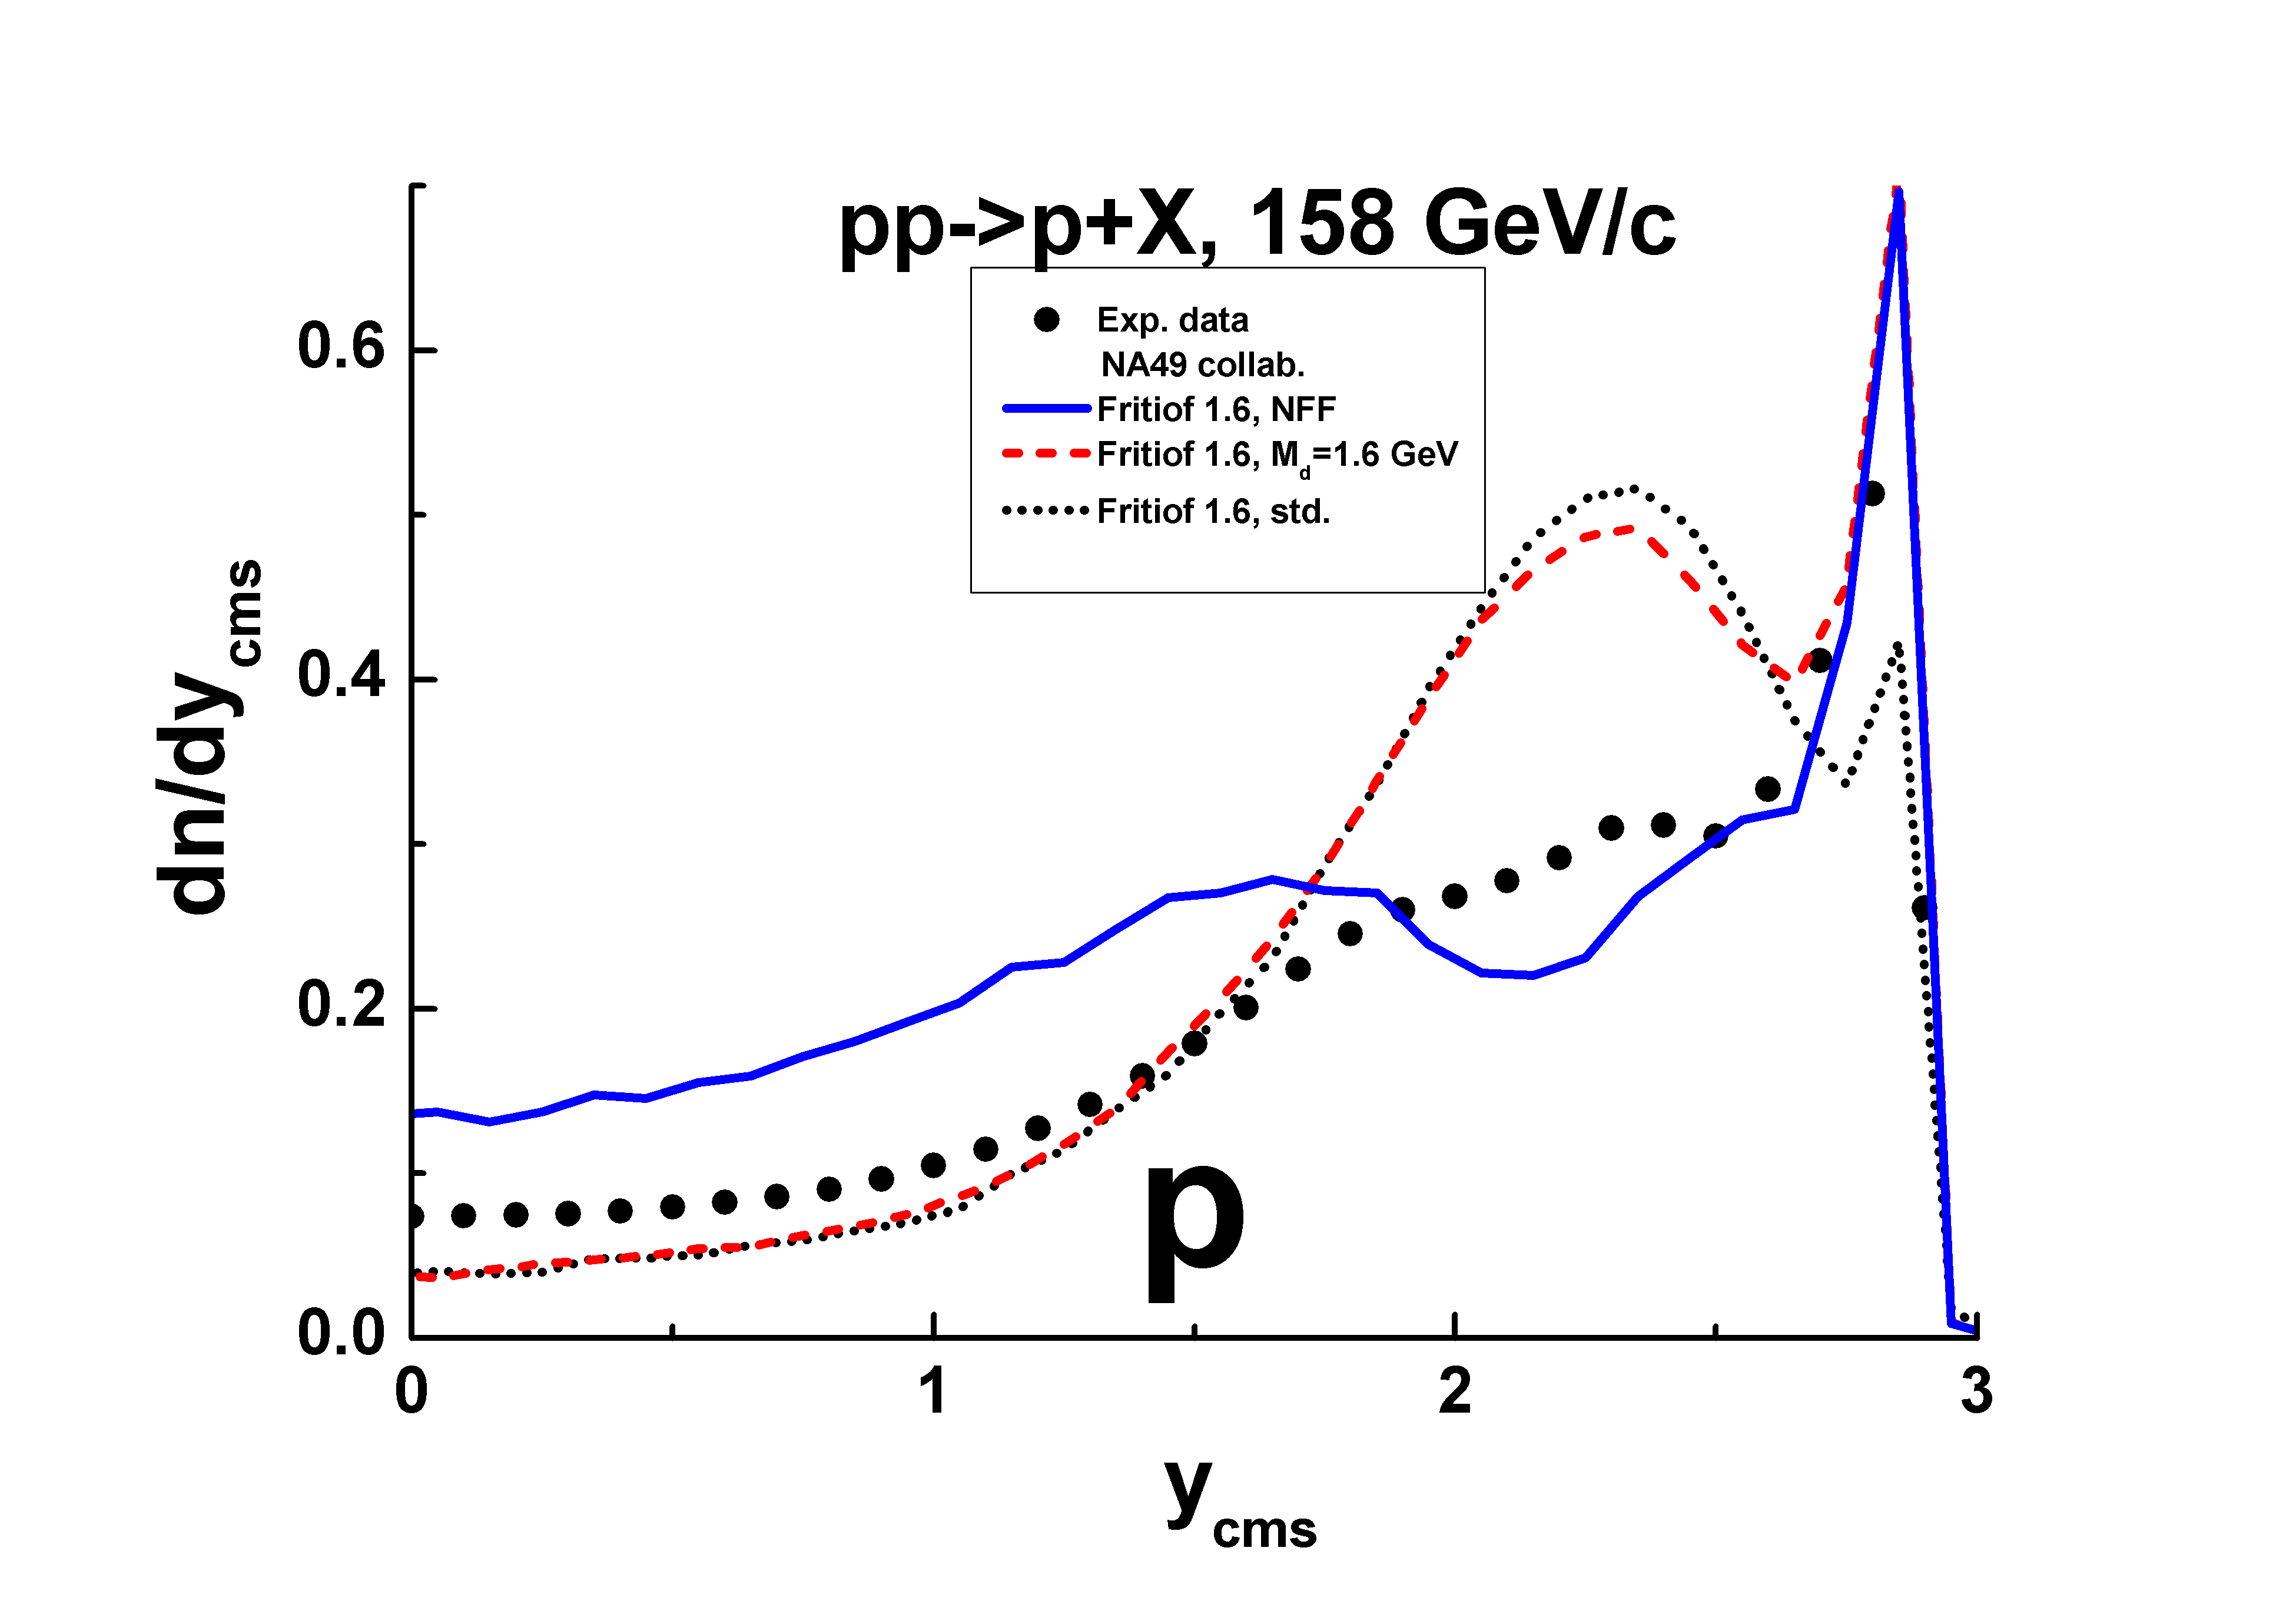
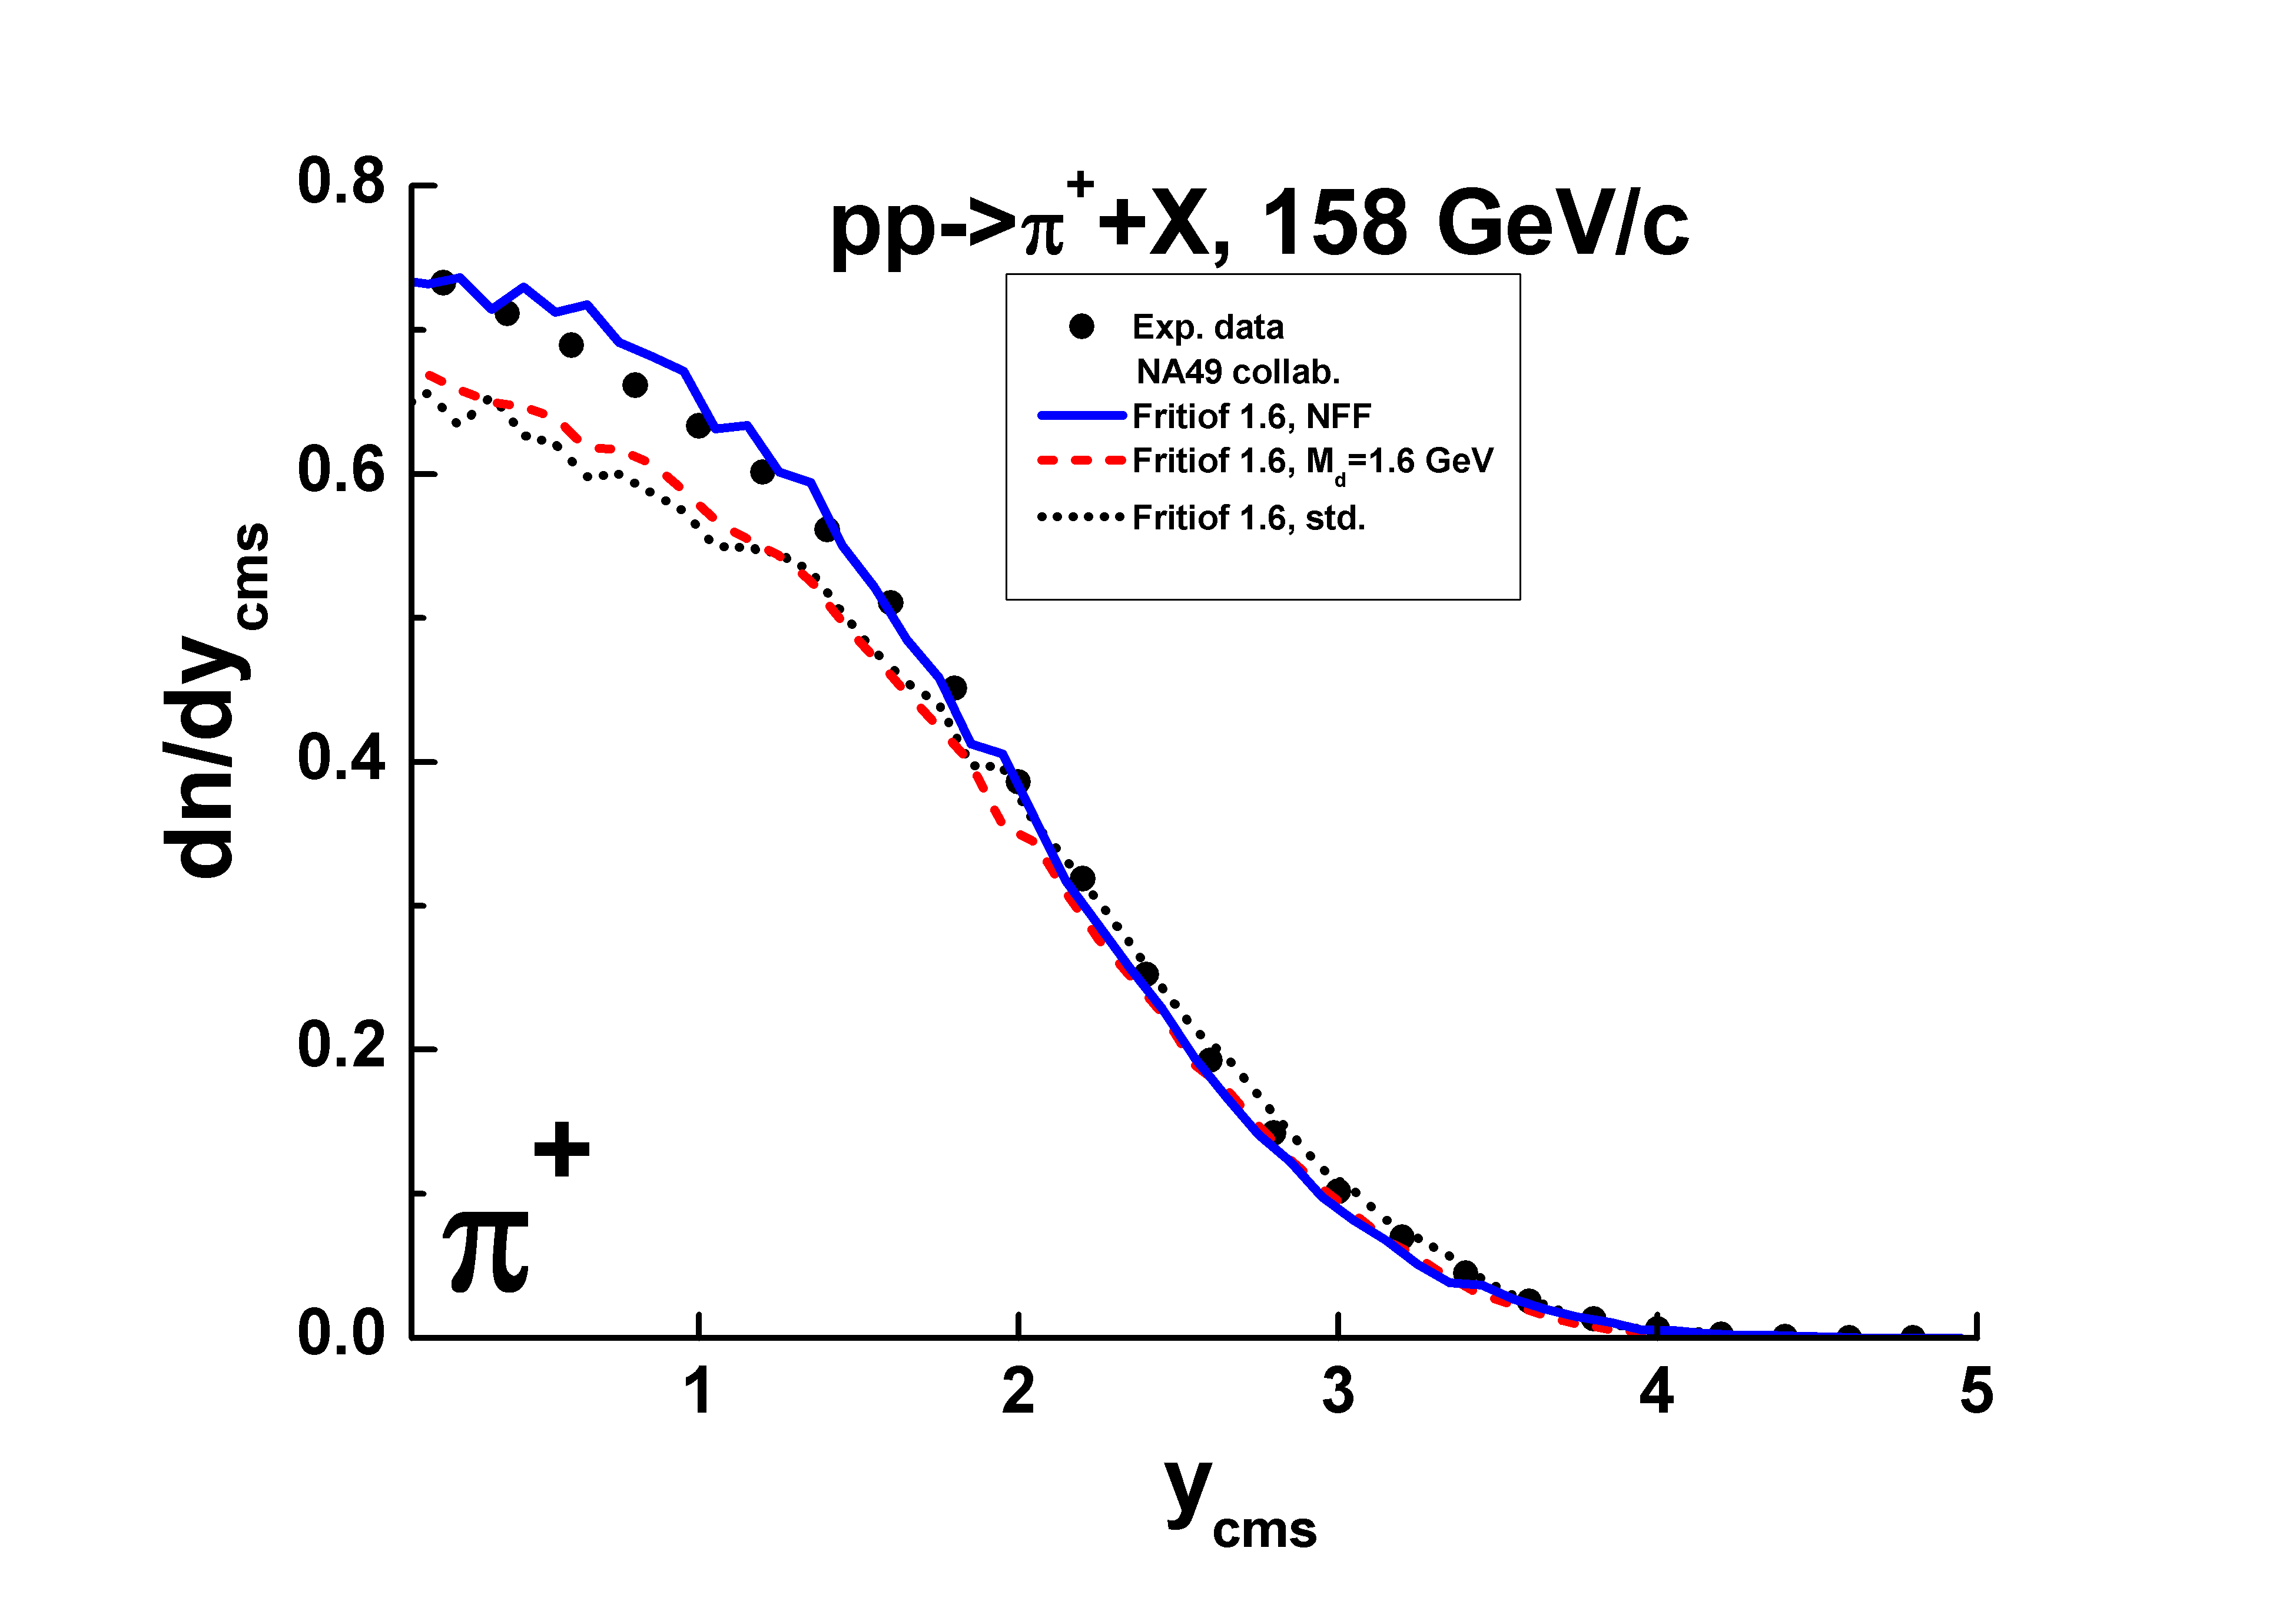
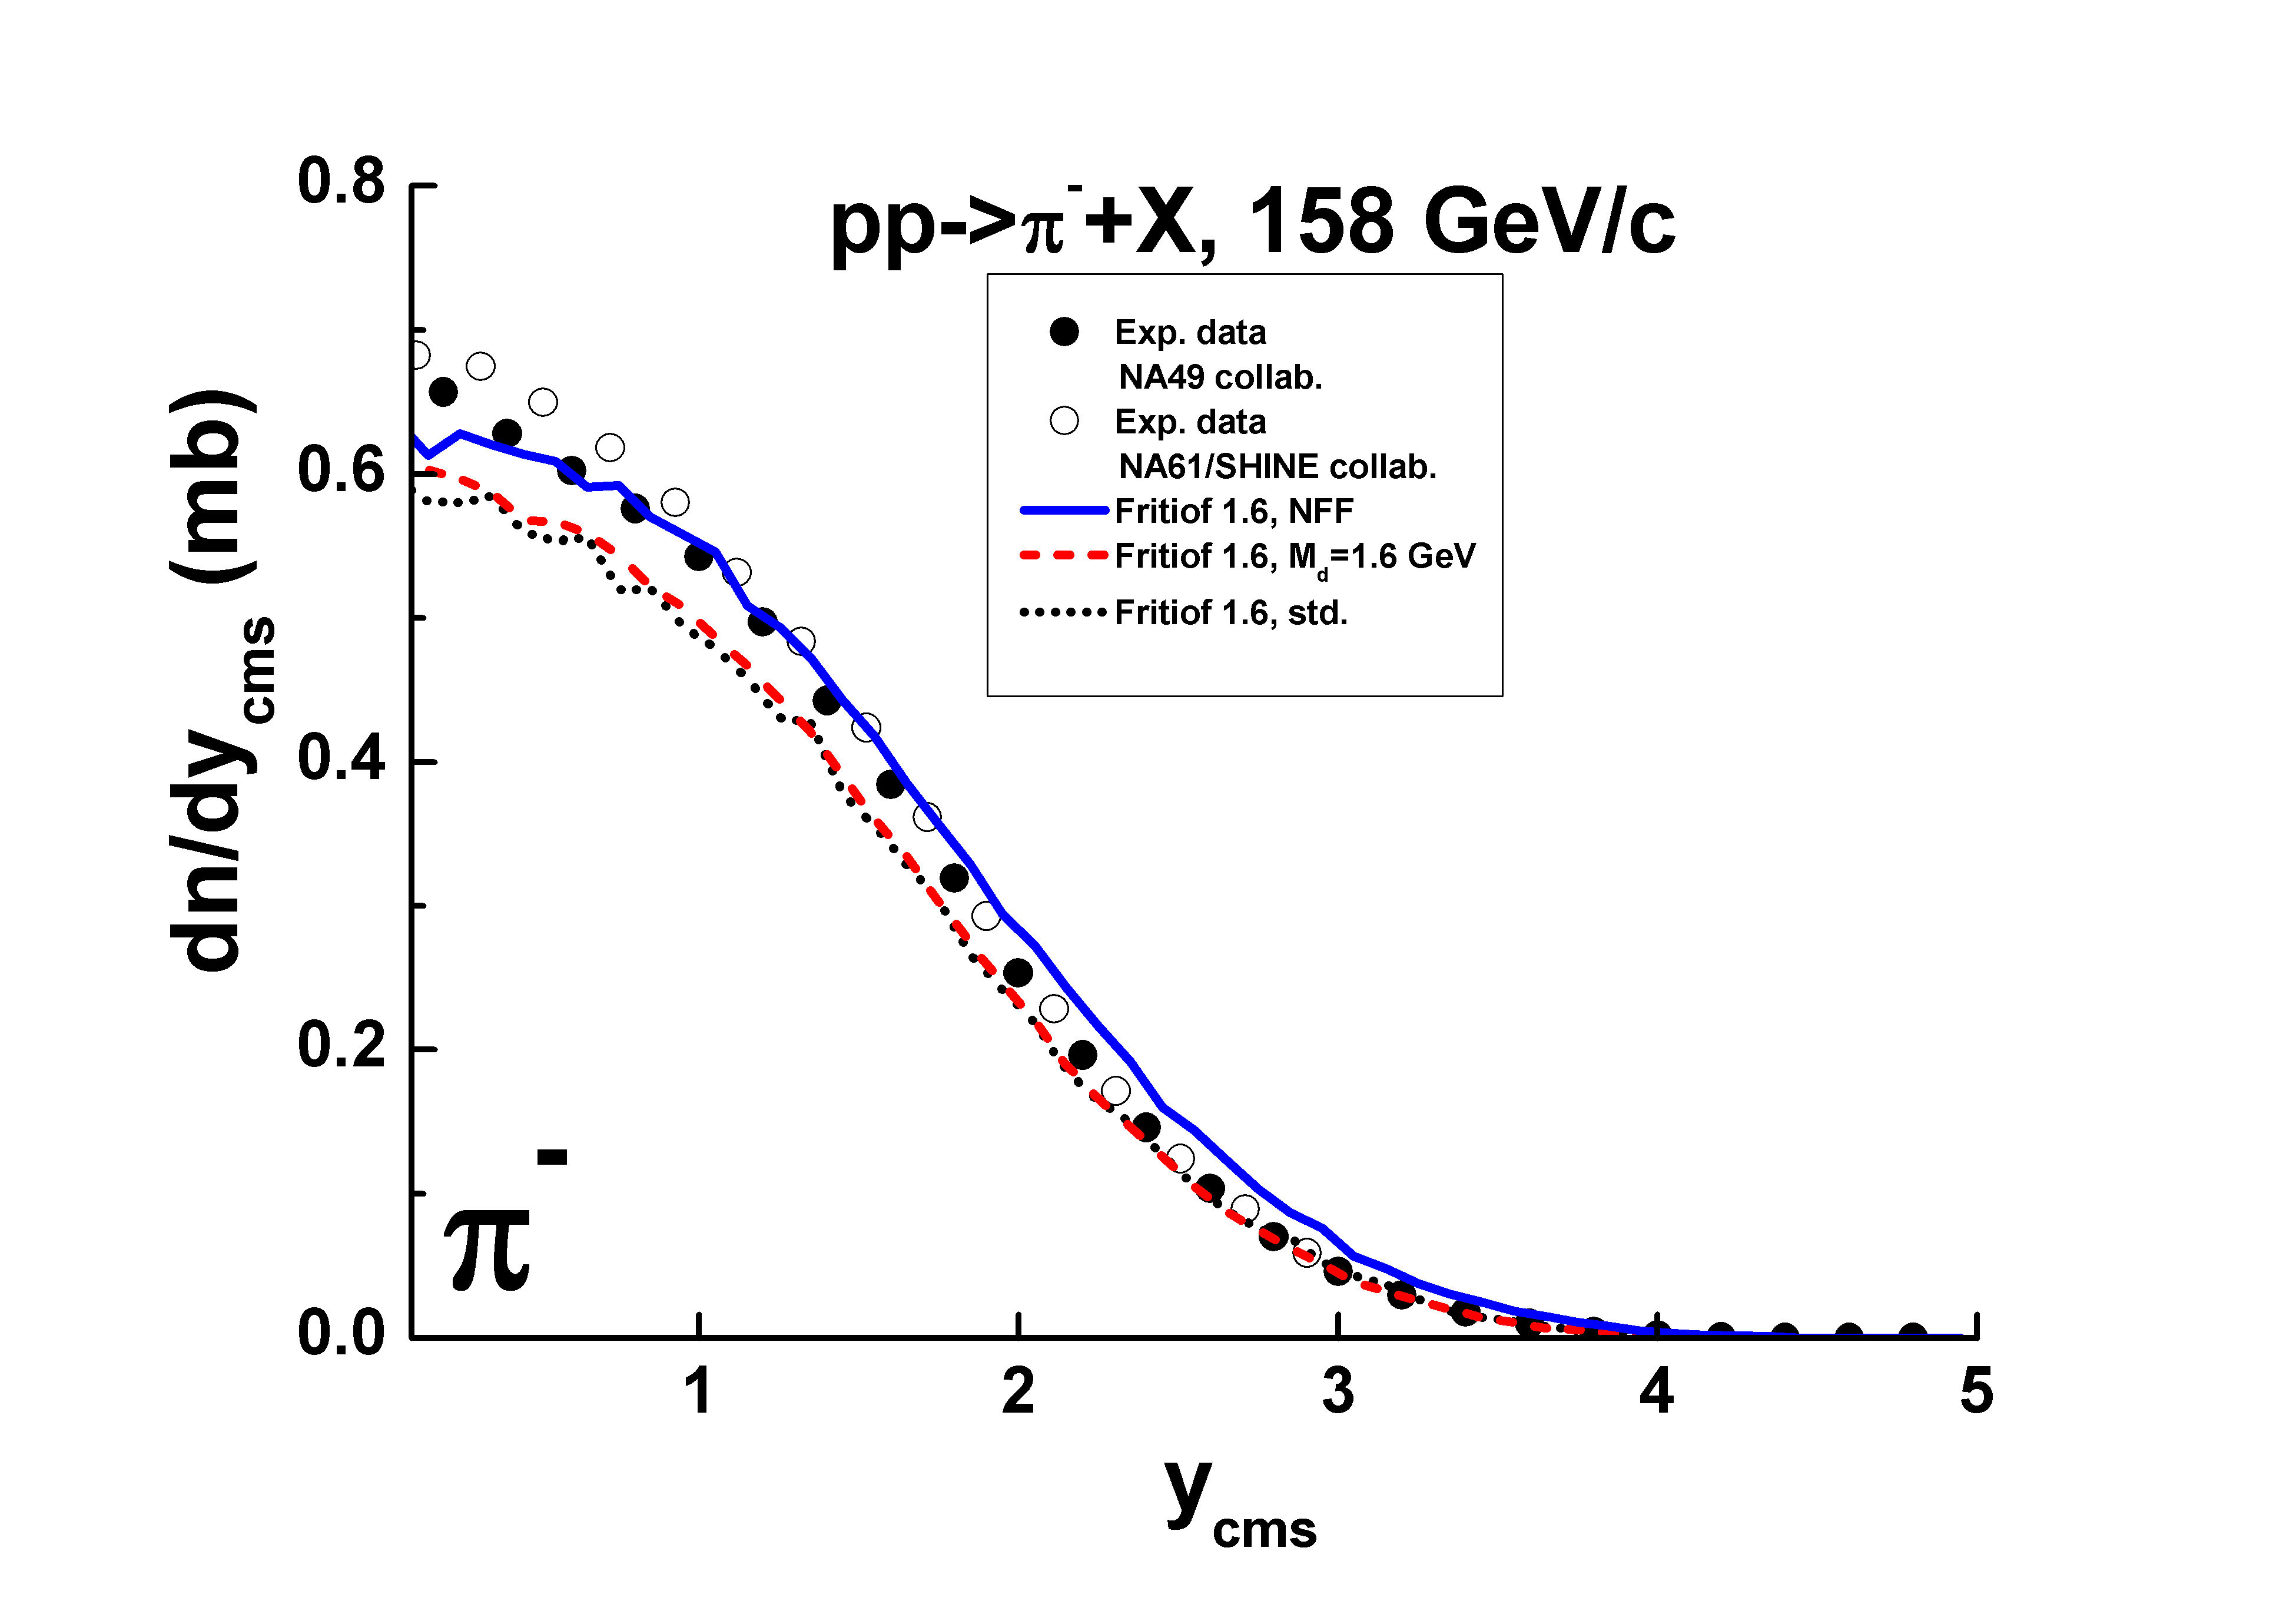
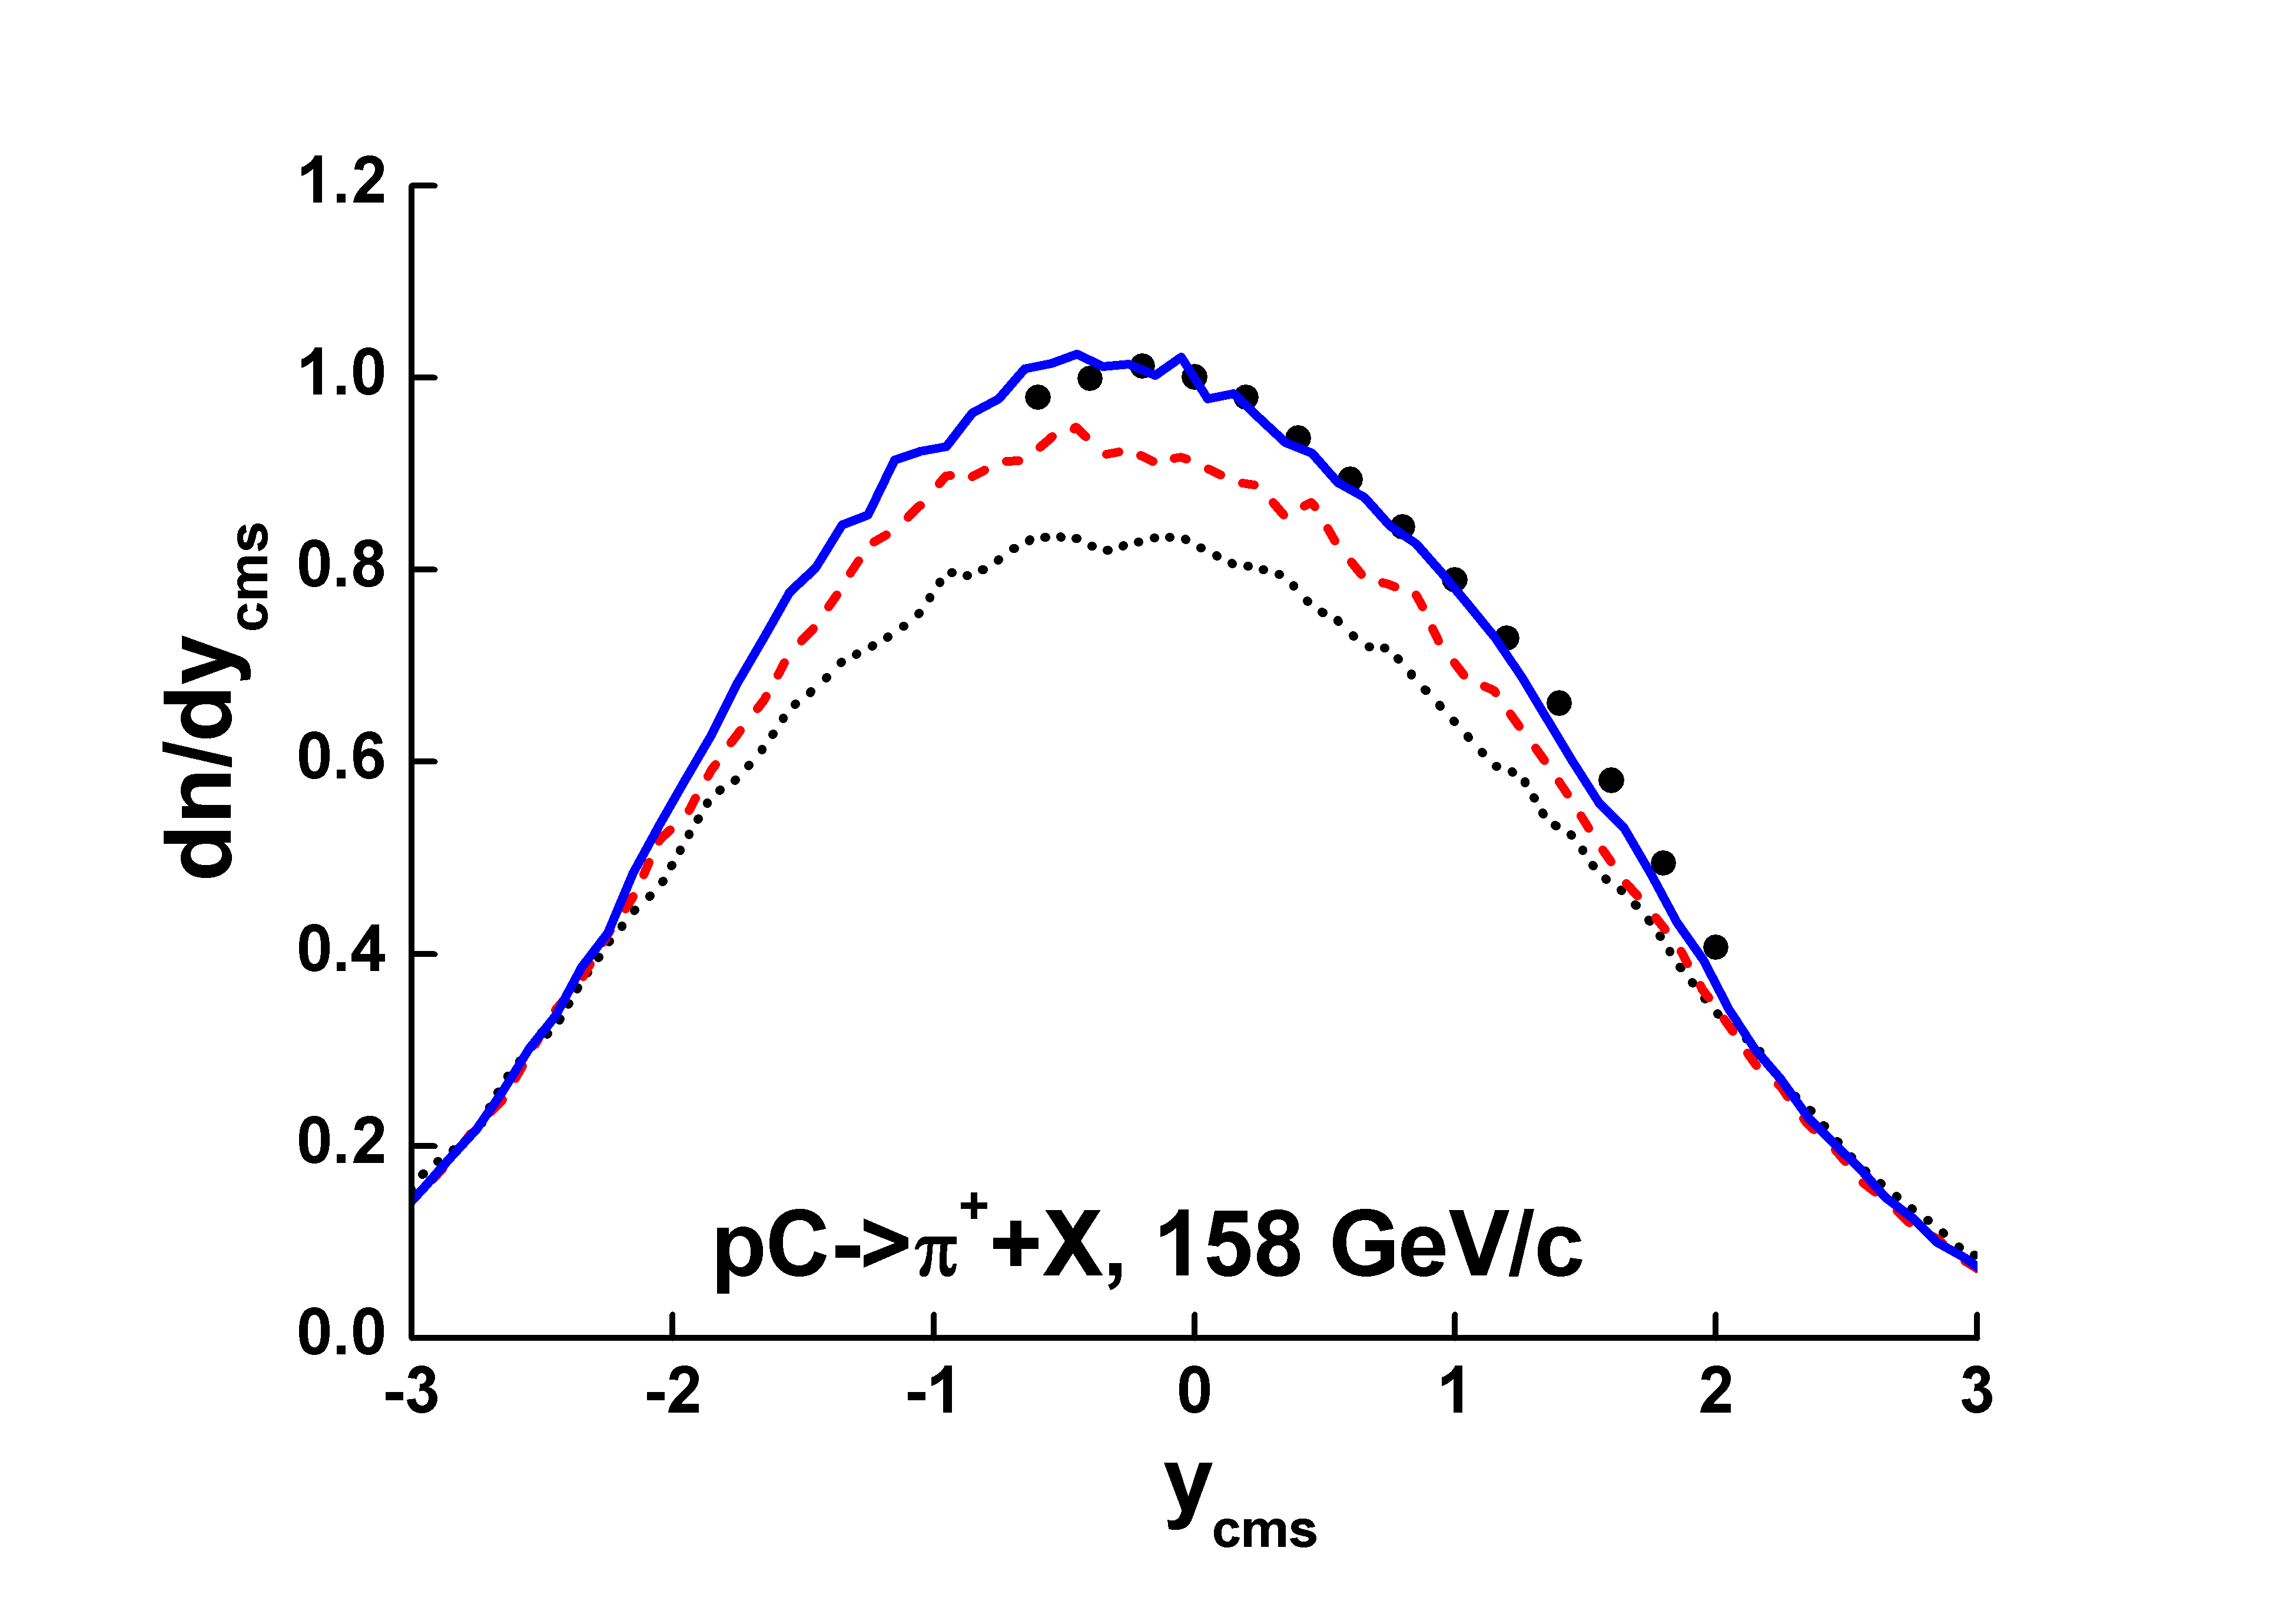
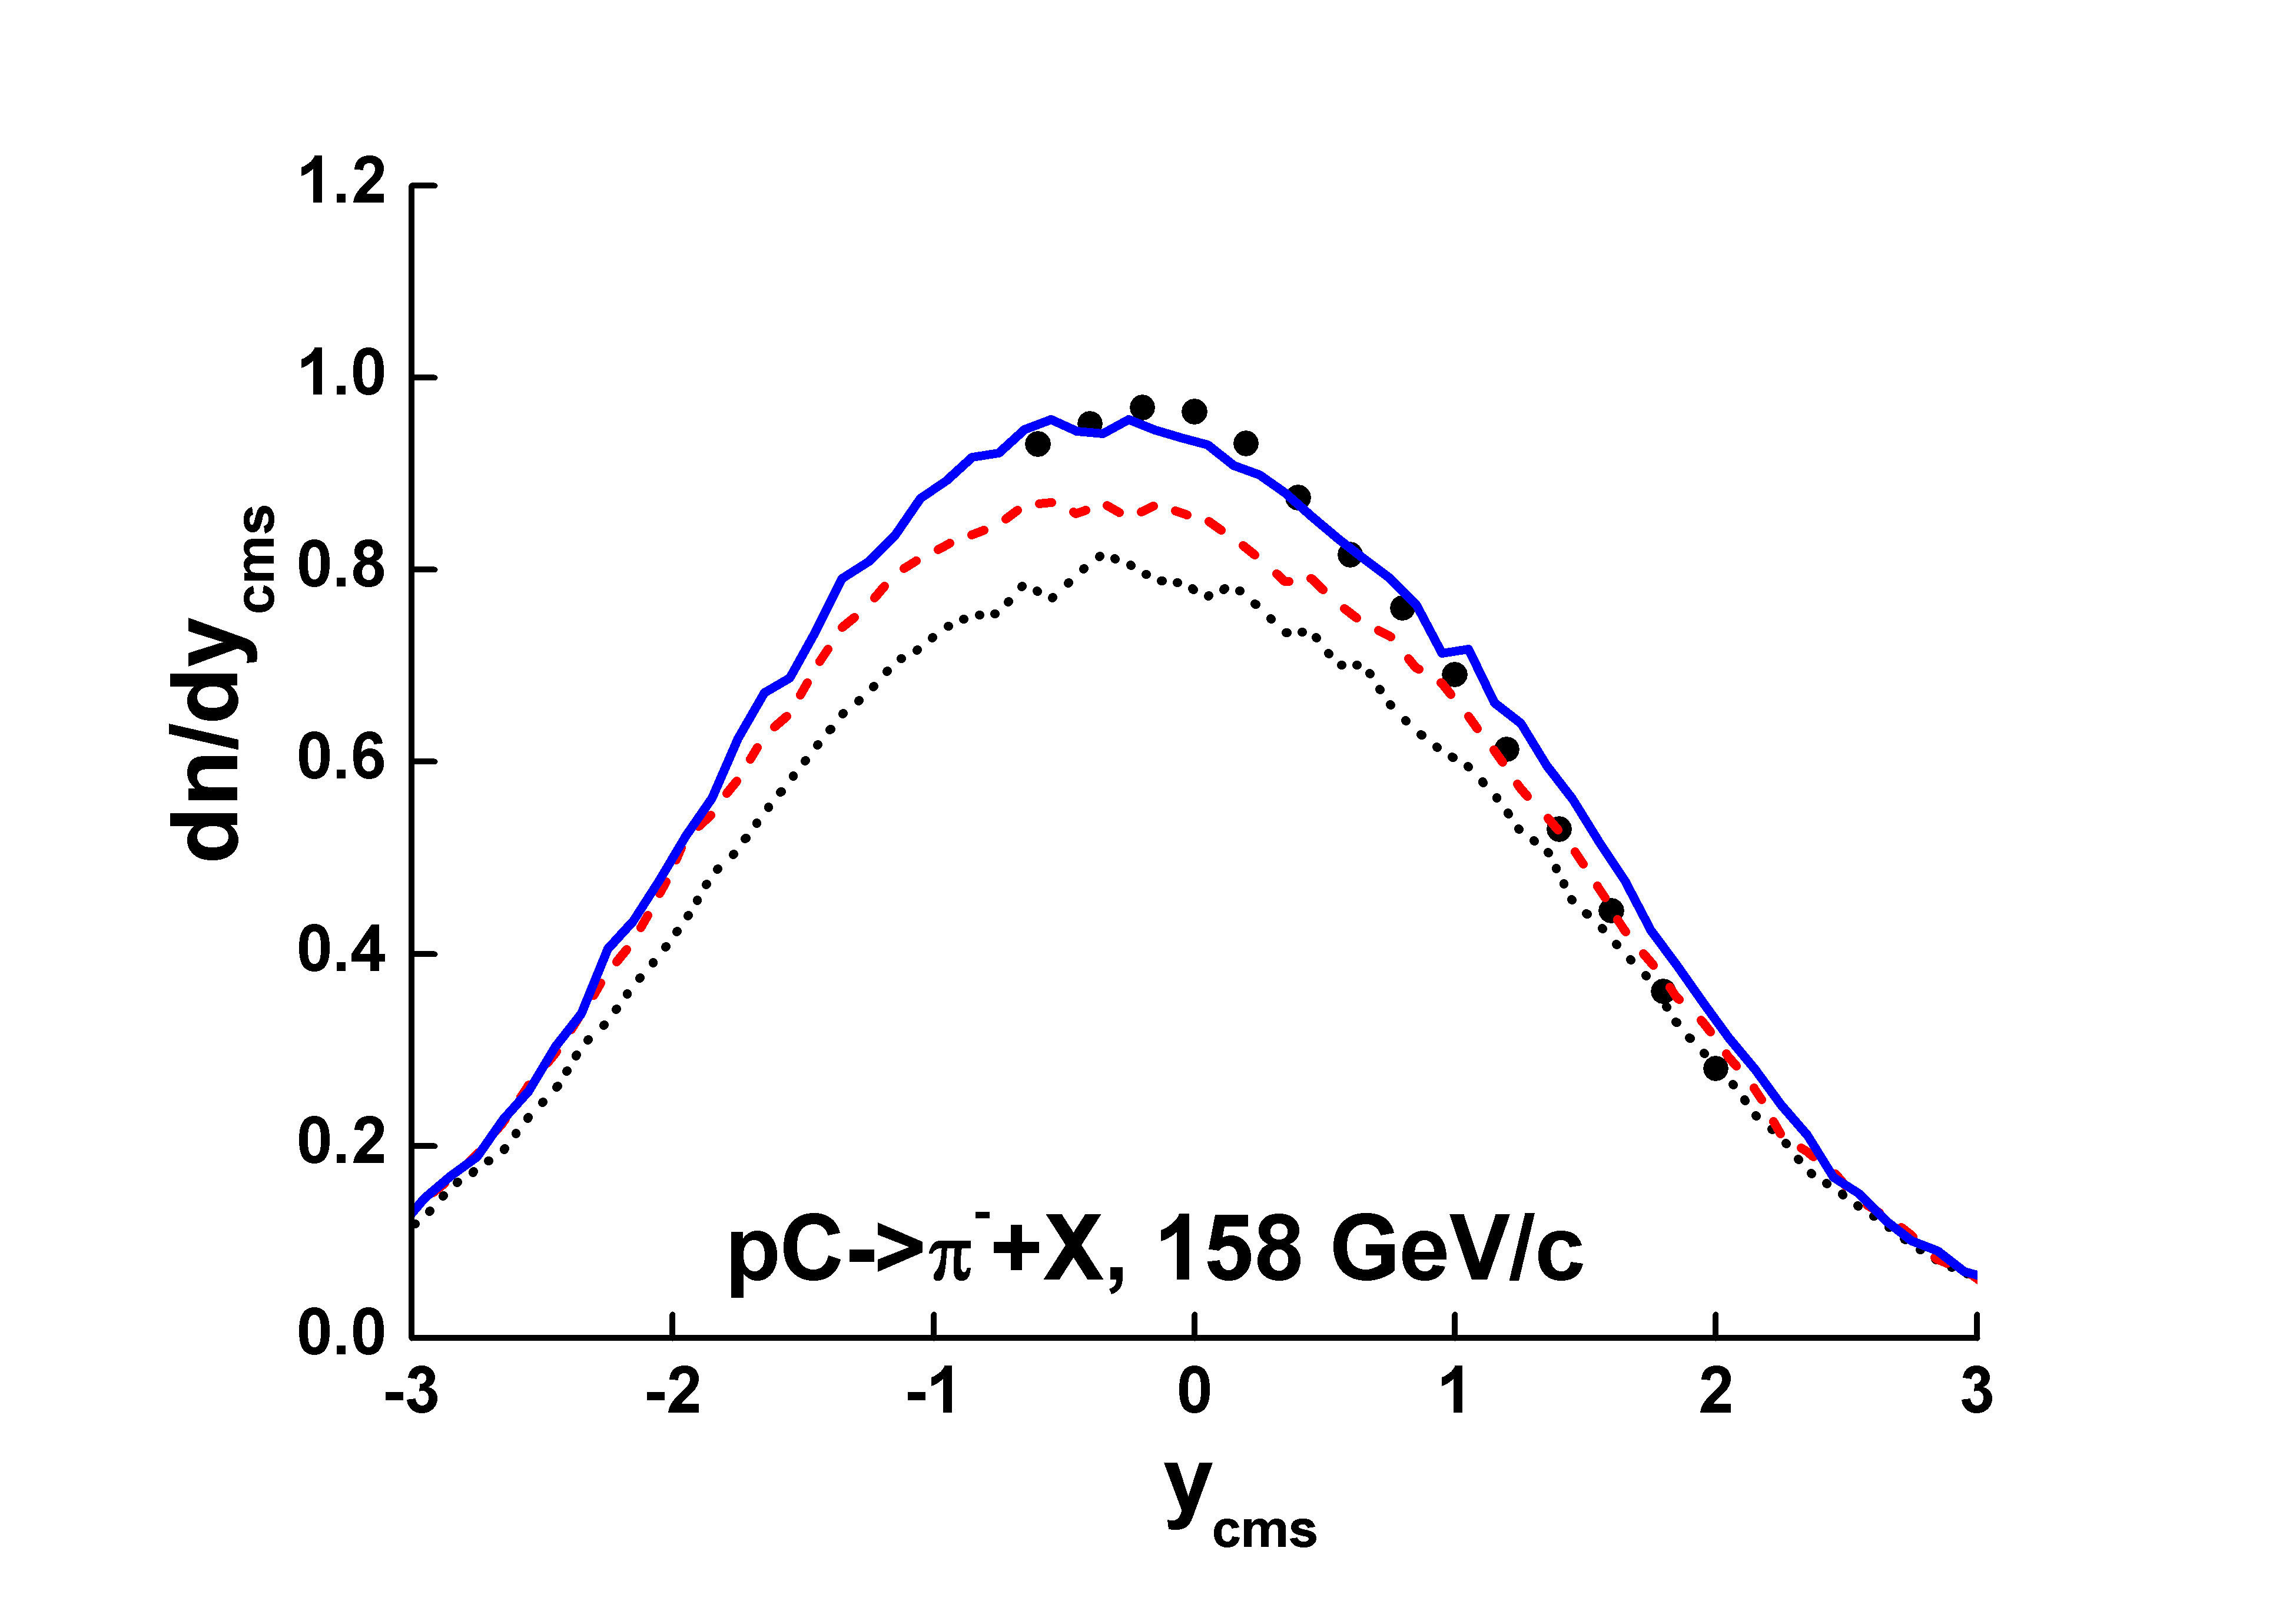
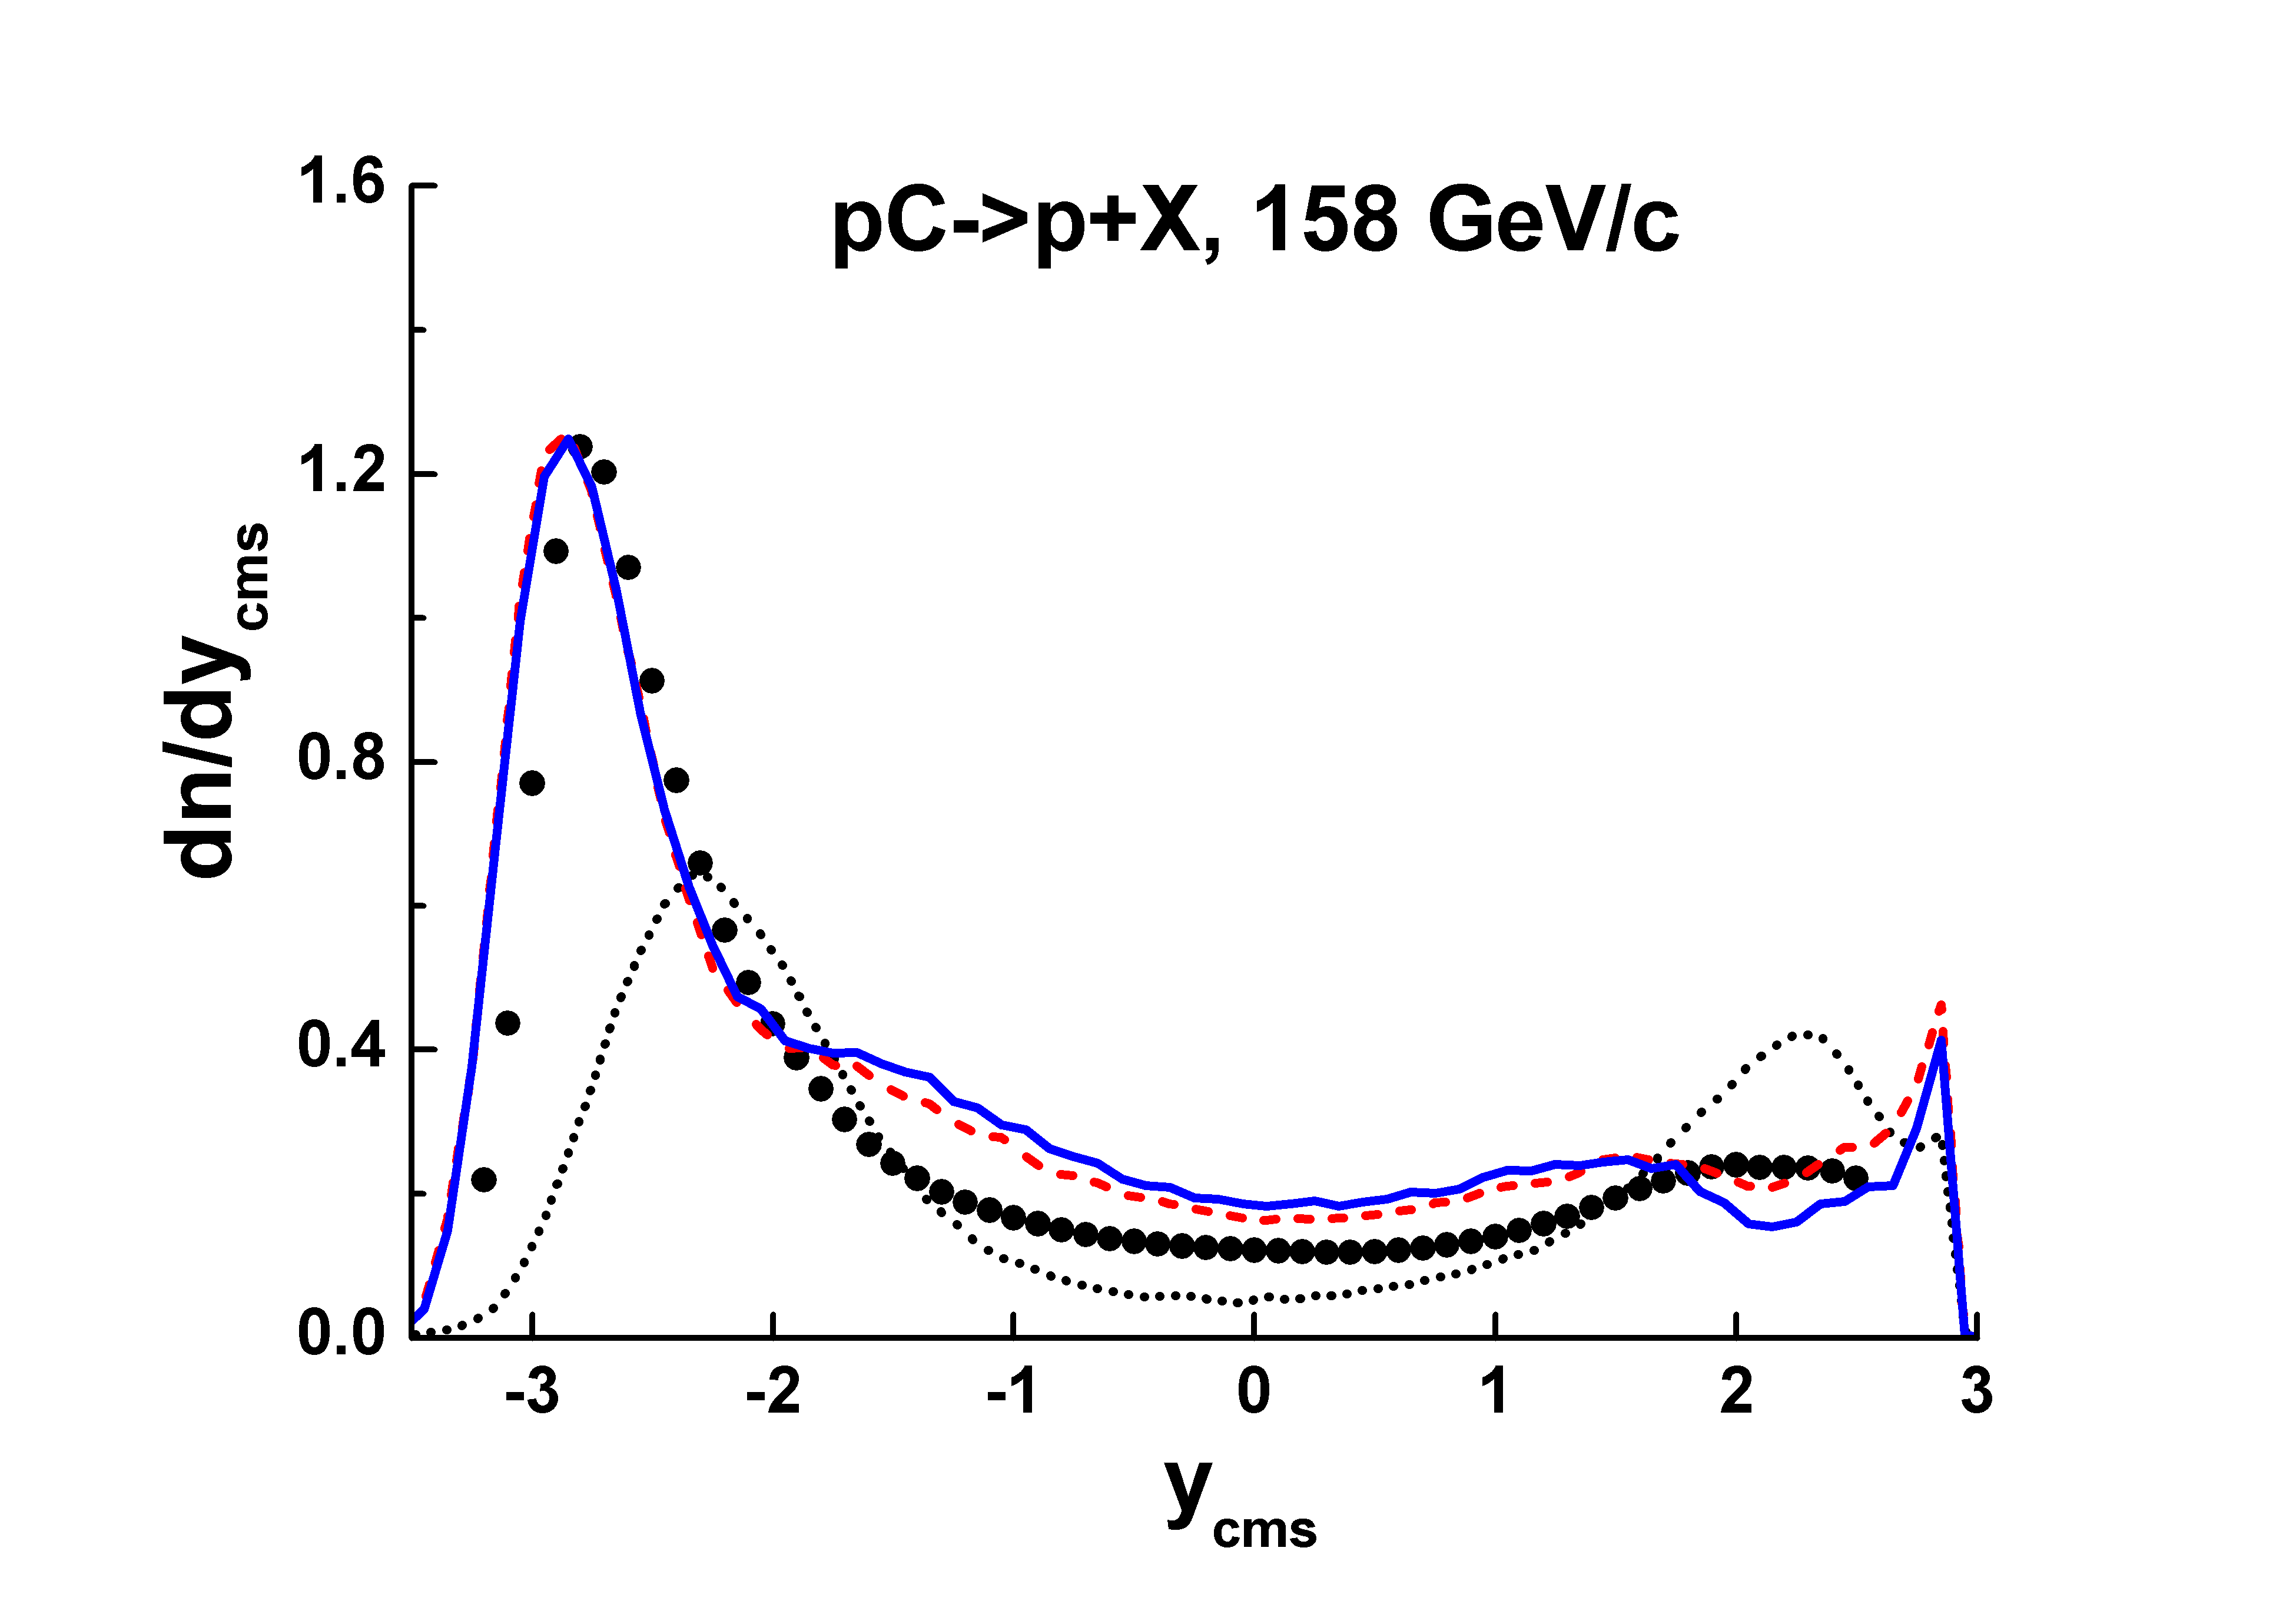
Tuning of the model at 158 GeV/c included 2 steps. At the first one, a probability of the diffraction was enlarged increasing from 1.2 to 1.6 GeV (see dashed red lines in Fig. 6). At the second step, fragmentation functions of strings were changed, especially the parameter ”a” in the LUND string fragmentation function (see above) which allowed to increase particle production in the central region.
A change of a string fragmentation function into baryons was more complicated. For this the following lines were introduced in the subroutine LUZDIS of JETSET 6.3 code:
C...CHOICE OF Z, PREWEIGHTED FOR PEAKS AT LOW OR HIGH Z
if(IFL1.gt.10) then ! Uzhi
Z=ZMAX*(RLU(0))**2 ! Uzhi
else ! Uzhi
100 Z=RLU(0)
...........................................
C...WEIGHTING ACCORDING TO CORRECT FORMULA
IF(Z.LE.FB/(50.+FB).OR.Z.GE.1.) GOTO 100
FVAL=(ZMAX/Z)*EXP(FB*(1./ZMAX-1./Z))
IF(FA.GT.0.01) FVAL=((1.-Z)/(1.-ZMAX))**FA*FVAL
IF(FVAL.LT.RLU(0)*FPRE) GOTO 100
endif ! Uzhi
The change operates at MST(10)=0. Results of the changes are presented in Fig. 6 by solid blue lines. Dotted lines are standard model predictions.
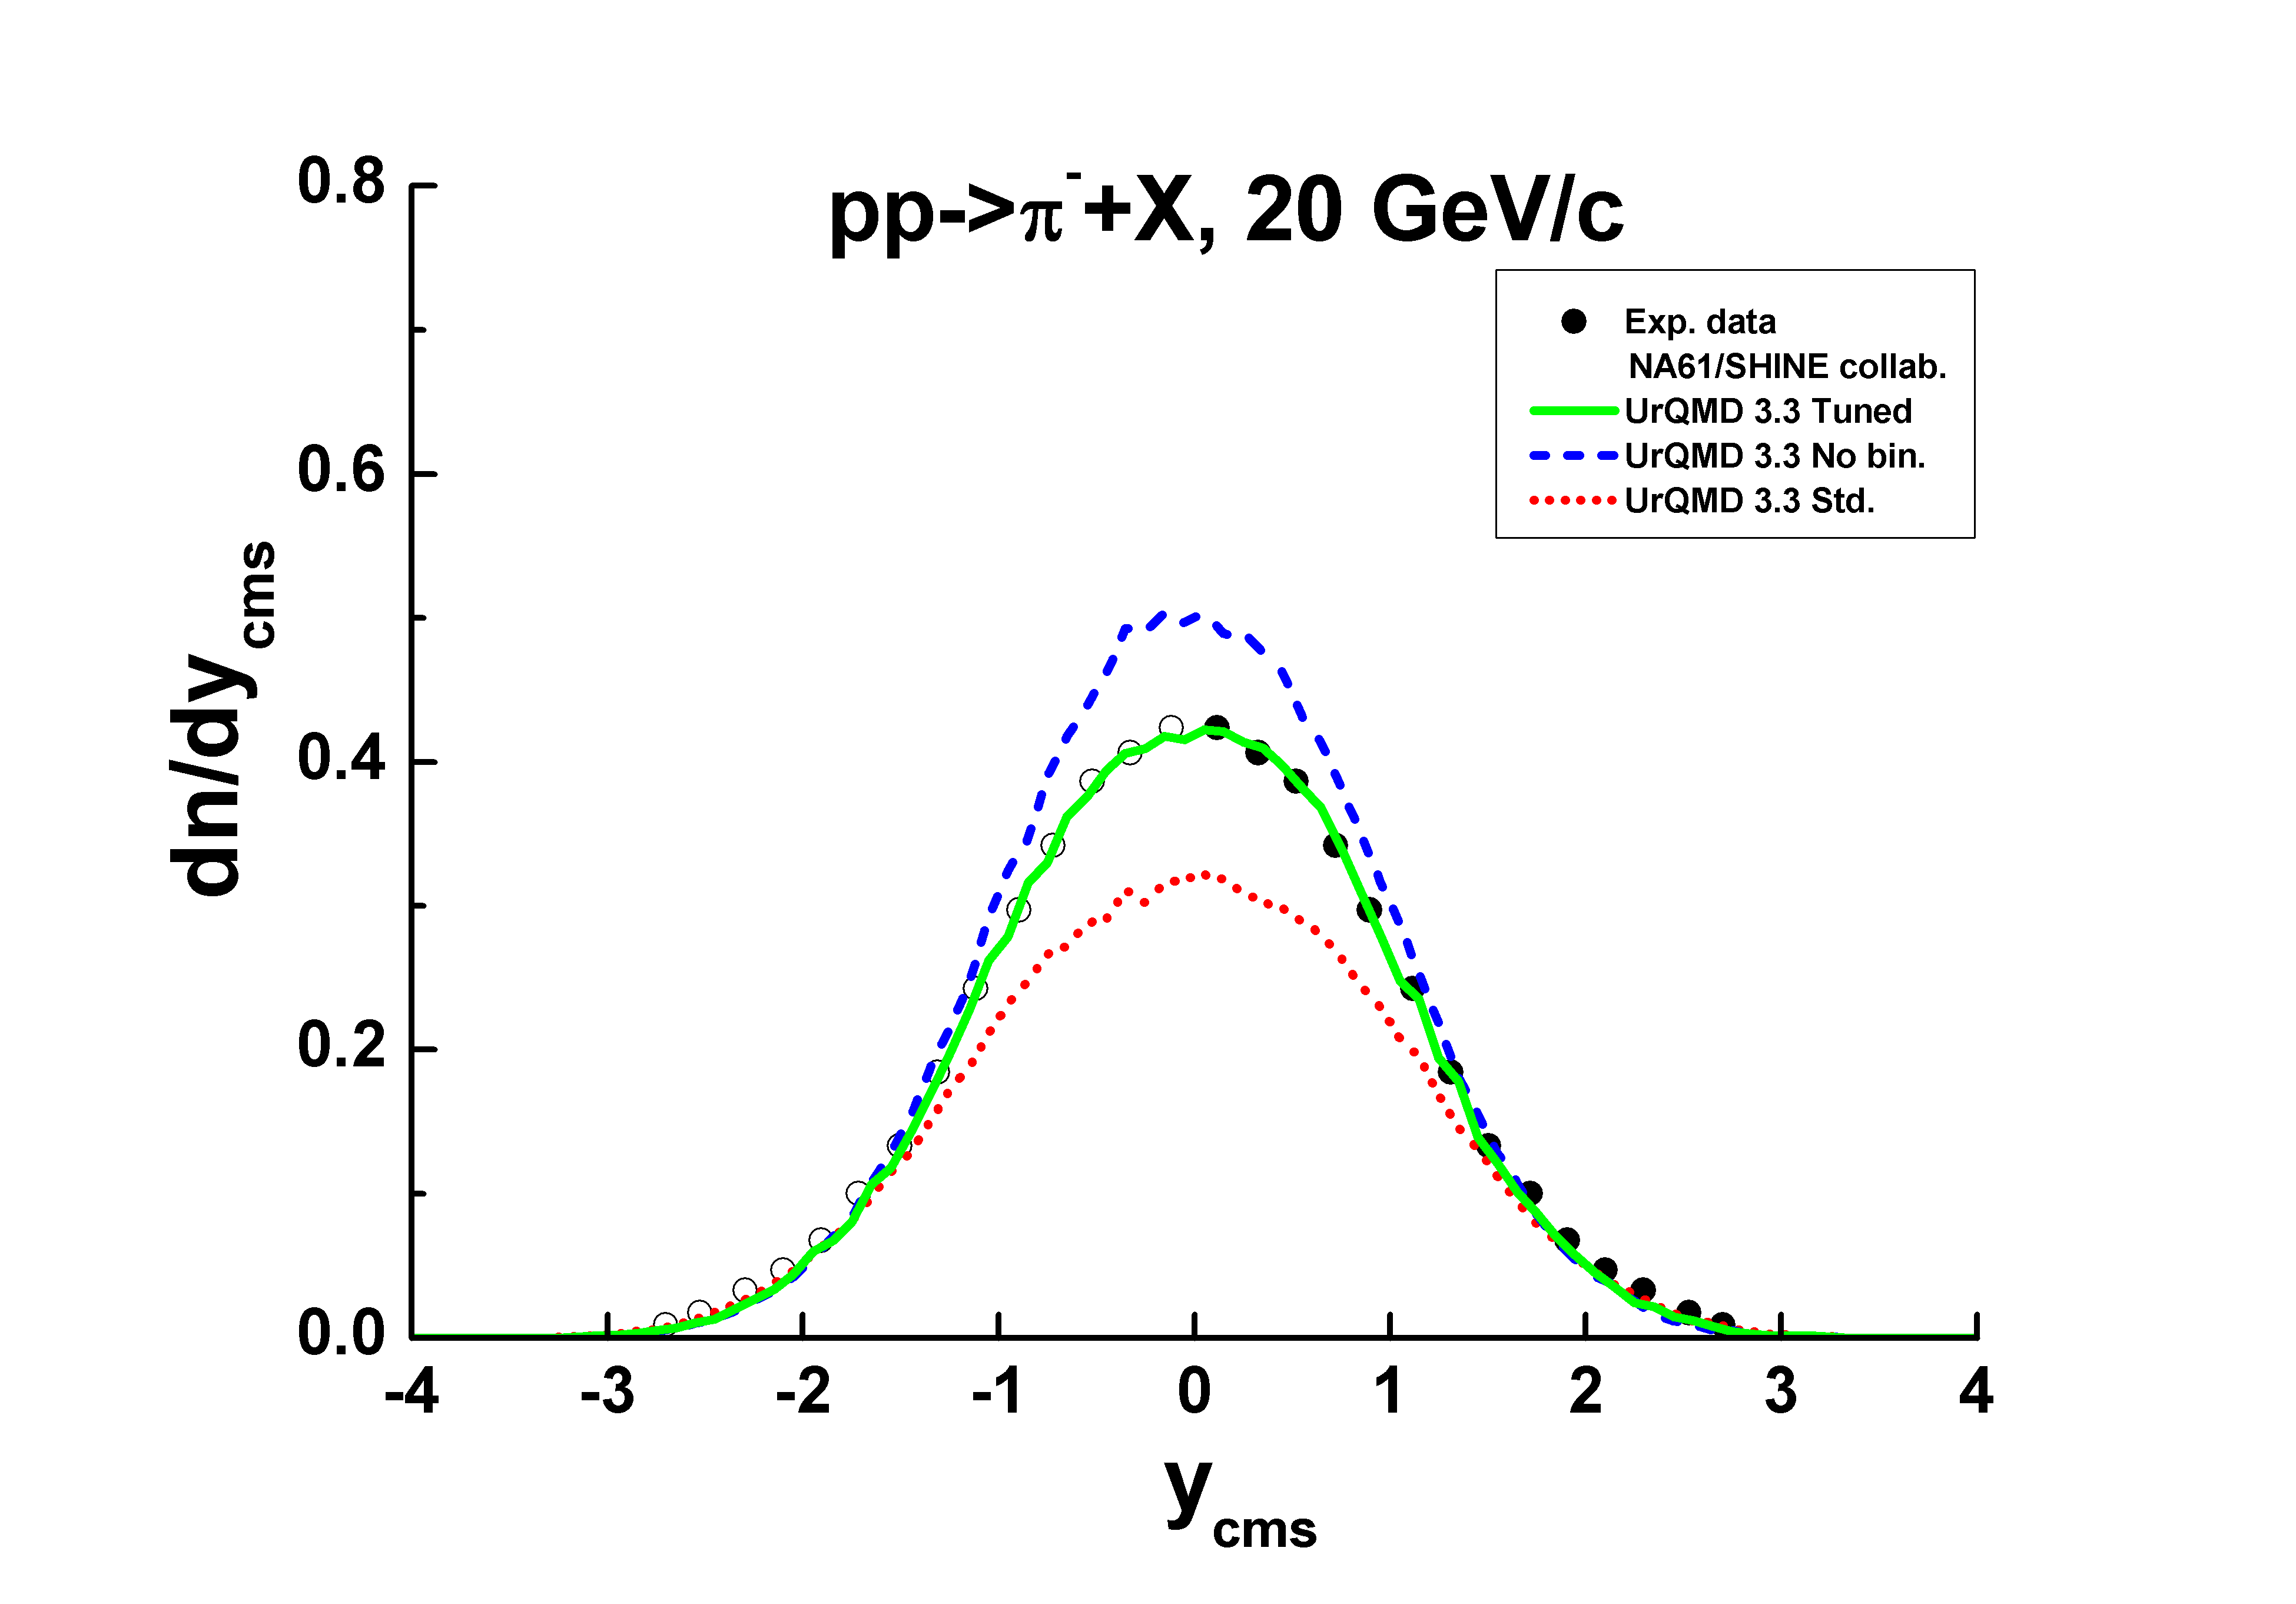
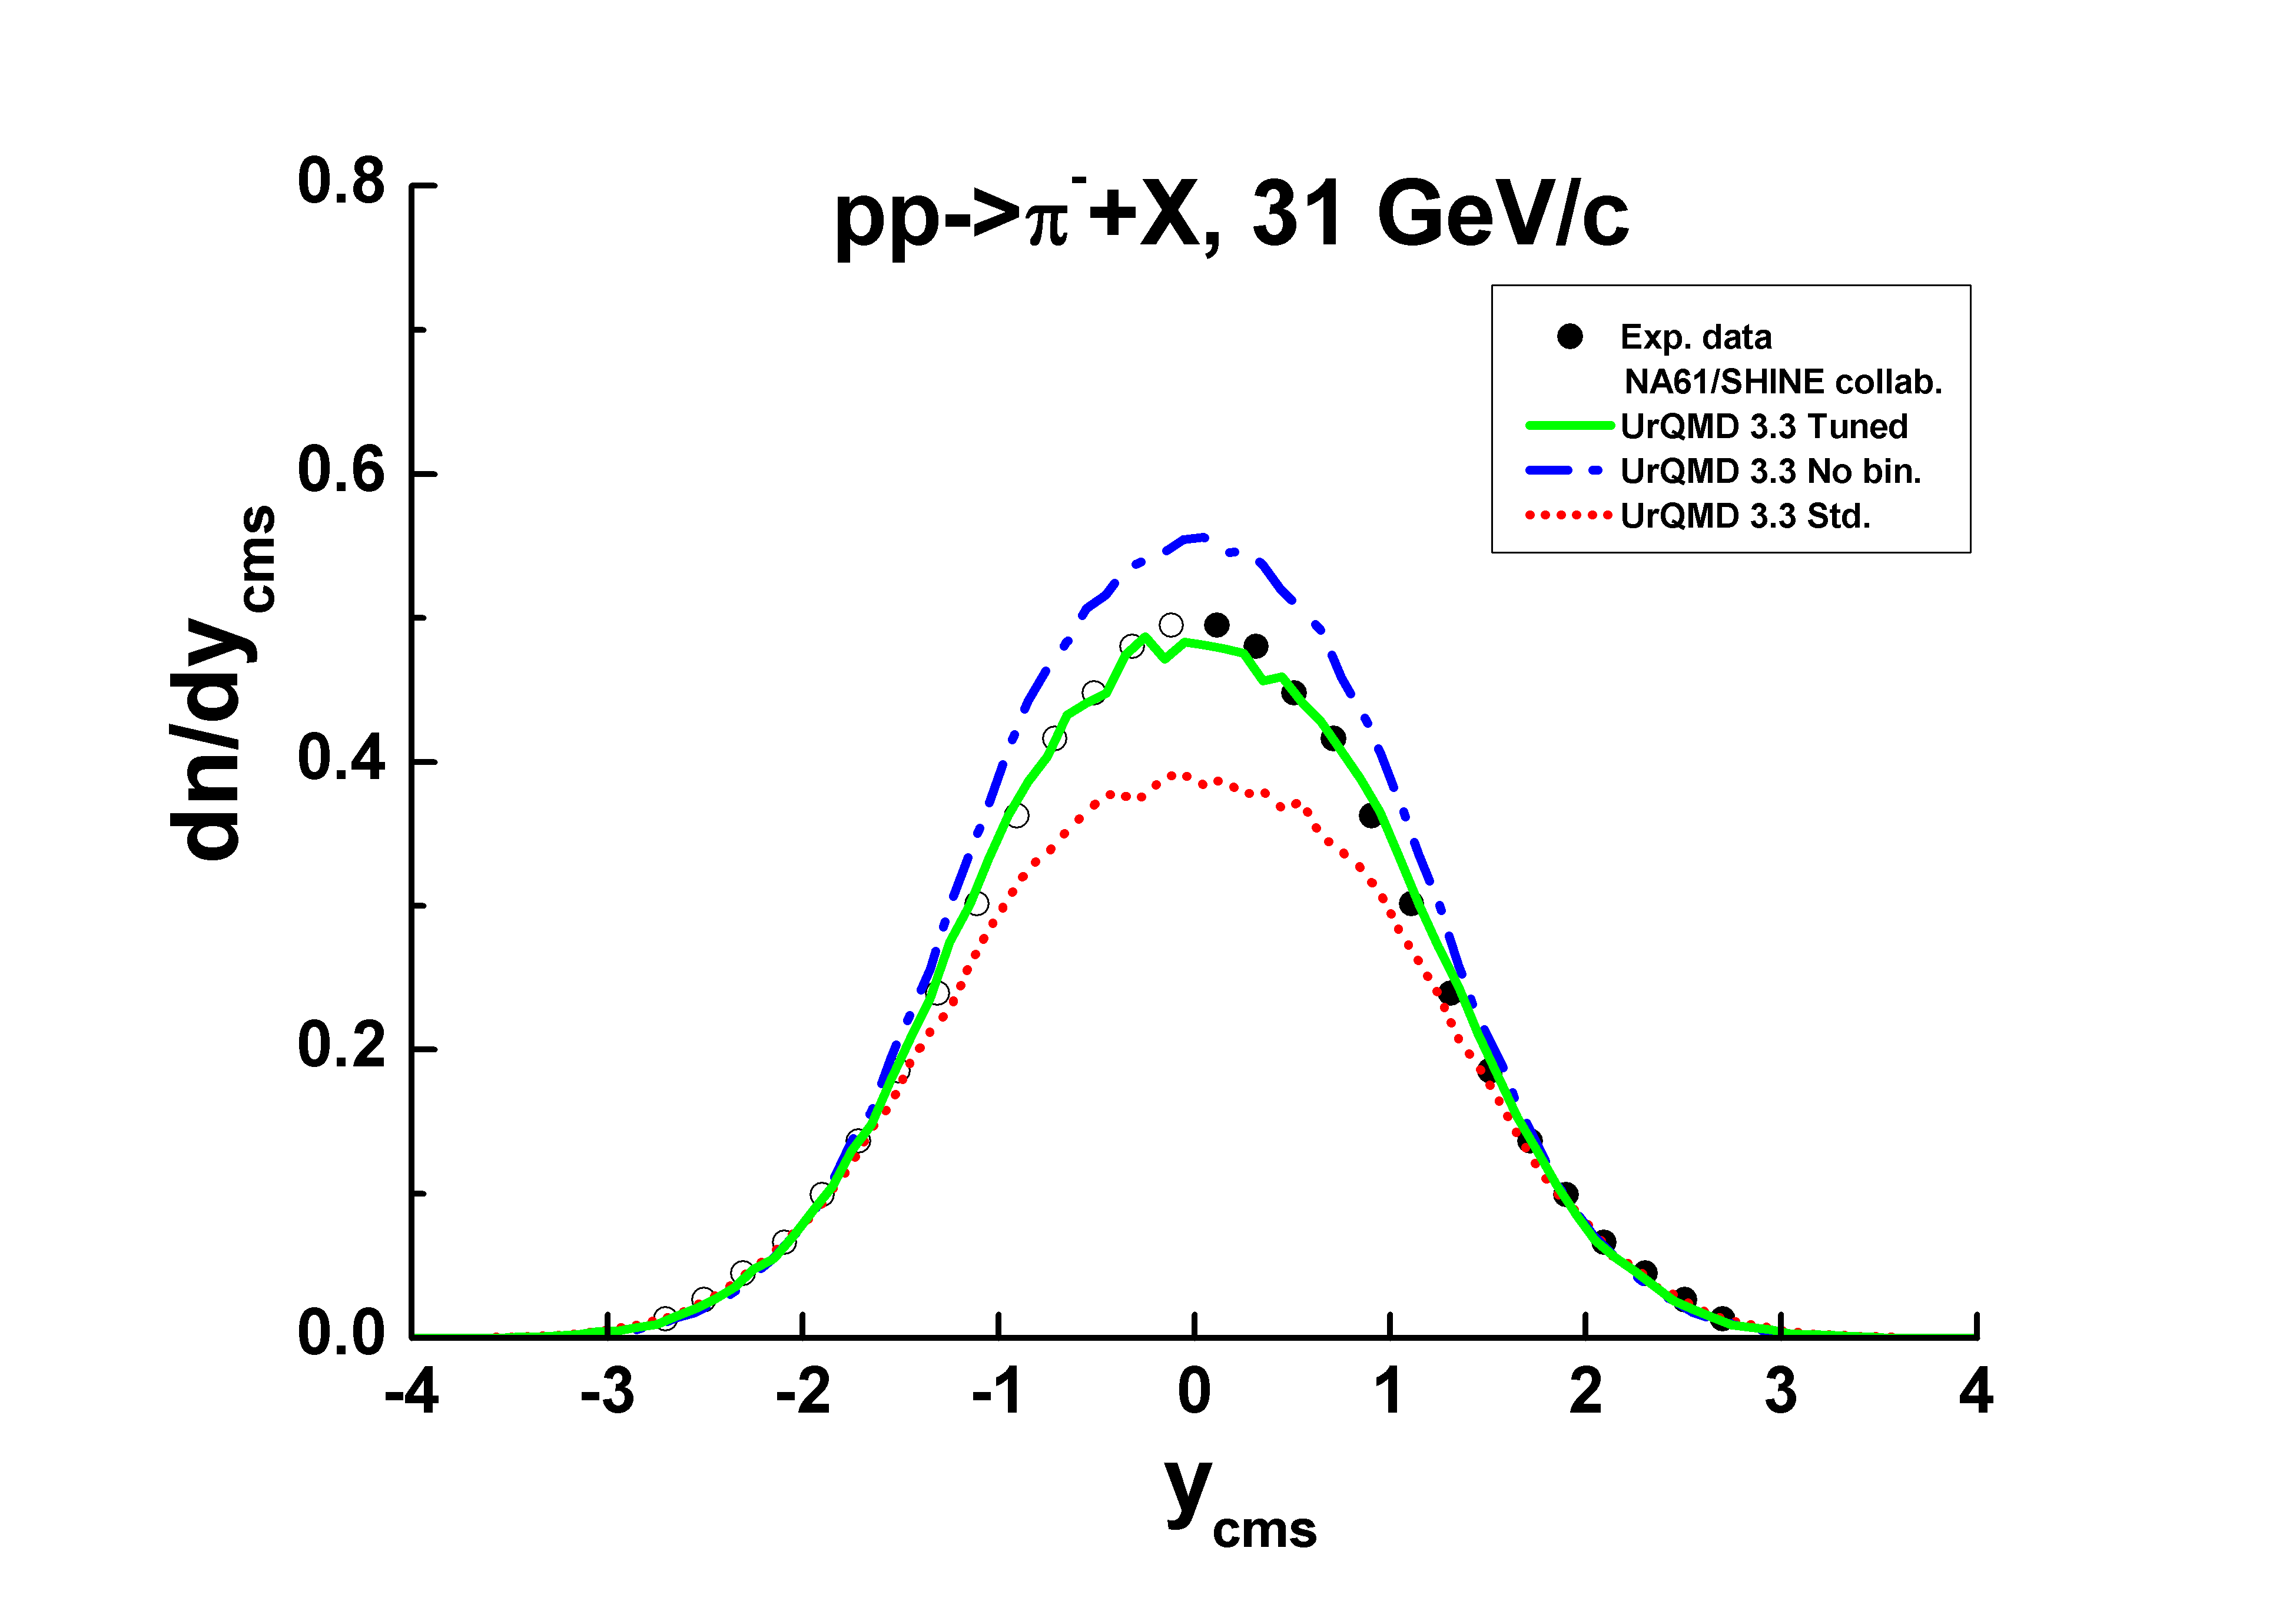
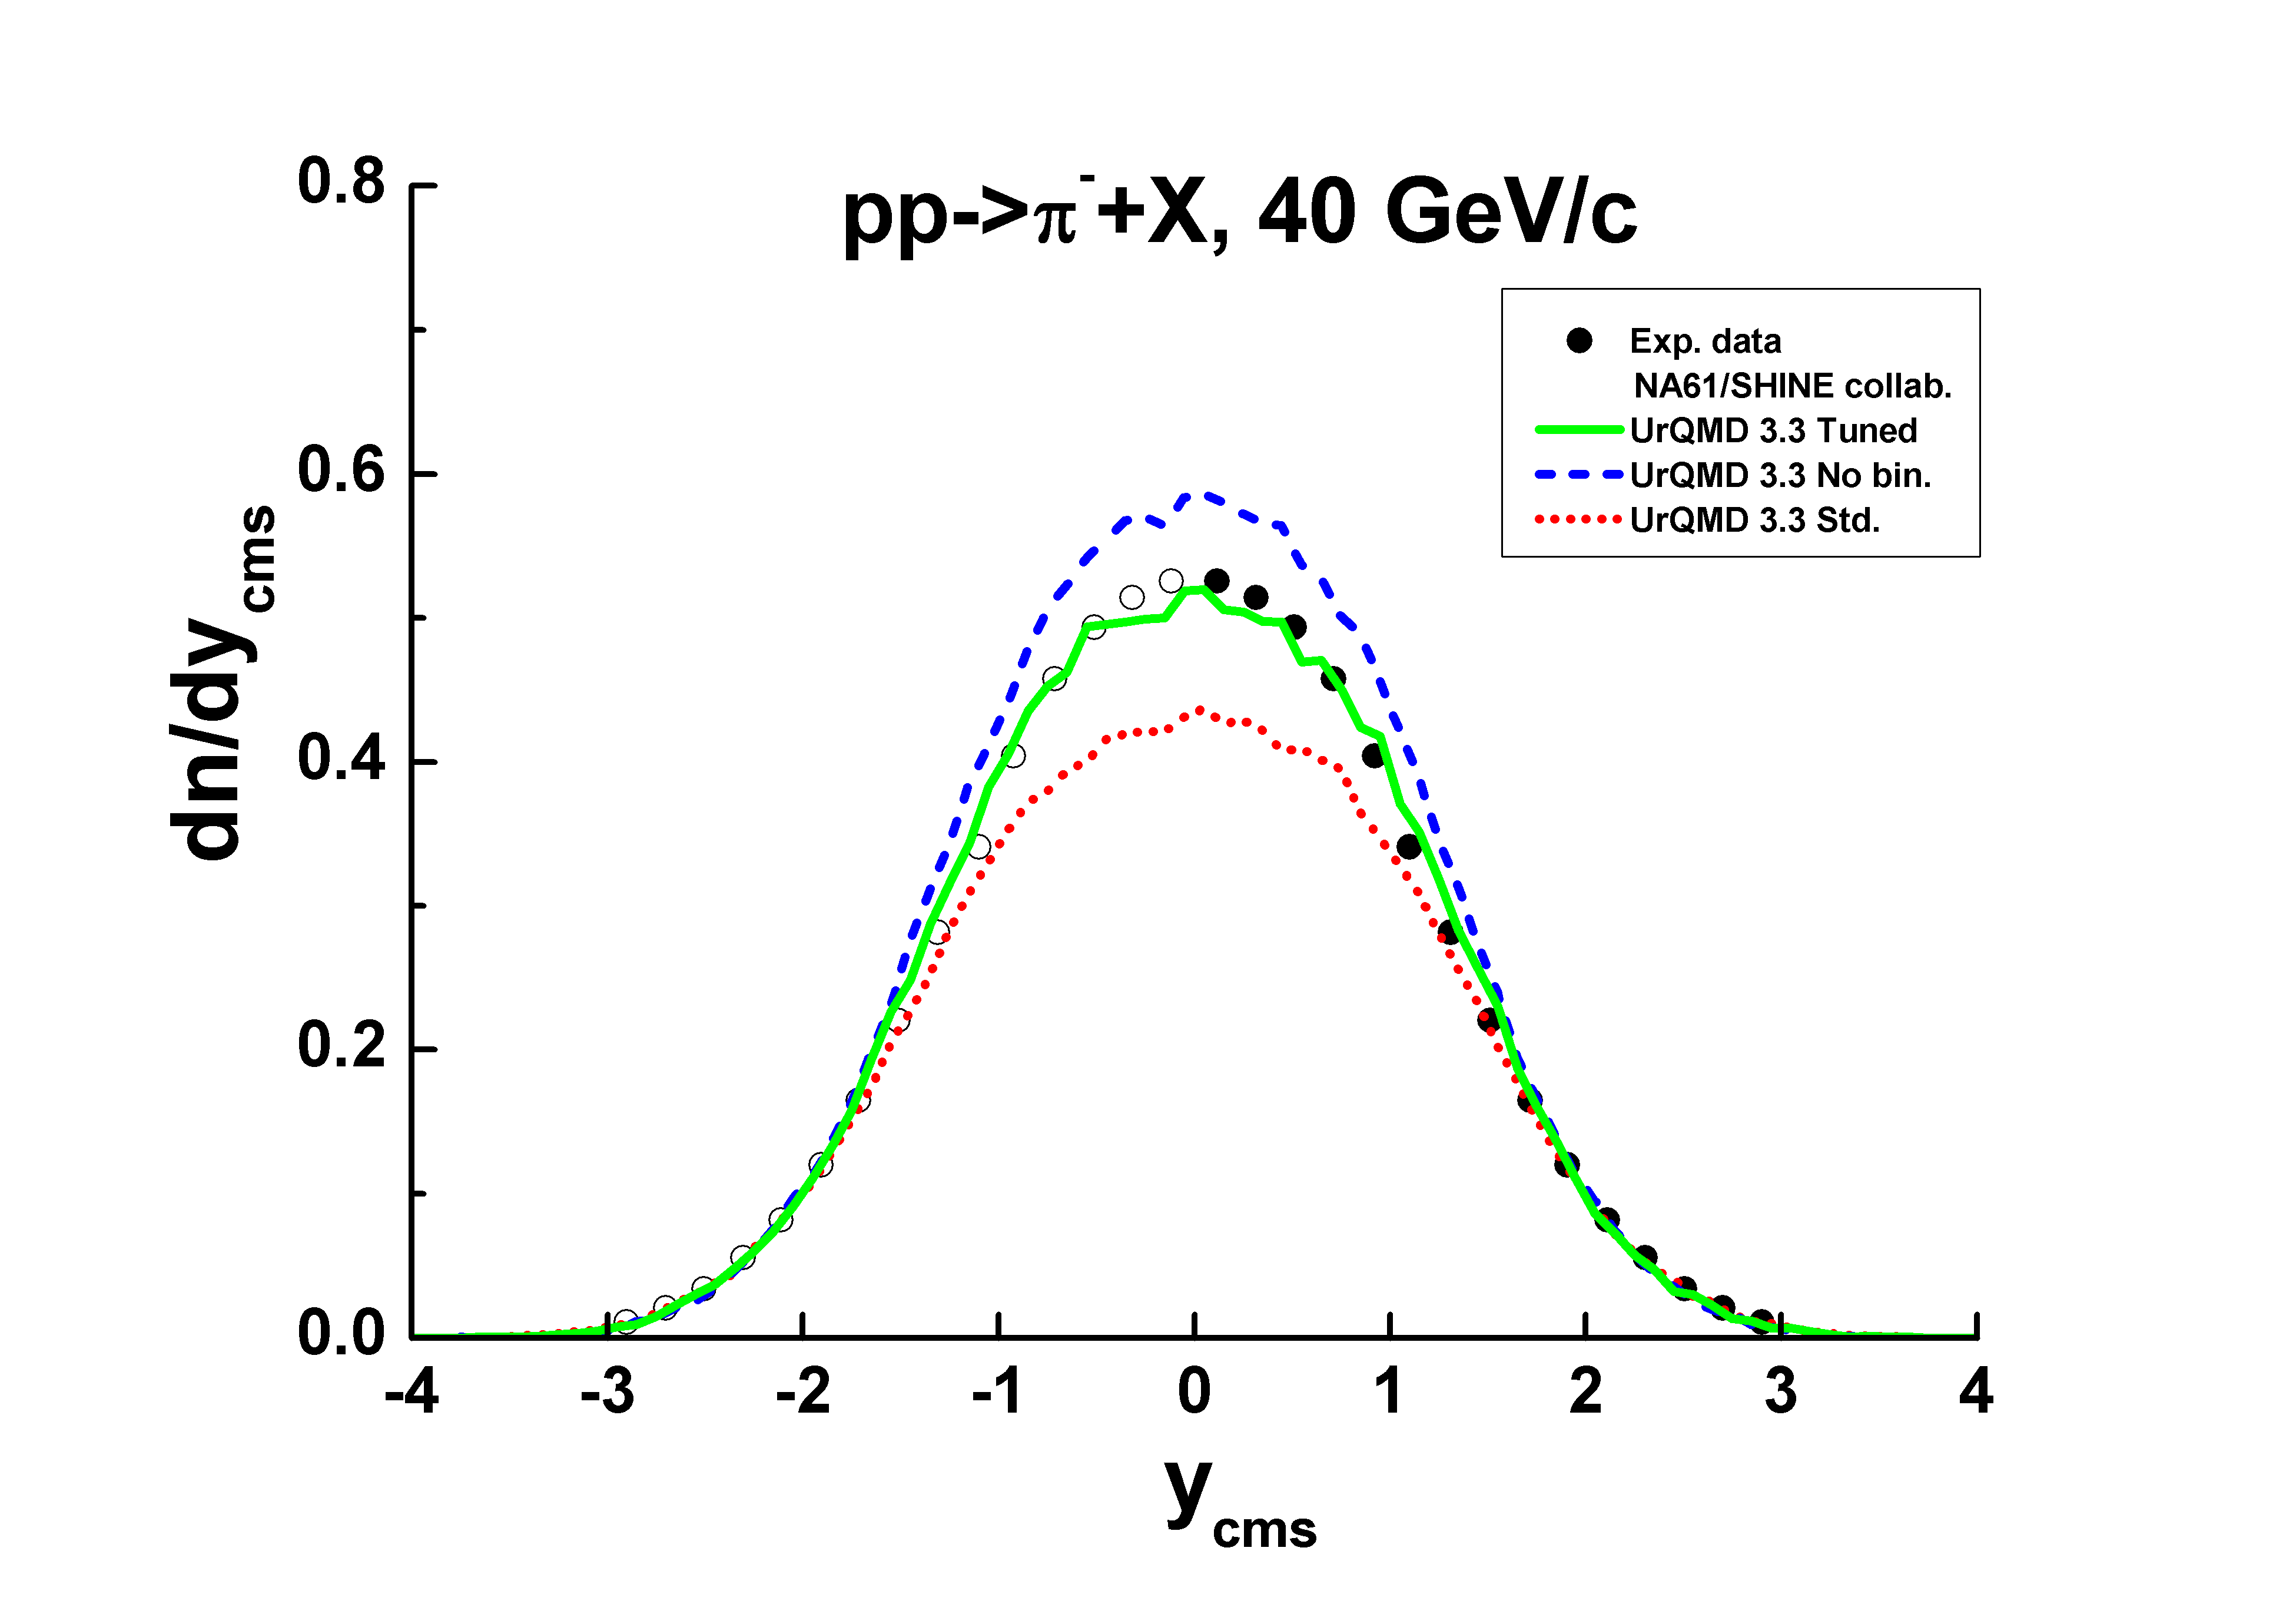
It was checked that these allowed to describe -data at 20, 31, 40 and 80 GeV/c.
3.3 Tuning of the UrQMD model
The accounting of the binary reactions is the main difference between the UrQMD model and other Fritiof model implementations. Thus, one can suppose that an erasing333See details in [9].) of the reactions in the model eliminates the difference between the model’s predictions. Really, it is so, as it shown in Fig. 7 where short-dashed red lines show calculations by the original model, and long-dashed blue ones are calculations without the binary reactions. As seen, the last calculations overestimate the data. The model results can be easily improved introducing a probability of the Fritiof processes like (see solid green lines in Fig. 7). These indicate that the binary reaction cross sections are not tuned quite well in the model.
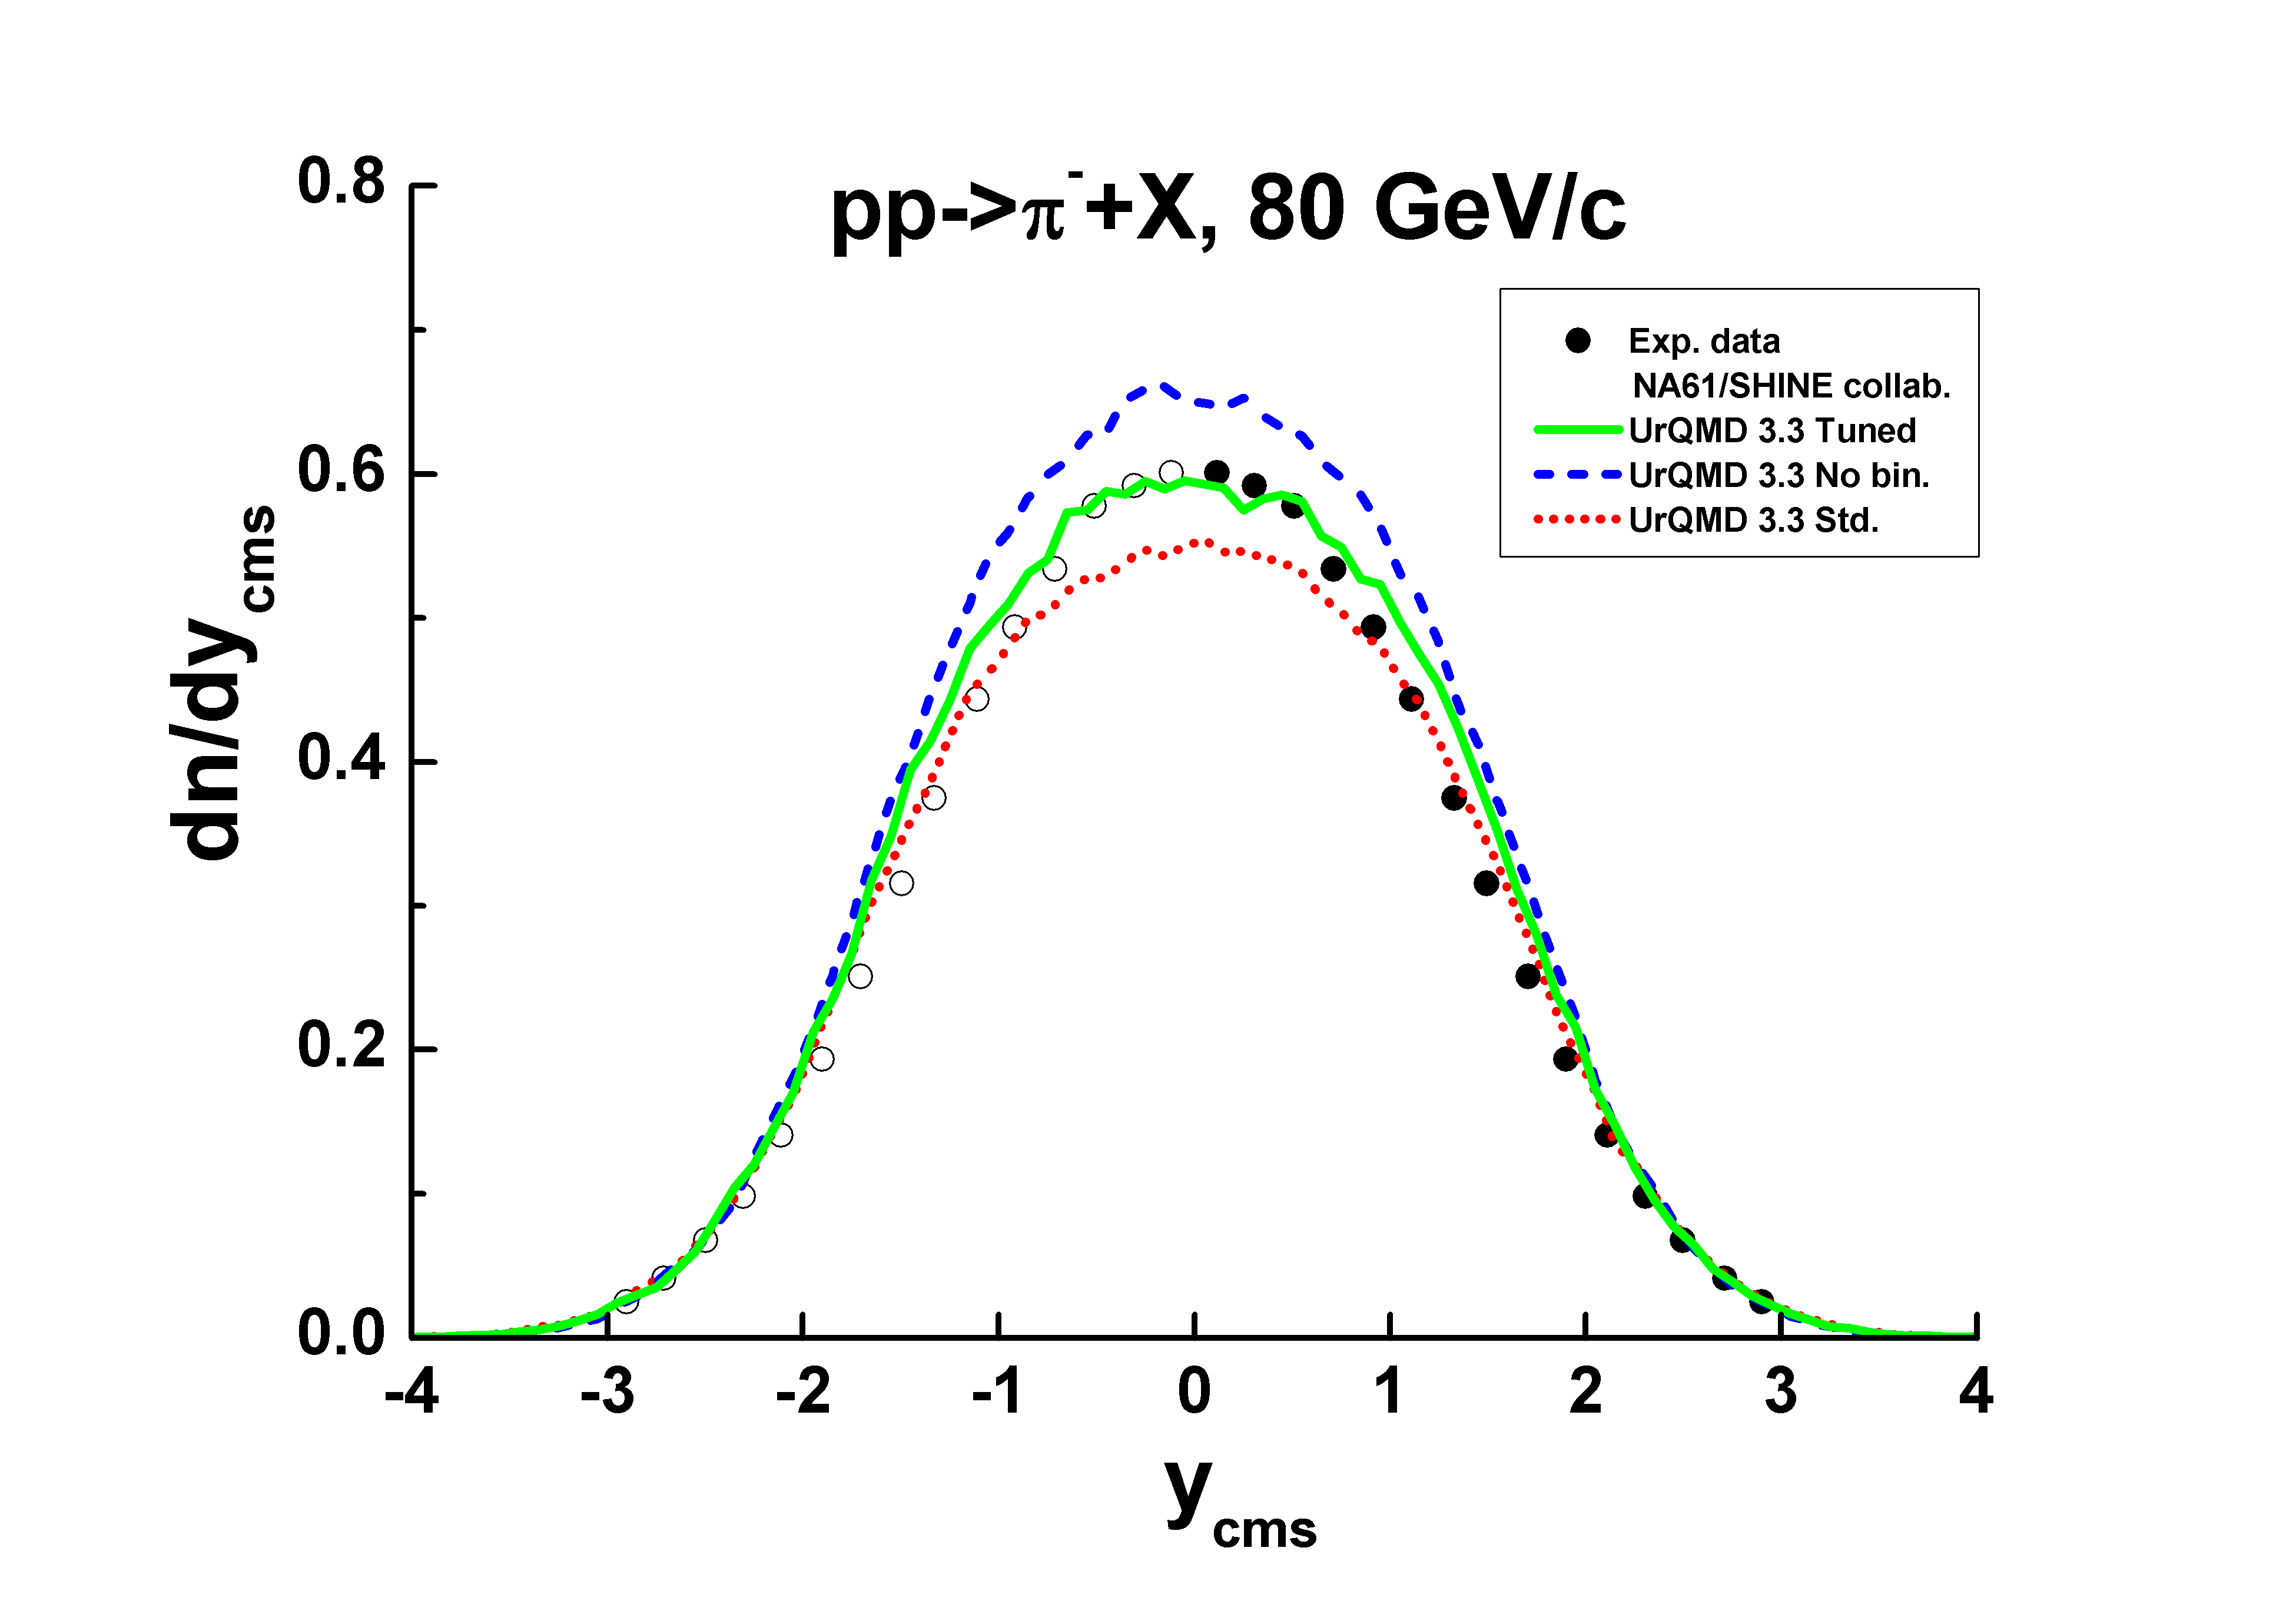
The probability of the Fritiof processes was introduced in the file scatter.f of the model as:
call normit (sigma,isigline)
if((ityp1.le.100).and.(ityp2.le.100).and.(sqrts.ge.3.5d0)) then ! Uzhi
UzhiXin=sigma(0)-sigma(1) ! Uzhi
UzhiSum=UzhiXin-sigma(9) ! Uzhi
sigma(9)=UzhiXin*(1.-1.1/SqrtS) ! Uzhi
UzhiFac=(UzhiXin-sigma(9))/UzhiSum ! Uzhi
do ii=2,nCh-1 ! Uzhi
sigma(ii)=sigma(ii)*UzhiFac ! Uzhi
enddo ! Uzhi
endif ! Uzhi
Results of the tuning for -interactions at 158 GeV/c are presented in Fig. 8 by solid lines. Dashed lines are the standard model calculations. As seen, the model reproduces correctly meson production at 0, but there is an essential difference between the data and the model calculations at other . The difference becomes larger for spectra.
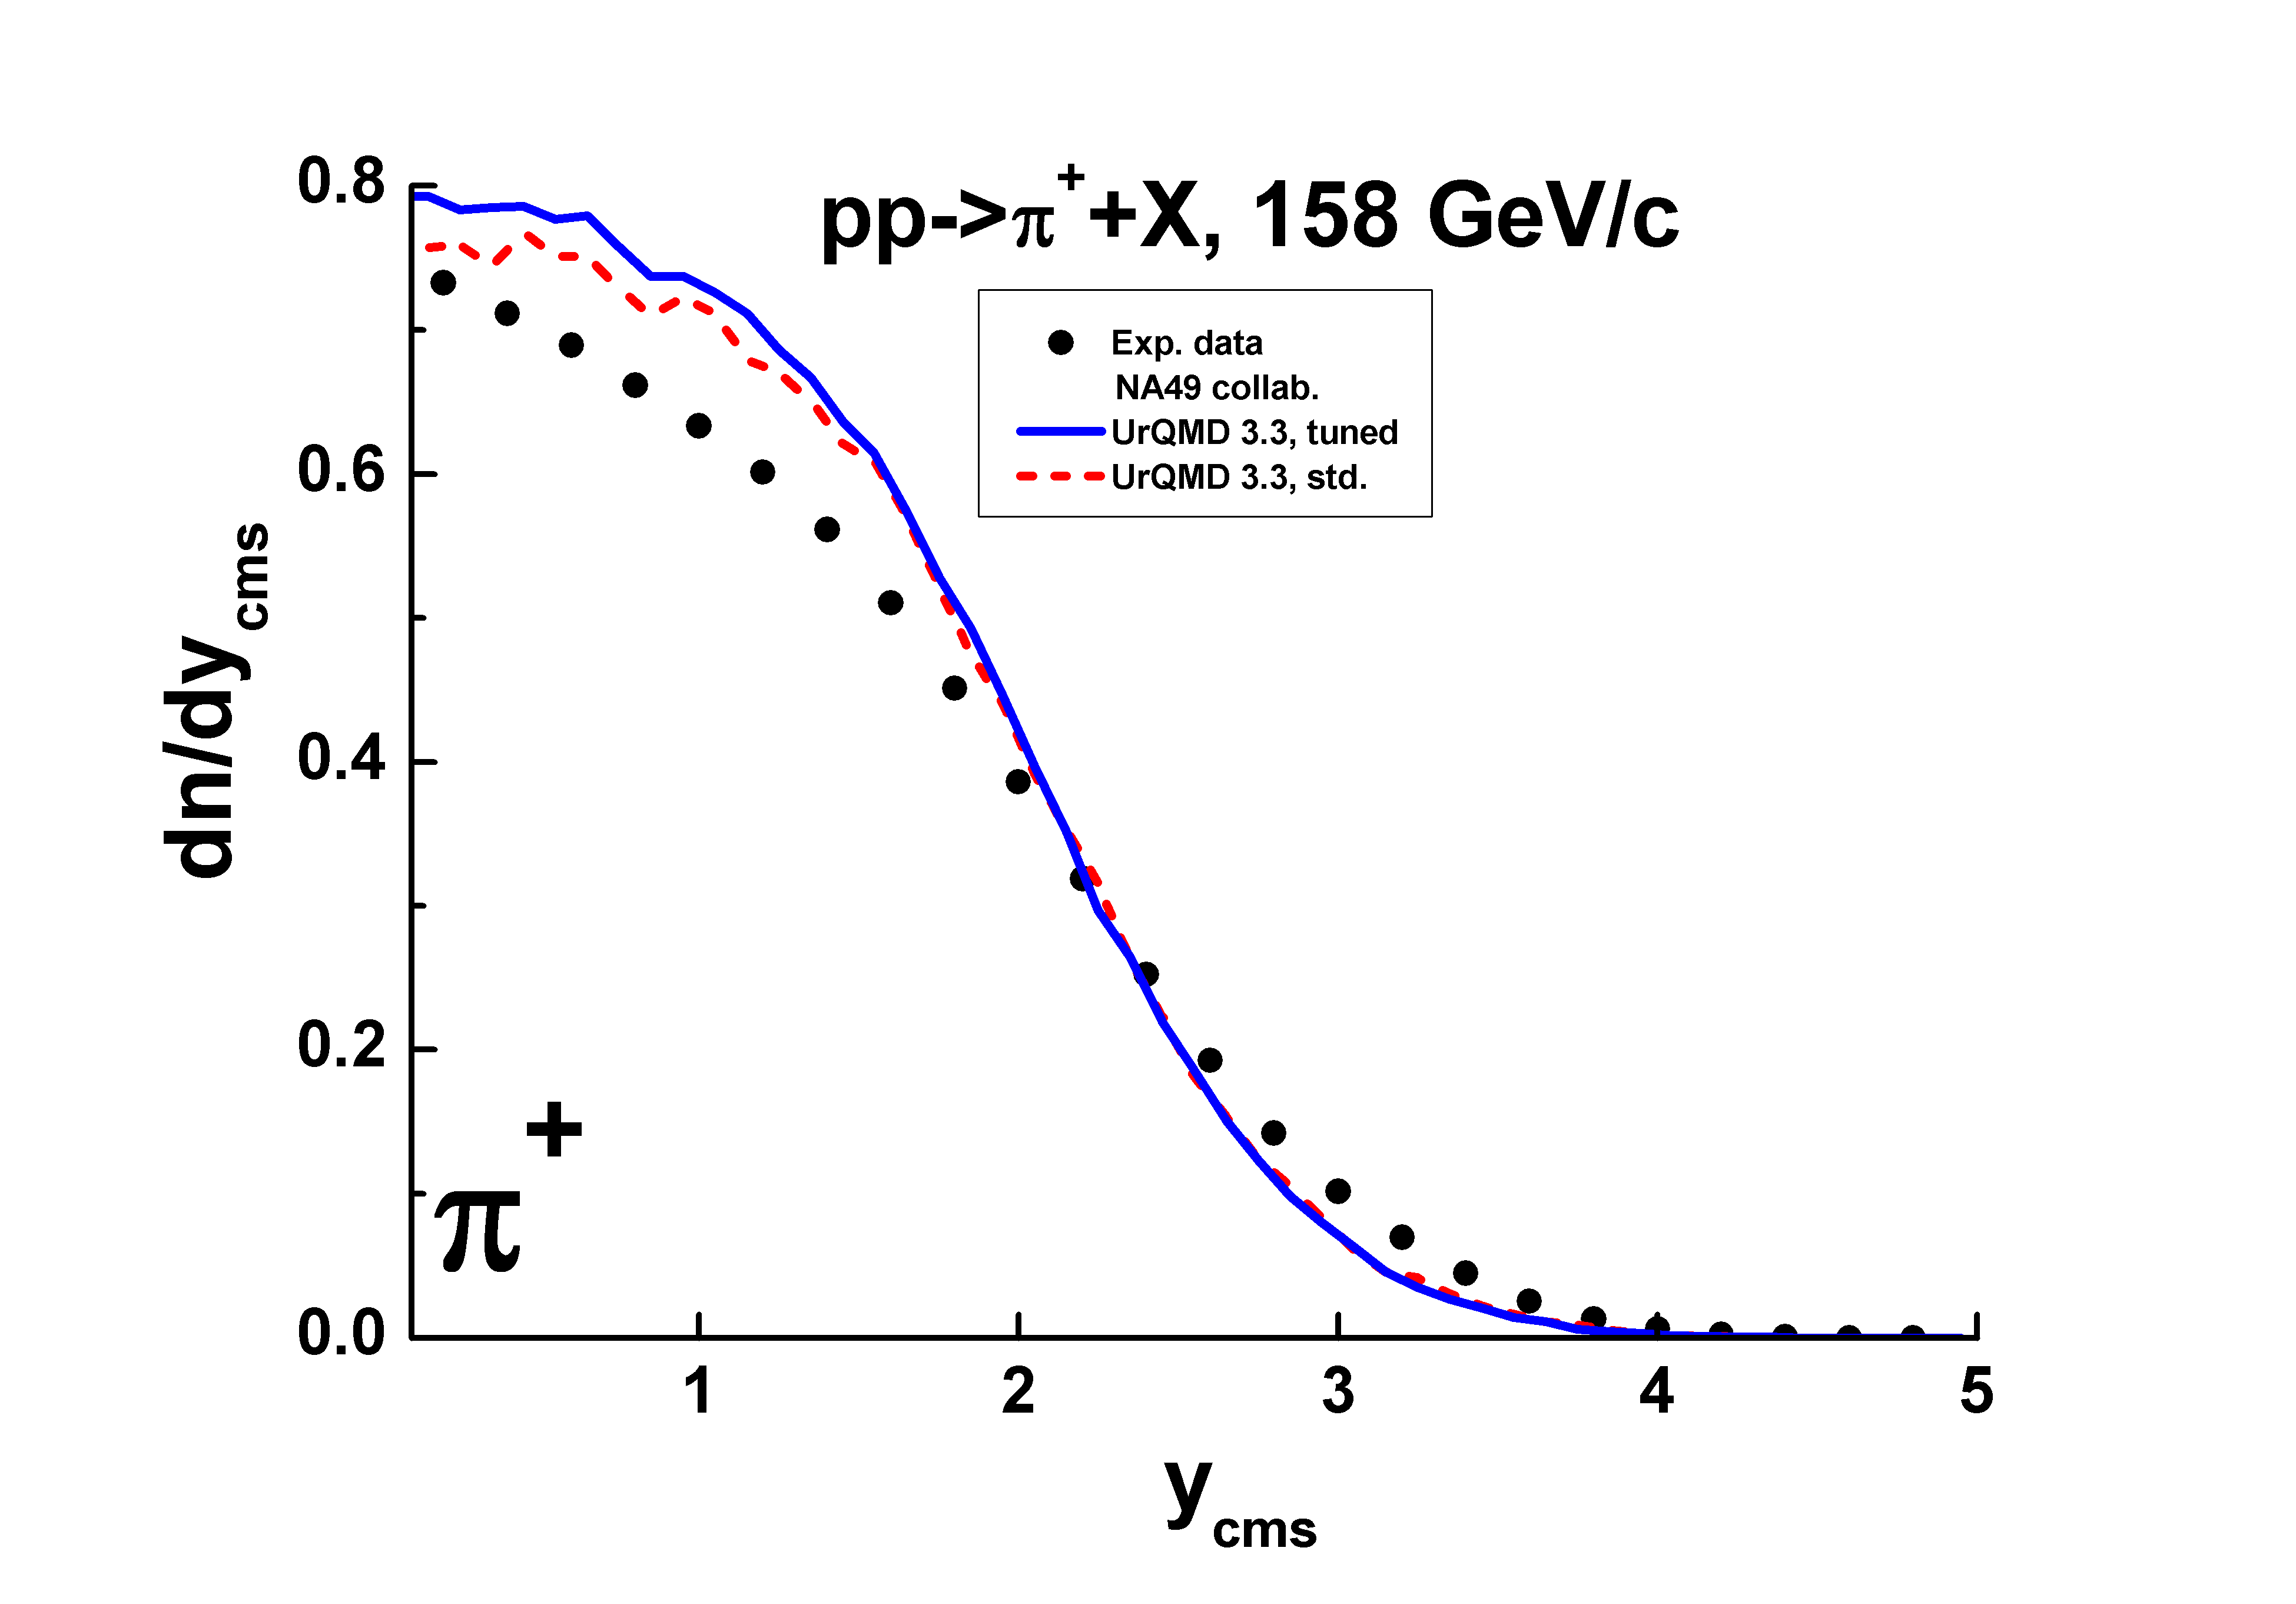
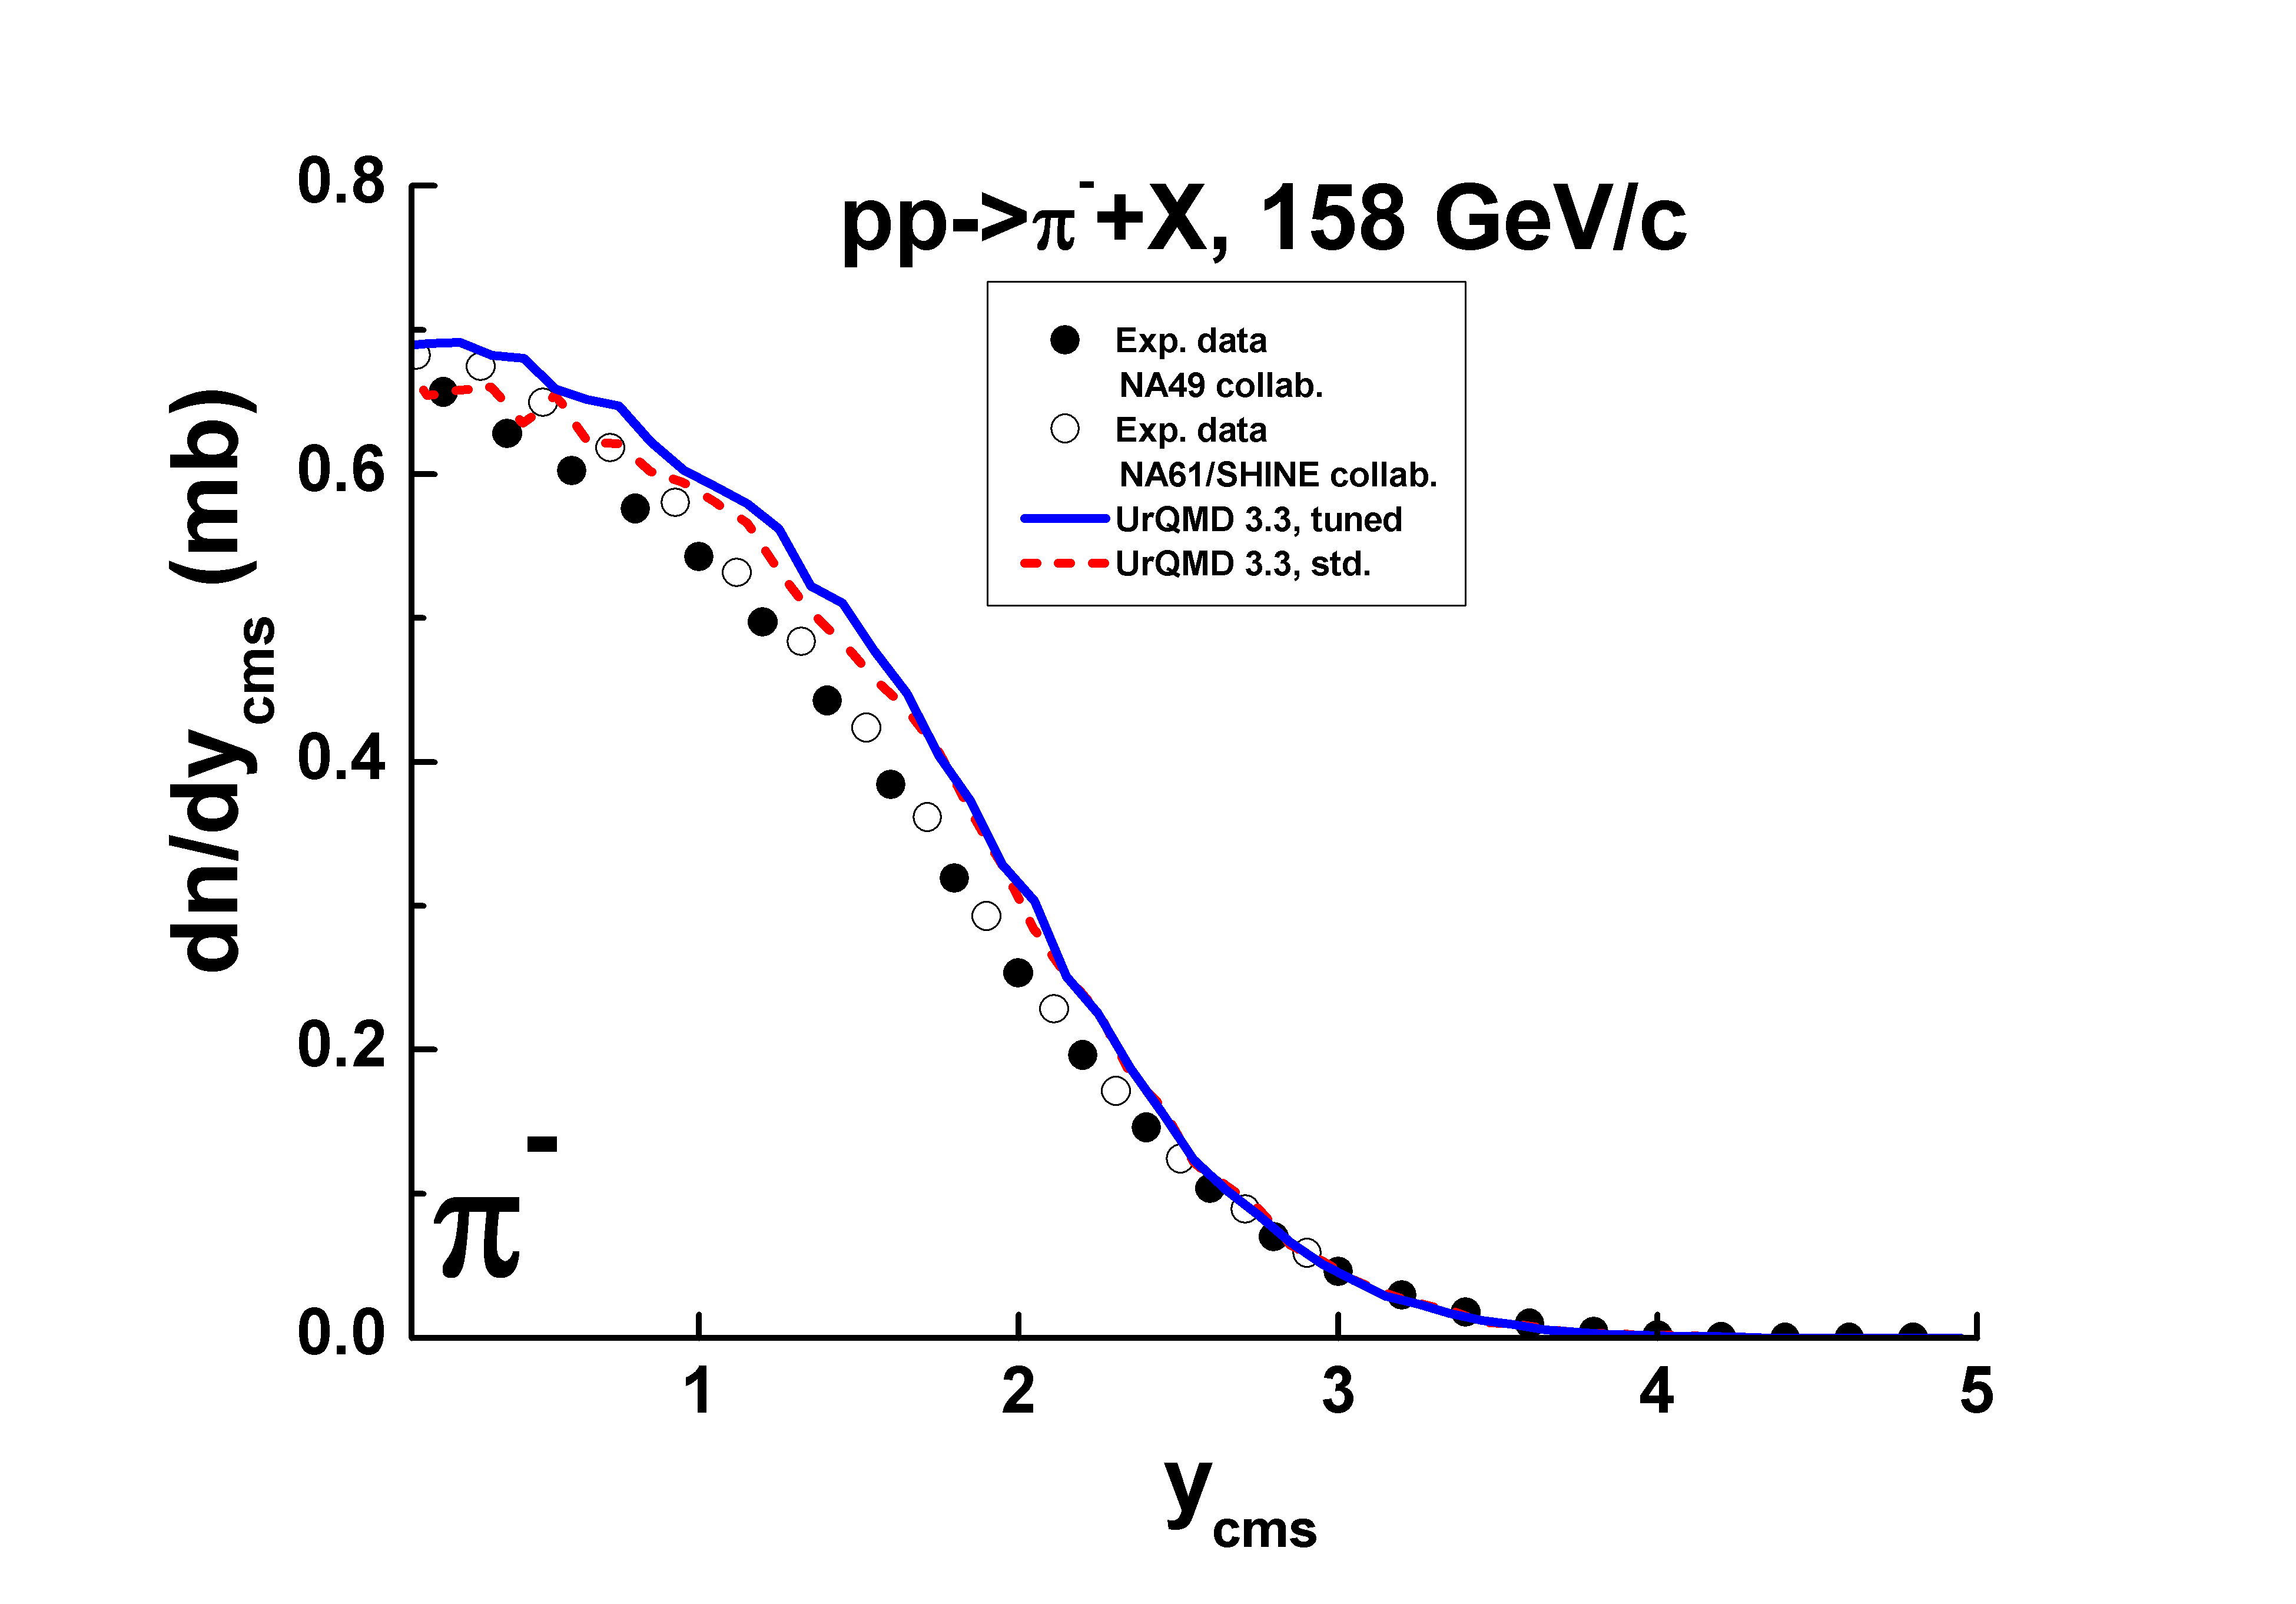
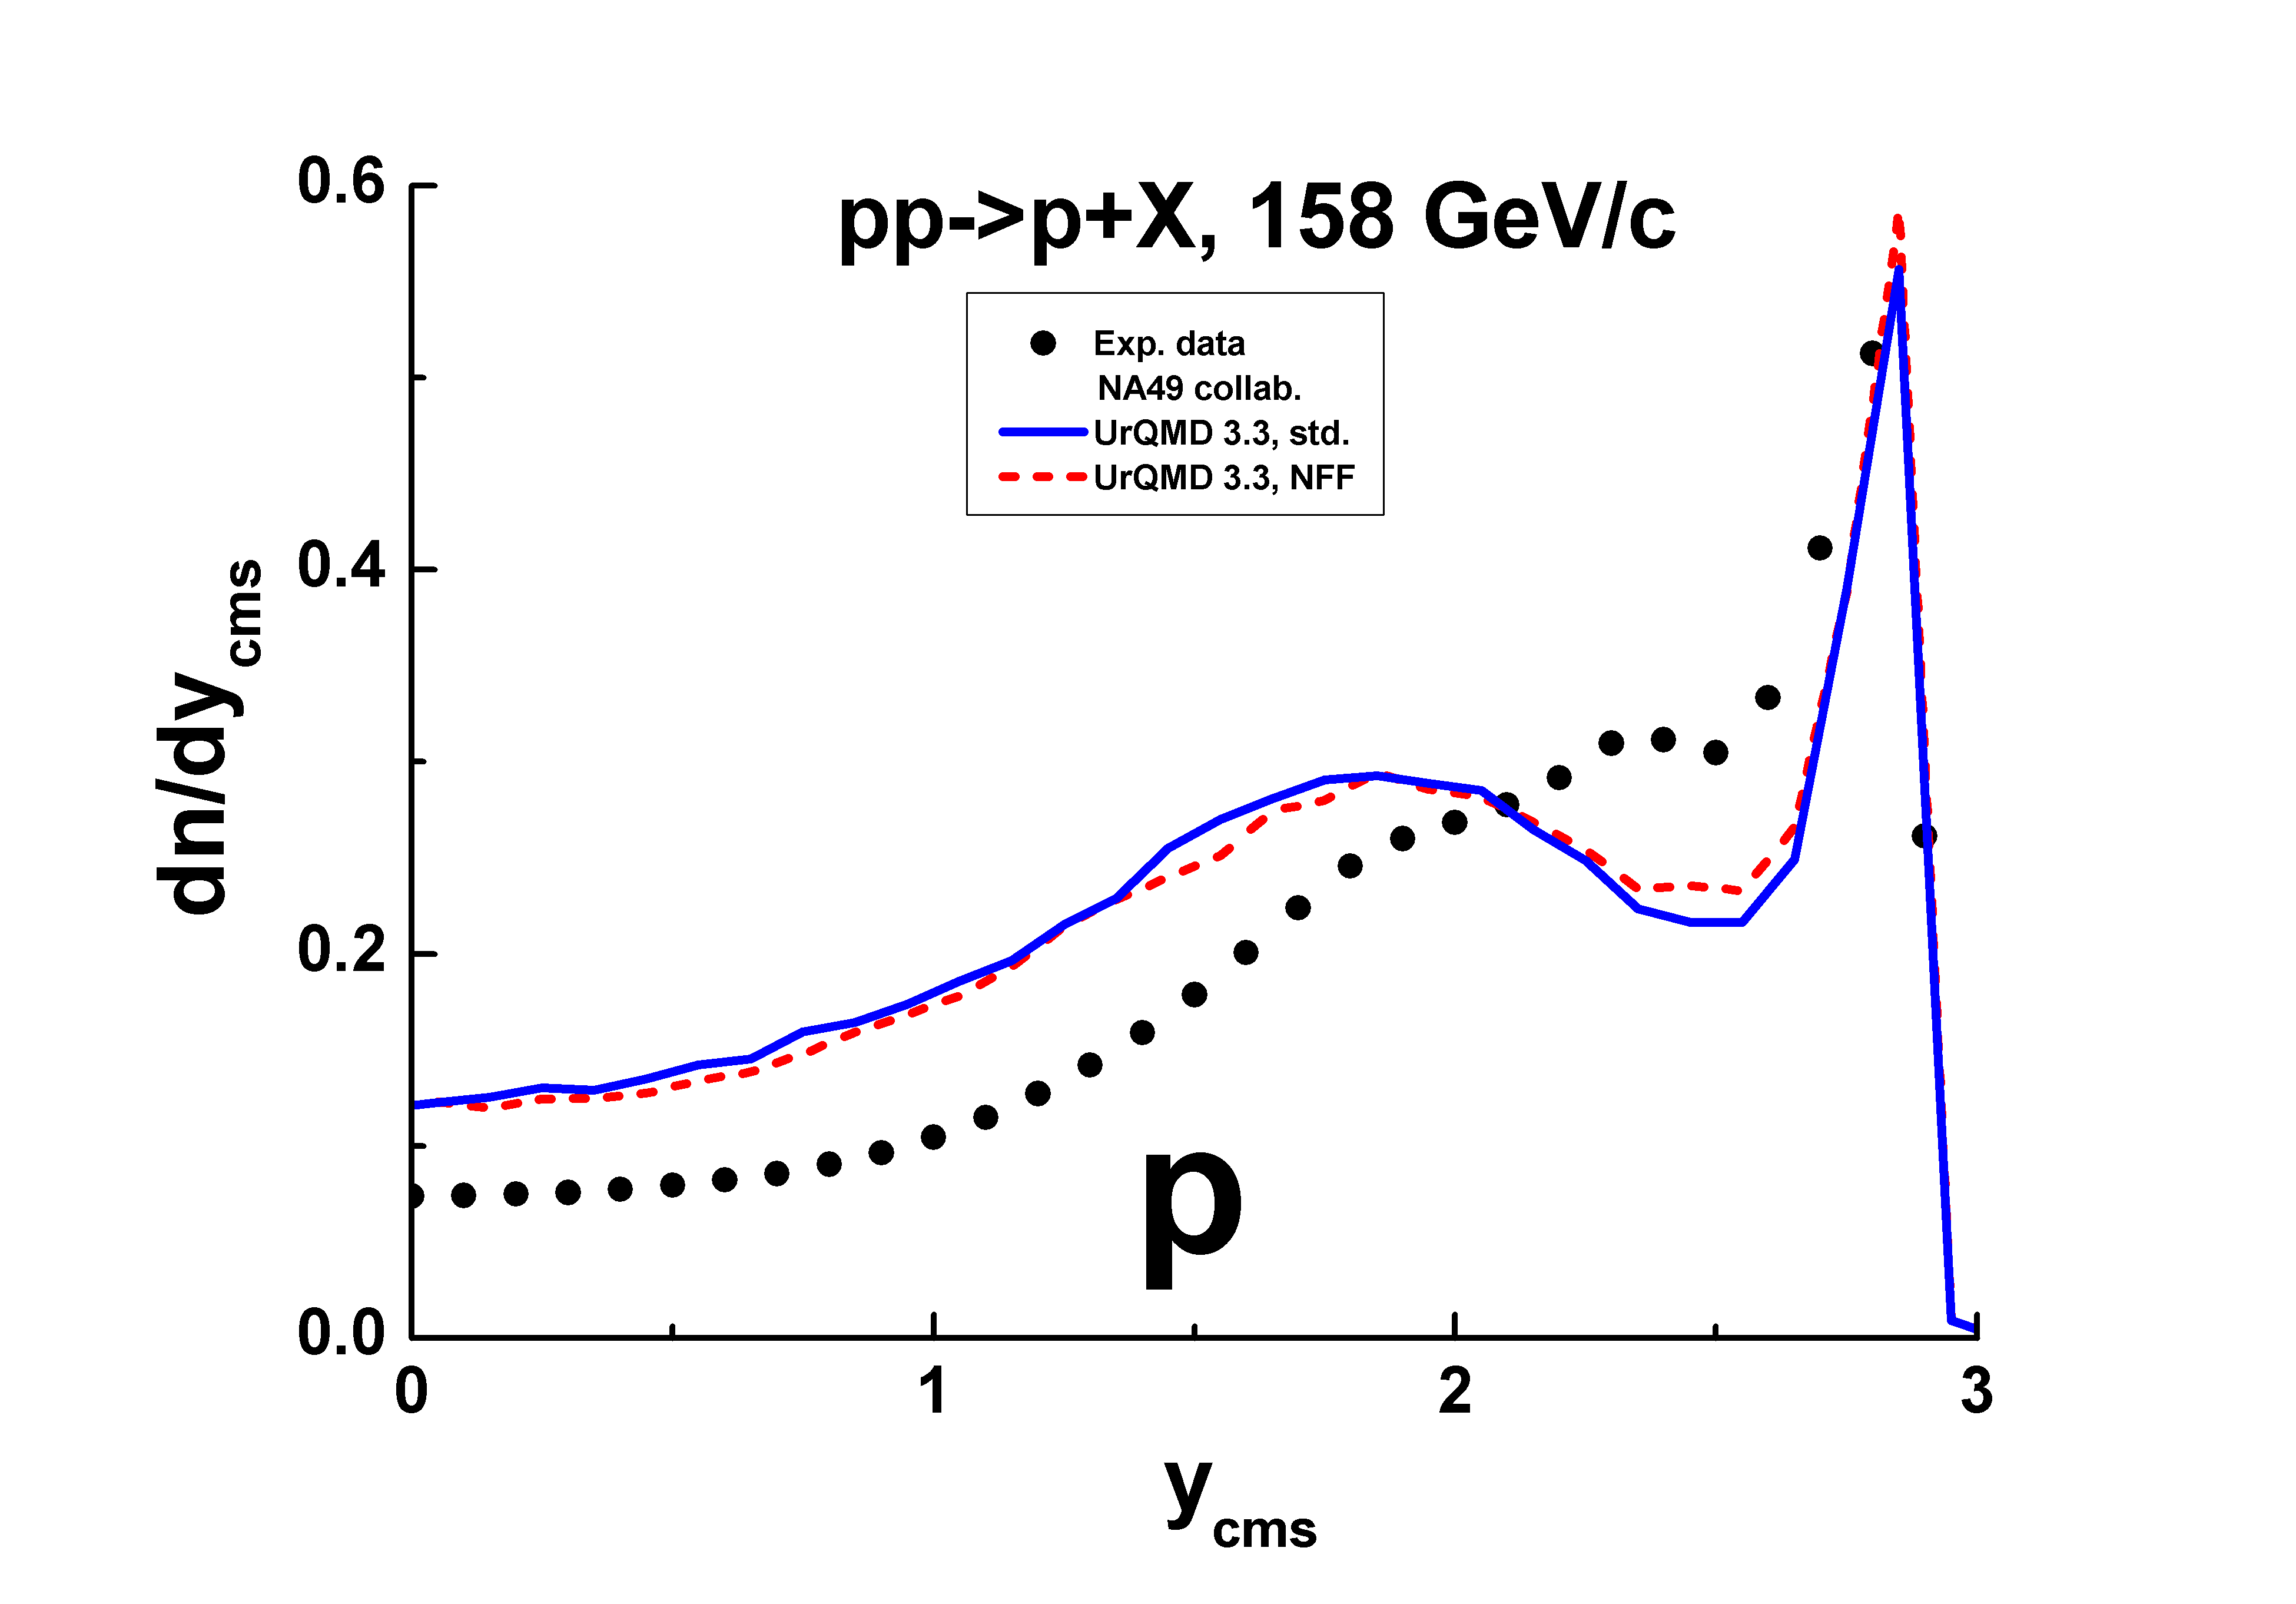
As seen also, the tuning does not affect on the proton spectra. Attempts to improve the description of the proton spectrum were not successful.
4 Verification of diffraction dissociation simulations
The above mentioned differences of the model implementations lead to various predictions of the diffraction peak height shown in Fig. 2. To understand the results, let us look at model calculations and experimental data at various energies.
There are a lot of data at low and high energies. Some of them are shown in Fig. 9 and 10 together with model calculations. The diffraction dissociation in a simple case can be seen in the reactions: , . Of course, there can be other reactions with non-vacuum exchanges in the -channel:
| (3) |
| (4) |
| (5) |
The reactions 3, 4, 5 are absent in the original Fritiof model. Thus, mass spectra of various systems in the reaction are smooth enough according to the Fritiof 1.6 implementation.
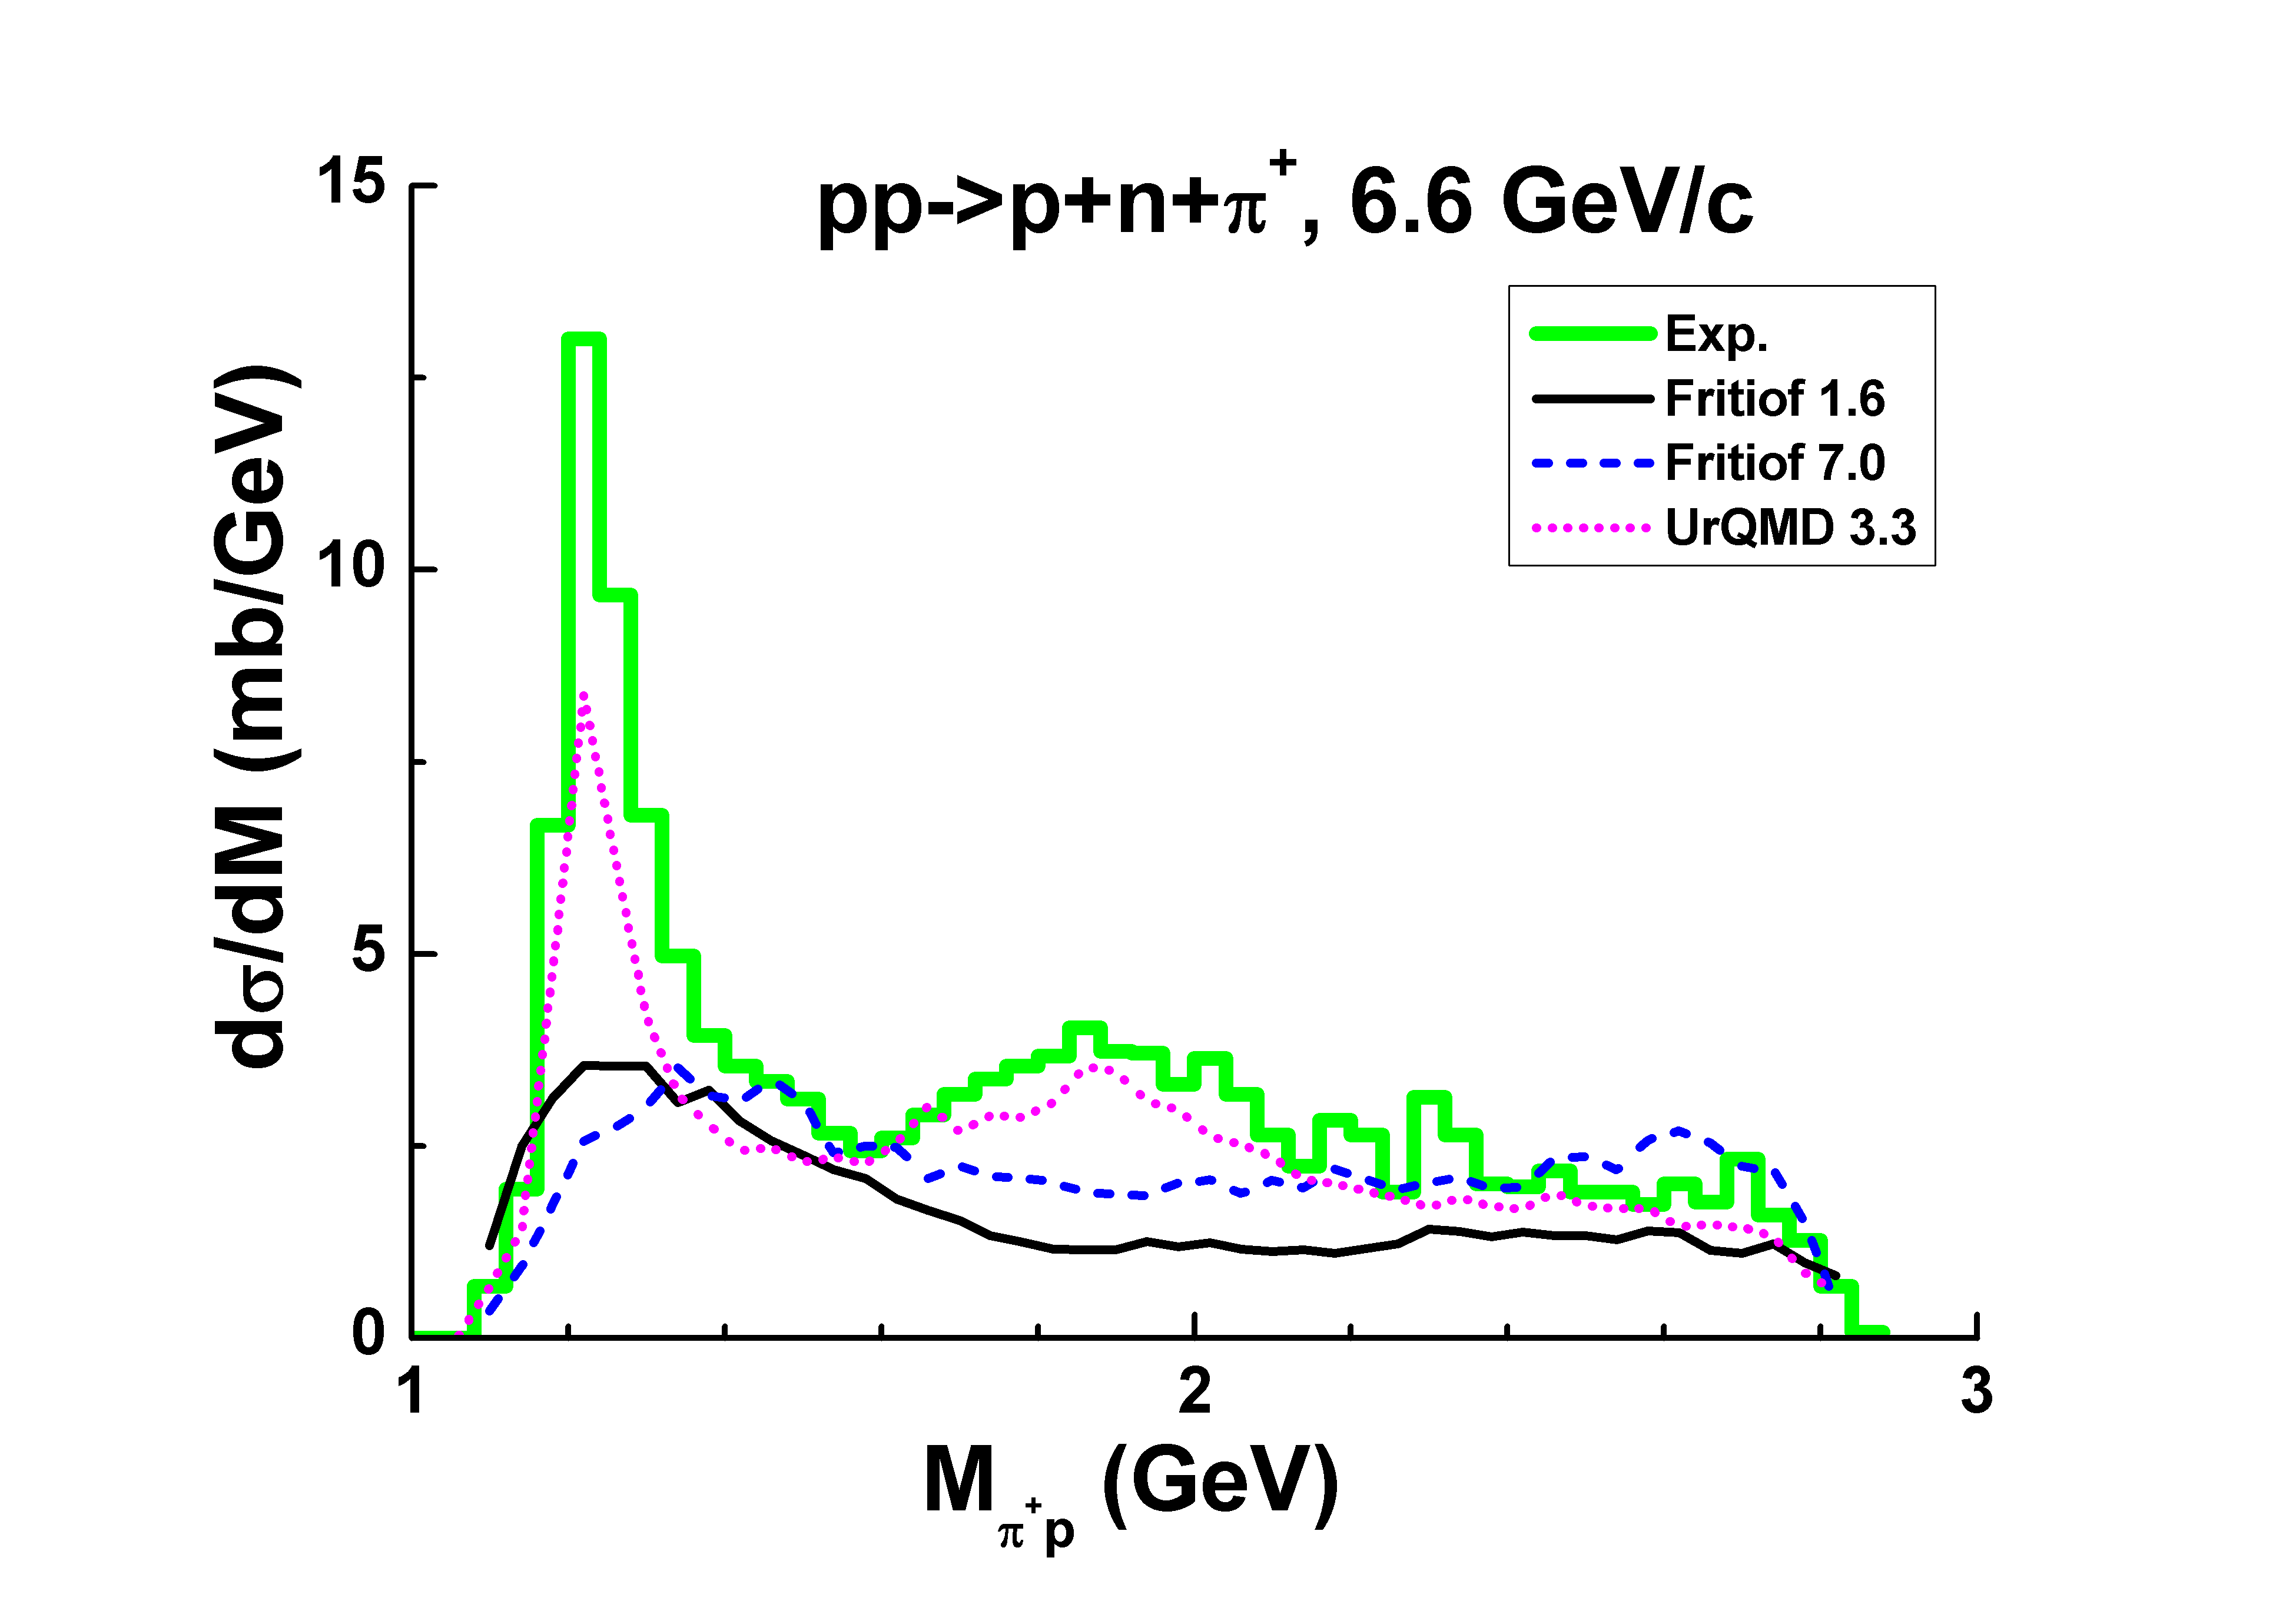
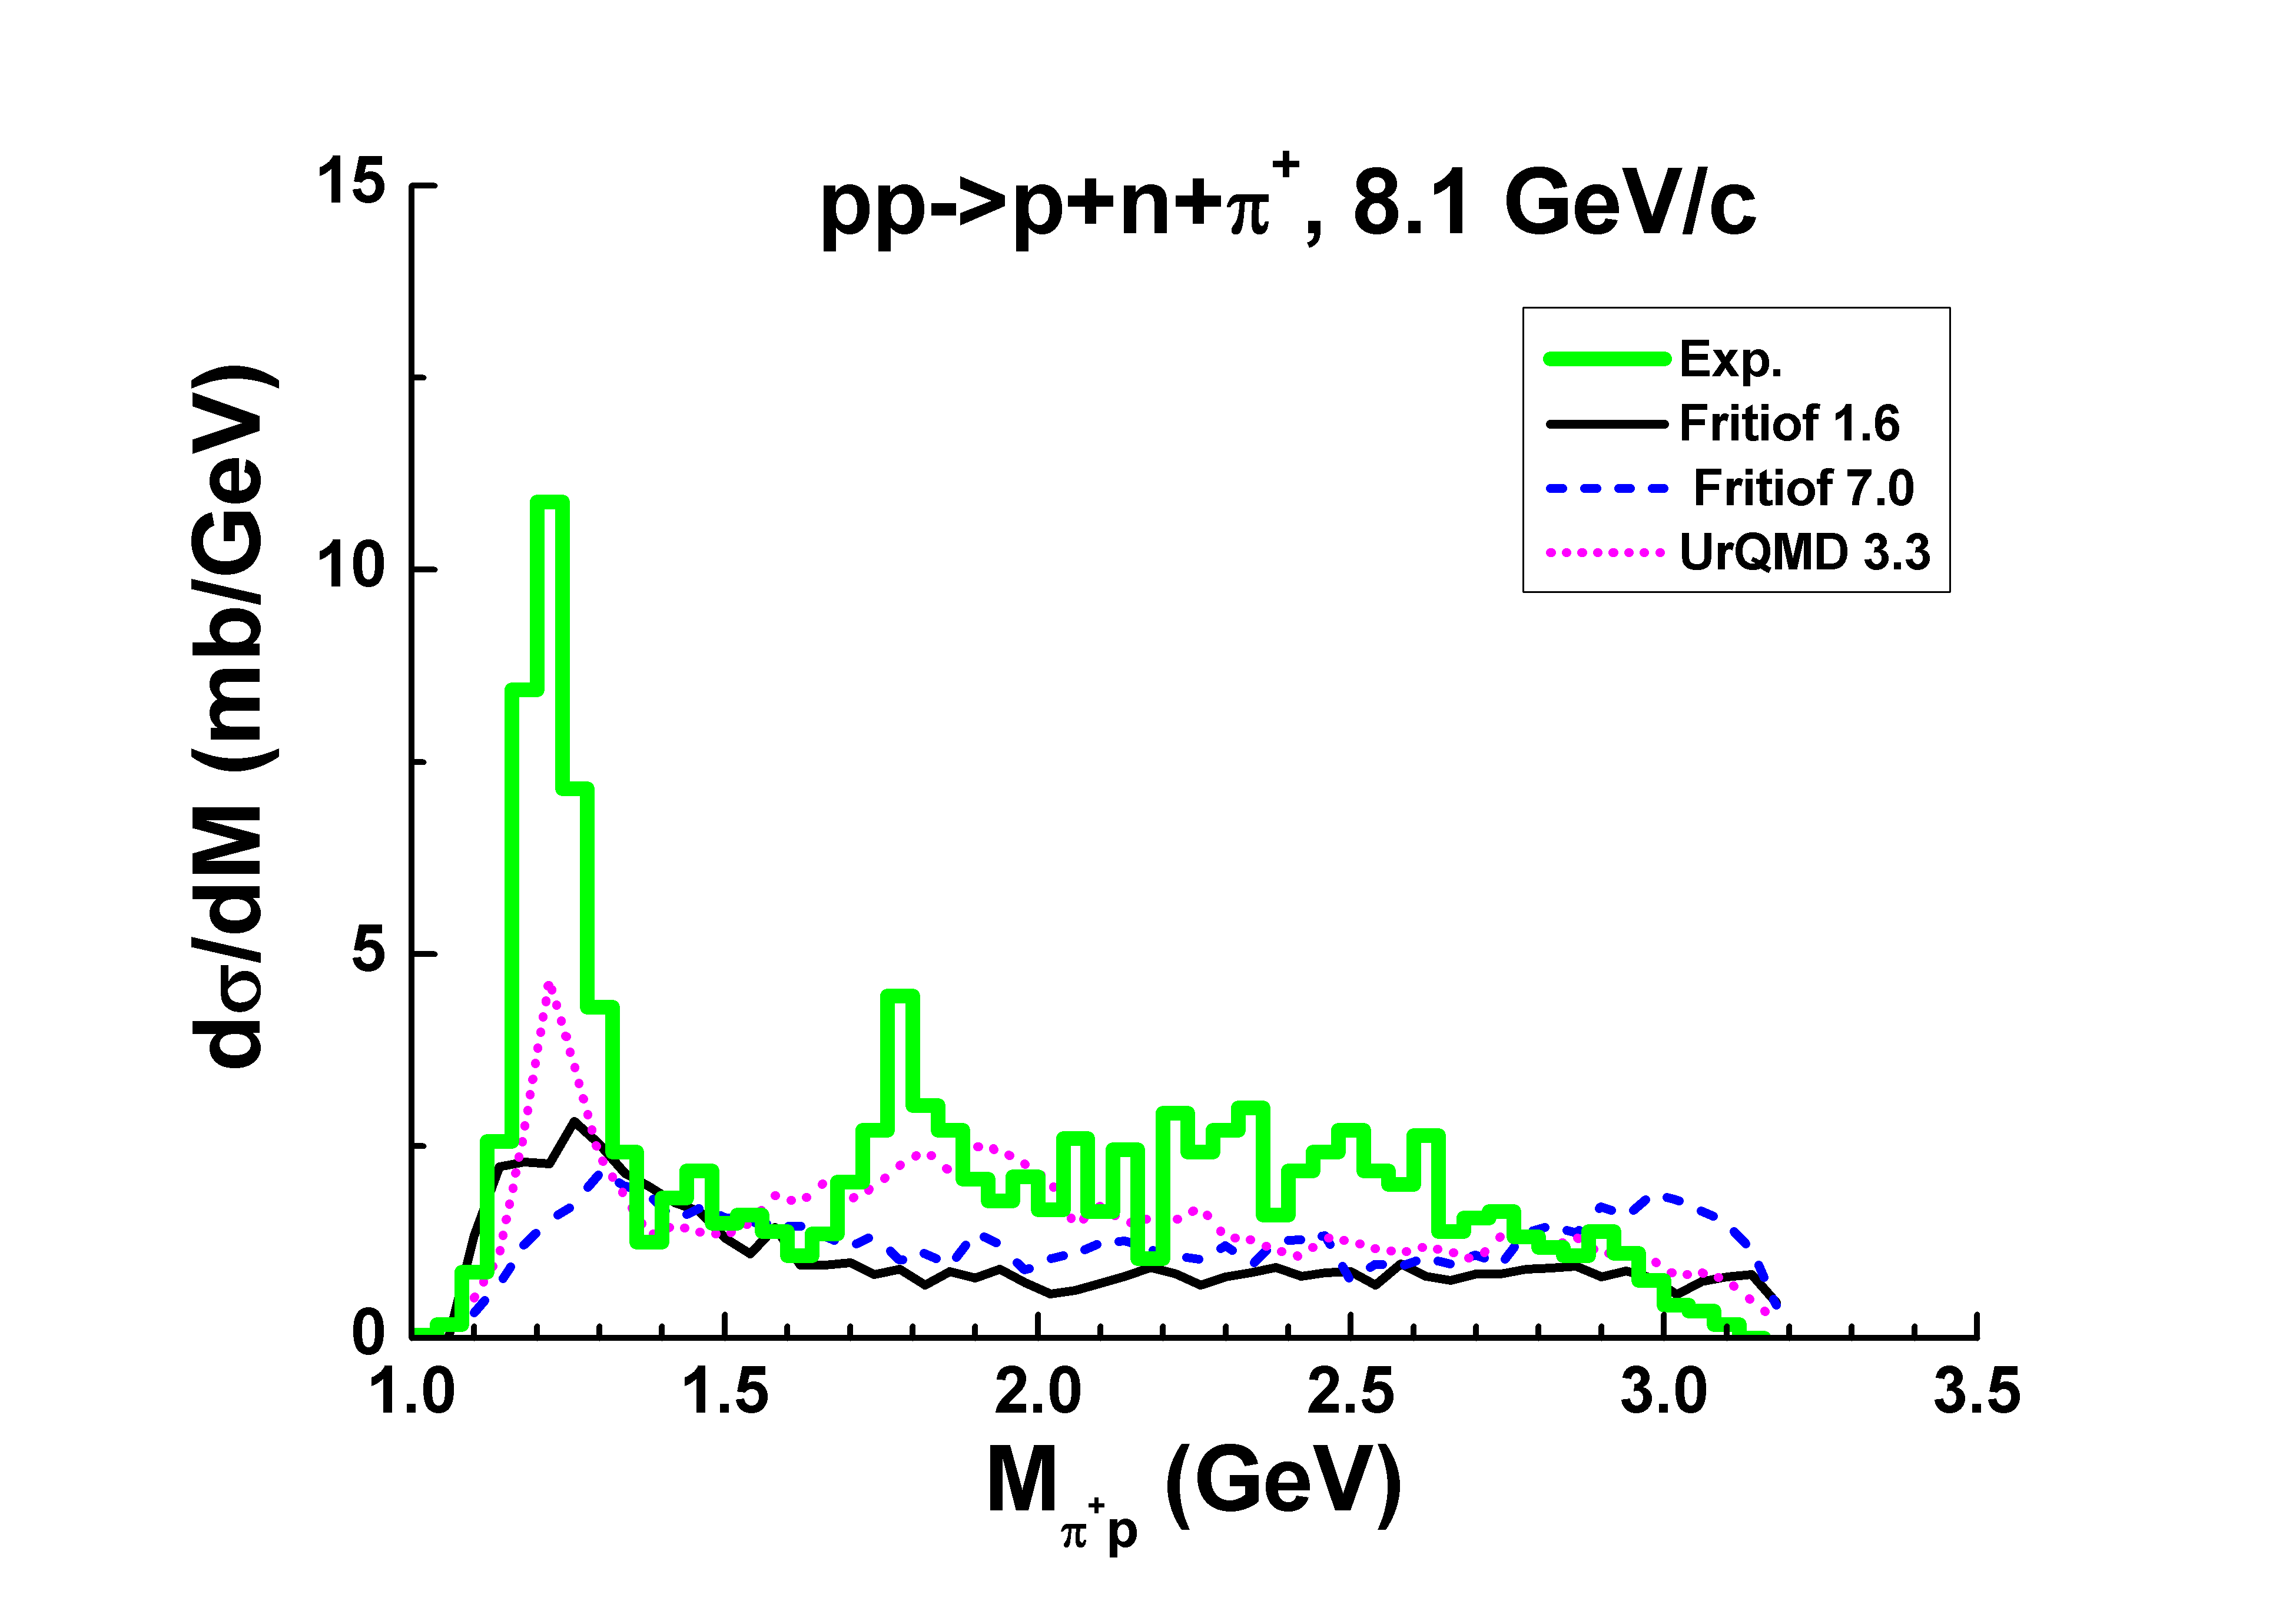
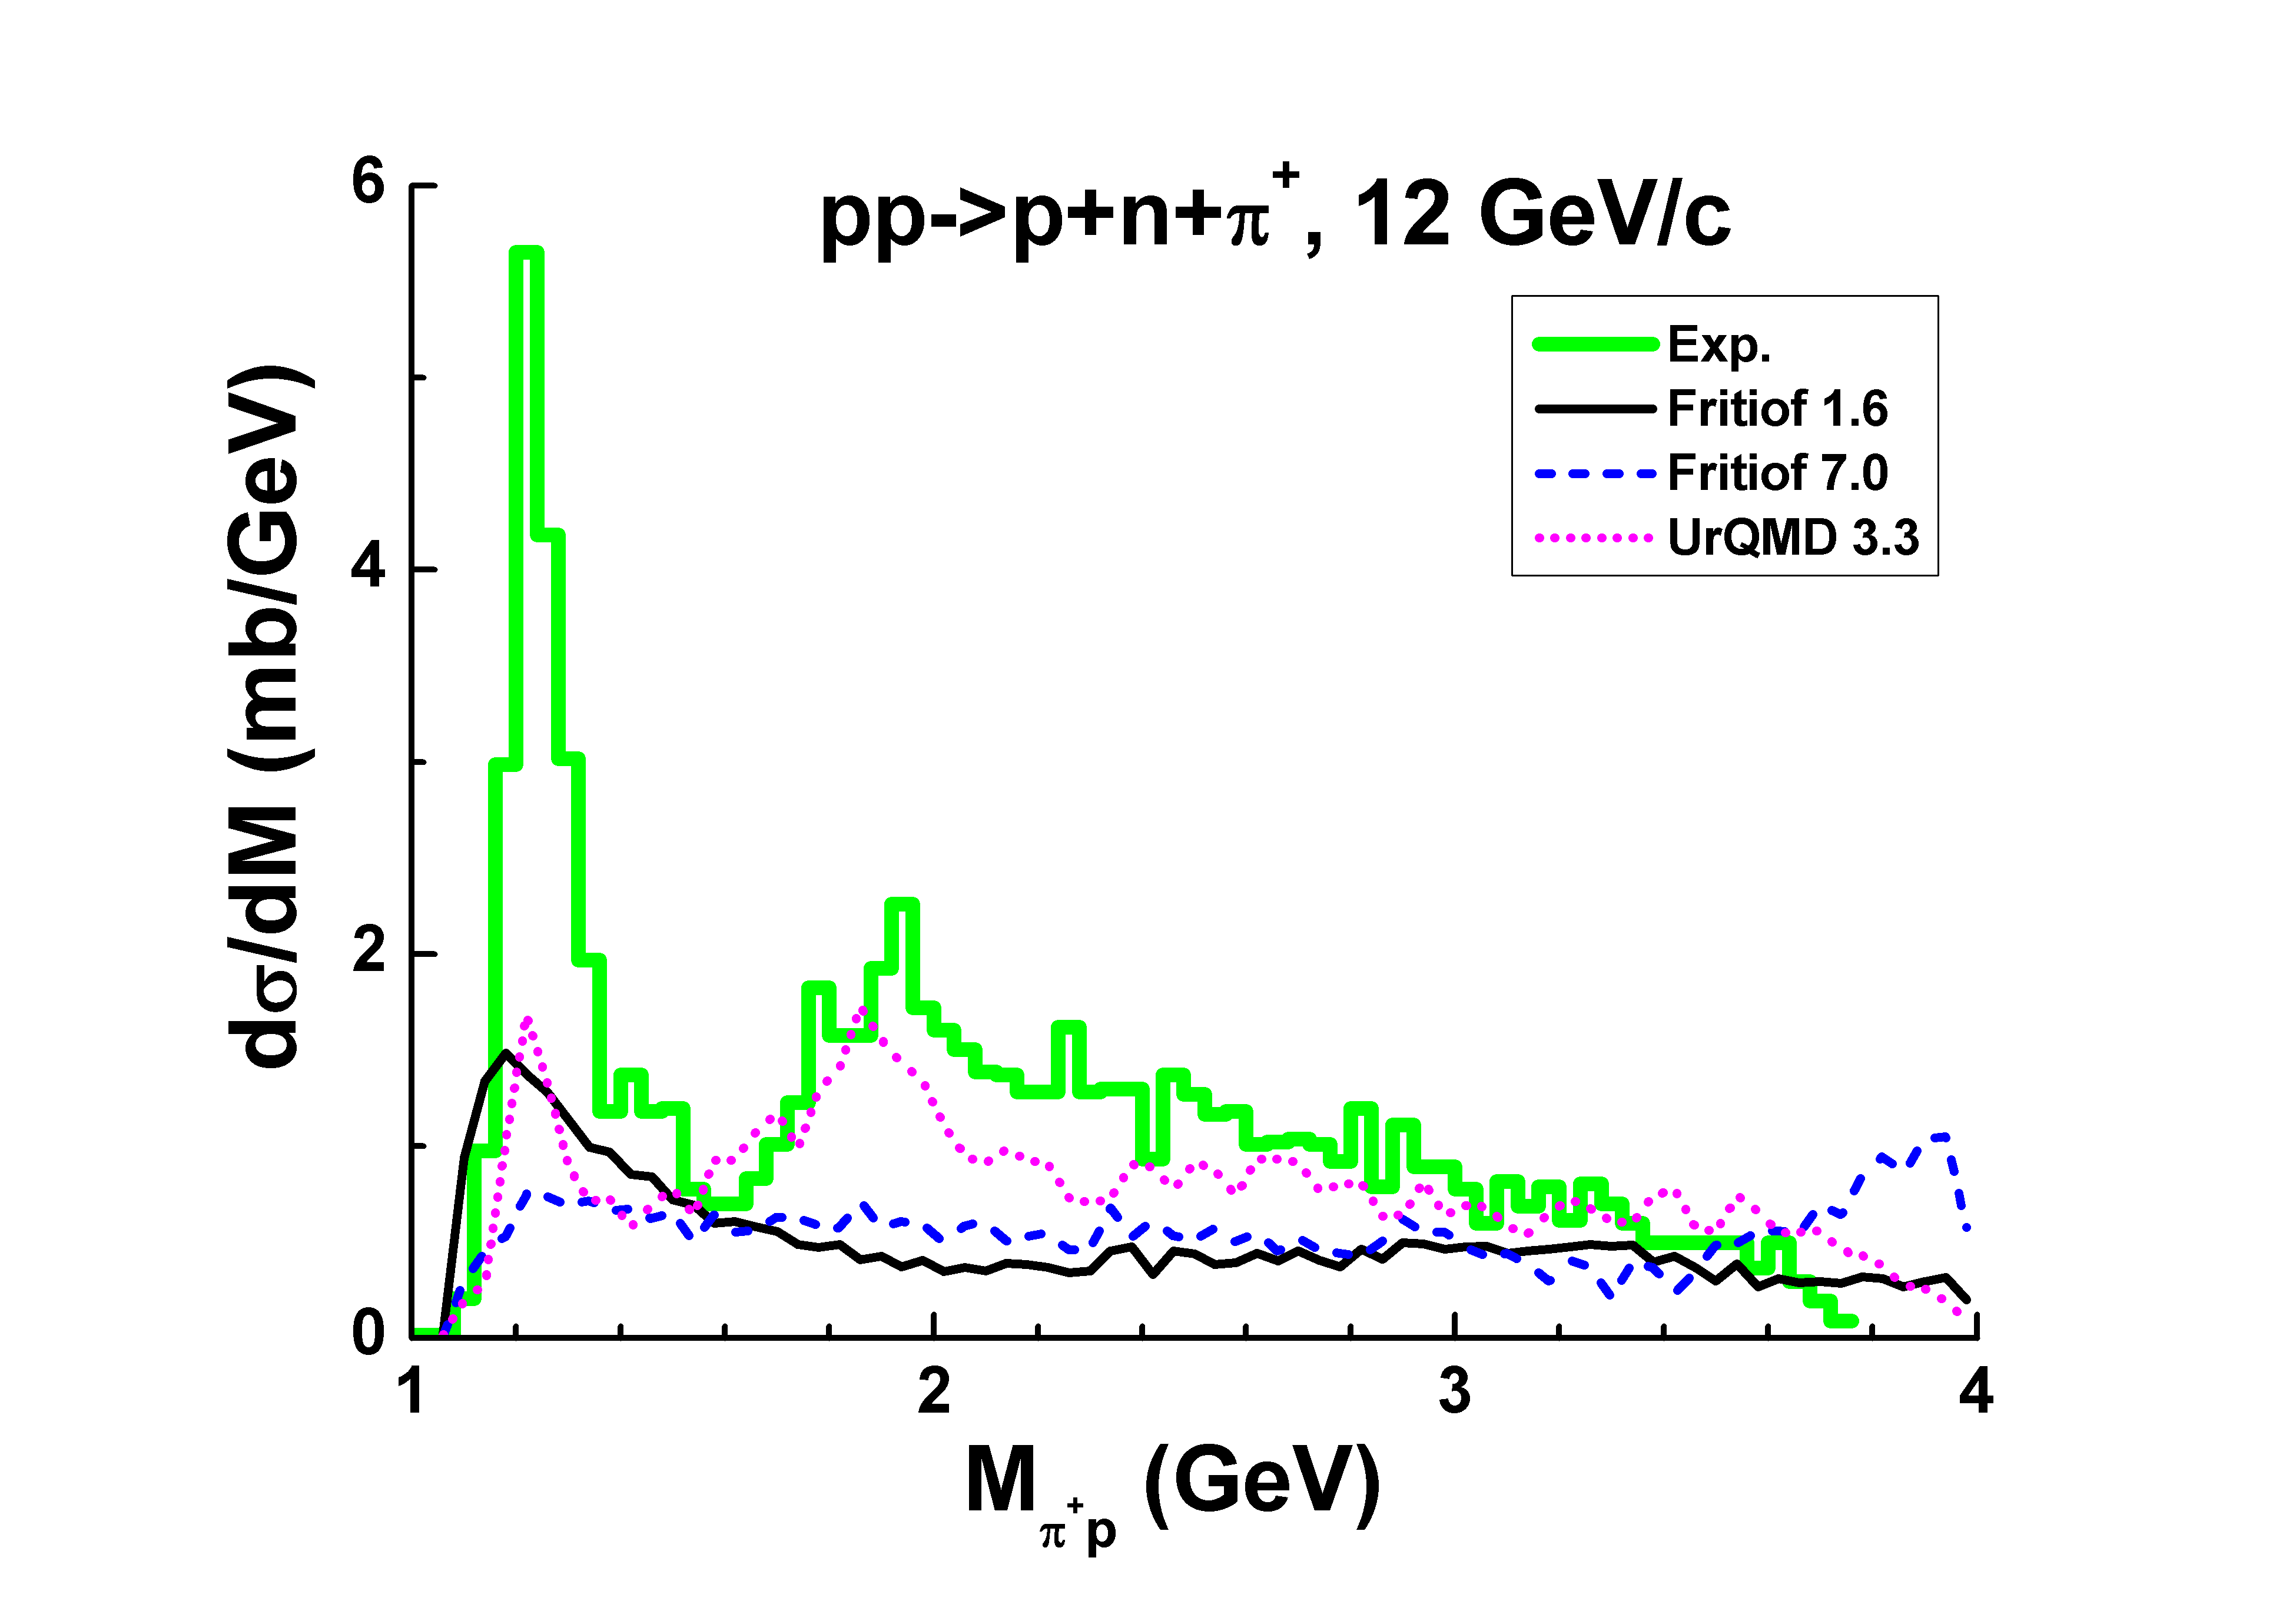
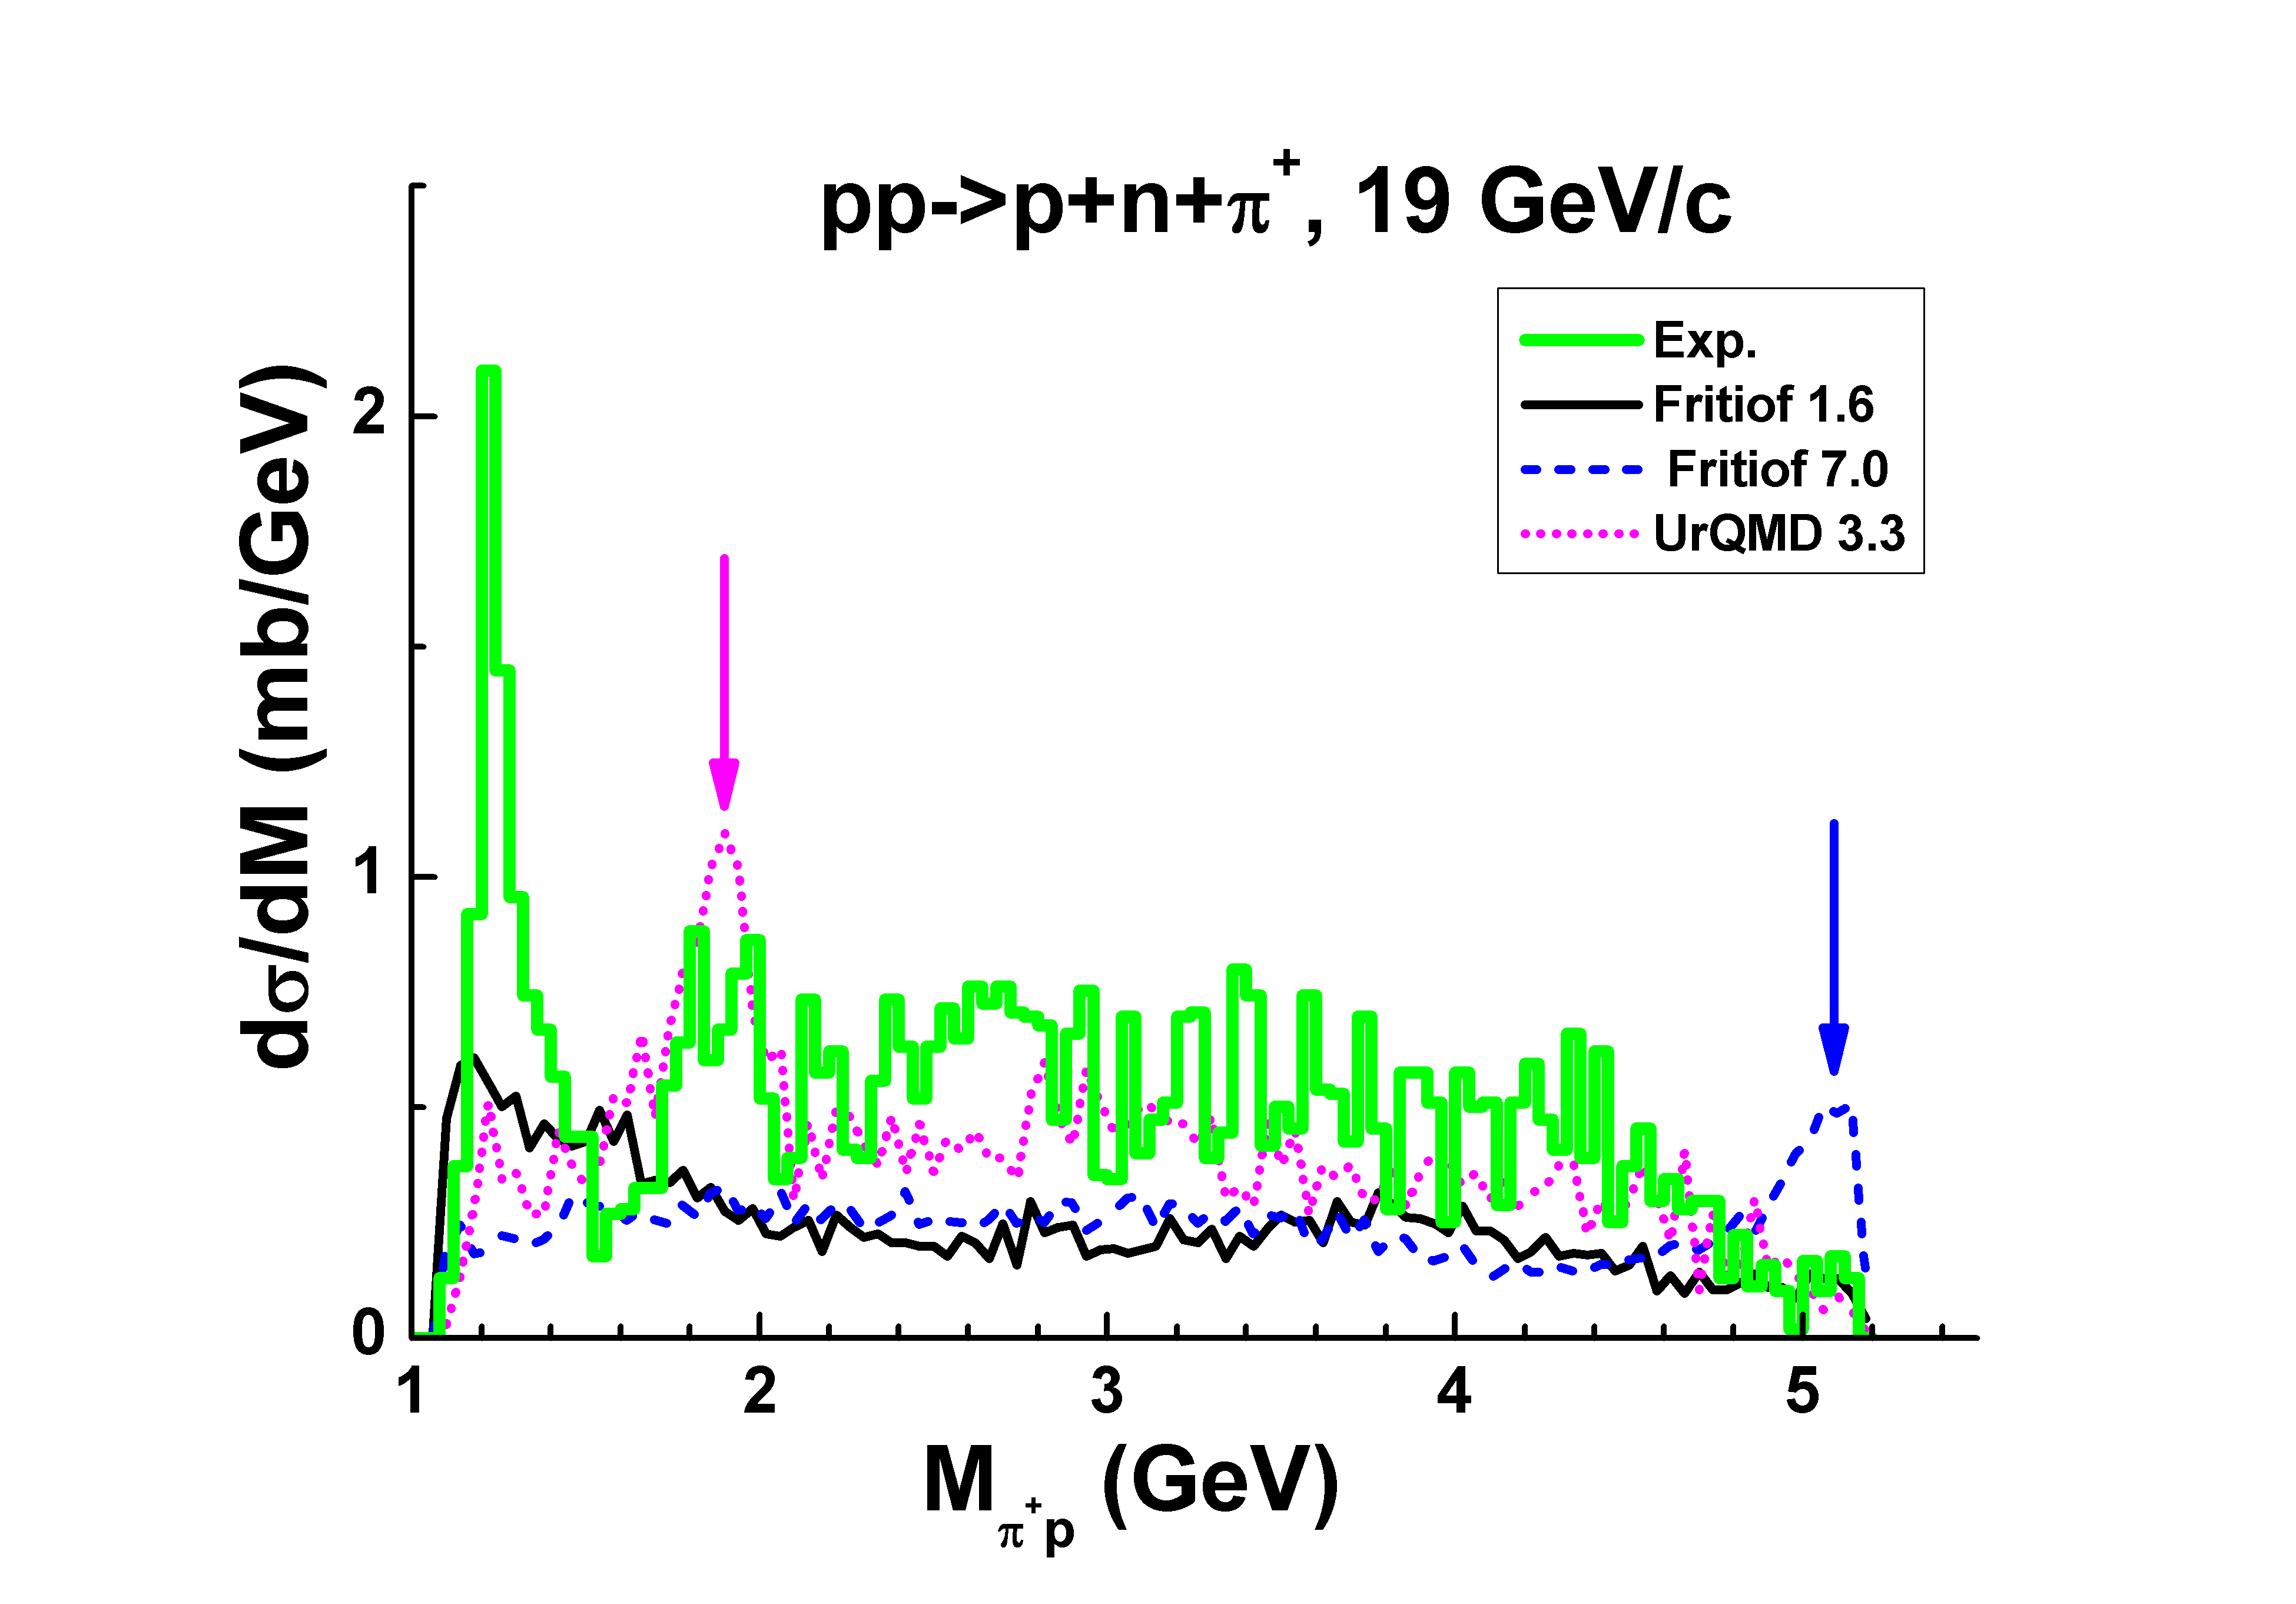
Another situation takes place in the Fritiof 7.0. Final states of diffraction dissociations in the implementation typically are . The LUND string fragmentation algorithm interprets them as systems if their masses are sufficiently small. Thus the corresponding peak is observed in calculated mass spectra (see Fig. 9). Due to this also, the form of the spectra are not agree with experimental ones at GeV.
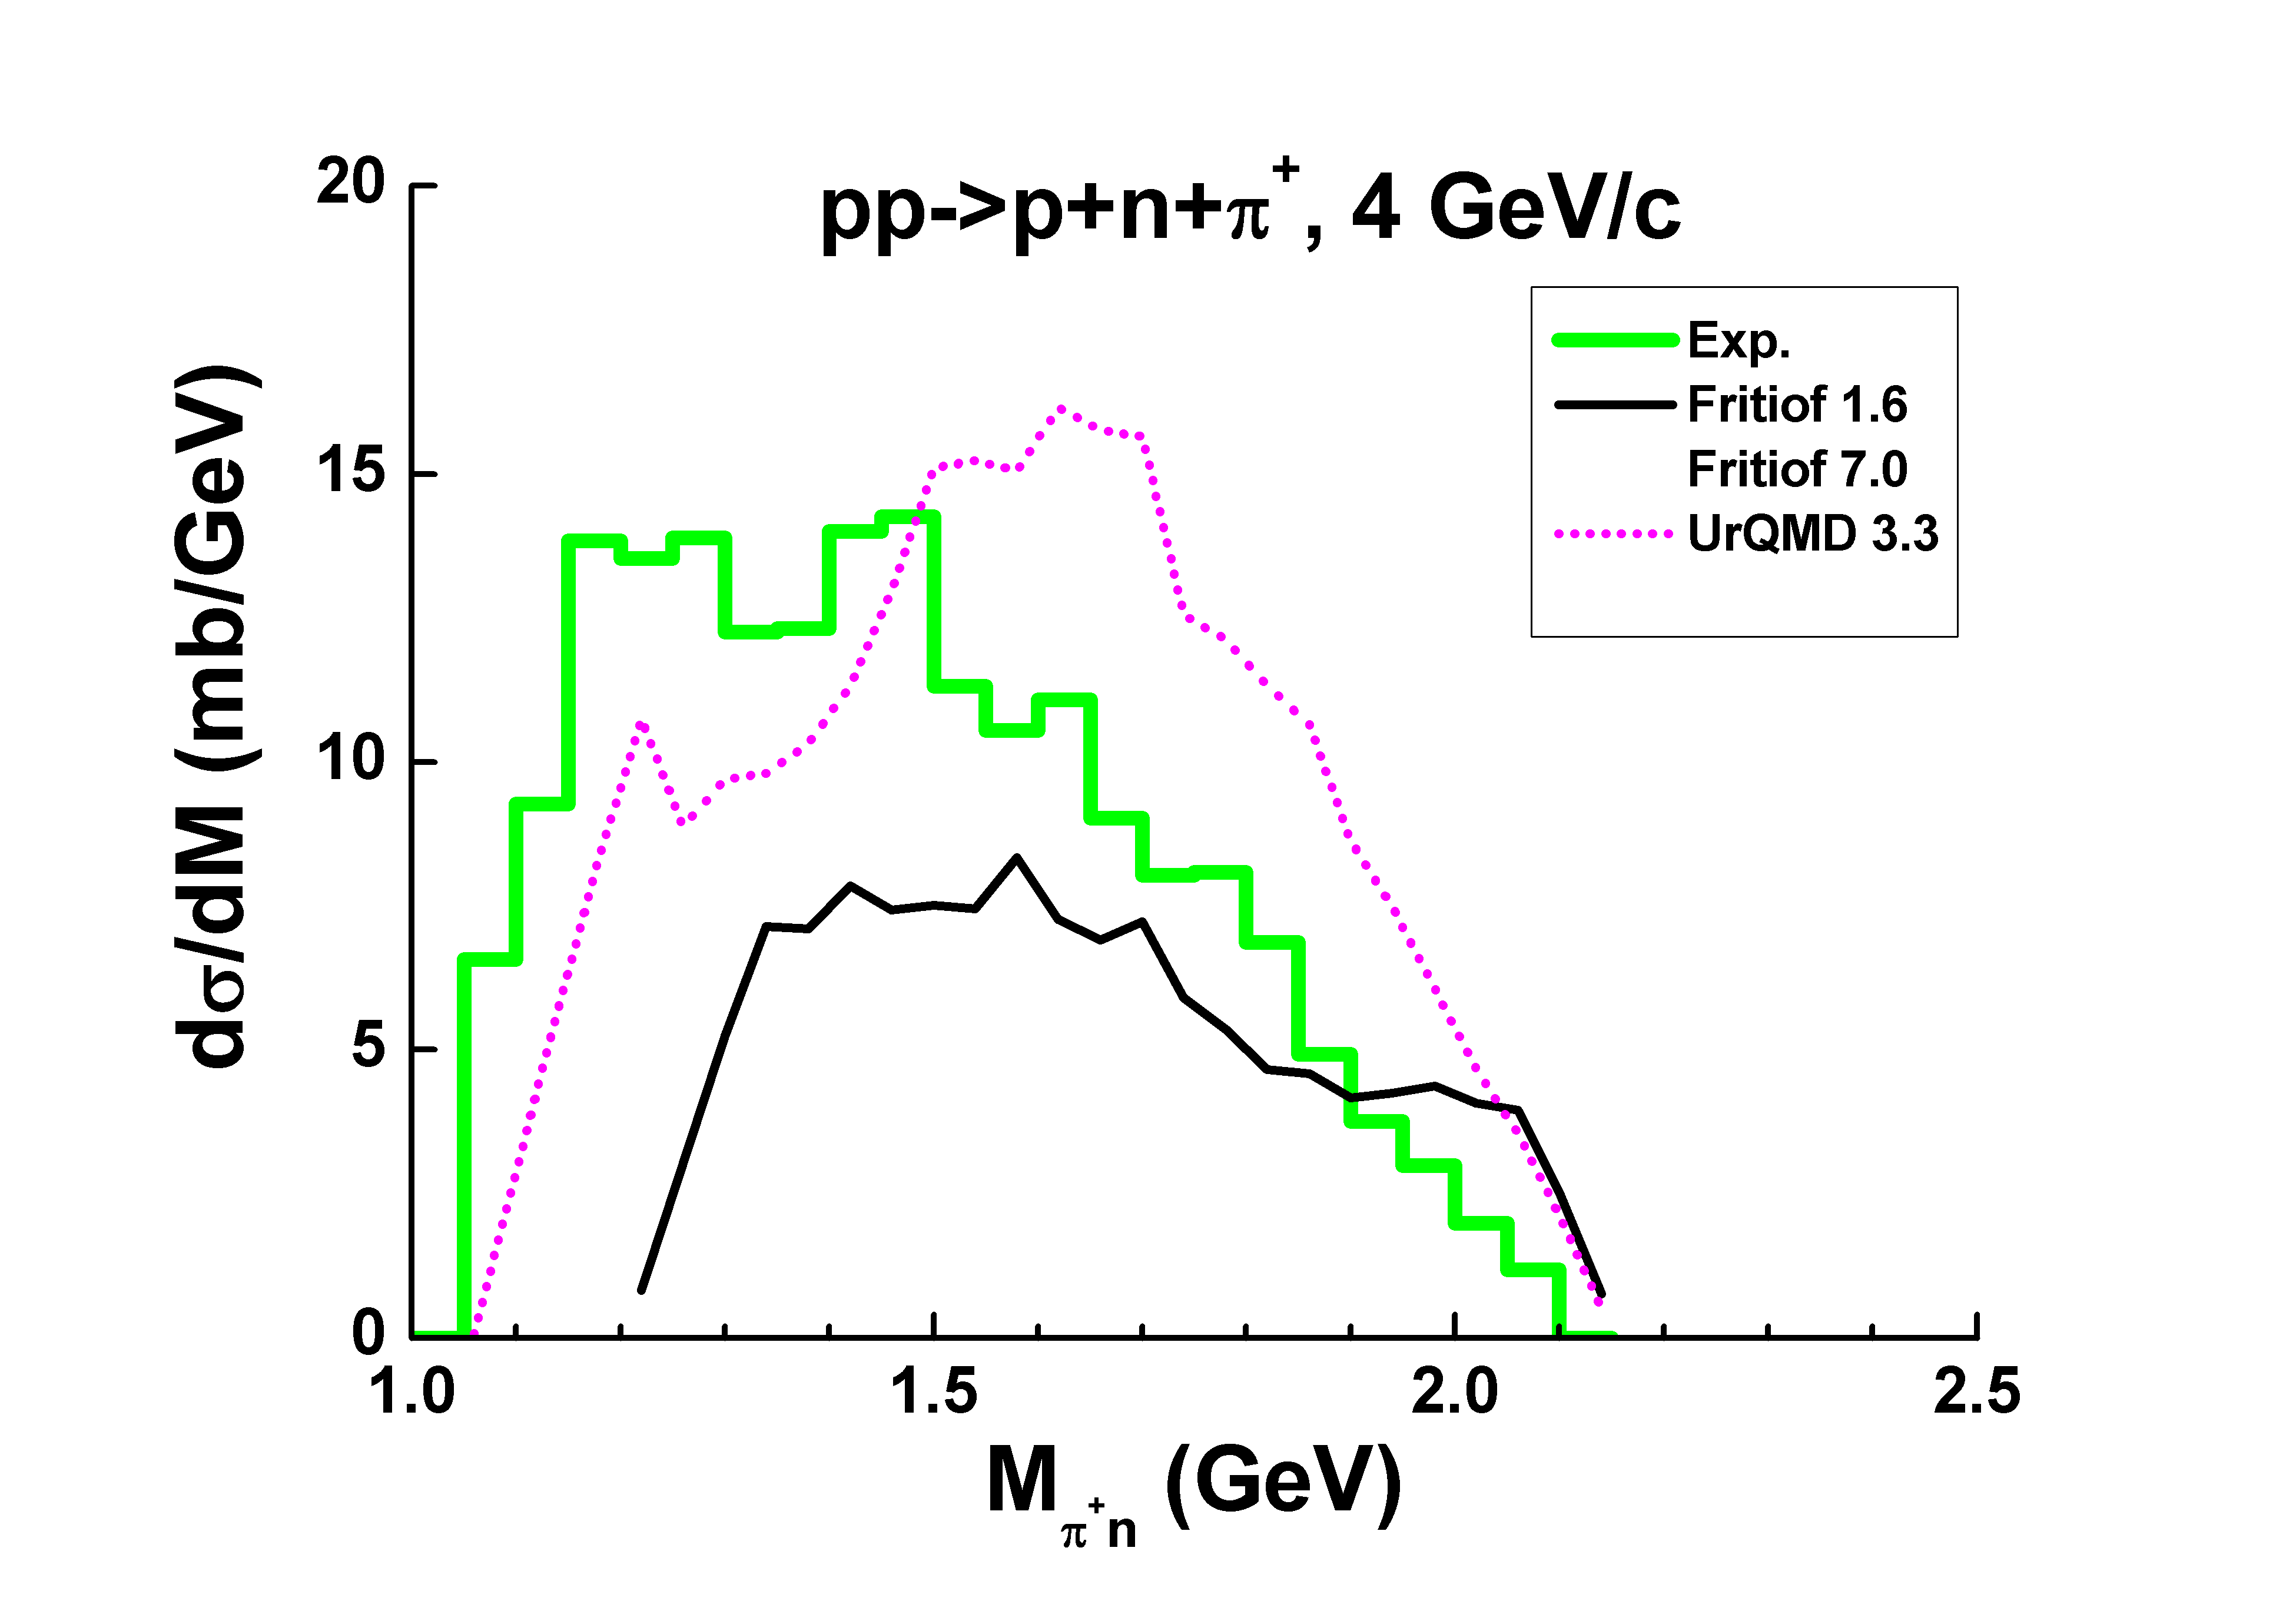
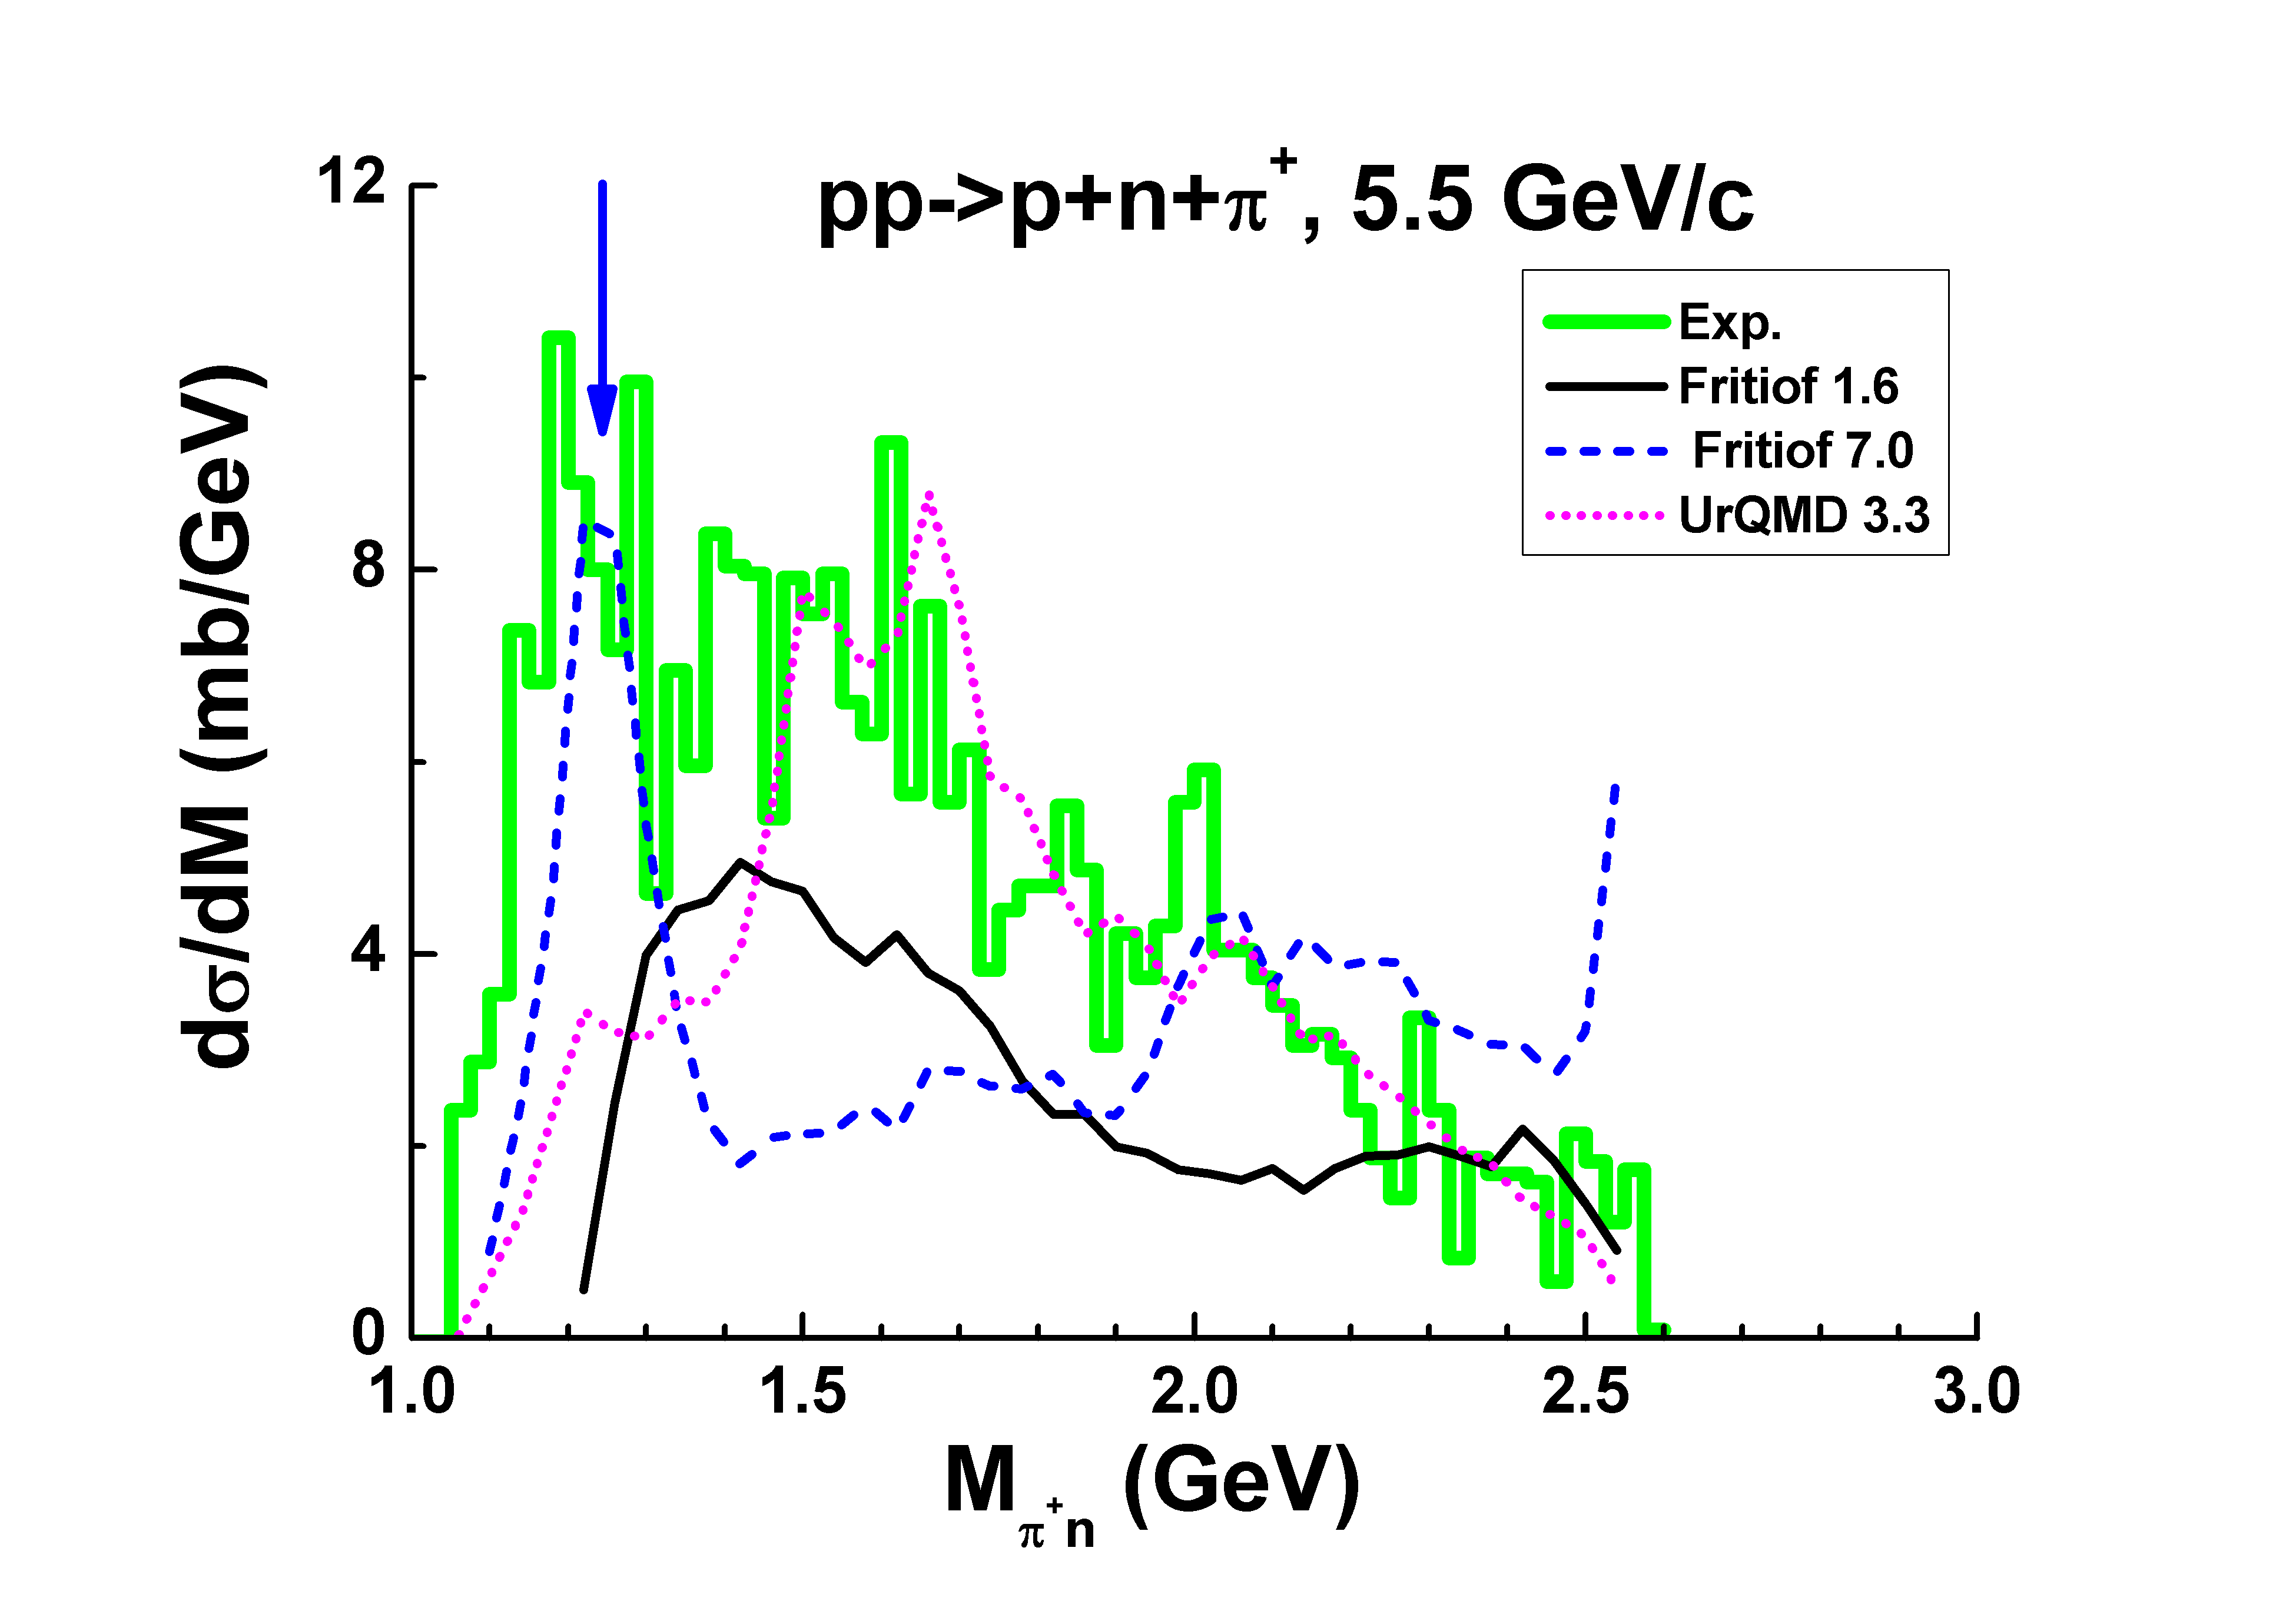
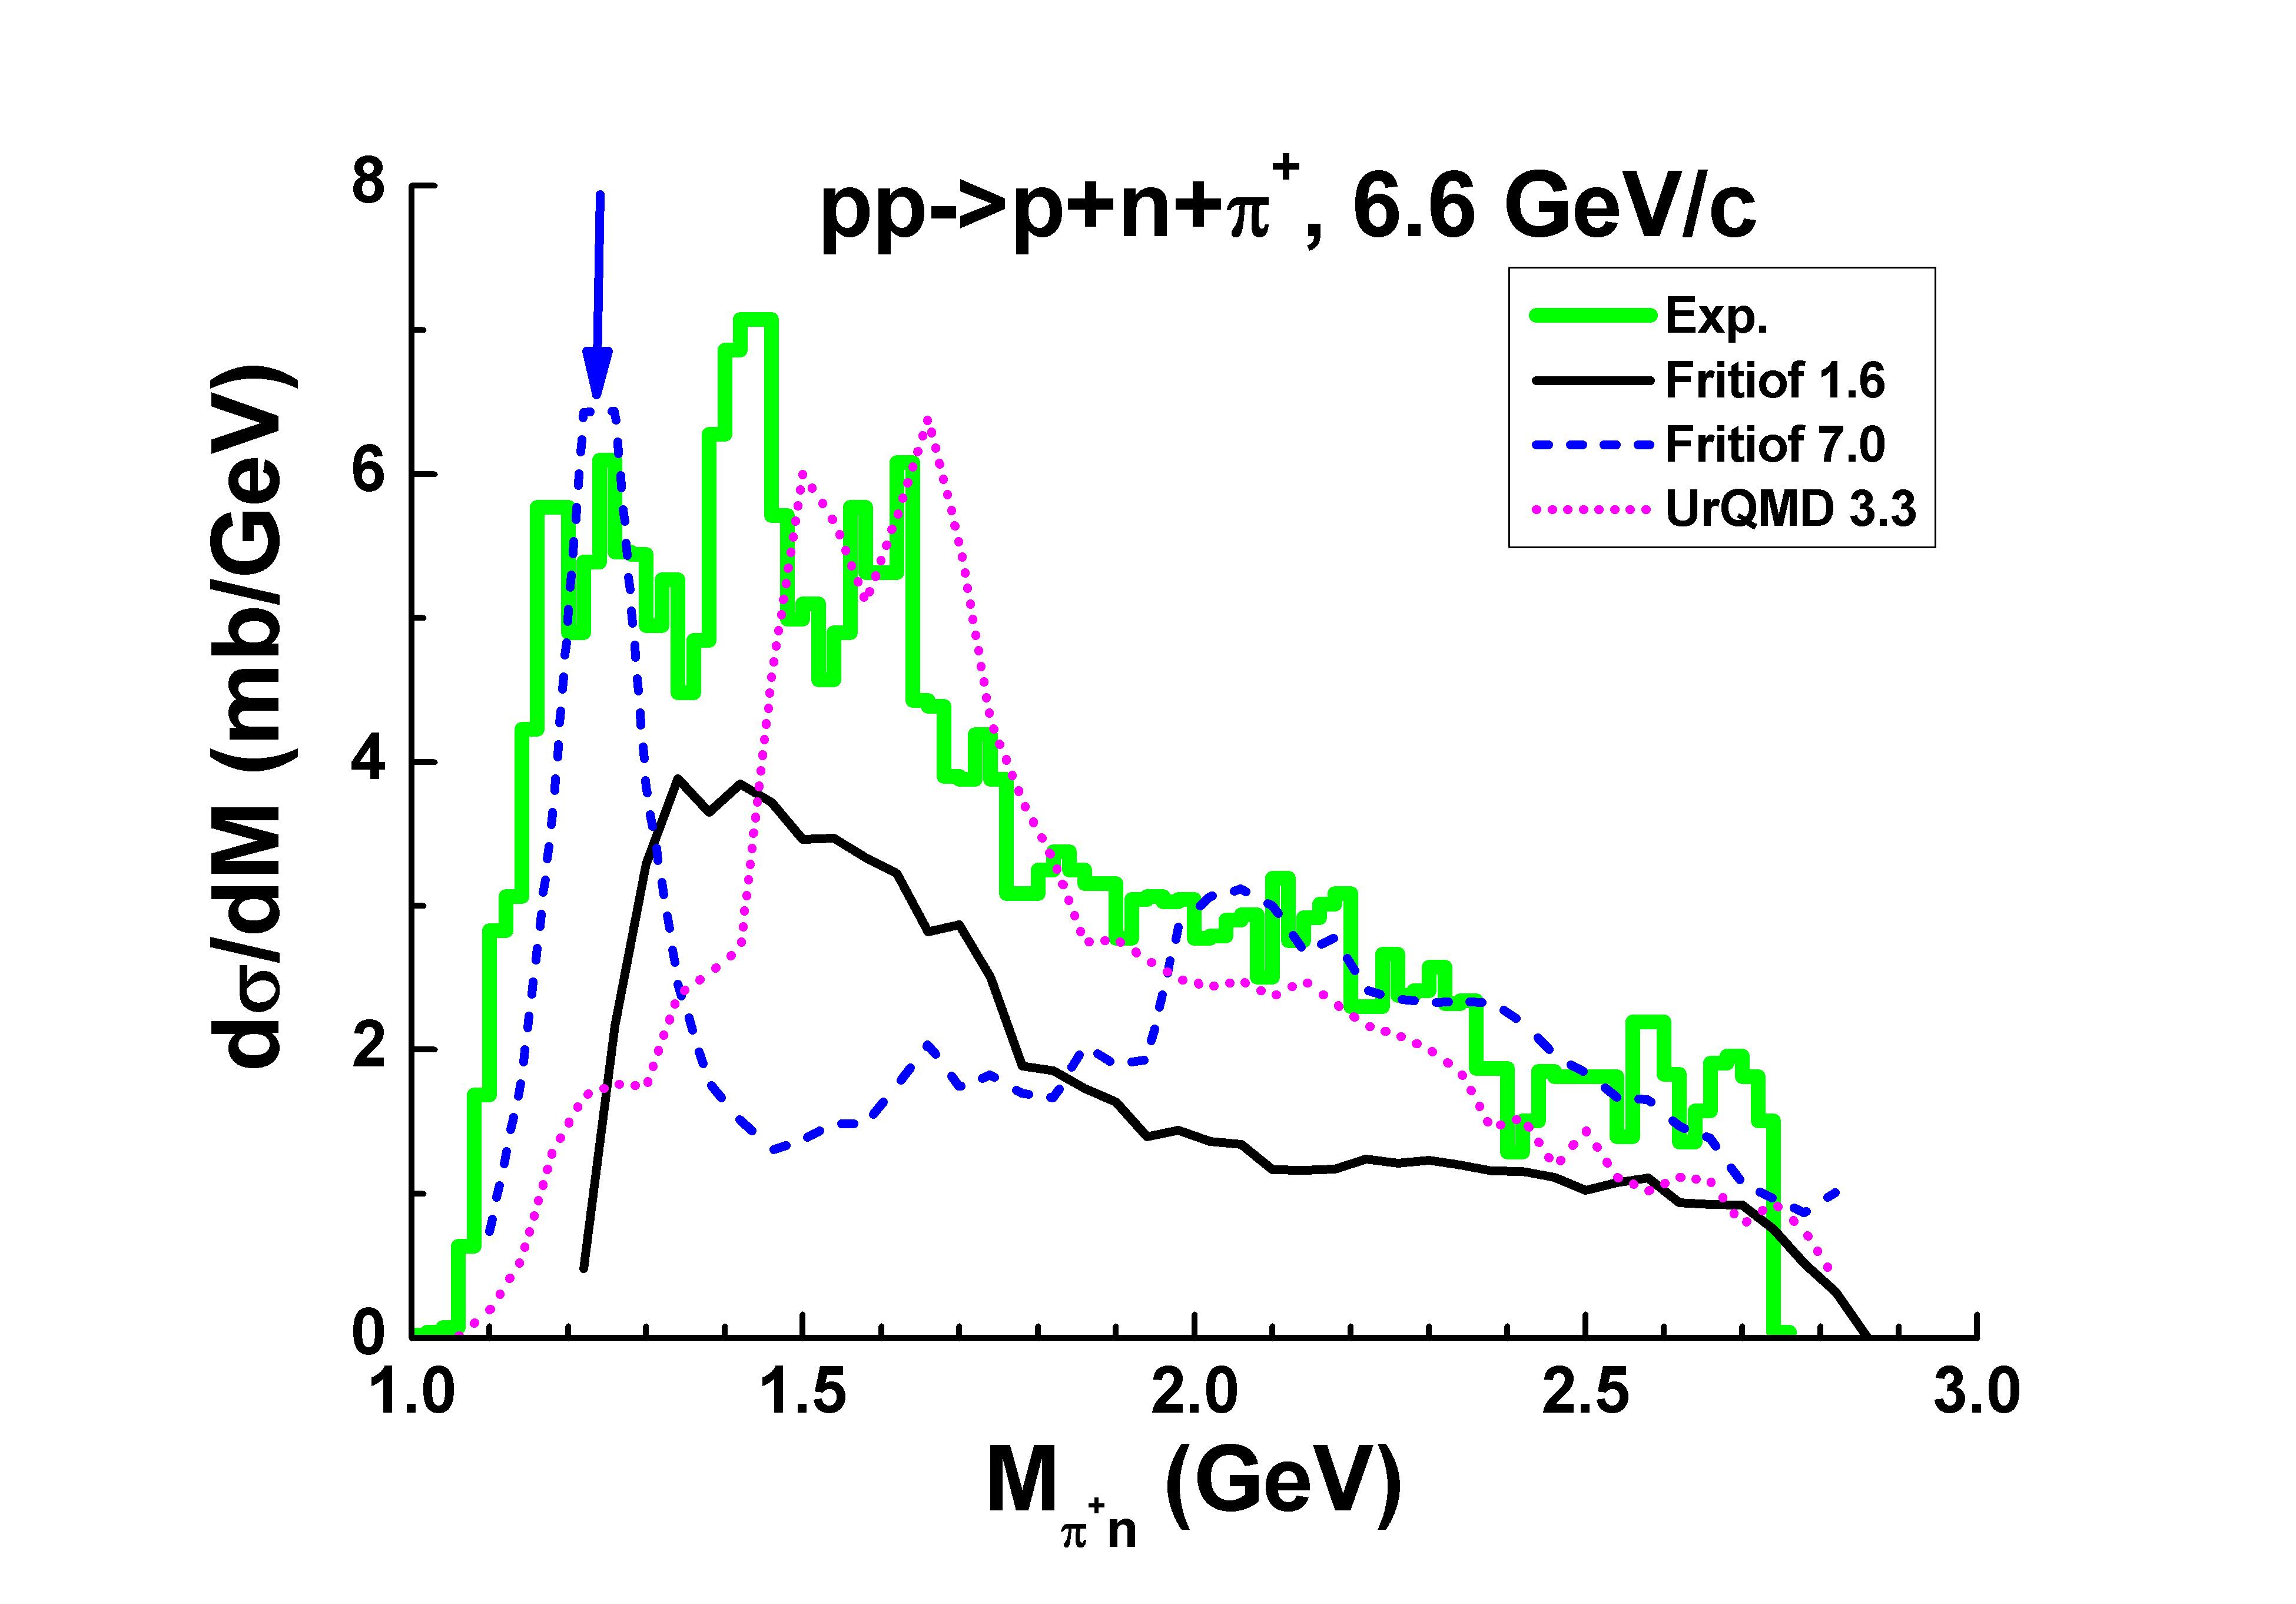
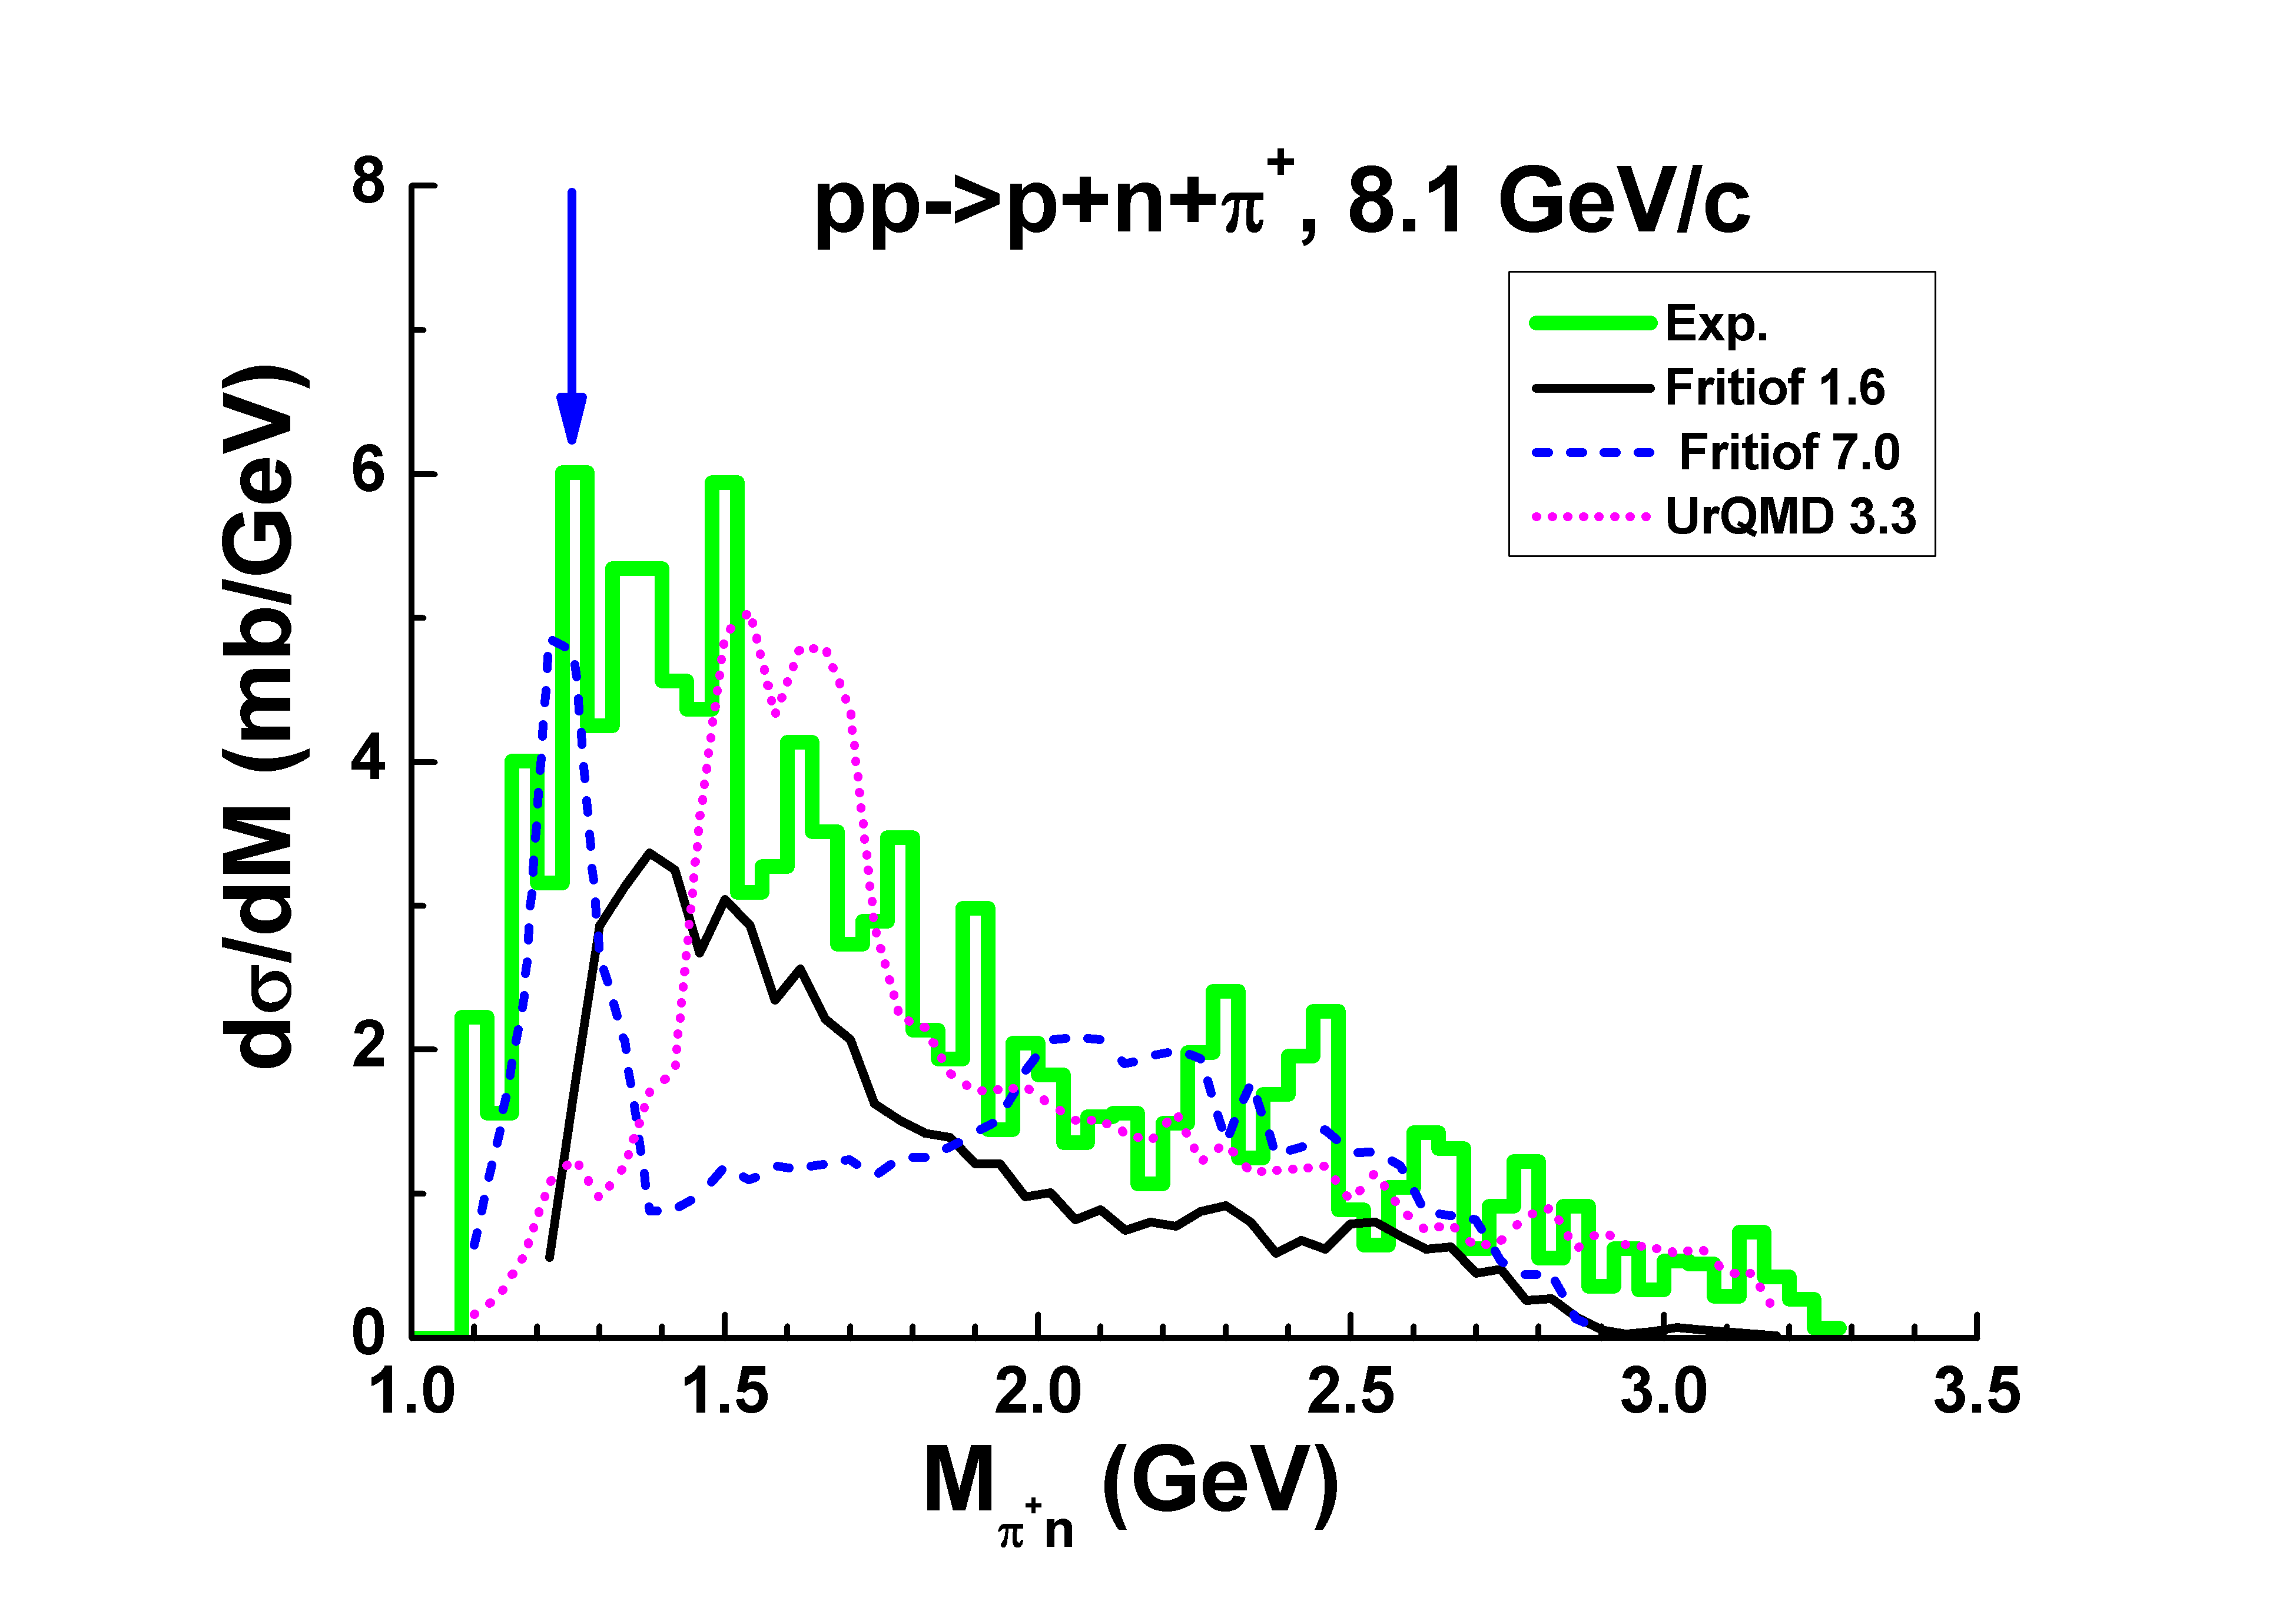
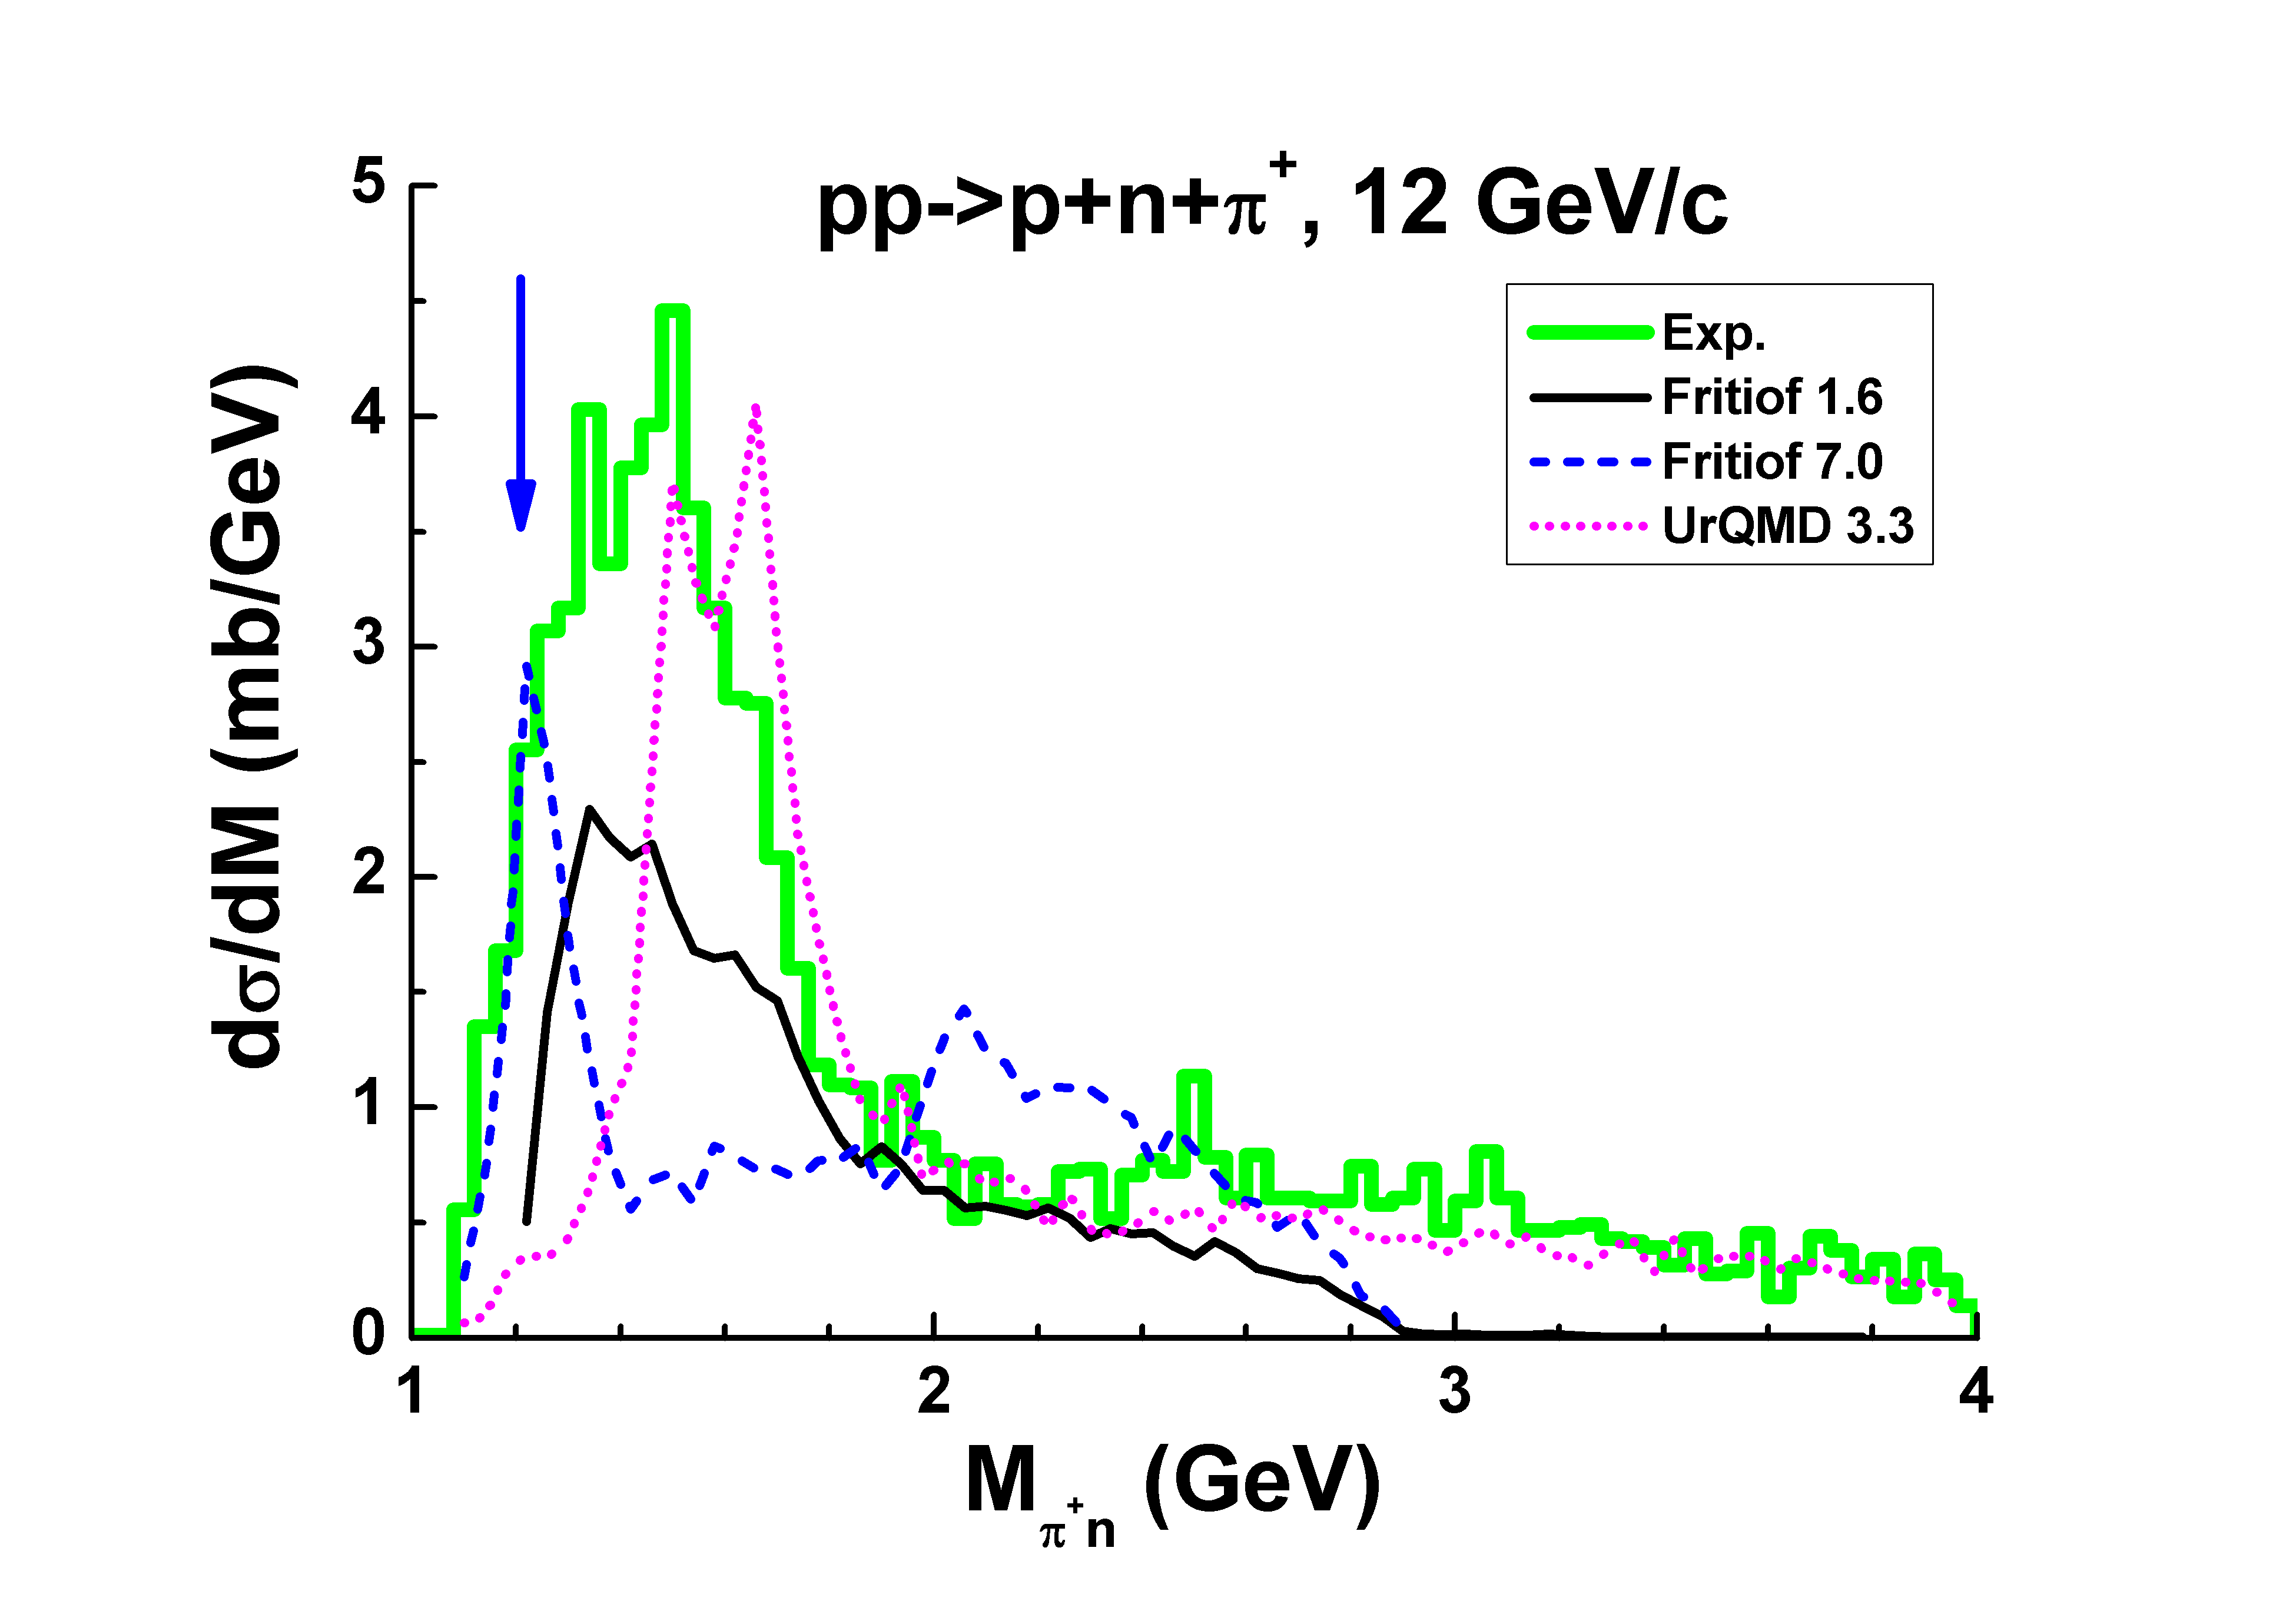
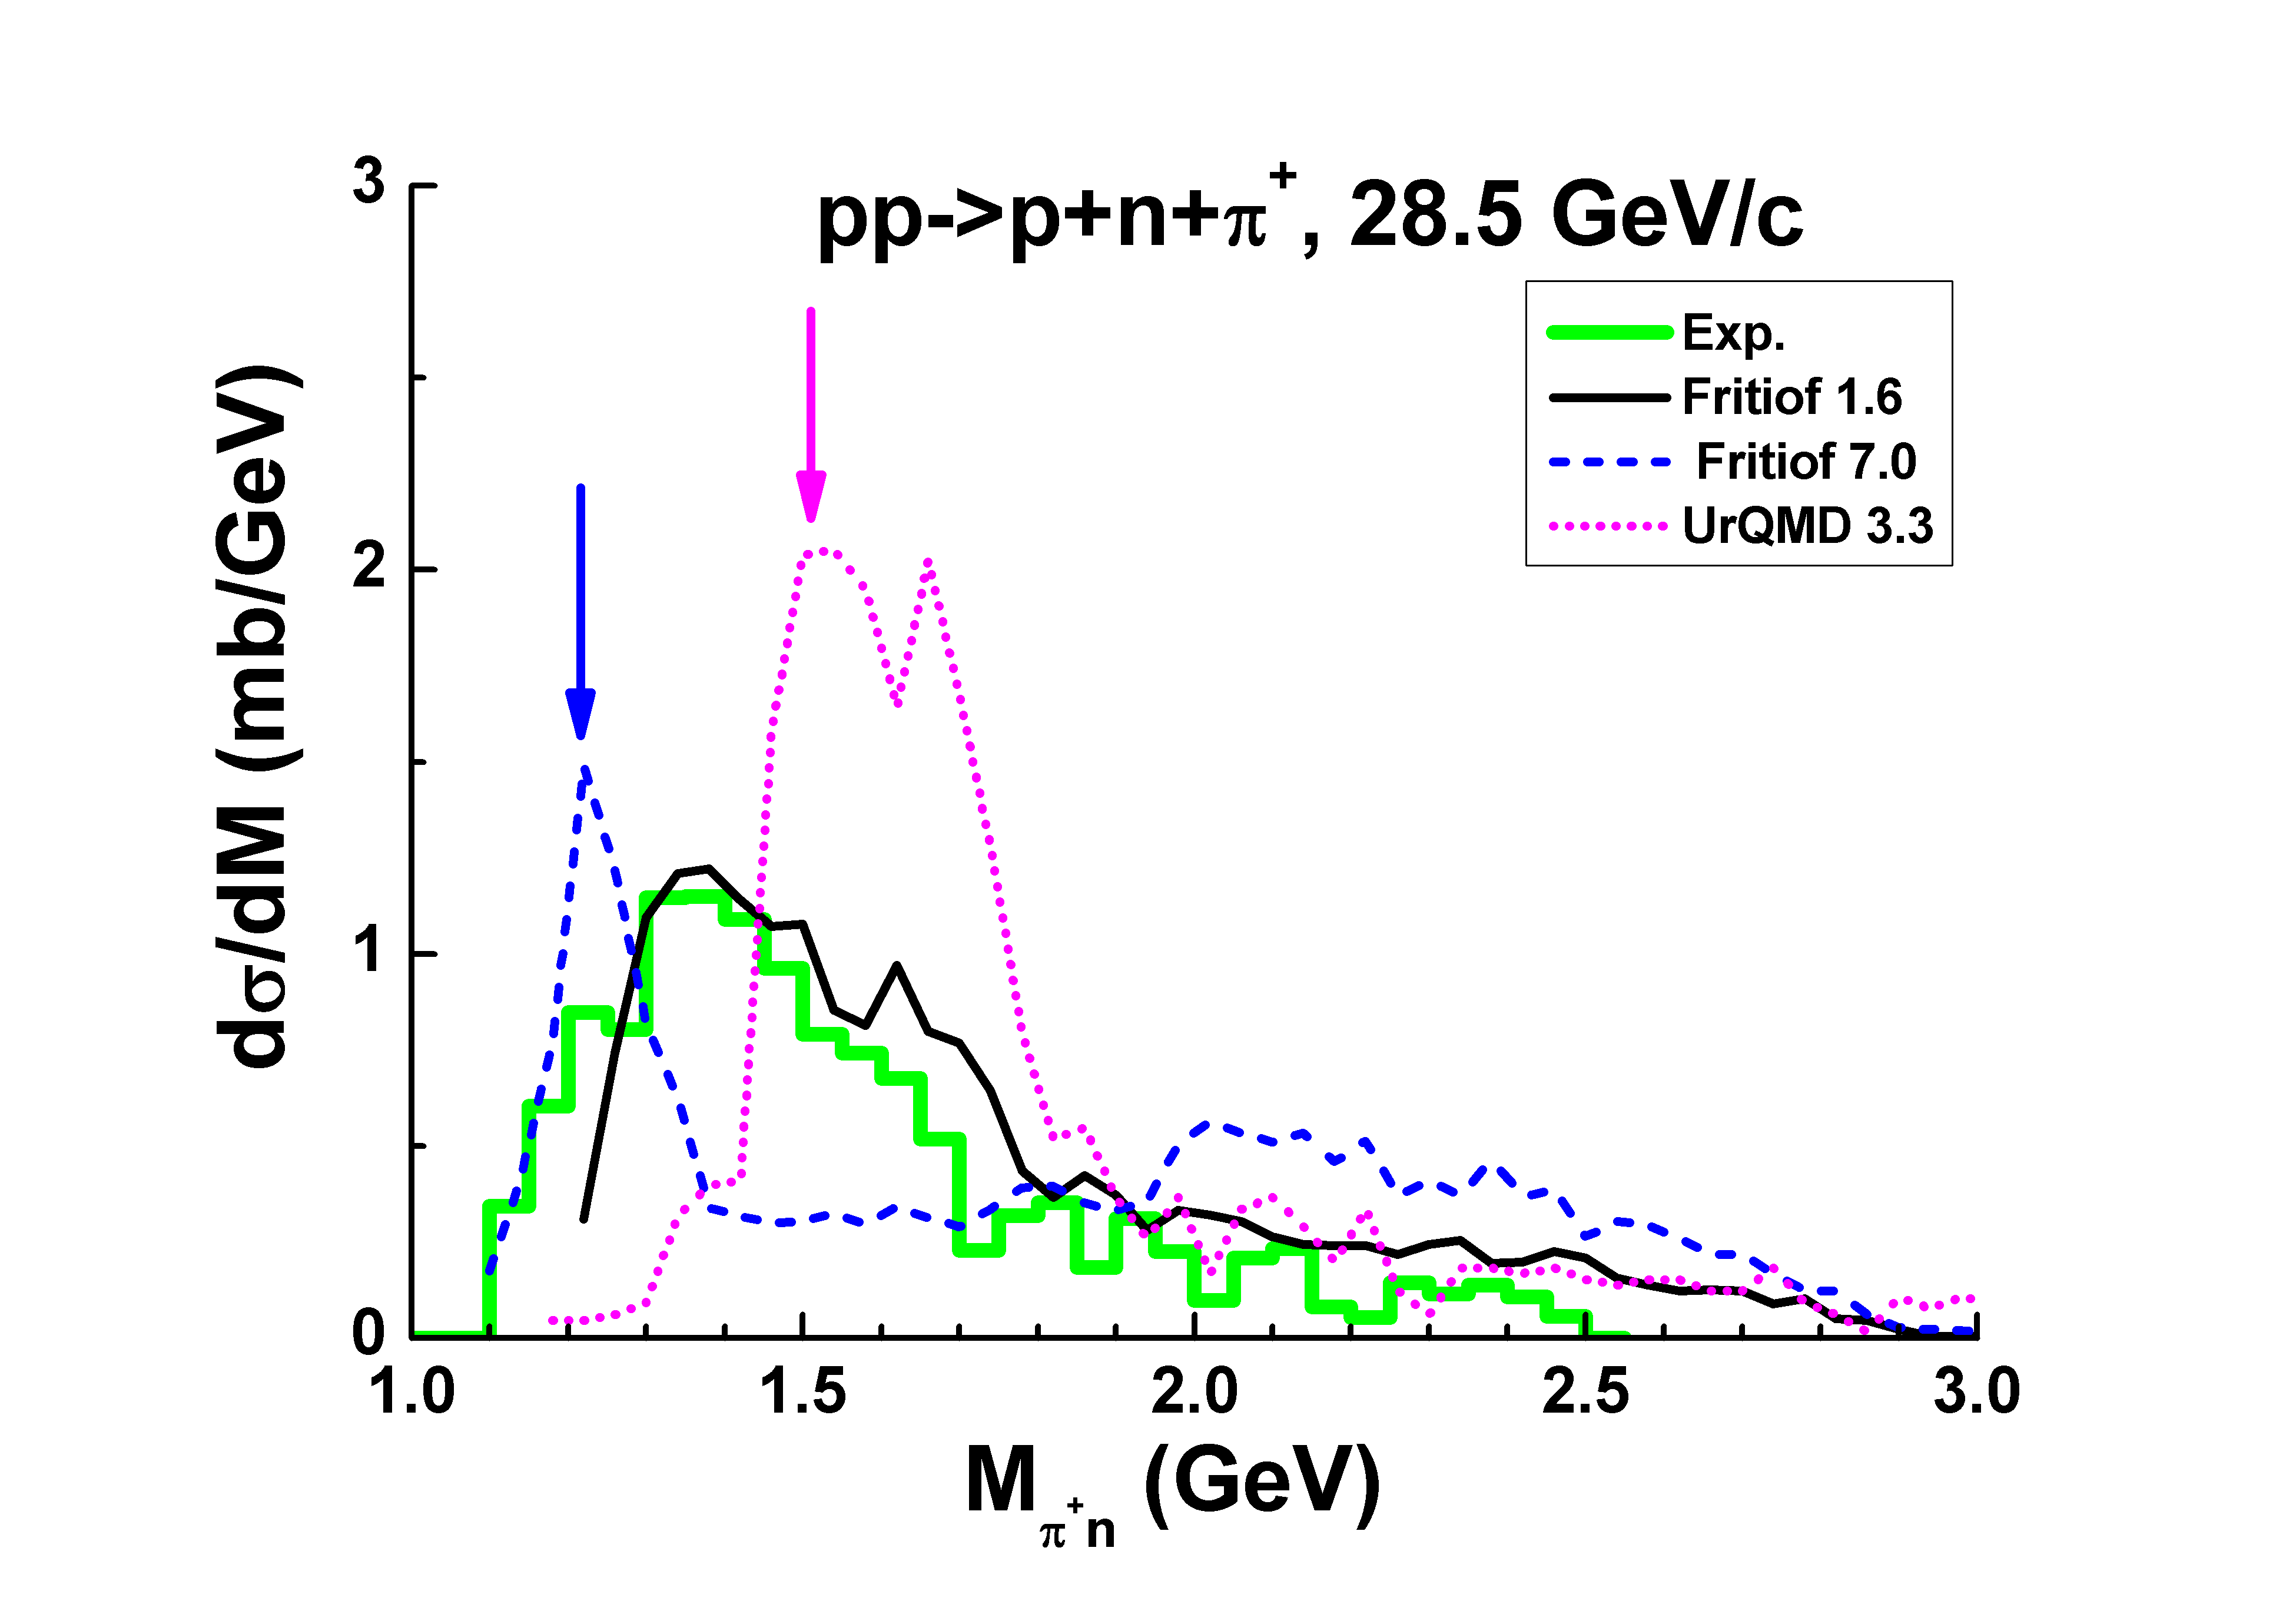
According to the UrQMD model, processes with a creation of or isobars are not dominating in the reactions. Instead, isobars with masses 1520 – 1700 MeV are copiously produced especially at high energies in a disagreement with the experimental data, see Fig. 9. Usually, a kinematical peak is seen in experimental high energy data at 1400 MeV. It is not reproduced in the models. Resonances, especially the Roper resonance, are not responsible for the structure of the peak in the low mass region. There were a lot of papers devoted to its description. Mainly they were done within the One-Pion-Exchange model taken its origin from the well-known papers [33, 34]. Many interesting results were obtained in the model, and one can hope that they can be used in Monte Carlo event generators.
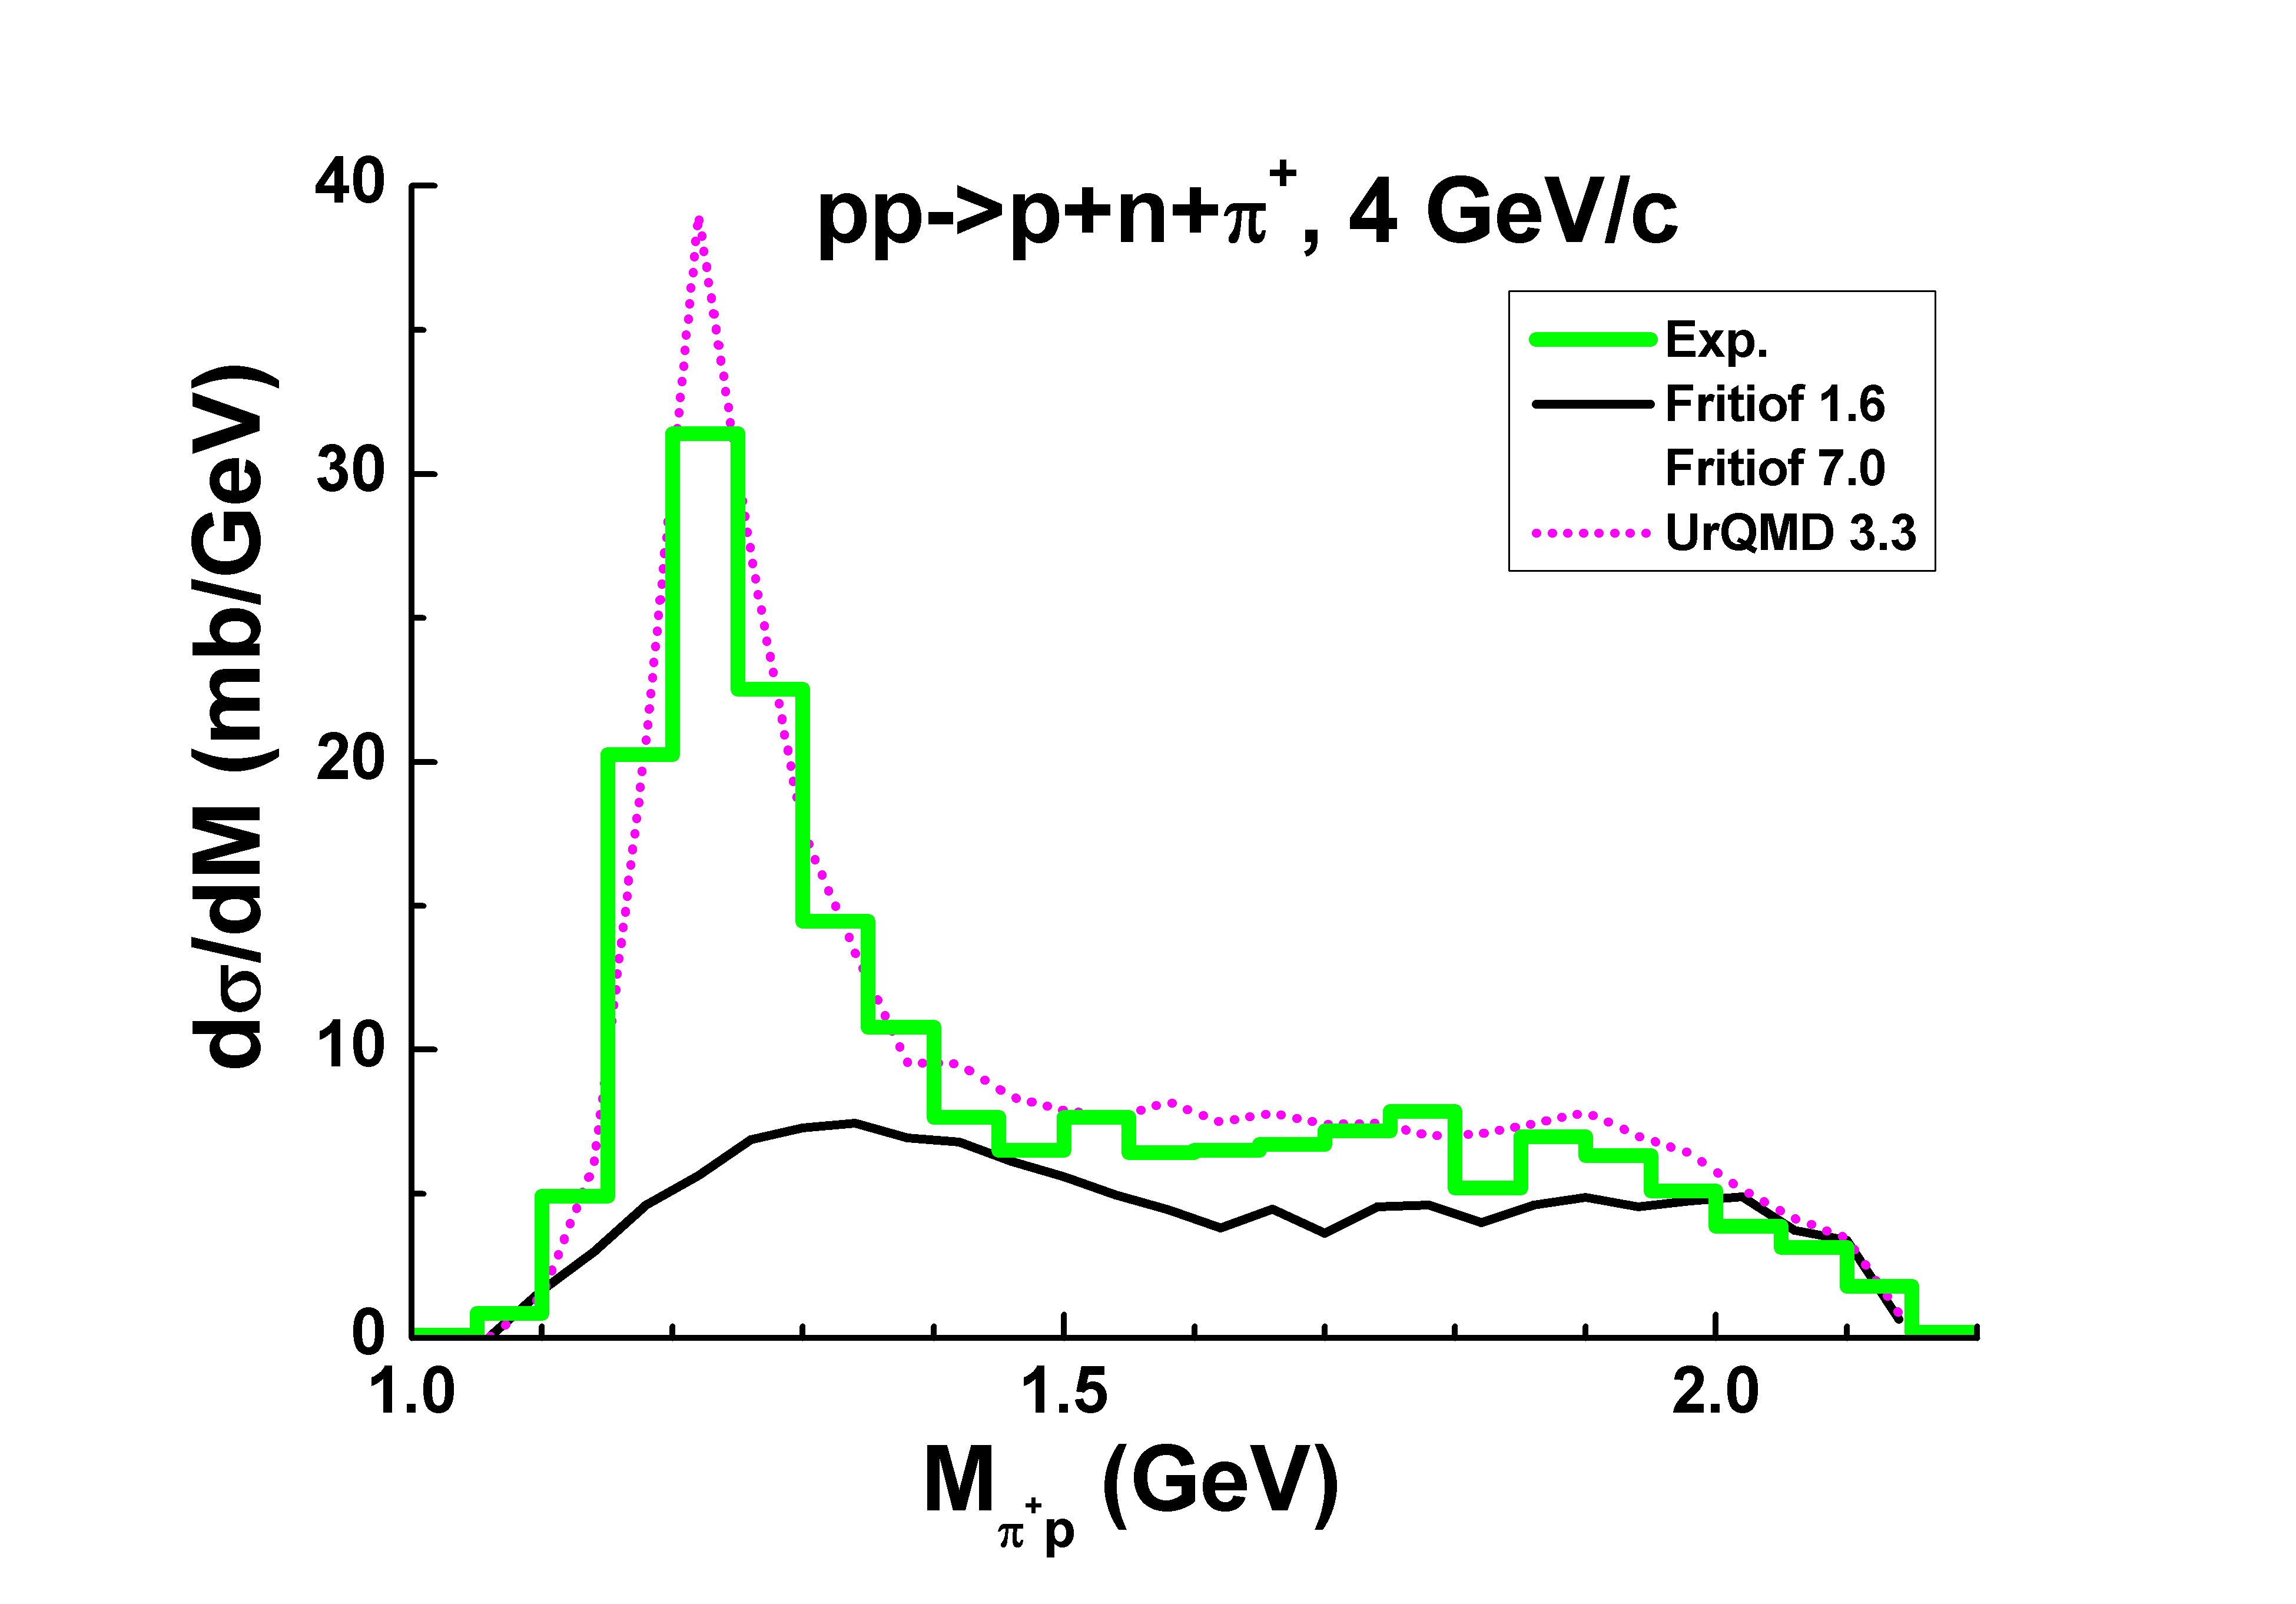
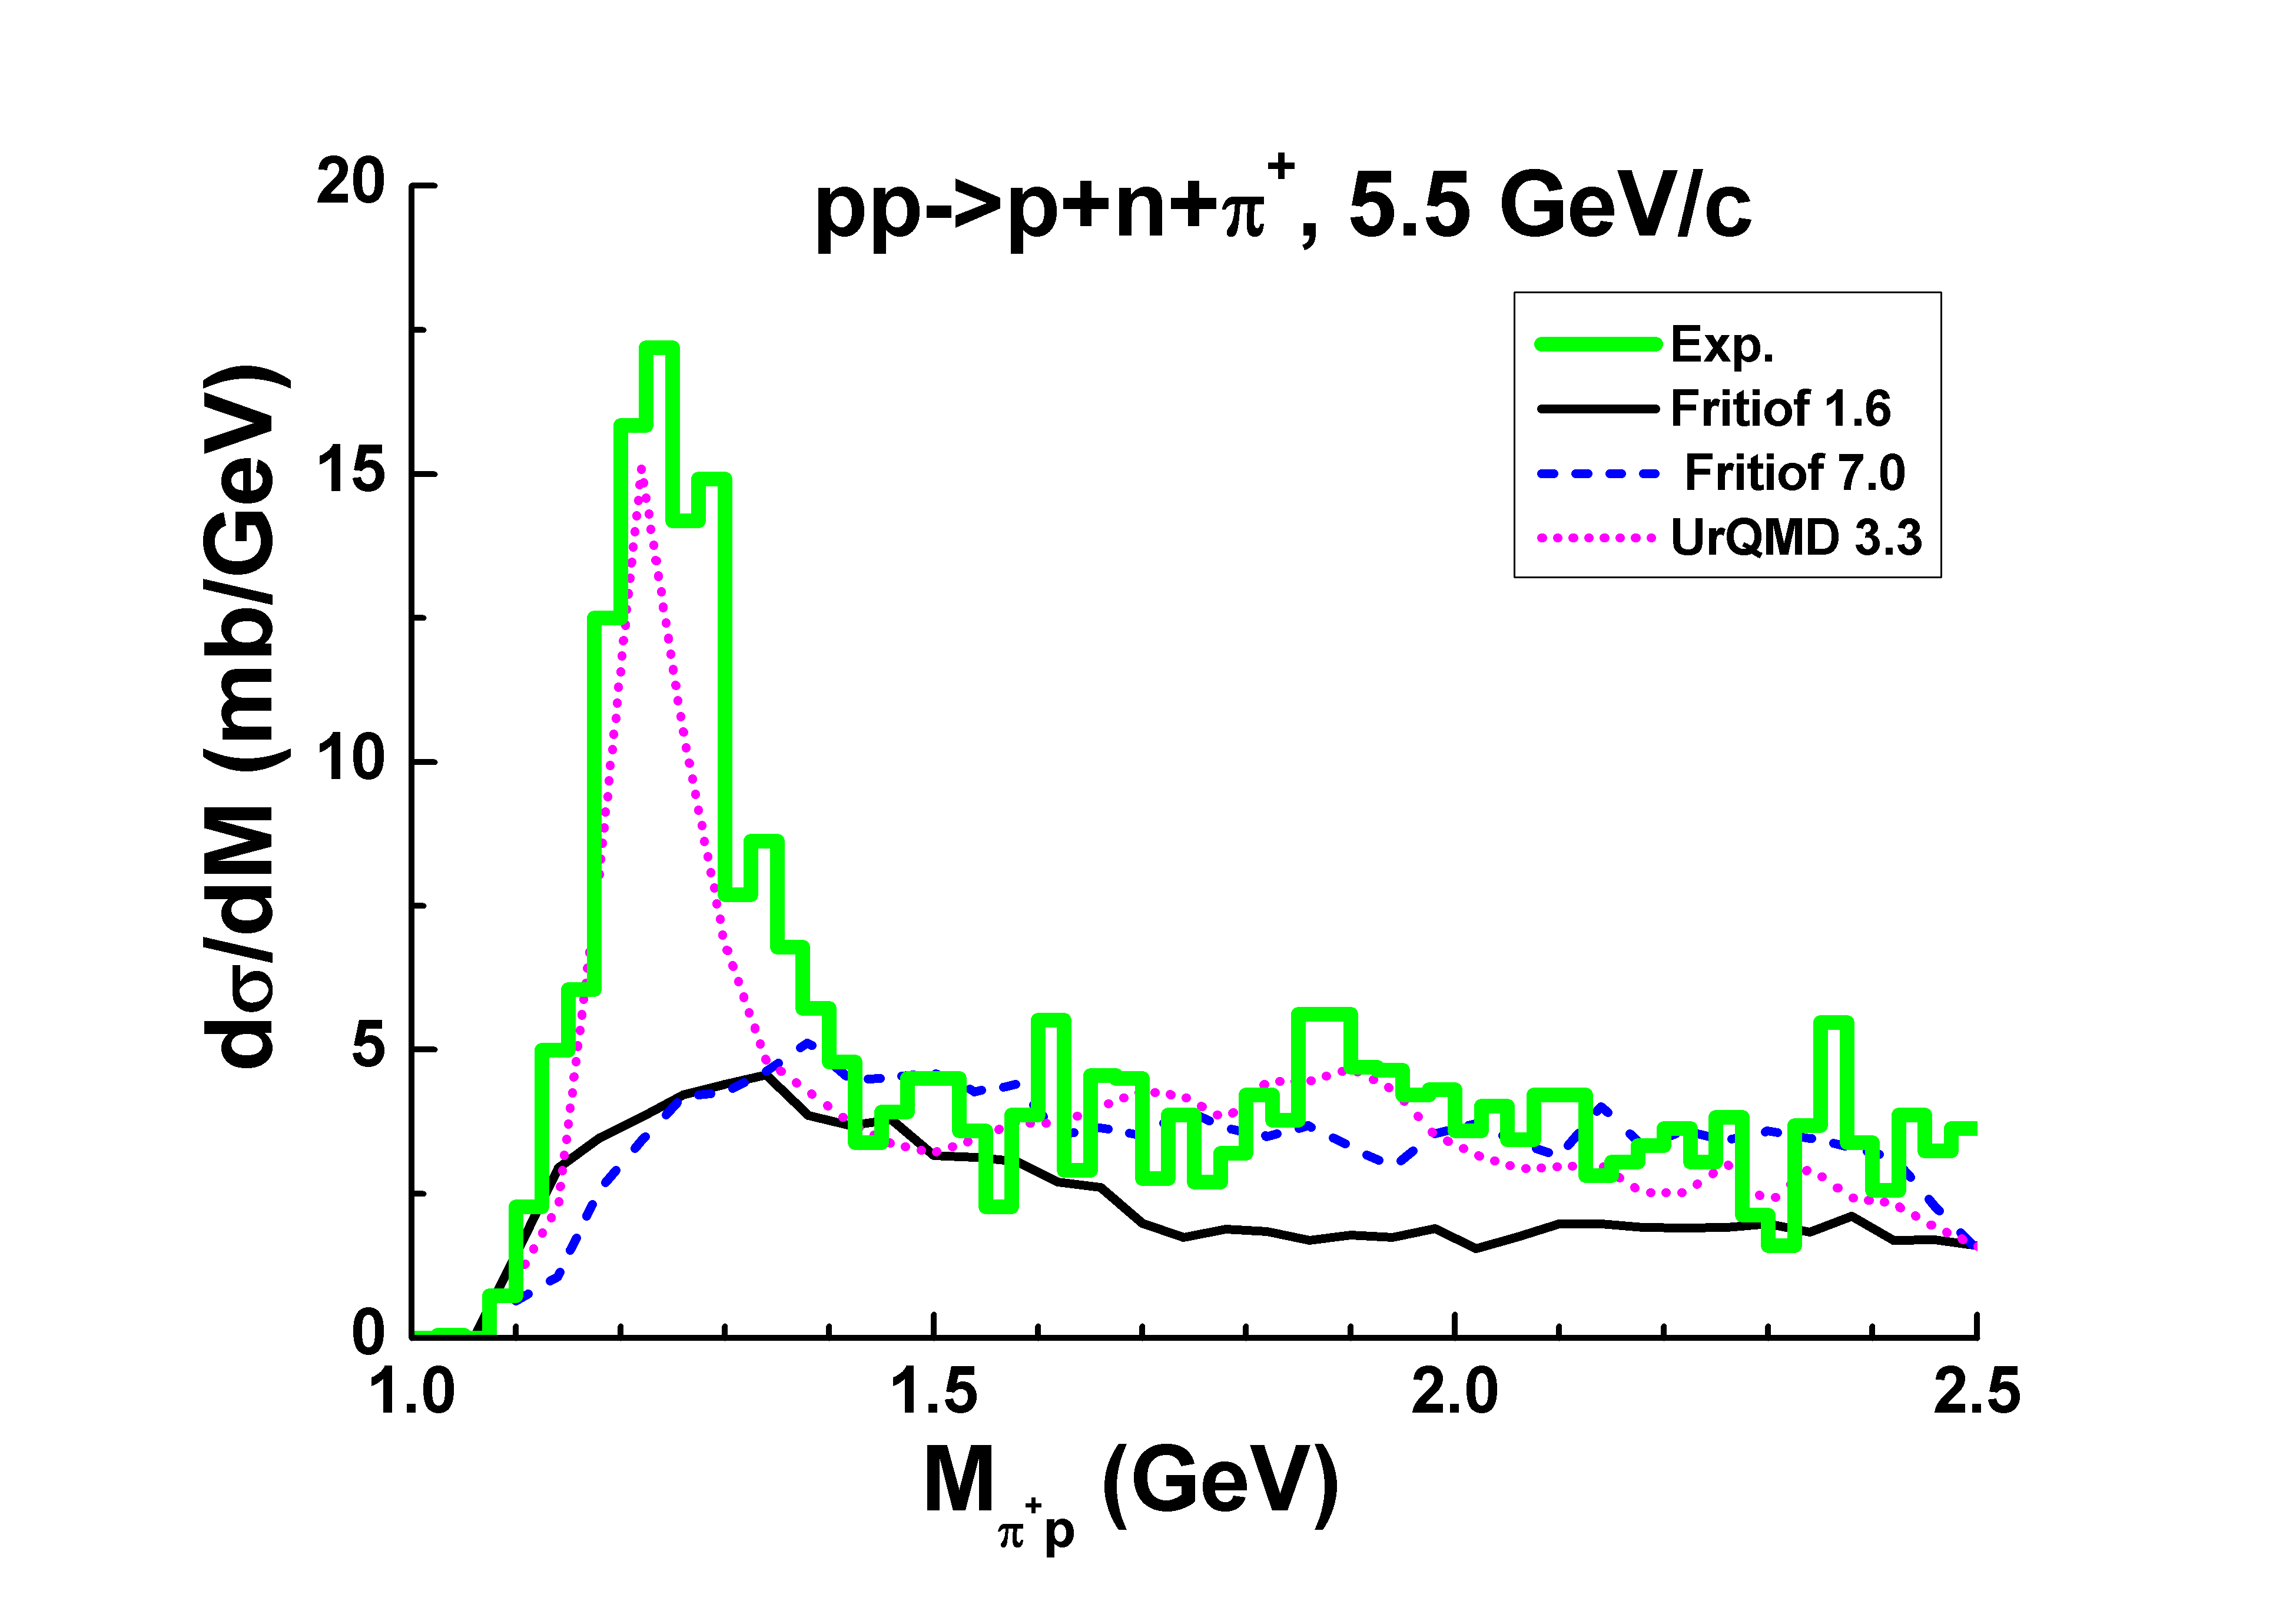
Mass distributions of pairs in the reactions give information about non-vacuum exchanges. As seen in Fig. 10, peaks connected with creations of -isobars are presented in the experimental data. The UrQMD model reproduces the peaks at 6 GeV/c, but it assumes that the yield of the resonances decreases very fast with energy growth. Fritiof 1.6 and Fritiof 7.0 models predict smooth distributions without peaks.
Summing up, one can conclude that a description of the mass distributions in the low mass region is a problem in all Fritiof-based model especially at high energies.
Experimental mass distributions at high energies are usually presented at various values of 4-momentum transfers, . For their analysis one needs to reproduce a -dependence of the spectra which requires a lot of work because a slope of a distribution on depends on a produced mass and on an energy of collisions. The models do not assume such dependencies, as it is seen in Fig. 11 where experimental data [35] are presented in a comparison with calculations results.
As seen also, the Fritiof 1.6 model does not describe the data at small parameter MeV. At larger parameter, the slope of the calculated curves becomes close to the experimental one. Now it is clearly seen, that the model underestimates the diffraction cross sections.
The UrQMD model gave at the beginning very strange results: the calculated distributions had step-like behaviour. To improve the model the following change has been done in the model (file angdis.f):
c for jmax=12 the accuracy is better than 0.1 degree
c
* do j=1,12 ! accuracy 2**-jmax ! Uzhi
do j=1,24 ! accuracy 2**-jmax ! Uzhi
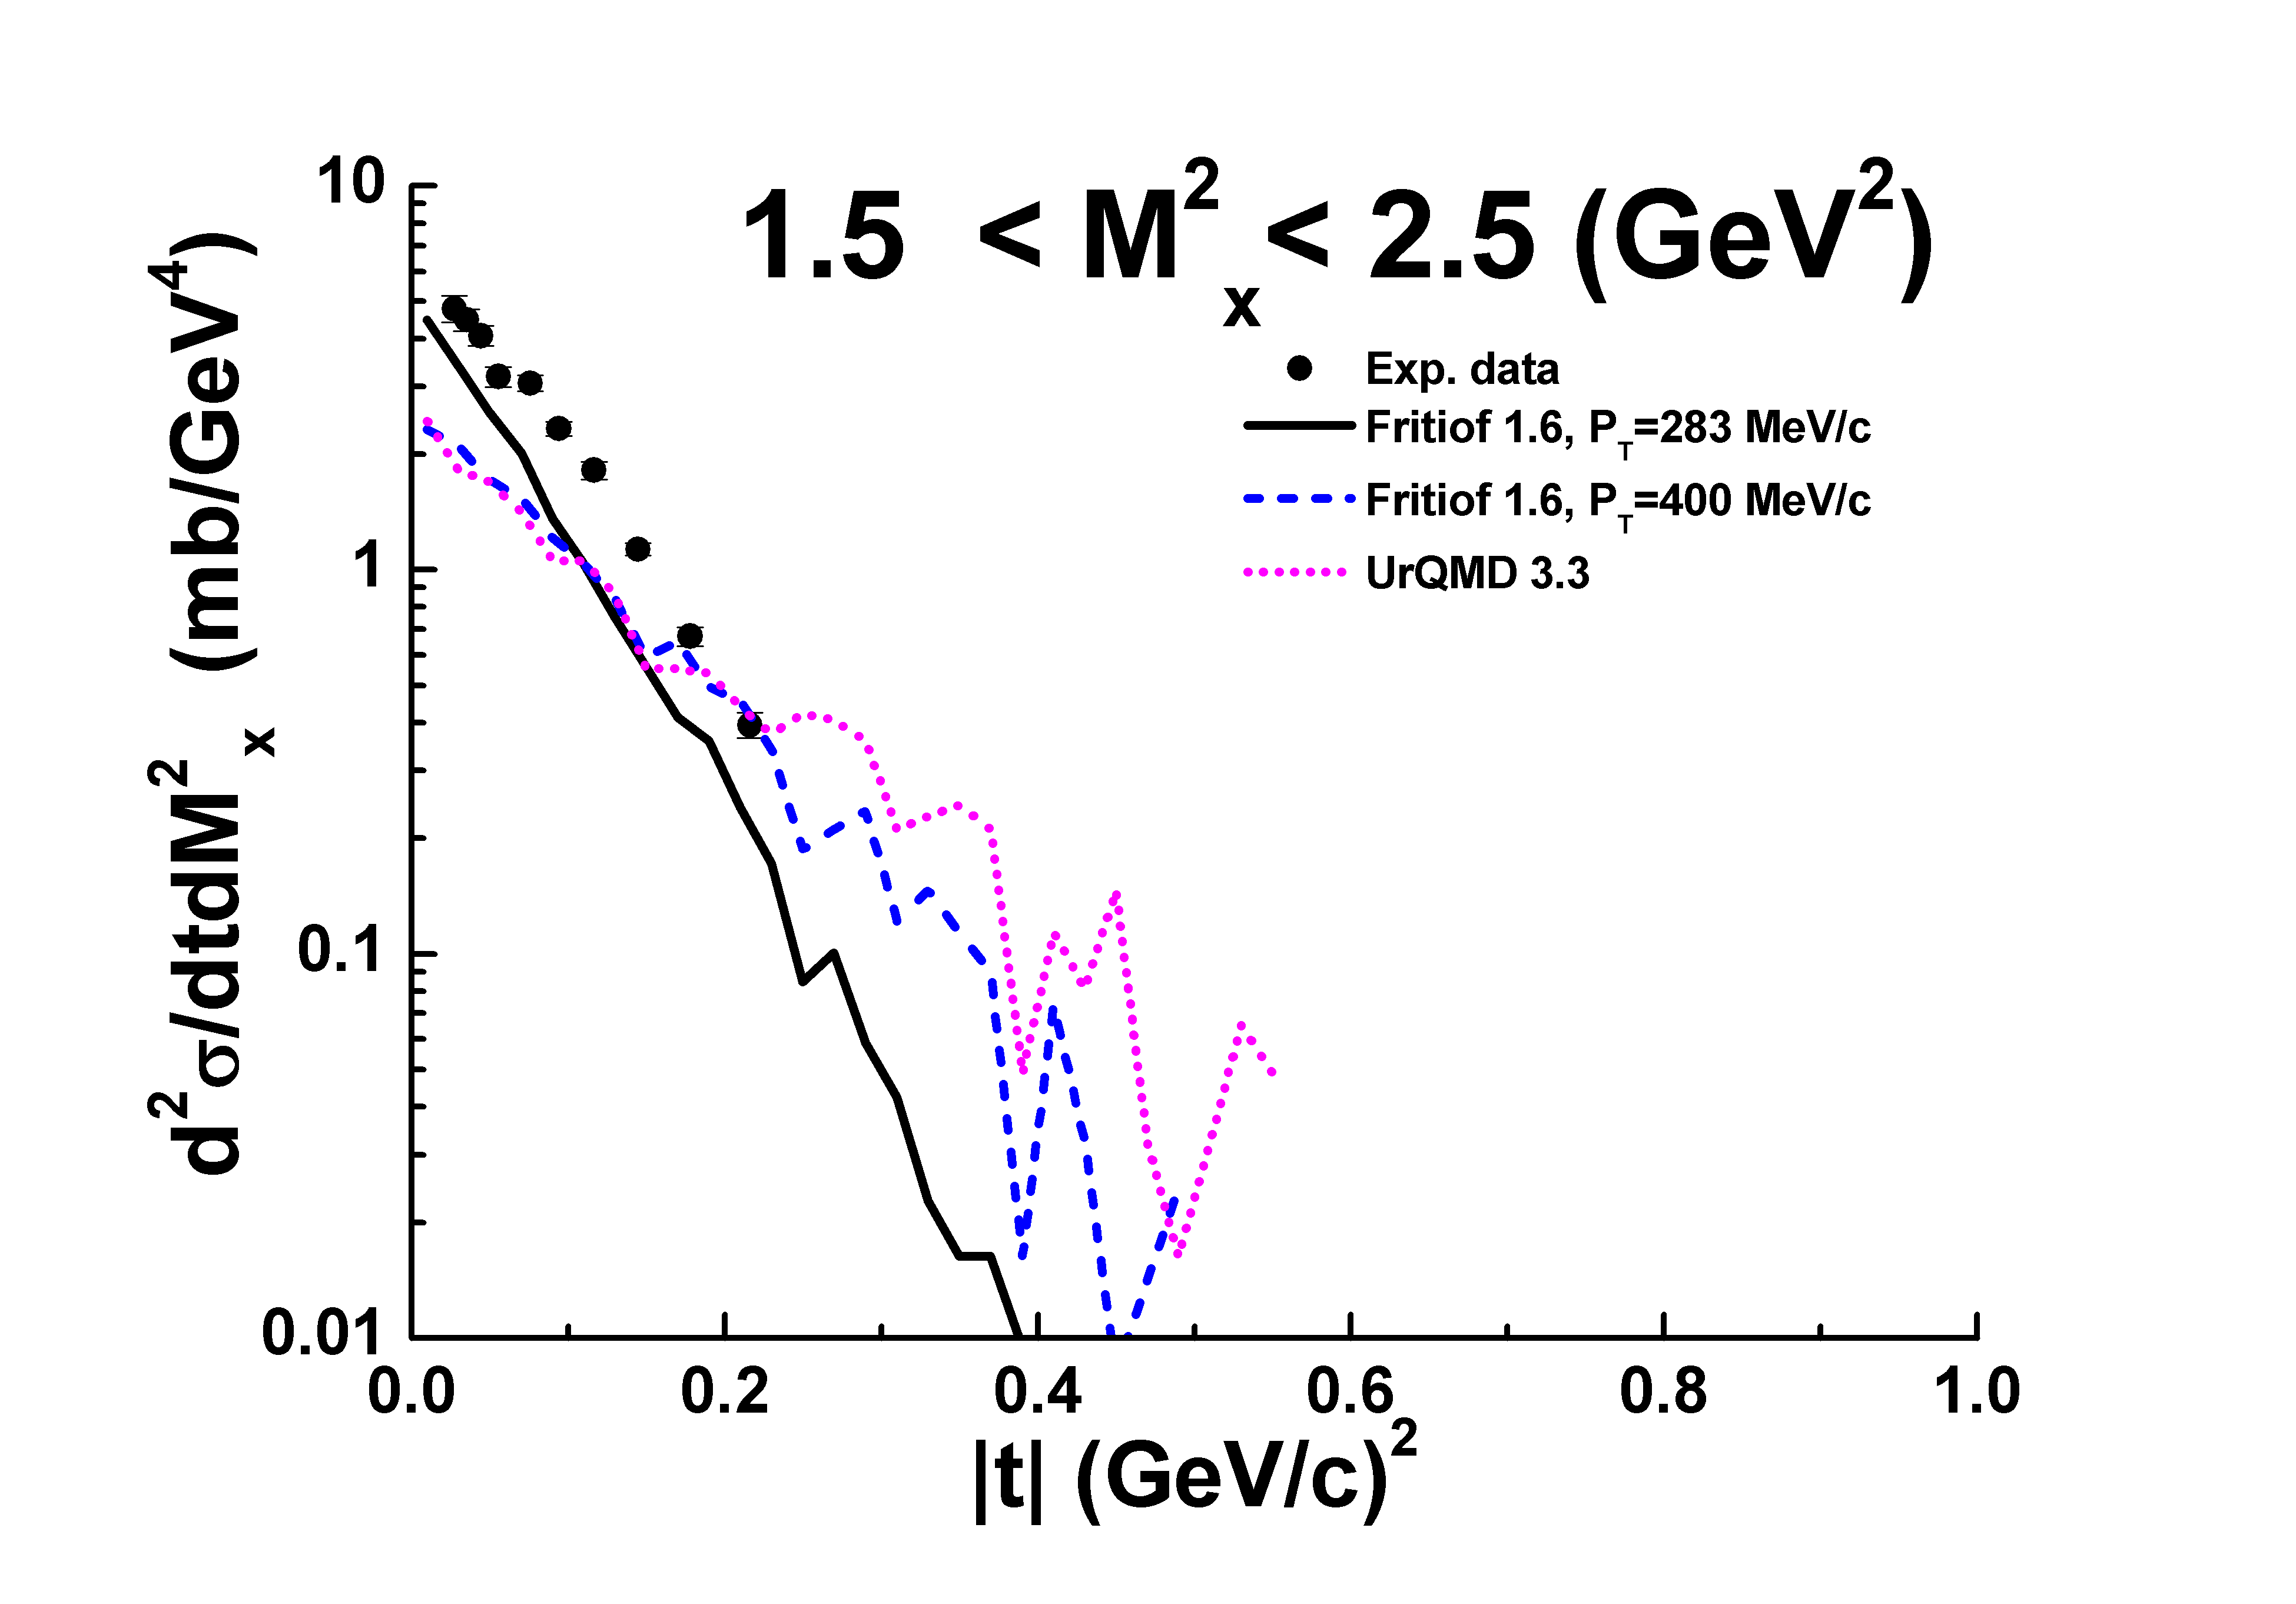
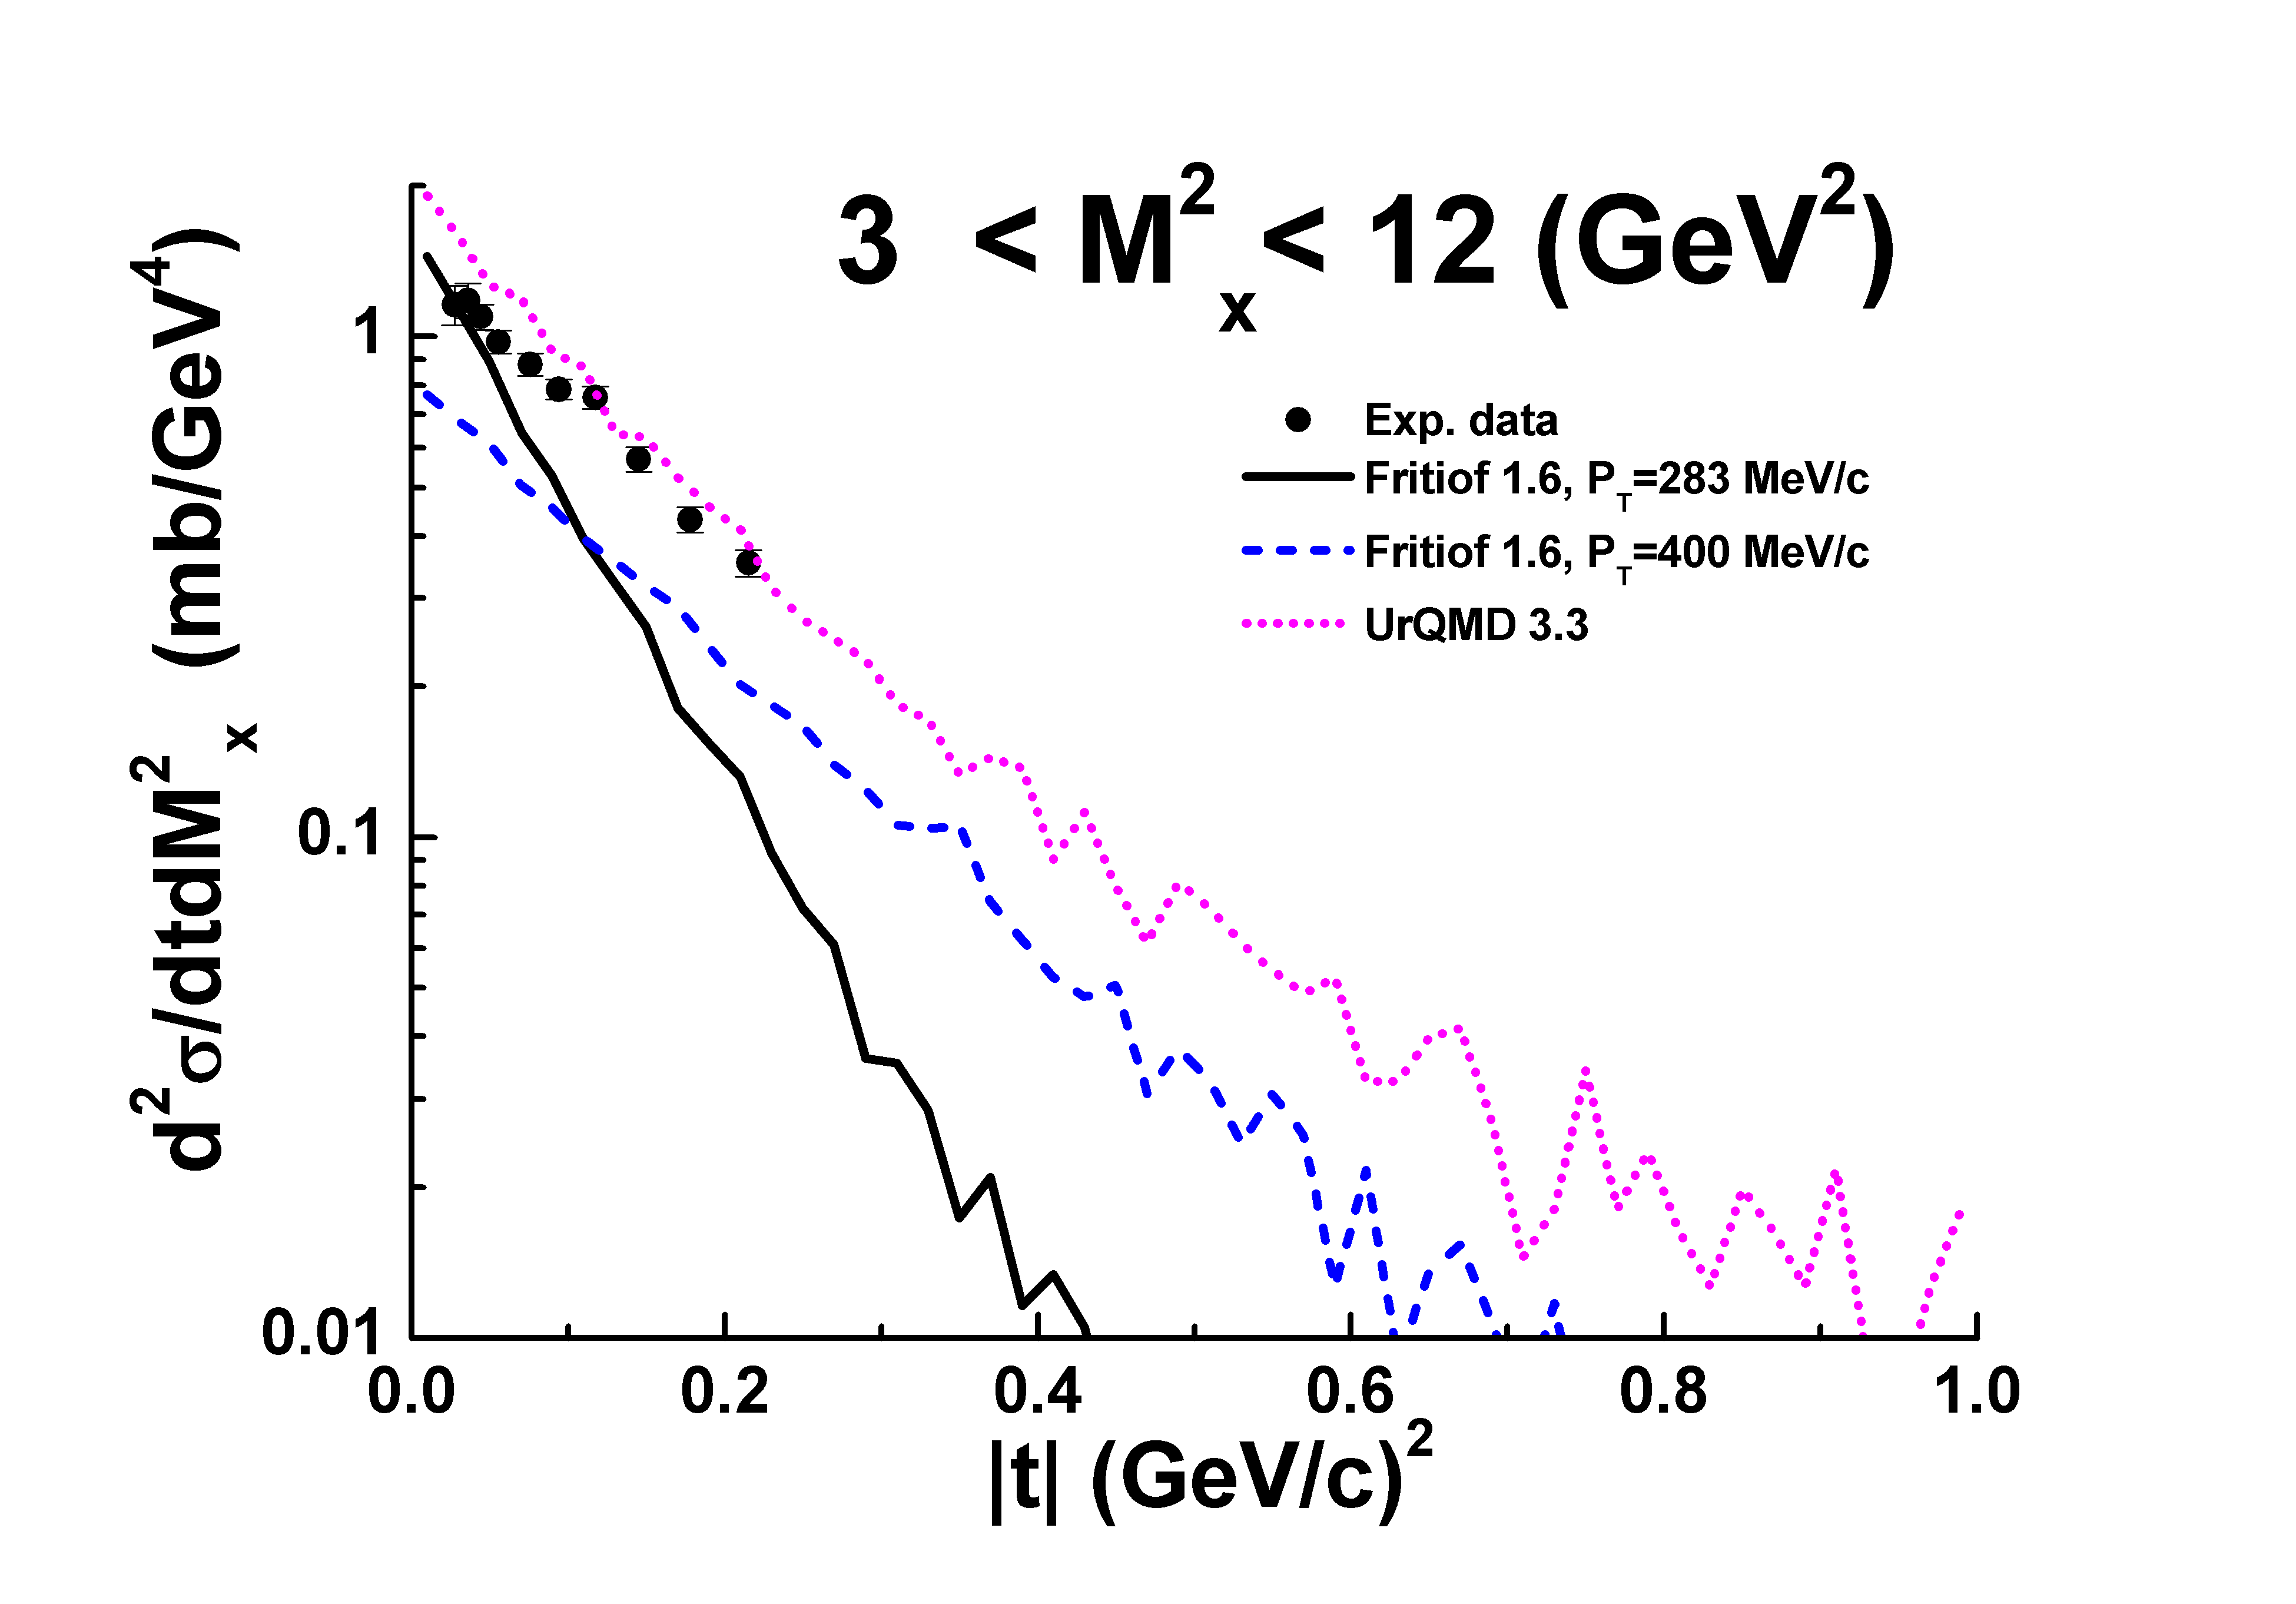
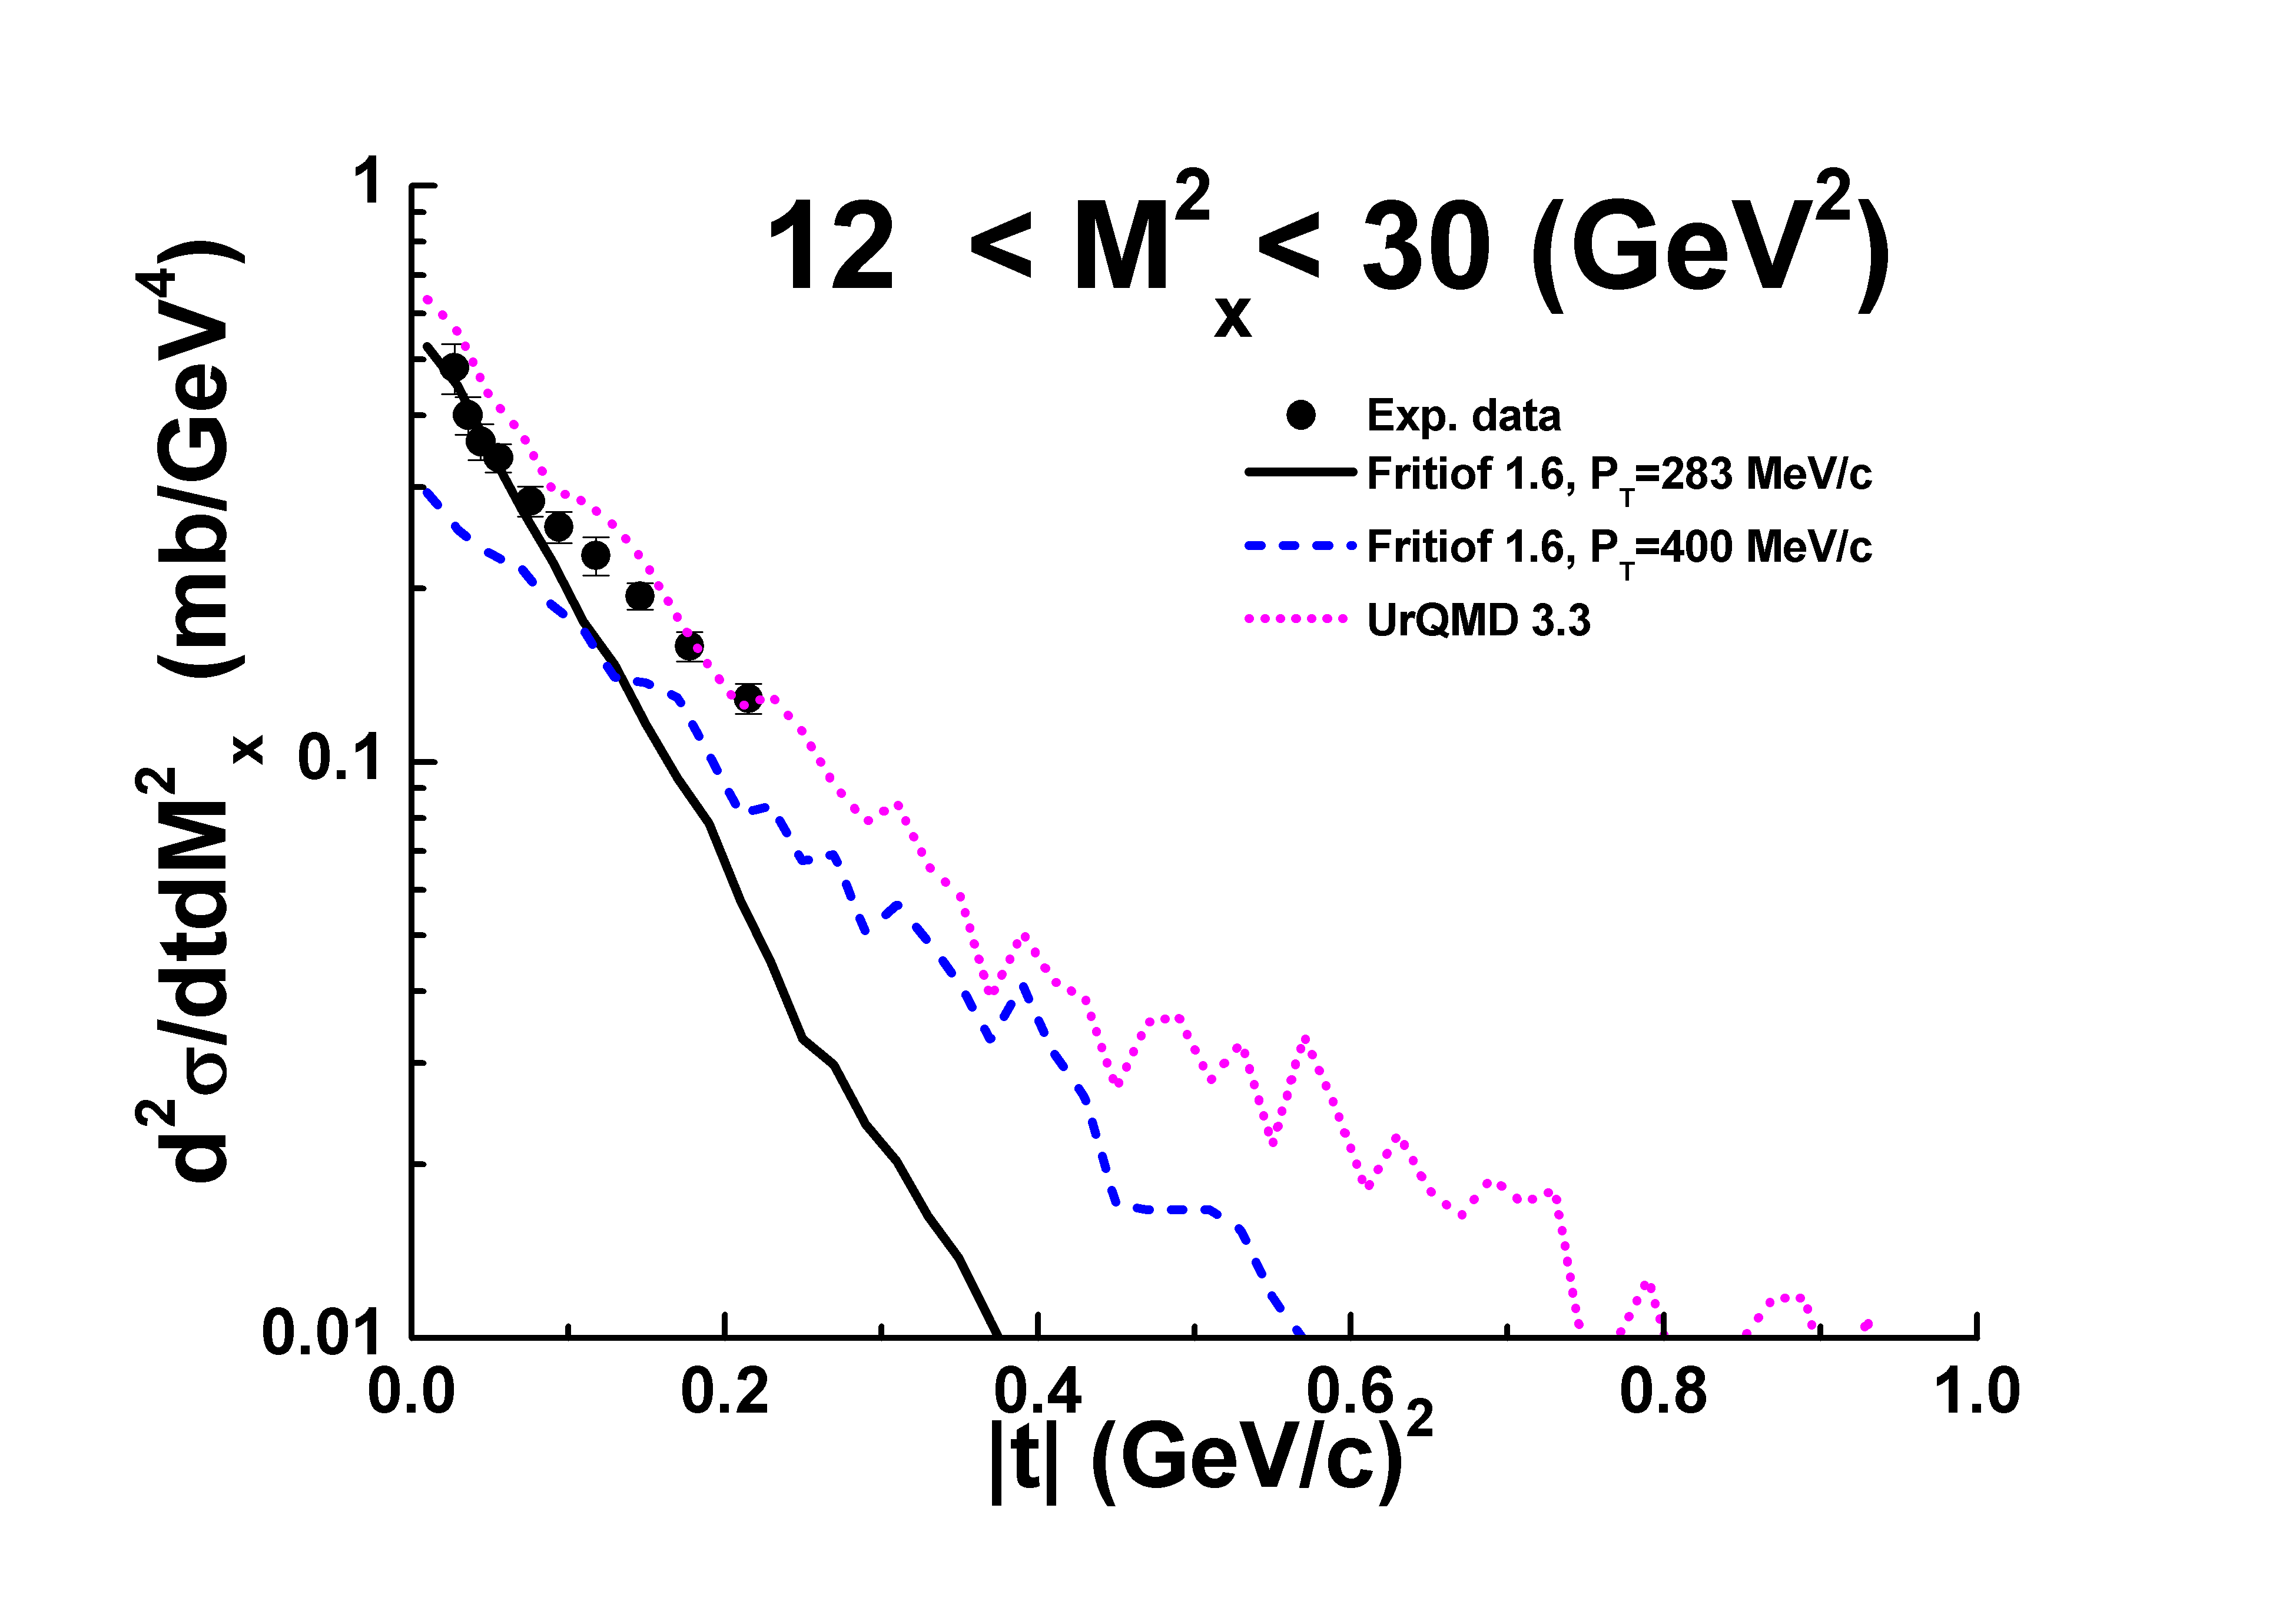
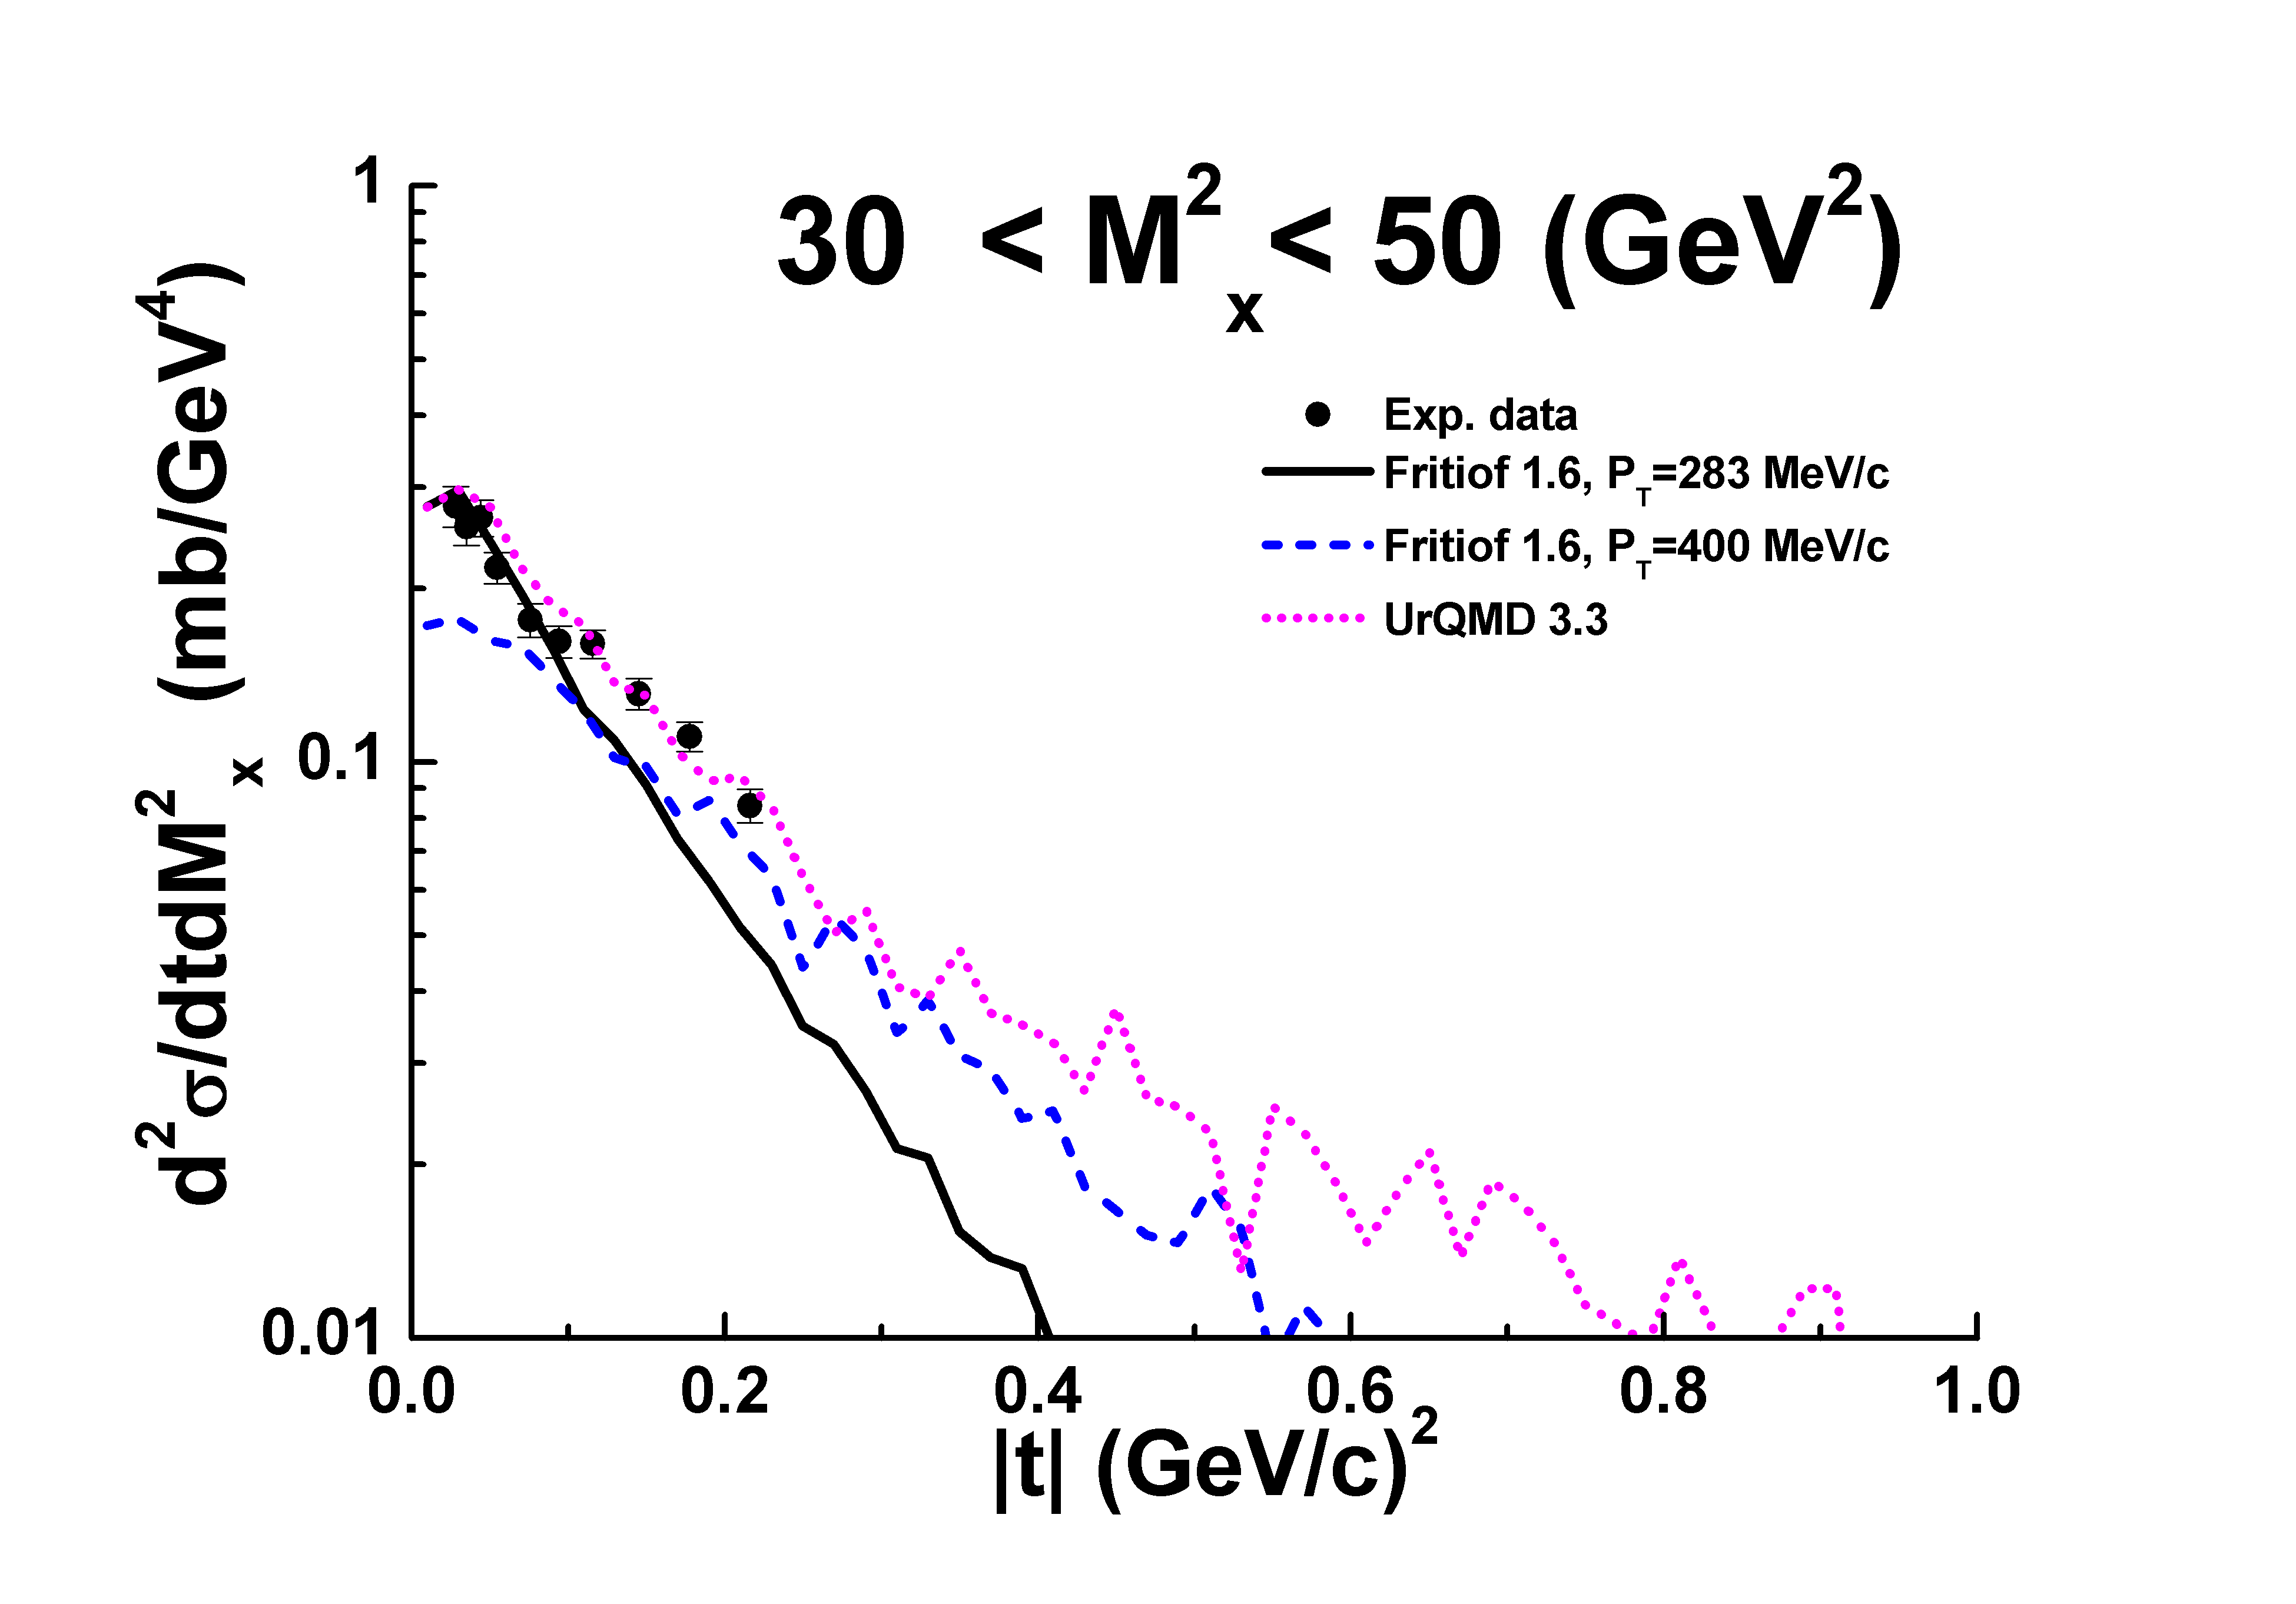
It should be noted that distribution in the considered reaction is not determined by the above given parameter (CTParam(31)=1.6) of the UrQMD model. A final distribution is simulated in the file angdis.f. Thus, the changes were introduced in it.
Results of the improved UrQMD model are presented in Fig. 11. As seen, the model underestimates a production of systems with 2.5 GeV2. At higher mass, the model predictions are in an agreement with the experimental data.
Assuming that a correct reproduction of the -dependence of the cross sections is not very important we can compare the model calculations with other experimental data. In Fig. 12 the experimental data of the paper [35] on squared mass distributions in the reactions at various energies integrated over region 0.024 – 0.235 (GeV/c)2 are presented in a comparison with the calculations.
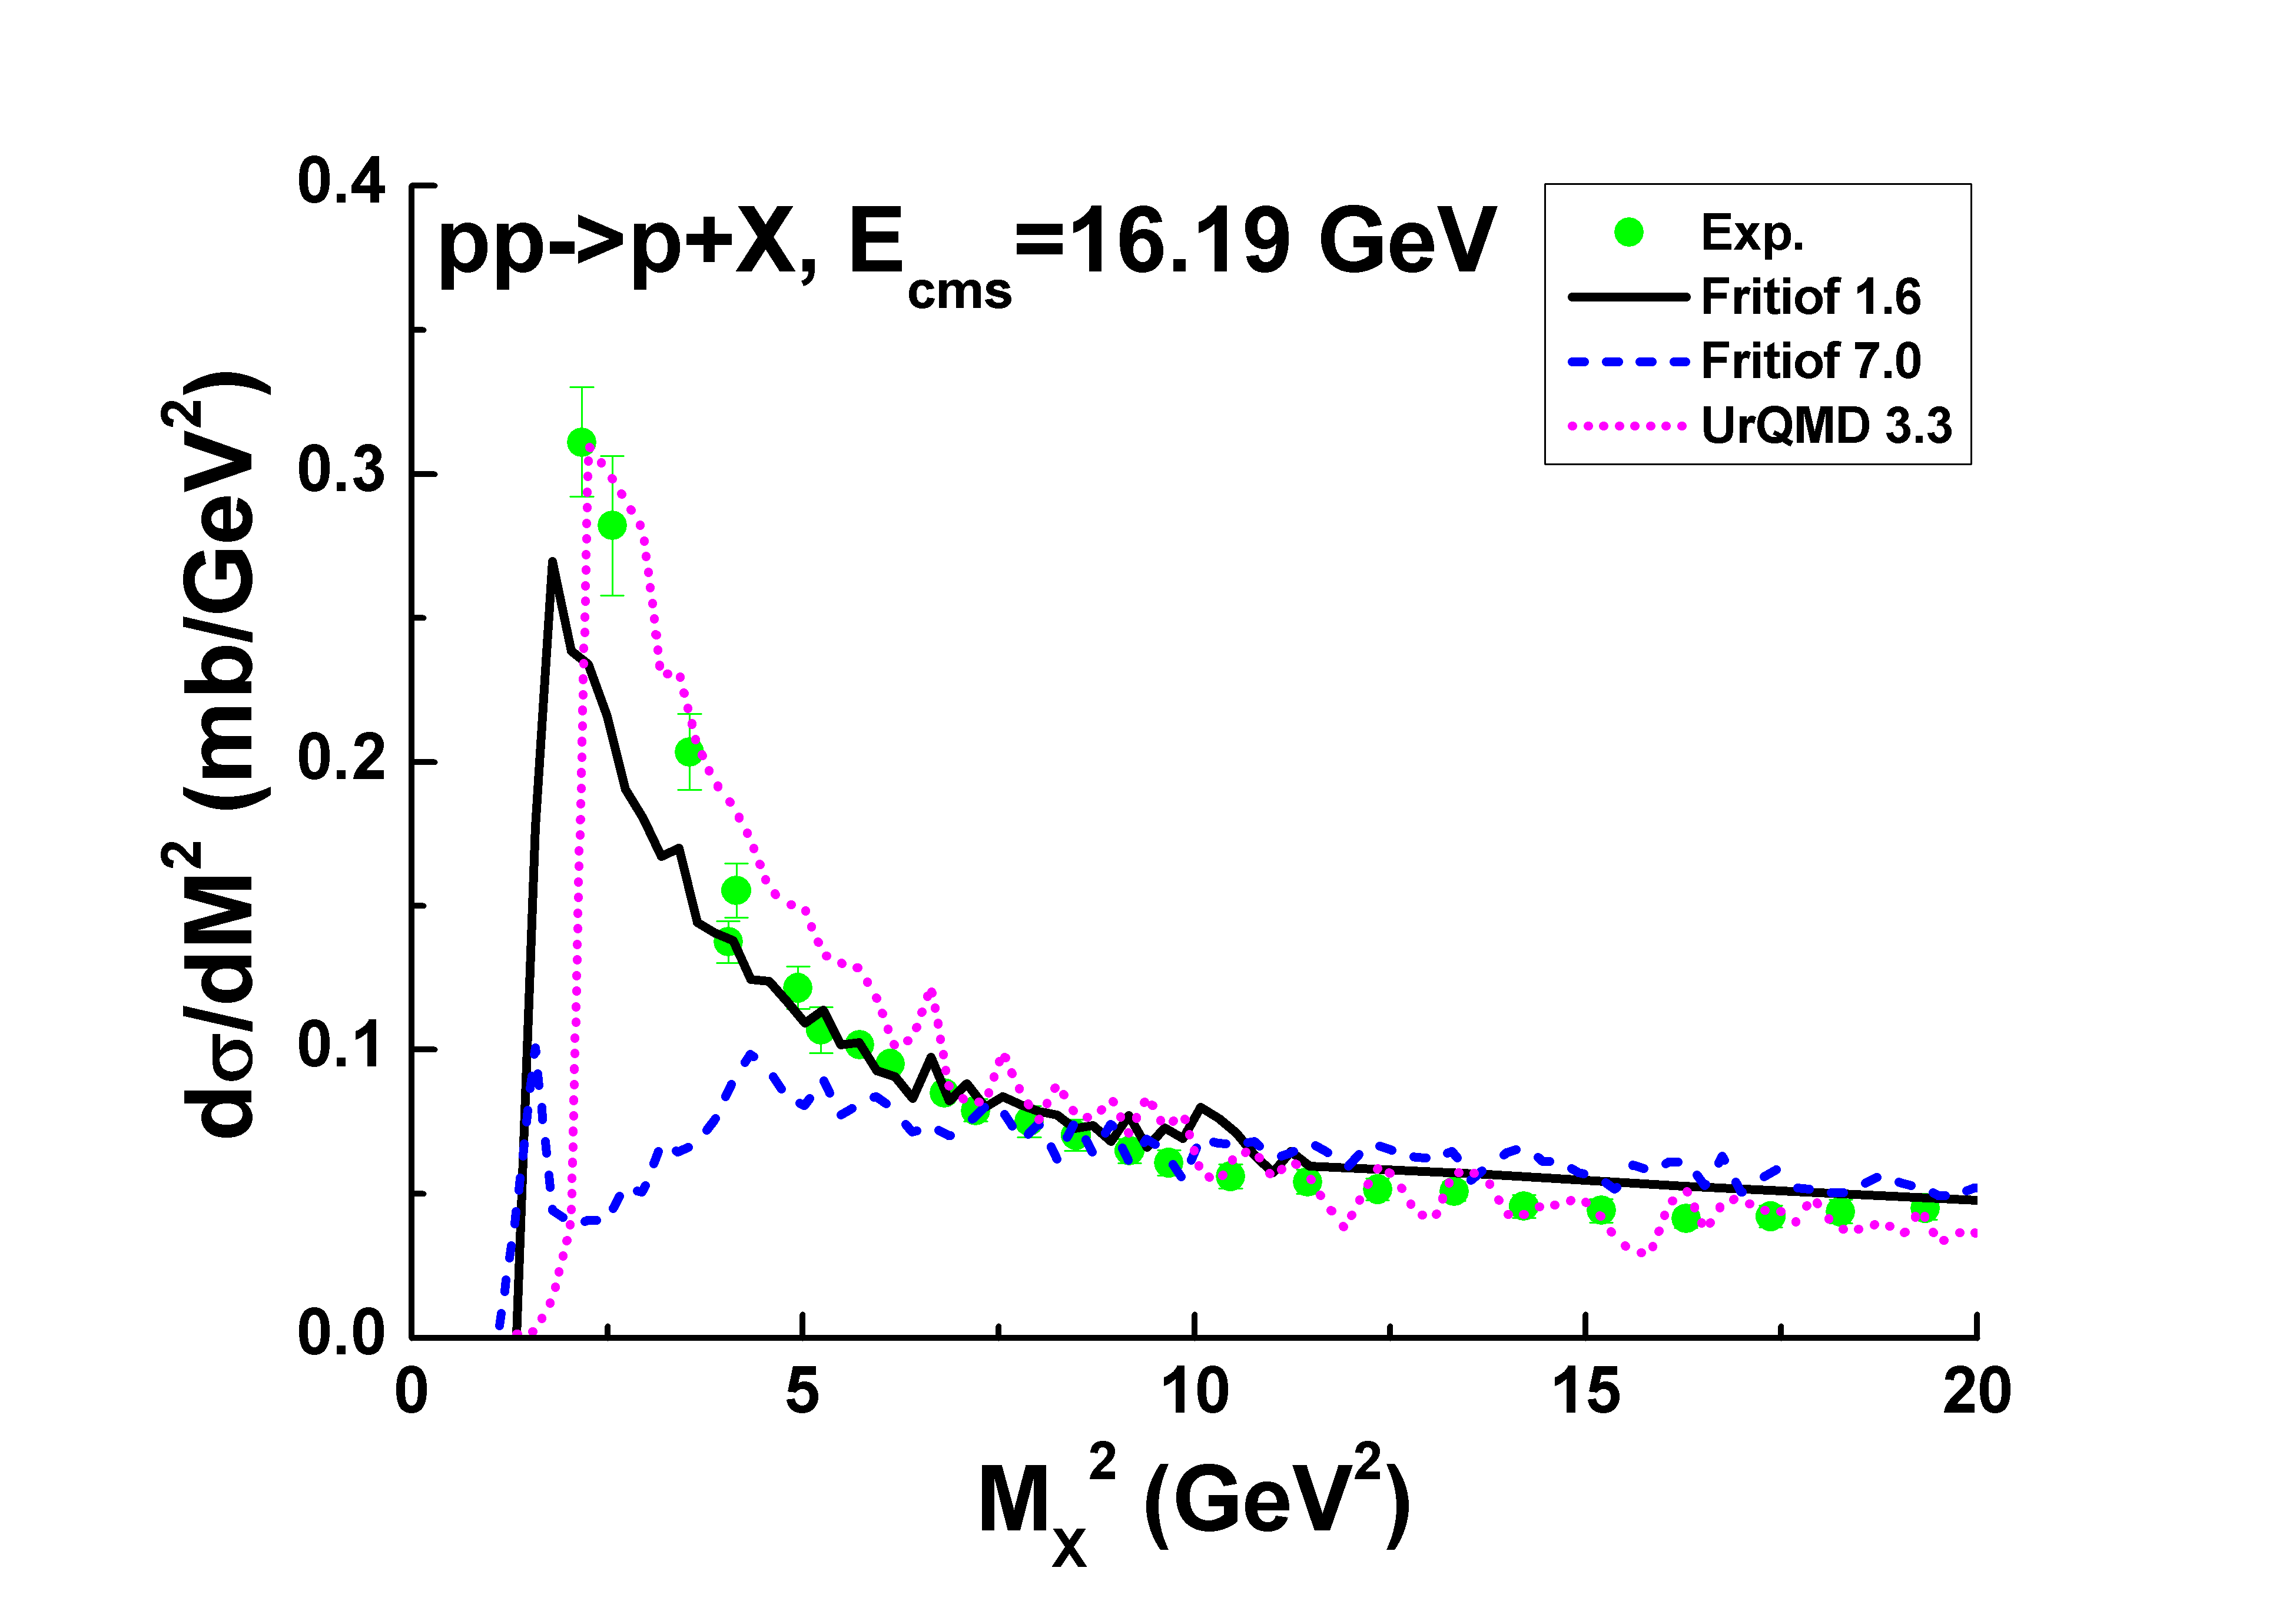
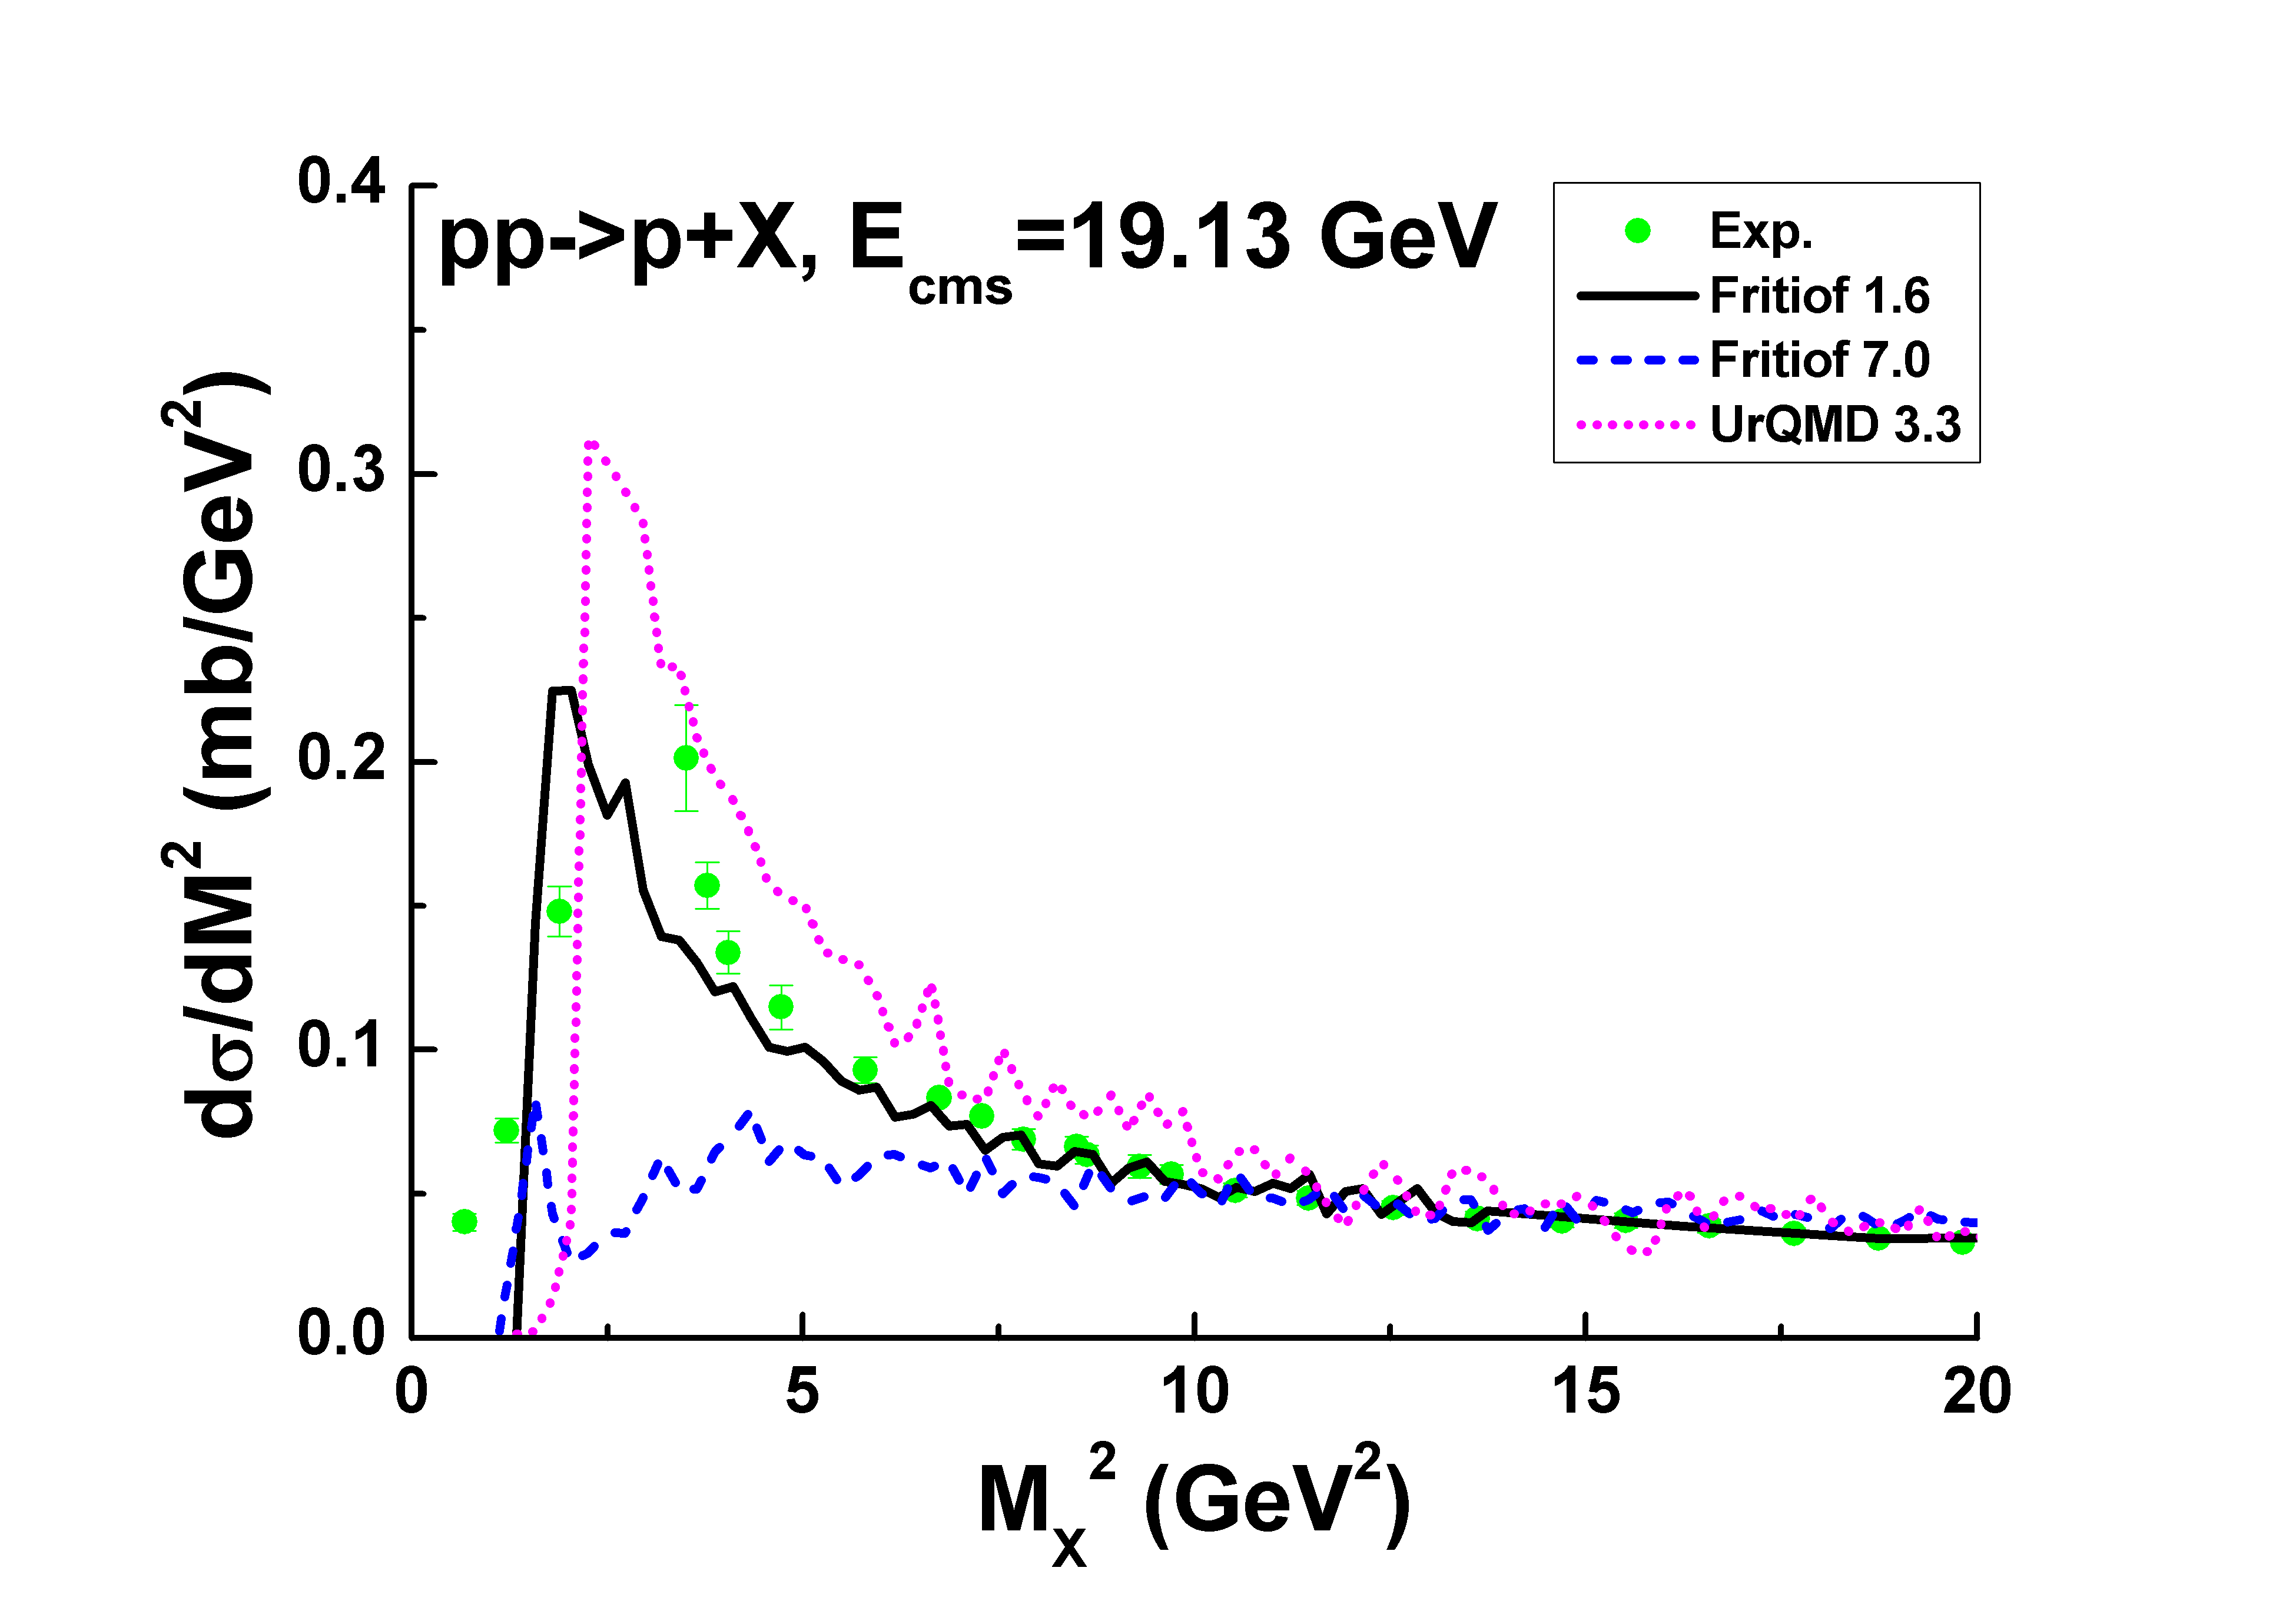
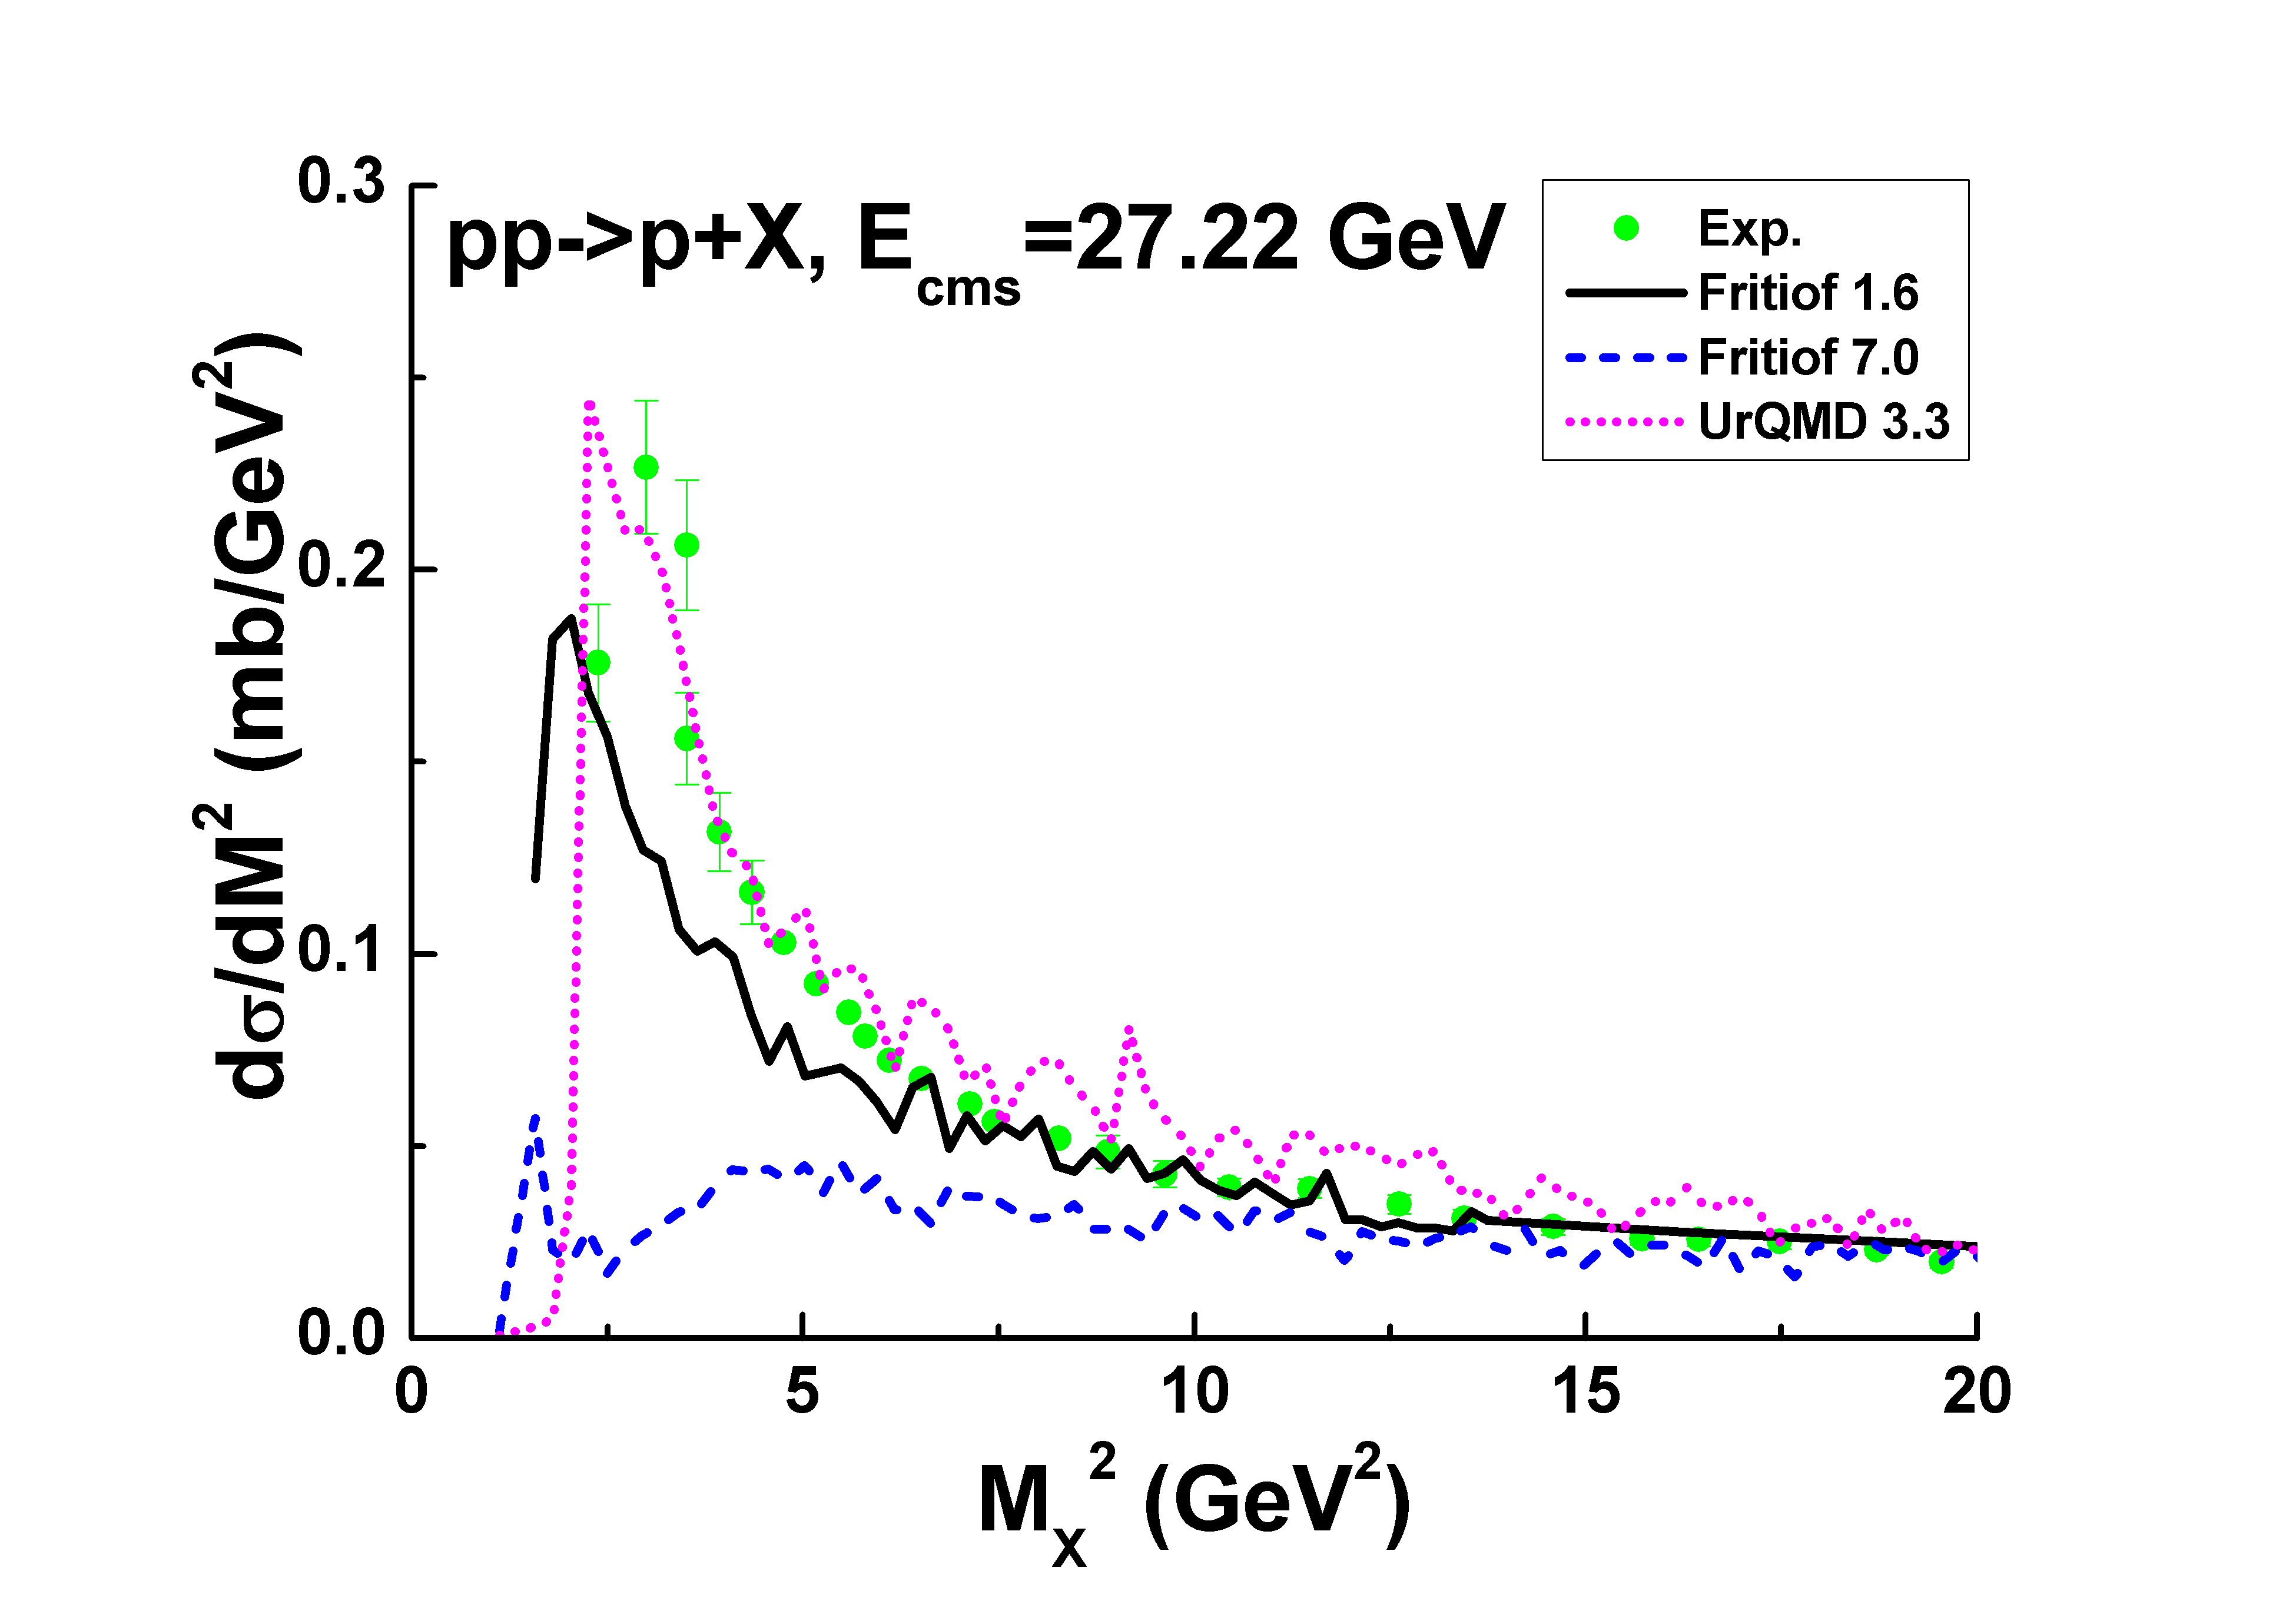
As seen, the Fritiof 1.6 model does not describe the data in low mass region. The Fritiof 7.0 model gives strange predictions in the region. The UrQMD model reproduces the data reasonably well except the data at GeV. Probably, more realistic description of the -dependence is needed. The models have close predictions in high mass region.
Calculations of the diffraction dissociation cross sections in -interactions integrated over are presented in Fig. 13a in a comparison with experimental data from paper [36]. As seen, Fritiof 1.6 and Fritiof 7.0 essentially underestimate the cross sections at high energies. The UrQMD model gives reasonable predictions at 15–25 GeV. Above the region, the model underestimates the data.
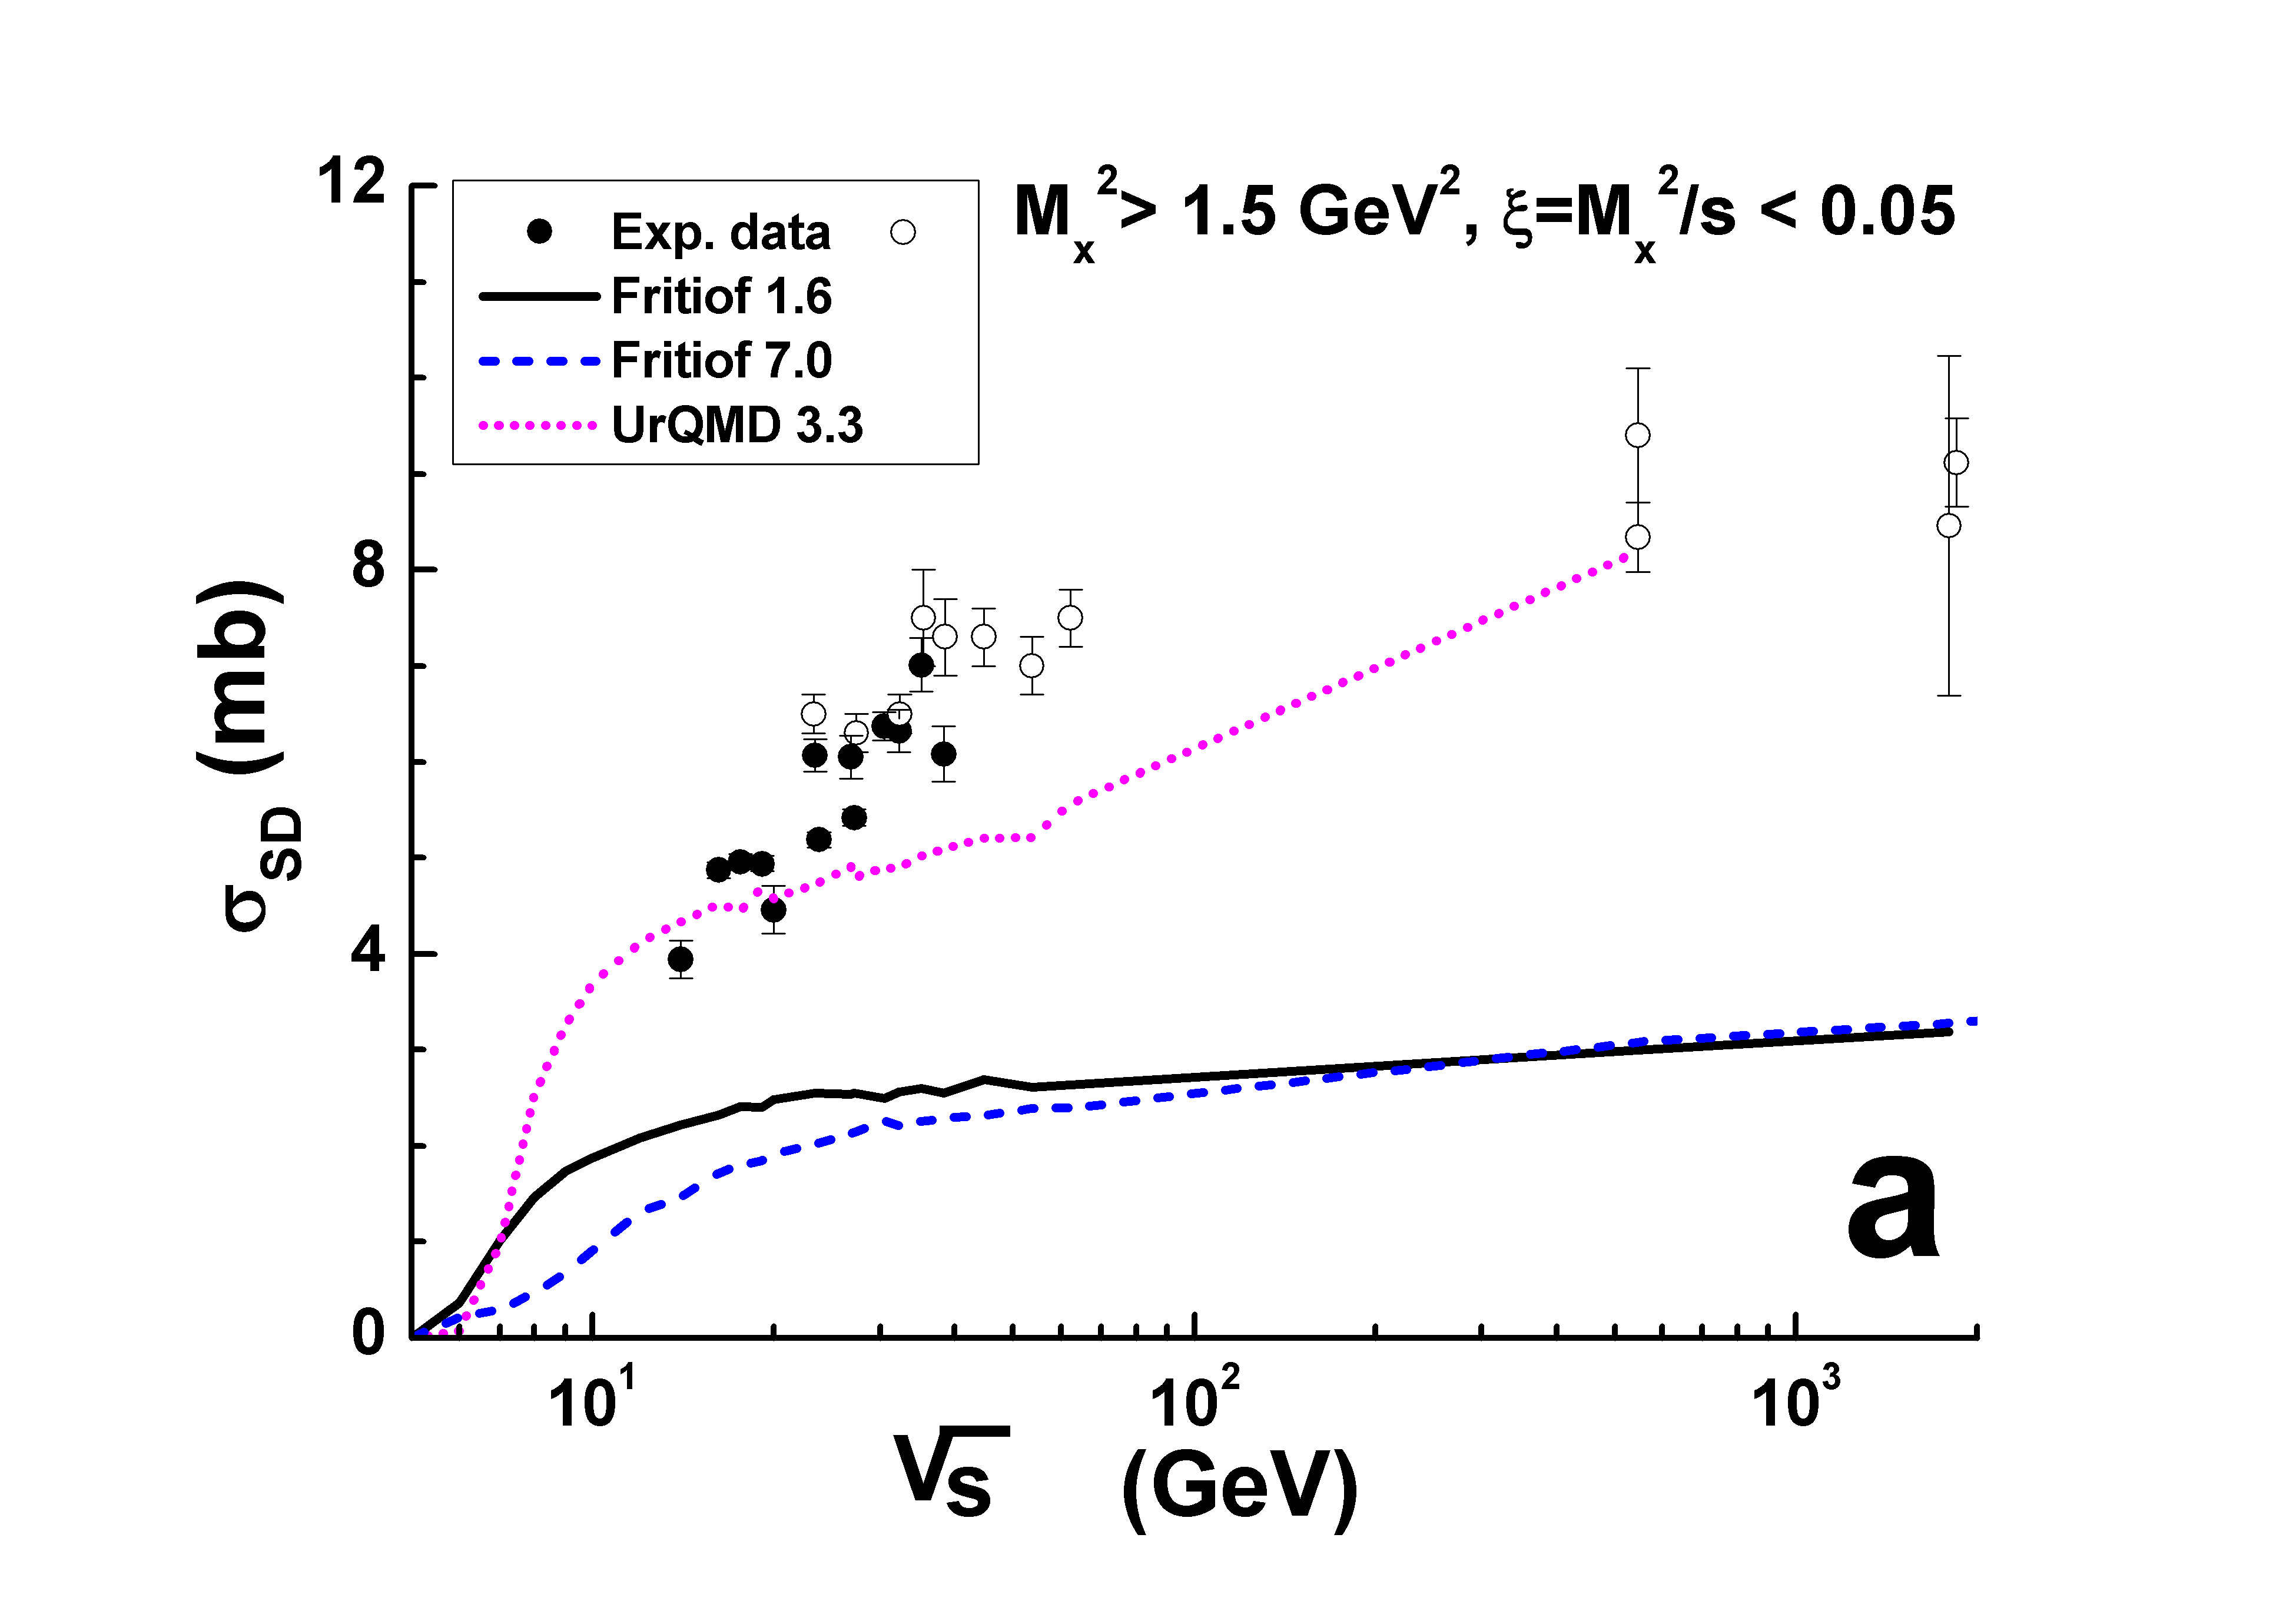
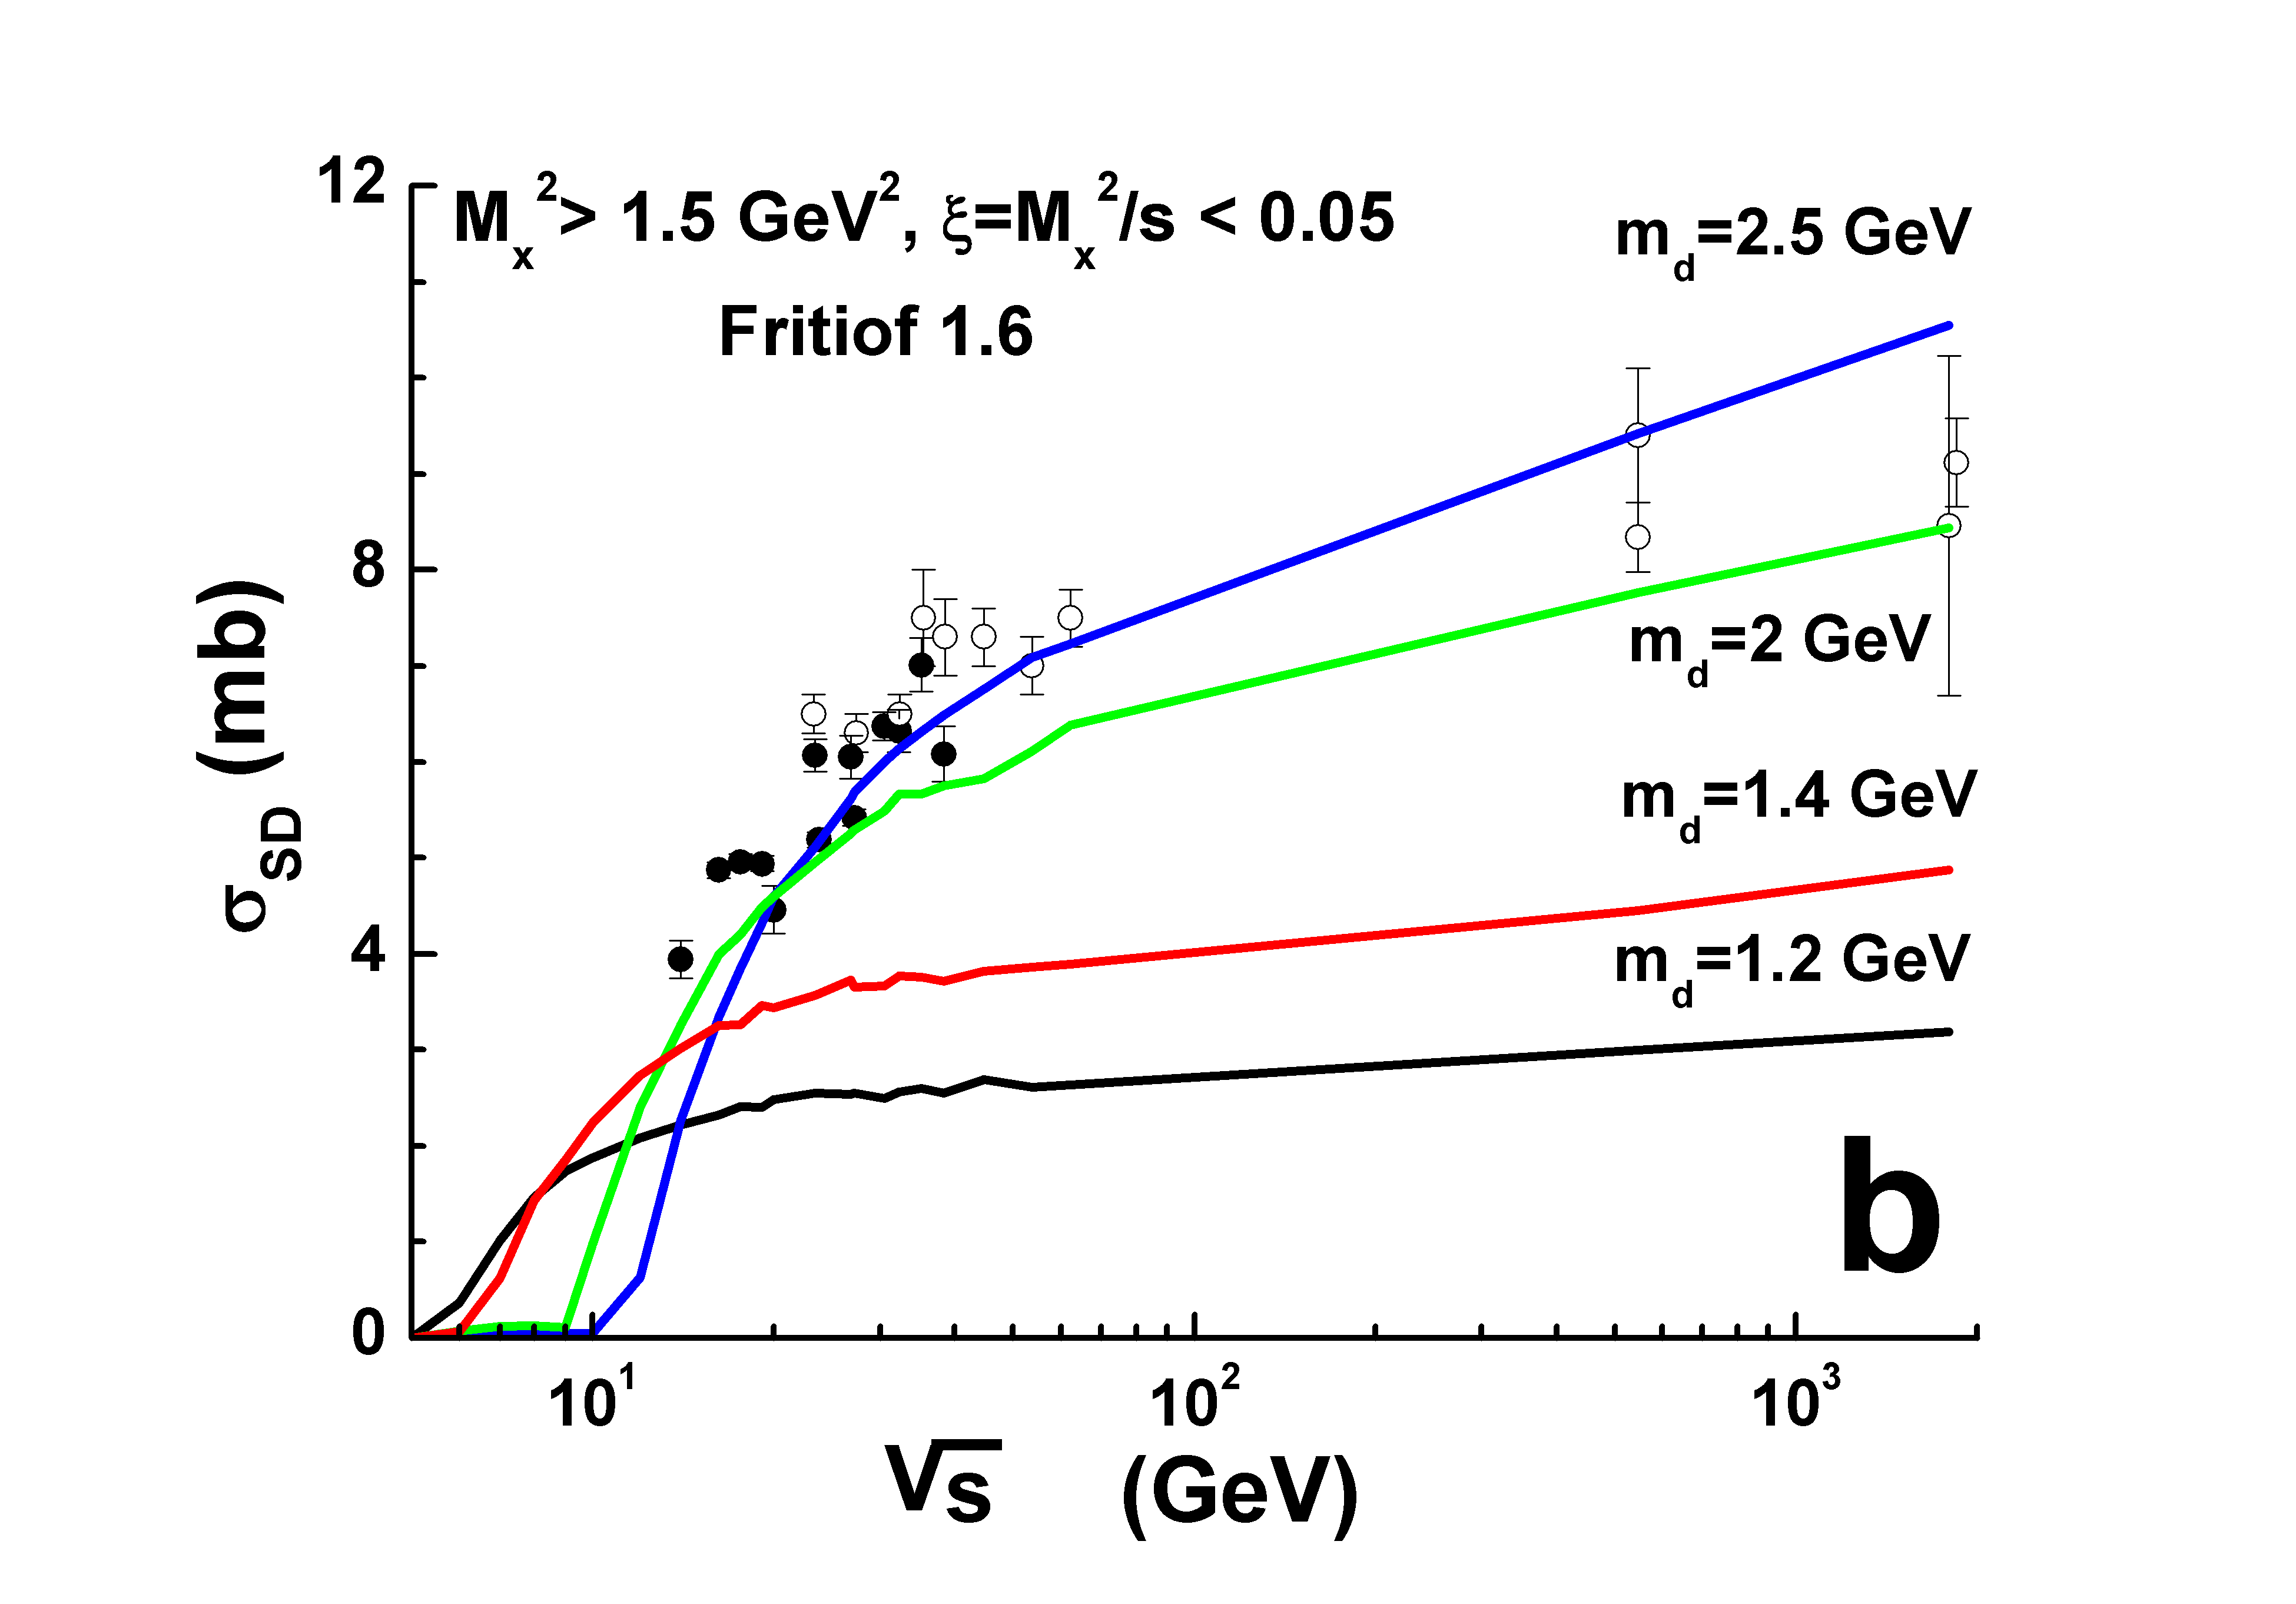
Of course, there is a simple possibility to change the Fritiof 1.6 and Fritiof 7.0 predictions increasing (see Fig. 13b). This changes also the behaviour of the cross sections at low energies. However the particle production in the central region of -interactions has a weak dependence on the ratio between diffractive and non-difractive cross sections. The most important factor here is a particle production in non-diffractive interactions.
5 interactions
The most simple situation takes place in the UrQMD model with a description of the data at 158 GeV/c. Because the standard and tuned variants of the model give close results, and a number of intra-nuclear collision in interactions is not large (), one cannot expect a large difference for collisions. According to Fig. 14 it is so.
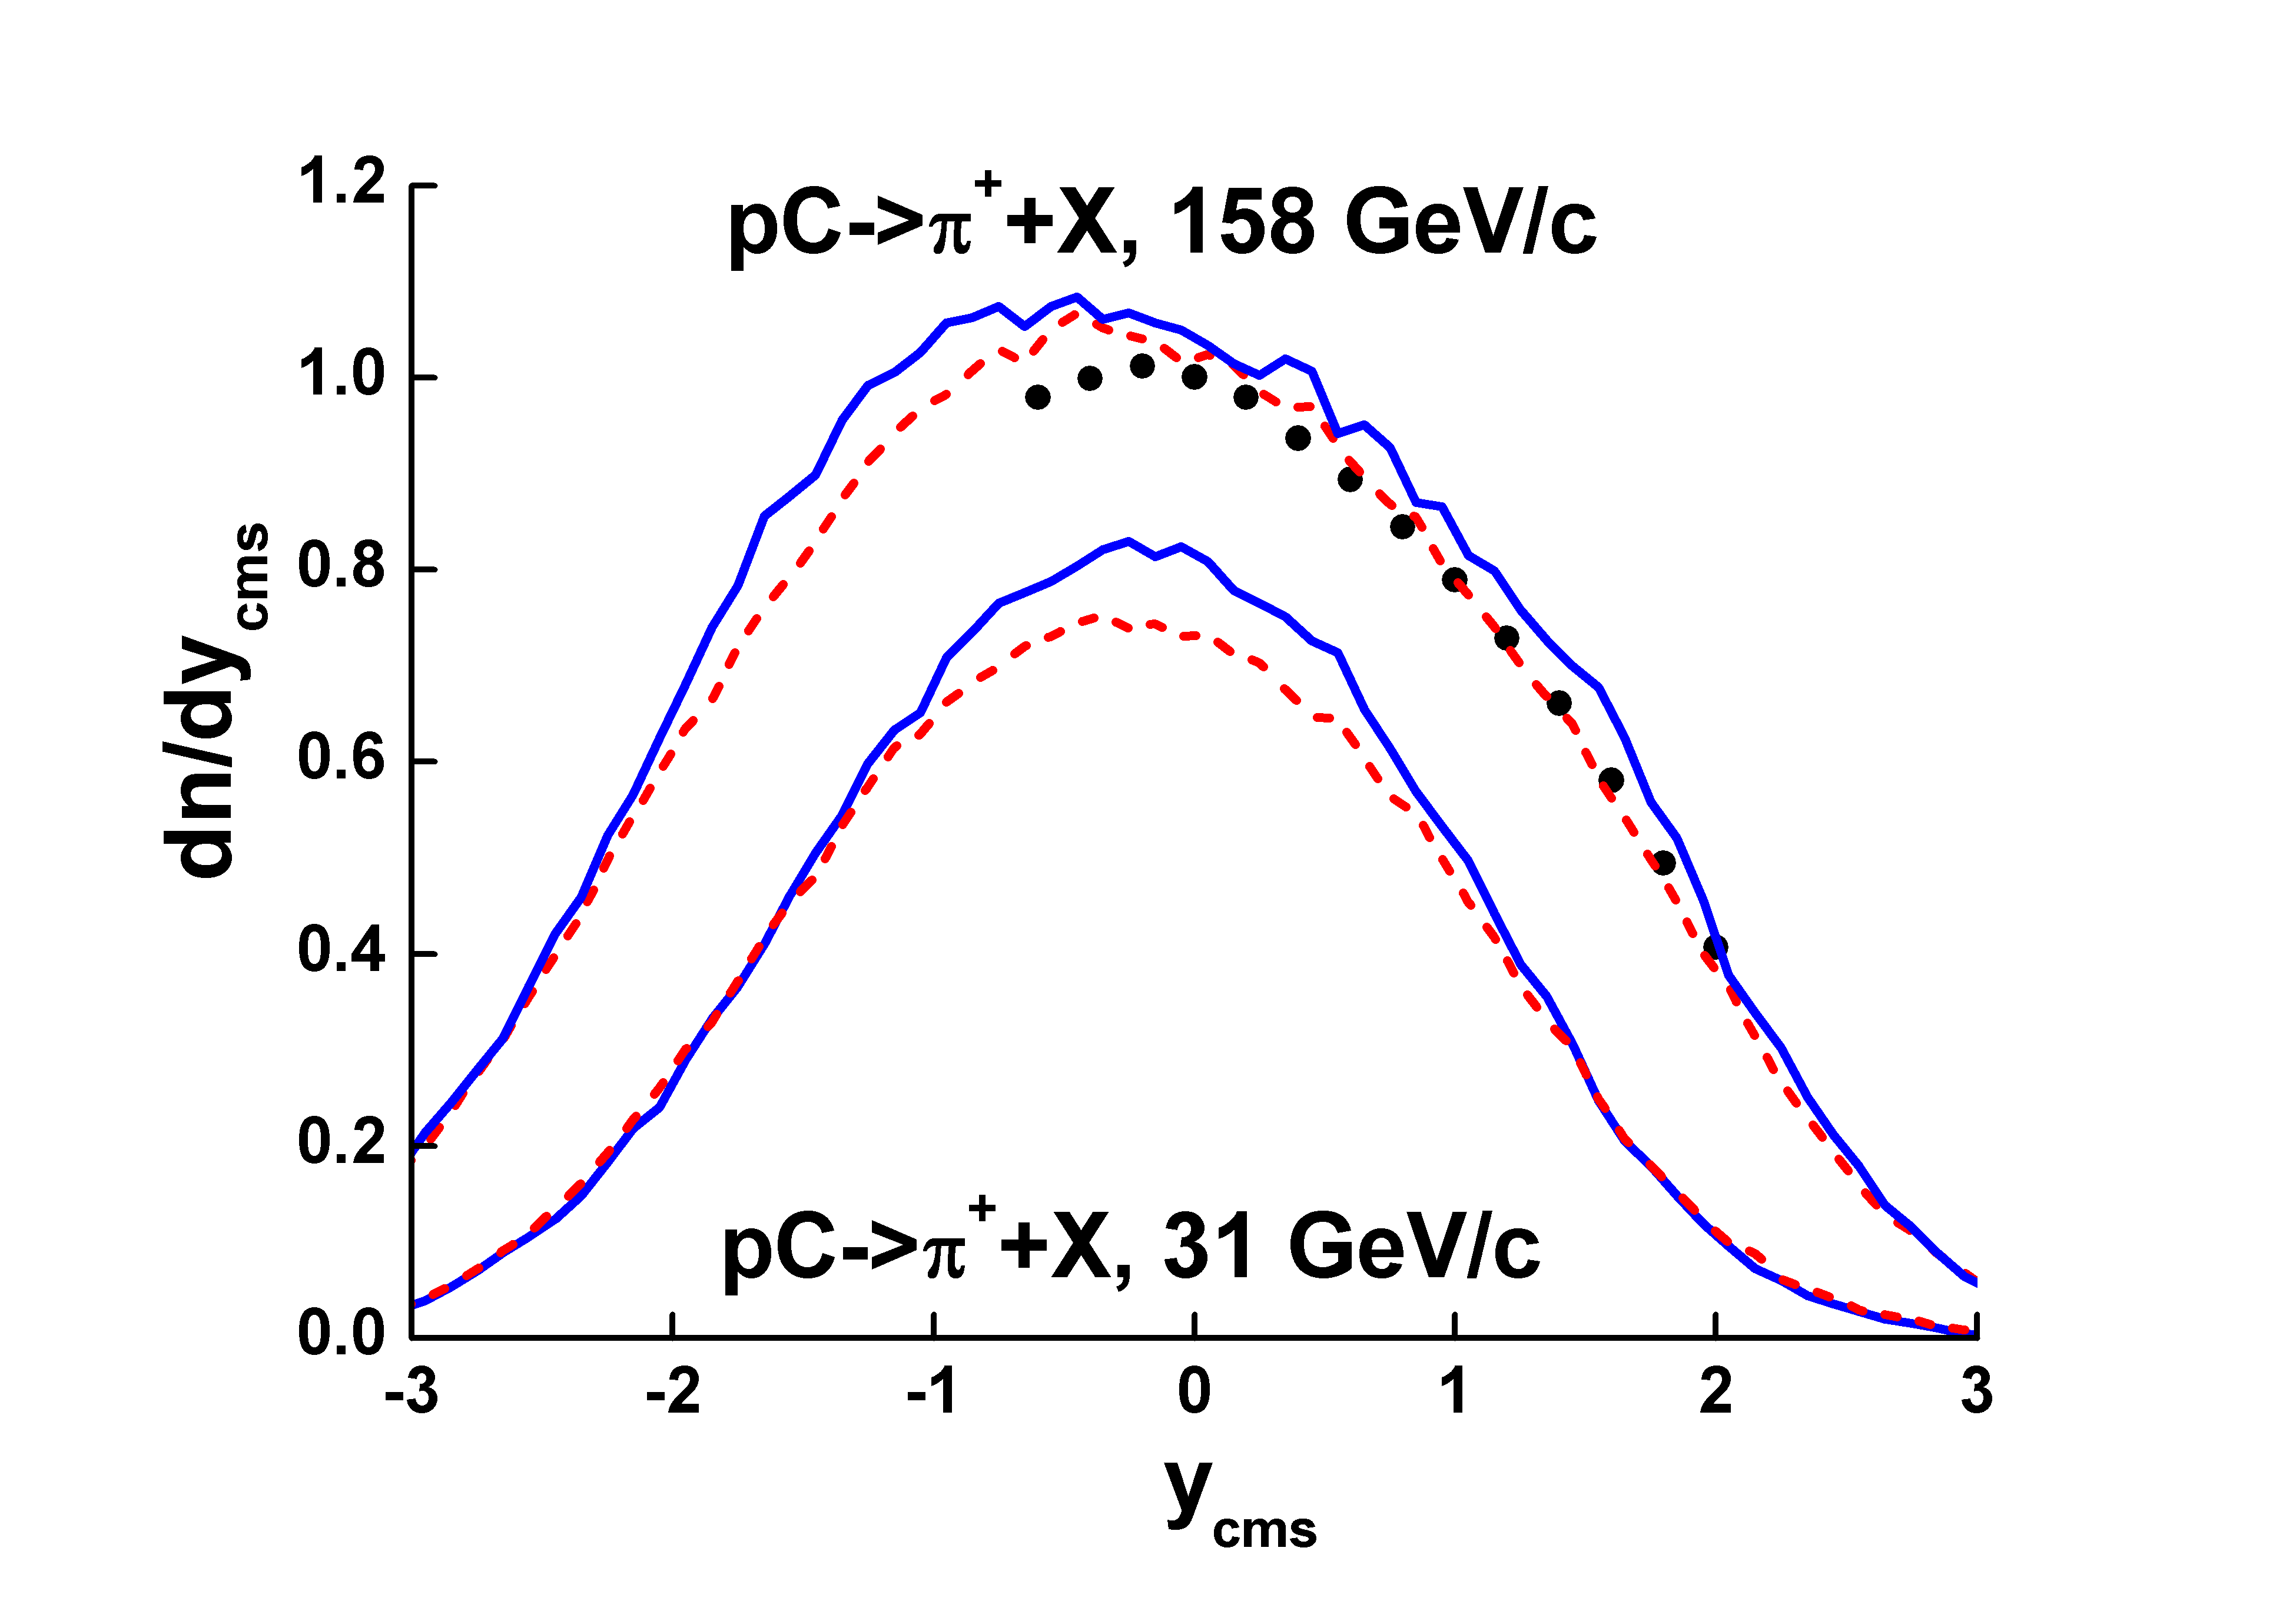
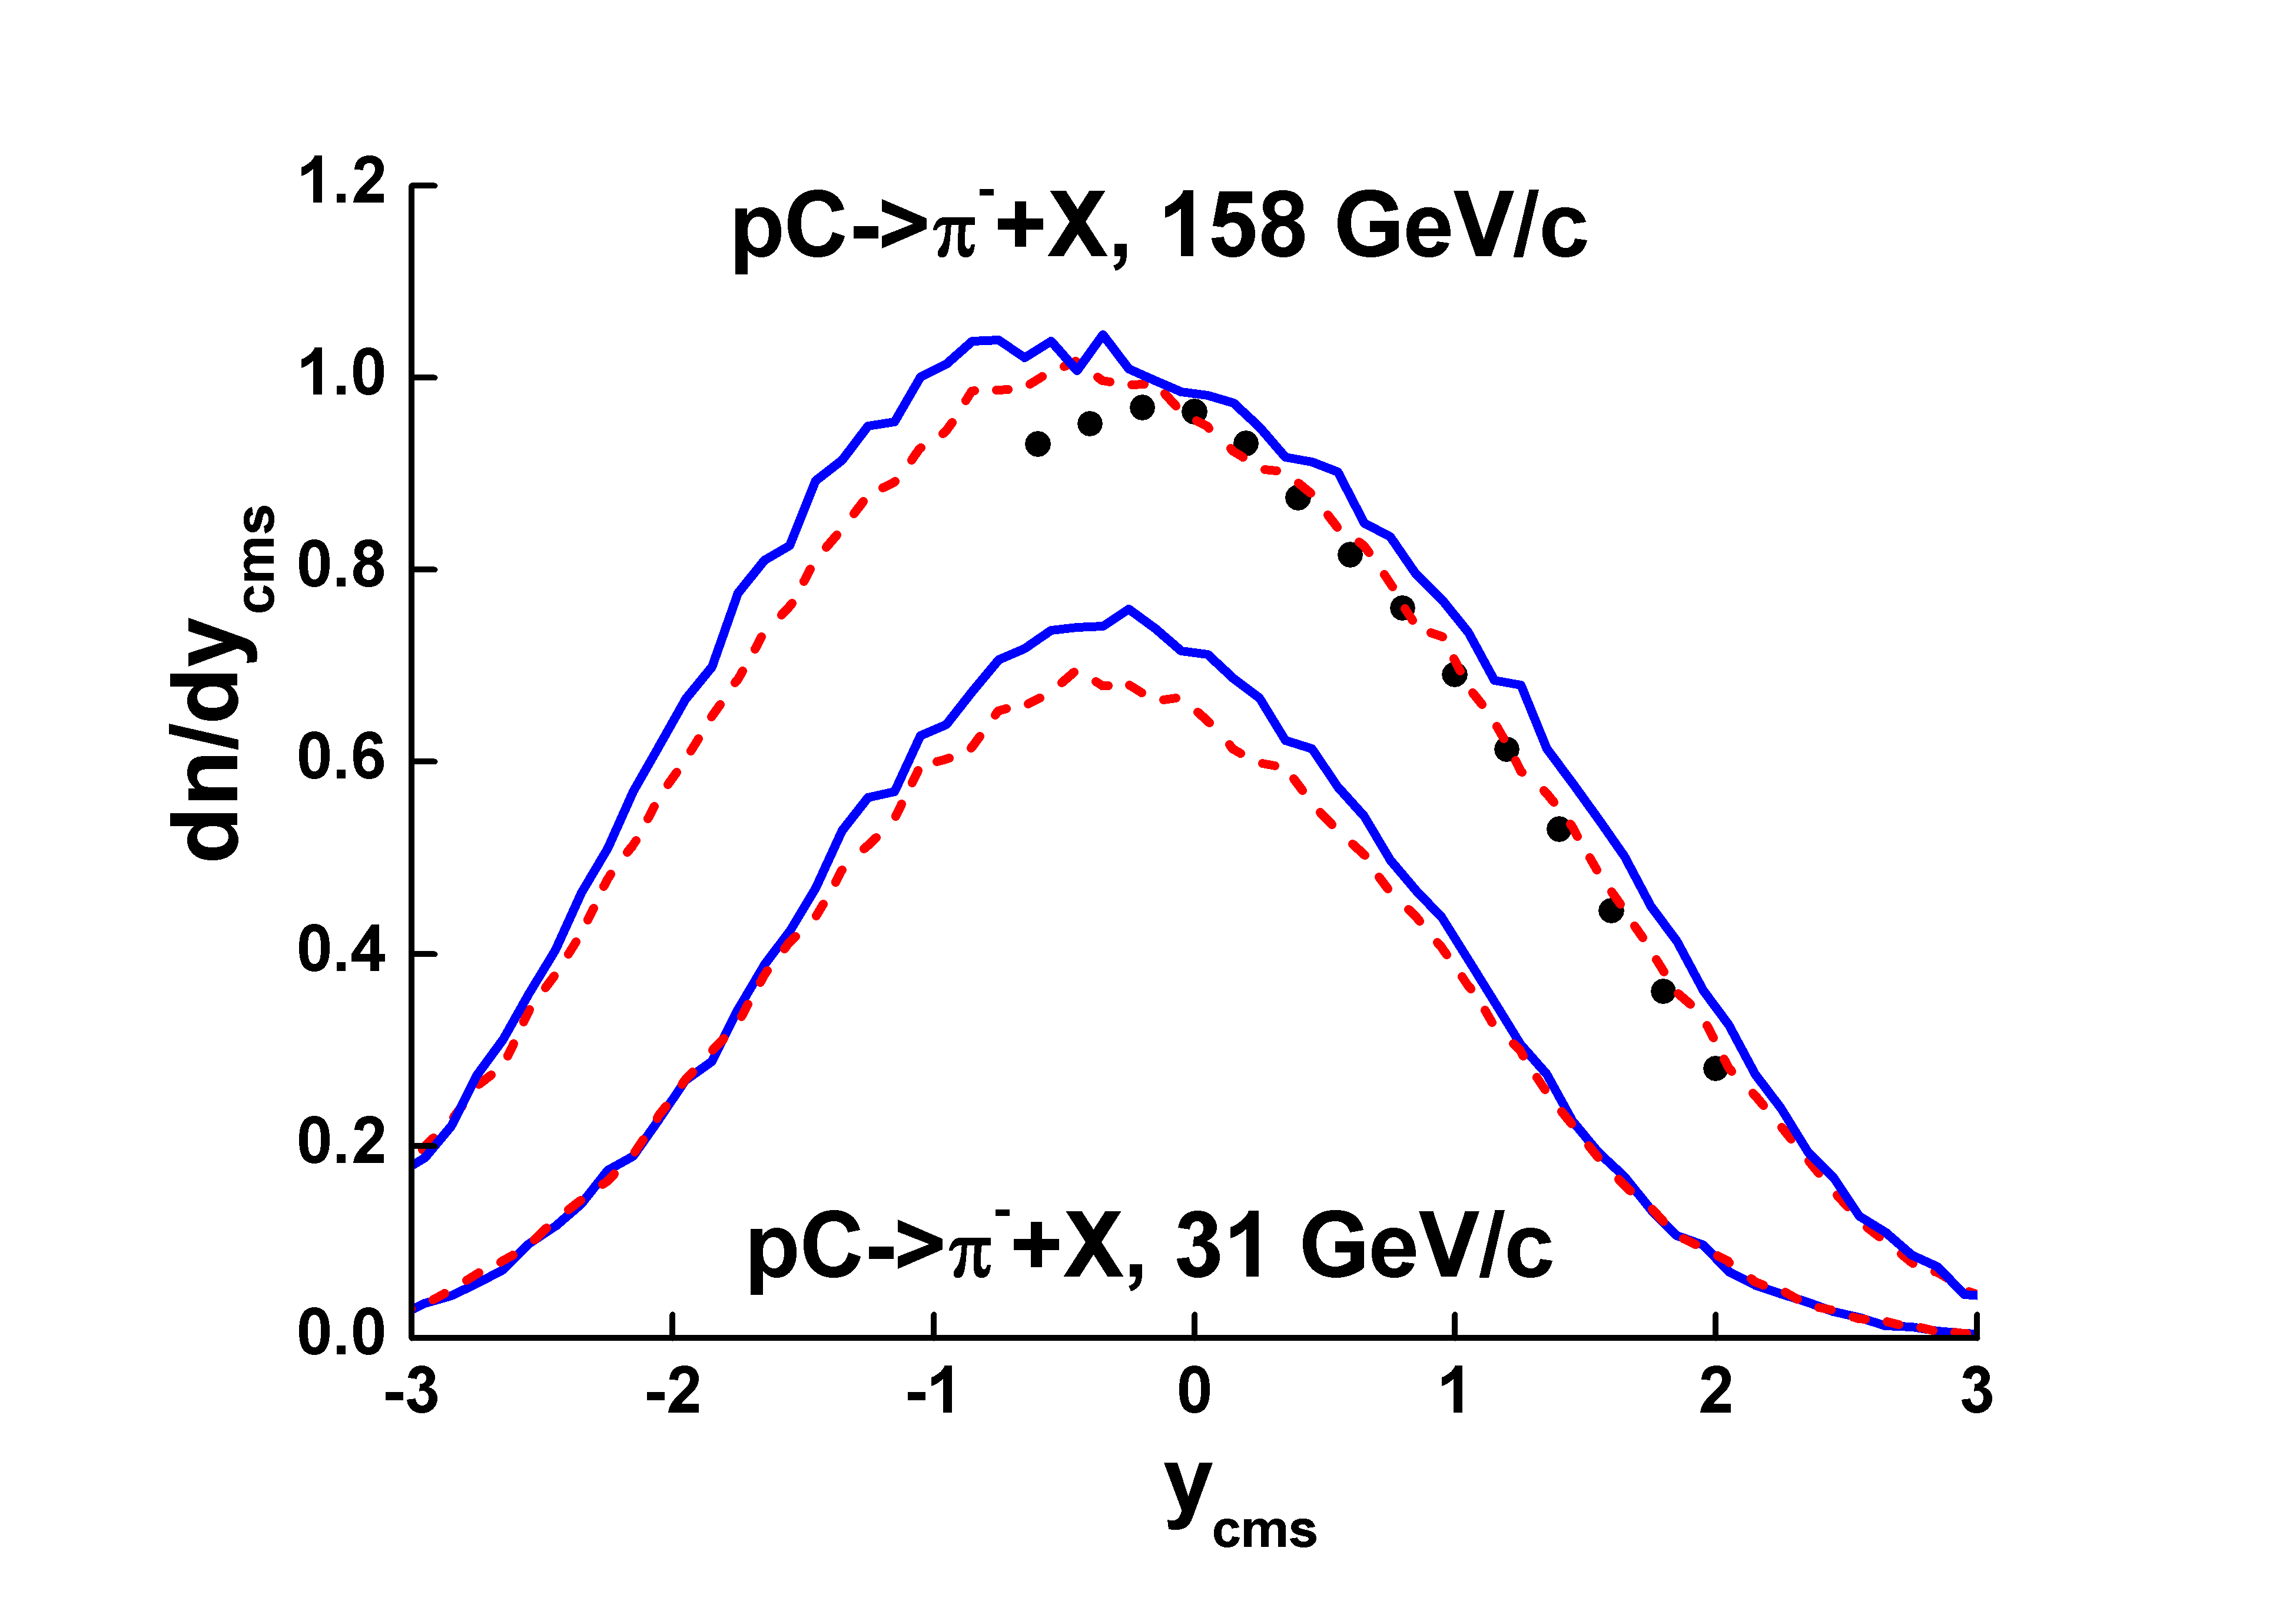
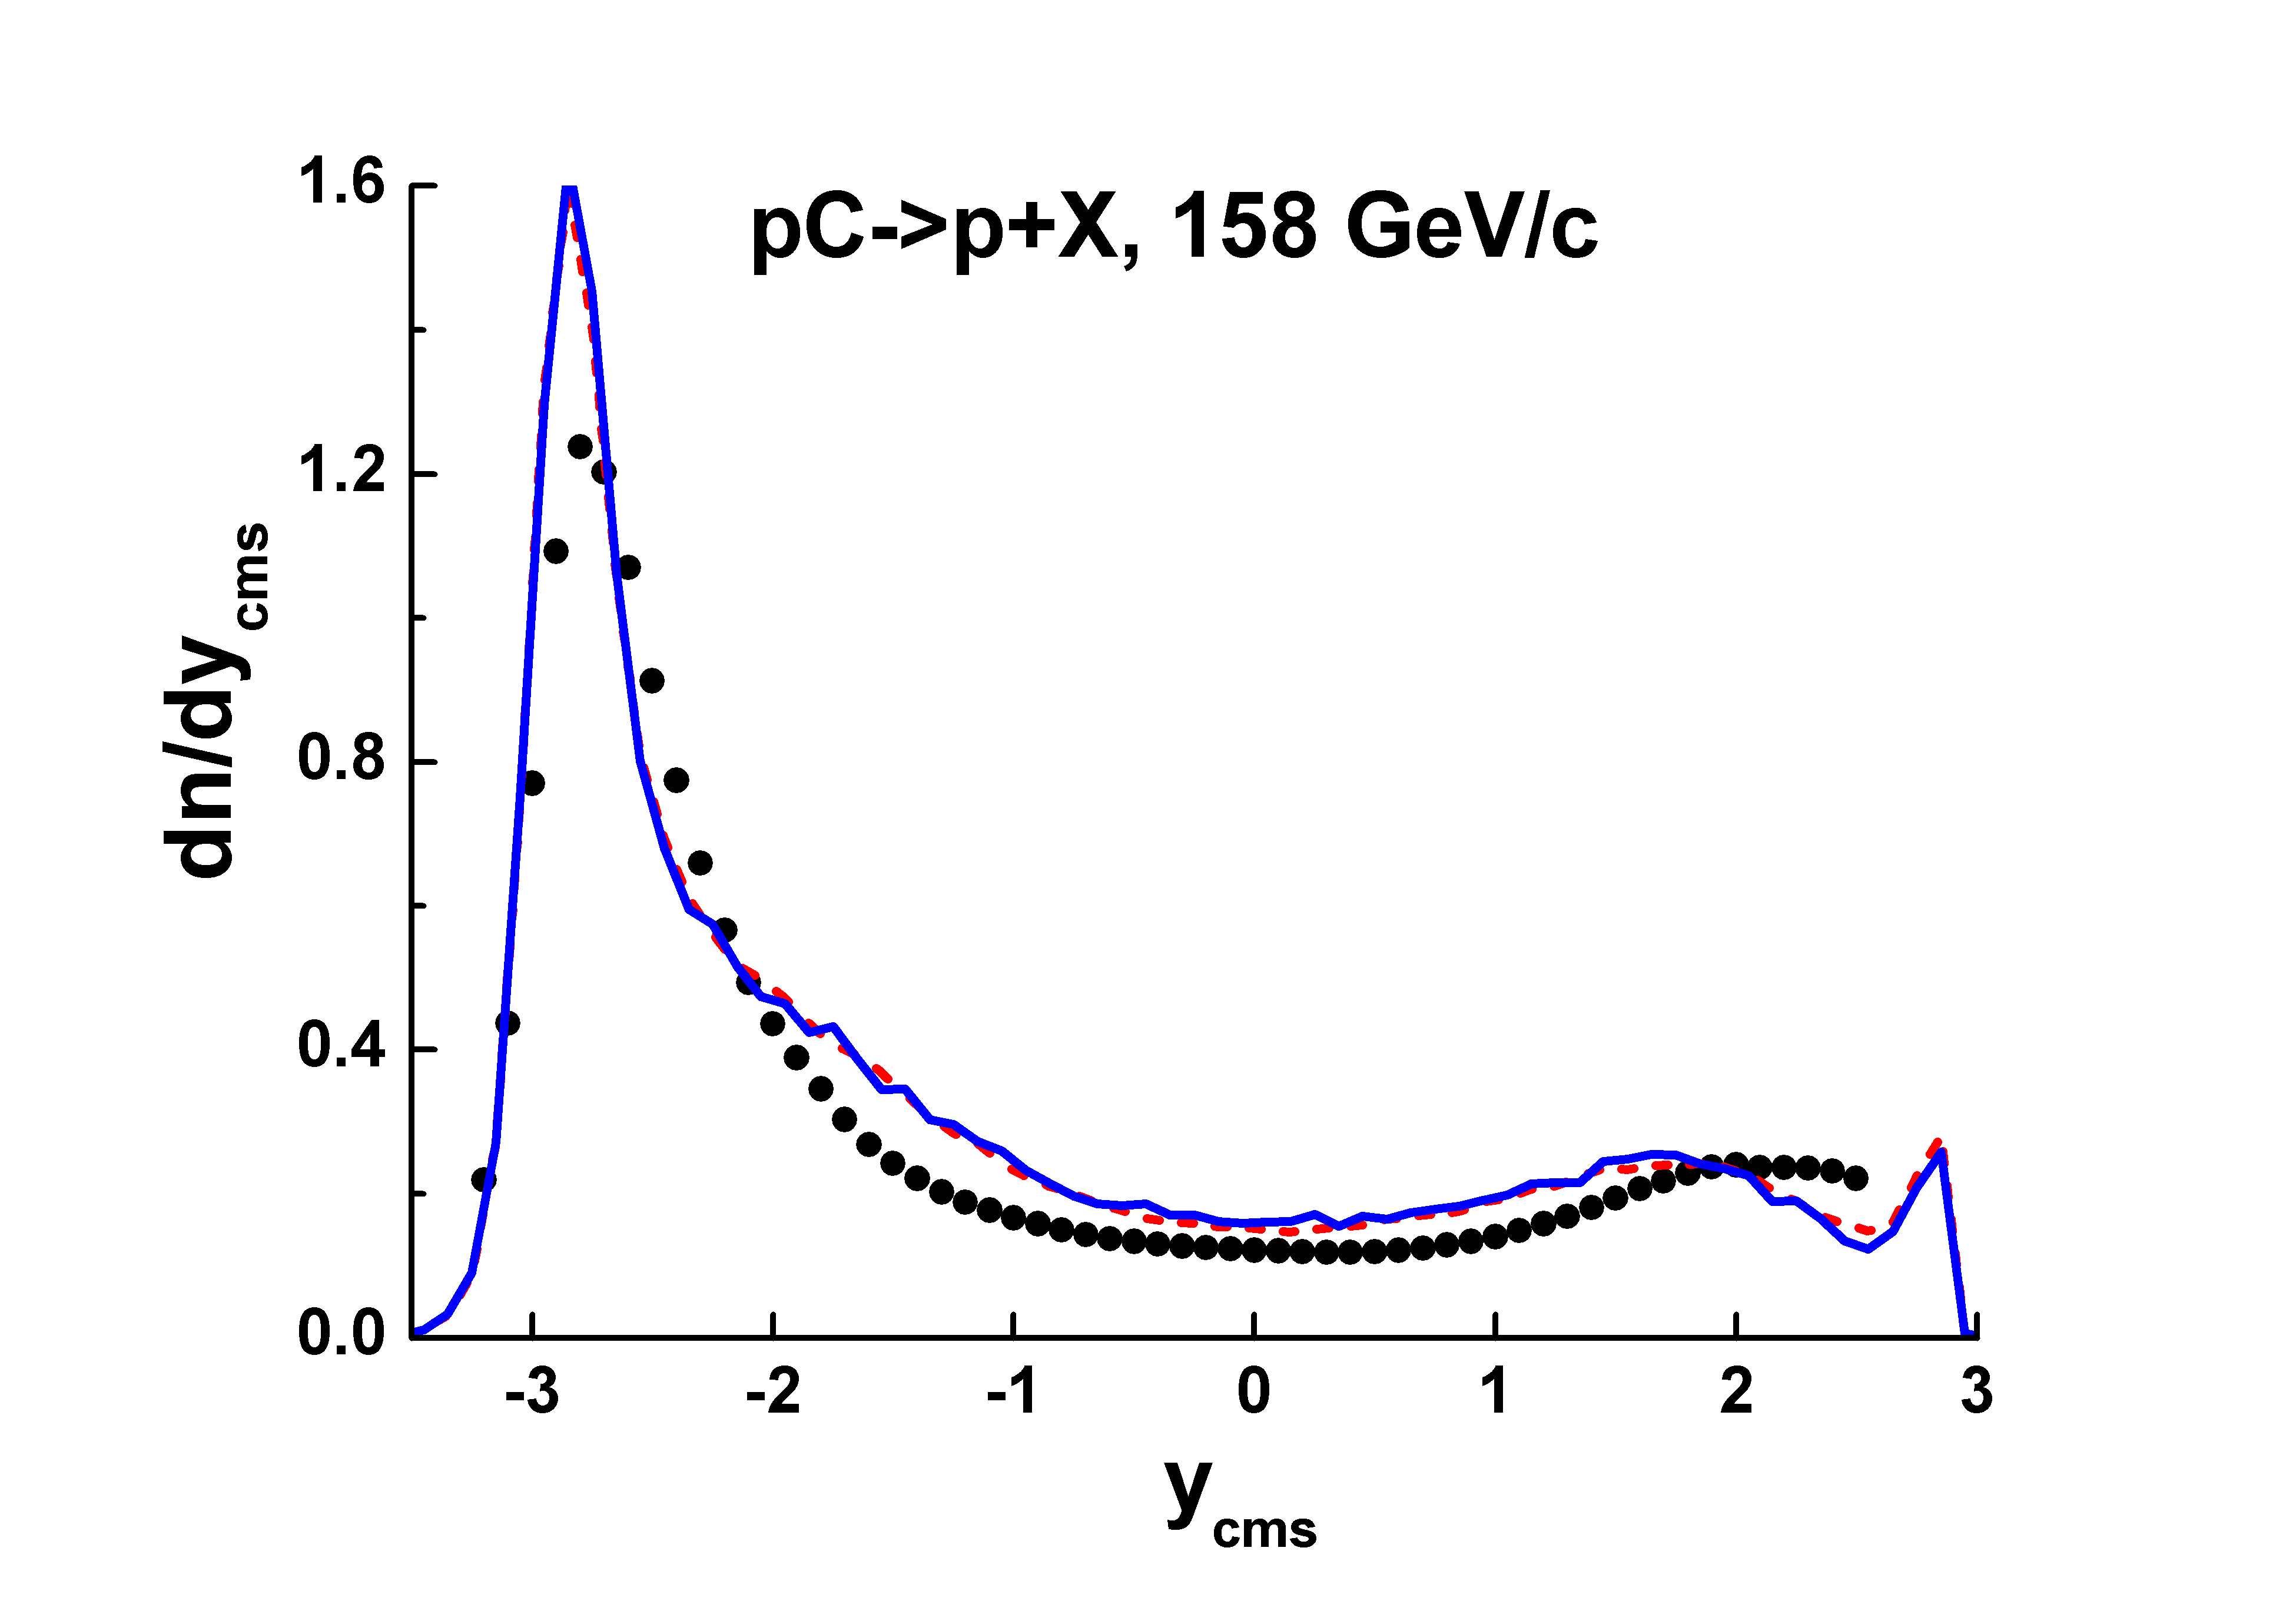
The difference becomes larger at lower energies, but it is lower than in -interactions. Thus one can suppose that the tuning is not important for nucleus-nucleus interactions.
According to the figure, the bad situation with the description of the proton spectrum in interactions is saved for interactions also.
Results of the tuned Fritiof 1.6 model are presented in Fig. 15. There are two variants of the model for hadron-nucleus and nucleus-nucleus interactions – with and without de-excitations of the created objects during intra-nuclear collisions. The variant without the de-excitations assumes that a mass of an object can only increase during the collisions, due to this a multiplicity of produced particles is also increased. As seen, the variant without the de-excitations allows to decribe the data.
As it was said above, the original version of the model did not consider the secondary particle cascading into nuclei. For a simulation of it, a reggeon theory inspired model [37] of nuclear destruction (RTIM) was attracted and implemented in the tuned variants. As seen, this allows to describe the proton spectrum in the target fragmentation region. A good description of the spectrum in the central region requires a good reproduction of the spectrum in -interactions.
Conclusion
-
1.
Simulations of the low mass diffraction dissociation is not correct enough in all Fritiof-based models.
-
2.
It would be well to implement a simulation of the binary reaction in all Fritif-based model, and improve their cross in the UrQMD model.
-
3.
It is no doubts that due to a fine tuning of the model’s parameters a successful description of meson production experimental data can be reached.
- 4.
References
- [1] NA61/SHINE Collaboration (N. Abgrall et al.) arXiv:1310.2417 [hep-ex].
- [2] NA49 Collaboration (C. Alt et al.), Eur. Phys. J. C45 (2006) 343;
- [3] NA49 Collaboration (T. Anticic et al.), Eur. Phys. J. C65 (2010) 9.
- [4] NA49 Collaboration (T. Anticic et al.), Eur. Phys. J. C68 (2010) 1;
- [5] NA49 Collaboration (C. Alt et al.), Eur. Phys. J. C49 (2007) 897. NA49 Collaboration (B. Baatar et al.), Eur. Phys. J. C73 (2013) 2364.
- [6] NA61/SHINE Collaboration (N. Abgrall et al.) Phys. Rev. C84 (2011) 034604.
- [7] V. Uzhinsky: arXiv:1107.0374 [hep-ph].
- [8] V. Uzhinsky: arXiv:1109.6768 [hep-ph].
- [9] V. Uzhinsky: arXiv:1308.0736 [hep-ph].
- [10] B. Andersson et al., Nucl. Phys. B281 (1987) 289.
- [11] B. Nilsson-Almquist and E. Stenlund, Comp. Phys. Commun. 43 (1987) 387.
- [12] X.-N. Wang and Miklos Gyulassy, Phys. Rev. D44 (1991) 3501.
- [13] M. Gyulassy and X.-N. Wang, Comput. Phys. Commun. 83 (1994) 307.
- [14] http://hepweb.jinr.ru/hijing_0_1/eval/
- [15] E.I. Alexandrov, V.M. Kotov, V.V. Uzhinsky, P.V. Zrelov: arXiv:1208.6439 [hep-ph].
- [16] S.A. Bass et al., Prog. Part. Nucl. Phys. 41 (1998) 225 ; M. Bleicher et al., J. Phys. G 25 (1999) 1859.
- [17] http://urqmd.org/
- [18] http://hepweb.jinr.ru/urqmd1_3/validation/urqmd_model_validation.htm
- [19] http://www.gsi.de/en/research/fair.htm
- [20] http://nica.jinr.ru/
- [21] GEANT4 Collaboration (S. Agostinelli et al.) Nucl. Instrum. Meth. A506 (2003) 250; GEANT4 Collaboration (J. Allison et al.) IEEE Trans. Nucl. Sci. 53 (2006) 270.
- [22] T. Sjöstrand, Comp. Phys. Commun. 39 (1986) 347.
- [23] T. Sjöstrand, Comp. Phys. Commun. 82 (1994) 74.
- [24] H.-U. Bengtsson and T. Sjöstrand, Comp. Phys. Commun. 46 (1987) 43.
- [25] L. Lönnblad, Comp. Phys. Commun. 71 (1992) 15.
- [26] L. Bodini et al., Nuov. Cim. A58 (1968) 475.
- [27] G. Alexander et al., Phys. Rev. 154 (1967) 1284.
- [28] E. Colton et al., Phys. Rev. D7 (1973) 3267.
- [29] J. Ginestet et al., Nucl. Phys. B13 (1969) 283.
- [30] V. Blobel et al., Nucl. Phys. B92 (1975) 221.
- [31] W.E. Ellis et al., Phys. Rev. Lett. 21 (1968) 697.
- [32] H. Boggild et al., Phys. Lett. 30B (1969) 369.
- [33] S.D. Drell and K. Hiida, Phys. Rev. Lett. 7 (1961) 199.
- [34] R. Deck, Phys. Rev. Lett. 13 (1964) 1969.
- [35] R.D. Schamberger et al., Phys. Rev. D17 (1978) 1268.
- [36] K. Goulianos and J. Montanha, Phys. Rev. D59 (1999) 114017.
-
[37]
Kh. Abdel-Waged and V.V. Uzhinsky, Phys. Atom. Nucl. 60 (1997) 828;
Yad. Fiz. 60 (1997) 925.
Kh. Abdel-Waged and V.V. Uzhinsky, J. Phys. G24 (1997) 1723.
EMU-01 Collab. (M.I. Adamovich et al.) Zeit. fur Phys. A358 337 (1997). - [38] V. Uzhinsky, A. Galoyan, Phys. Lett. B721 (2013) 68.
- [39] A.S. Galoyan, V.V. Uzhinsky, JETP Lett. 96 (2013) 564; Pisma Zh. Eksp. Teor. Fiz. 96 (2012) 632.