Difficulty Rating of Sudoku Puzzles: An Overview and Evaluation
Abstract
How can we predict the difficulty of a Sudoku puzzle? We give an overview of difficulty rating metrics and evaluate them on extensive dataset on human problem solving (more then 1700 Sudoku puzzles, hundreds of solvers). The best results are obtained using a computational model of human solving activity. Using the model we show that there are two sources of the problem difficulty: complexity of individual steps (logic operations) and structure of dependency among steps. We also describe metrics based on analysis of solutions under relaxed constraints – a novel approach inspired by phase transition phenomenon in the graph coloring problem. In our discussion we focus not just on the performance of individual metrics on the Sudoku puzzle, but also on their generalizability and applicability to other problems.
1 Introduction
What determines difficulty of problems for humans? Is there any relation between difficulty for humans and computational complexity for computers? Can we predict difficulty of problems algorithmically? Answers to these questions can give us an insight into human cognition and provide impulses for development of artificial intelligence. Moreover, these questions have important practical applications in human-computer collaboration and in training of problem solving skills, e.g., for developing intelligent tutoring systems [2, 3, 4].
Constraint satisfaction problems (CSP) are well suited for this kind of research, because many popular puzzles have natural CSP formulation. This is particularly the case of Sudoku puzzle, which is at the same time a “textbook example” of CSP and very popular puzzle.
1.1 Human Problem Solving and Problem Difficulty
Although human problem solving has been studied for at least 40 years [36], the issue of problem difficulty has not been properly explored. Results are available only for several specific puzzles (mostly transport puzzles): Tower of Hanoi (and its izomorphs) [18], Chinese rings [19], 15-puzzle [35], traveling salesman problem [6], Sokoban [13], and Rush hour puzzle [15]. The main reason for the scarceness of research in this important area is probably the difficulty of obtaining sufficient data for analysis of human problem solving. To estimate “human difficulty” of a problem we need many people to solve it; to study techniques for predicting problem difficulty we need data on many problems; thus we need data from hundreds of hours of problem solving. It is practically impossible to obtain data of such extend using the traditional laboratory approach to data collection.
However, the advent of ubiquitous Internet allows a scalable alternative to the traditional approach to data collection. In our other work [13, 15], we build our own web portal and use it to collect data on human problem solving. In this work, we exploit the popularity of the Sudoku puzzle and use data from several web servers. In this way we have been able to obtain (rather easily and quickly) data capturing hundreds of thousands of hours of human problem solving activity (approximately 2000 puzzles, hundreds of human solvers for each puzzle). This means that our data are several orders of magnitude more extensive than the usual data used in study of human problem solving – most previous research uses data based on tens or hundreds of hours of human problem solving activity (usually about 20 people and 5 puzzles). Even though this way of data collection has its disadvantages (e.g., lack of direct control over participants), we show that thanks to the scale of the “experiment”, the data are robust and applicable for research purposes.
In this work we study the problem difficulty of one particular problem – the Sudoku puzzle. We describe difficulty rating metrics for the Sudoku puzzle, and evaluate their correlation with human performance (measured by time). This goal has direct applications – such metrics are heavily used since Sudoku is currently very popular and even commercially important [22], and the difficulty rating of puzzles is one of the key things which influence the user’s experience of puzzle solving. Despite the straightforwardness of our goal and its direct applicability, there is no easily applicable theory that could be used to guide the development of difficulty rating metrics. Currently used Sudoku metrics are usually built in an ad hoc manner, they are not properly evaluated and their merits are not clear.
Although we only analyze data on a single puzzle, the aim of this work goes beyond the specific study of Sudoku. We would like to raise interest in the study of problem difficulty, for example by showing that extensive and robust data for study are easily available on the Internet. Our main goal is not to get “the best Sudoku rating metric”, but rather to get an insight into problem difficulty, which could be applied also to other problems. Therefore, we do not focus just on the performance of individual metrics, but also on their generalizability and potential applicability to other problems.
1.2 The Sudoku Puzzle
Sudoku is a well-known number placement puzzle: for a partially filled grid, the goal is to place numbers 1 to 9 to each cell in such a way that in each row, column, and sub-grid, each number occurs exactly once. We focus on the Sudoku puzzle for several reasons. The main reason has already been stated above – thanks to the current popularity of Sudoku, we can easily obtain large scale data on human solving activity. Moreover, the Sudoku puzzle has very simple rules, which makes it suitable for extensive analysis. Finally, Sudoku is also a member of an important class of constraint satisfaction problems. The class of constraint satisfaction problems contains many other puzzles and also many real life problems (e.g., timetabling, scheduling). Although we use data for the Sudoku puzzle, our goal is to make the analysis and difficulty metrics as general as possible, so that the results are potentially applicable to other constraint satisfaction problems.
Sudoku has been the subject of many research studies, particularly with respect to its mathematical and algorithmic properties, e.g., enumerating possible Sudoku grid [7], NP-completeness of generalized version of Sudoku [38], formulation as constraint satisfaction problem [37, 26], and application of a large number of artificial intelligence and constraint satisfaction techniques for solving and generating Sudoku puzzles [27, 32, 8, 39, 25, 31, 9, 30, 16, 10, 29]. Also some psychological aspects of the puzzle have been studied [23].
The difficulty rating of Sudoku puzzles is, of course, not a novel problem. The issue of the Sudoku difficulty rating is widely discussed among Sudoku players and developers, but it has not been a subject of a serious scientific evaluation. Current rating algorithms are based mainly on personal experiences and ad hoc tuning. There are several research papers which discuss methods for difficulty rating [37, 27, 11]; however, these works study the correlation of proposed metric with the difficulty rating provided by the puzzle source (usually a newspaper), not with the data on human performance. Such analysis is not very meaningful since the rating provided in puzzle sources is just another rating provided by a computer program (nearly all published puzzles are generated and rated by a computer). The only work that we are aware of and that uses data on real human performance is the brief report by Leone et al. [24]. We have reported on preliminary versions of this research in [33, 34].
1.3 Contributions
We provide an analysis of the used datasets on Sudoku solving, and using these datasets we evaluate different approaches to the difficulty rating of Sudoku puzzles.
The first class of metrics is based on direct modeling of human problem solving of Sudoku puzzles, i.e., the use of “logic techniques” to solve the puzzle, which corresponds to the constraints propagation approach in CSP solving. Here we determine two main aspects of problem difficulty. The first is the complexity of individual steps (logic operations) involved in solving the problem – this is the usual approach used for rating Sudoku puzzles (see e.g., [17, 8]). We show that there is also a second aspect that has not yet been utilized for difficulty rating – the structure of dependency among individual steps, i.e., whether steps are independent (can be applied in parallel) or whether they are dependent (must be applied sequentially). We provide a simple general model that captures both of these aspects. We show that even with rather simple rating metric with few Sudoku-specific details we can obtain hight correlation with human performance – the Pearson’s correlation coefficient is 0.88. By combination with previously proposed Sudoku-specific metrics we improve the correlation to 0.95.
Metrics based on modeling human behaviour using constraint propagation give very good prediction, but they are not easily applicable to other problems. Sudoku has very simple rules and thus it is quite easy to formalize human “logic techniques”. Even for similar and still rather simple problems (like a Nurikabe puzzle), it can be quite difficult to formulate human logic techniques (choose suitable constraint propagation rules) and thus obtain a model of human problem solving and a good rating metric.
Therefore, we also study other types of metrics. We found an interesting approach to difficulty rating, which is based on analysis of solutions under relaxed constraints. This novel technique is inspired by phase transition phenomenon in random constraint satisfaction problems (particularly in the graph coloring problem) [5, 28, 20]. Metrics inspired by notions like freezing [20] and backbone variable [28] are slightly worse than metrics based on the constraint propagation approach, but the constraint relaxation metrics is much easier to transfer to other problems than the model-based approach (as we illustrate on the case of Nurikabe puzzle) and it gives an interesting insight into human problem solving – it does not mimic human thinking and yet it can predict it.
We also describe experiments with metrics based on other algorithmic approaches to solve Sudoku (e.g., backtracking search, simulated annealing). However, these metrics lead to poor predictions, sometimes even worse than the baseline metric “number of givens”.
2 Background
In this section we provide background information about constraint satisfaction problems, the Sudoku puzzle, and datasets used for evaluation.
2.1 Constraint Satisfaction Problems and the Sudoku Puzzle
The Sudoku puzzle can be formulated as a constraint satisfaction problems. A constraint satisfaction problem is given by a set of variables , a set of domains of variables , and a set of constraints . Each constraint involves some subset of variables and specifies allowed combinations of variable values (usually given in a symbolic form, e.g., ). A solution of a constraint satisfaction problem is an assignment of values to all variables such that all constraints are satisfied. The class of CSPs contains many puzzles (e.g., the eight queen problem, the cryptarithmetic puzzle) as well as many important practical problems (map coloring problems, timetabling problems, transportation scheduling).
Sudoku puzzle is a grid of cells, which are divided into nine sub-grids, partially filled with numbers 1 to 9. The solution of the puzzle is a complete assignment of numbers 1 to 9 to all cells in the grid such that each row, column and sub-grid contains exactly one occurrence of each number from the set . Sudoku puzzle is well-posed, if it admits exactly one solution. We study only well-posed puzzles.
Sudoku puzzle can be easily generalized for any grid size of and values from 1 to [37]. Moreover, there are many variants of Sudoku which use non-regular sub-grids (e.g, pentomino), or additional constraint (e.g., arithmetic comparison of values). In this work we use Sudoku puzzle (Fig. 1) as a small illustrating example, otherwise we consider solely the classical Sudoku puzzles.
Sudoku can be easily expressed as a constraint satisfaction problem [37]. Consider an example of a Sudoku given in Fig. 1; each cell corresponds to one variable, the domain of each variable is a set and the constraints express non-equality of variables and constants in the same row, column or sub-grid, e.g., for variable we have the following constraints: .
Sudoku can also be viewed as a special case of a graph coloring problem, which is a particularly well-studied CSP. Given a graph , the problem is to decide whether its vertices can be colored by colors in such a way that no two vertices connected by an edge share a color. For the Sudoku puzzle, we can construct a “Sudoku graph” (see Fig. 1). The Sudoku puzzle thus becomes 9-colorability problem for the graph with an initial color assignment111Note that it is also possible to reduce Sudoku to pure graph coloring problem by adding vertices corresponding to numbers 1 to 9.. The connection between Sudoku and graph coloring is further elaborated by Herzberg and Murty [12].

2.2 Solving Sudoku
Now we discuss algorithmic approaches to Sudoku solving and comment on their relation to human solving.
2.2.1 Backtracking
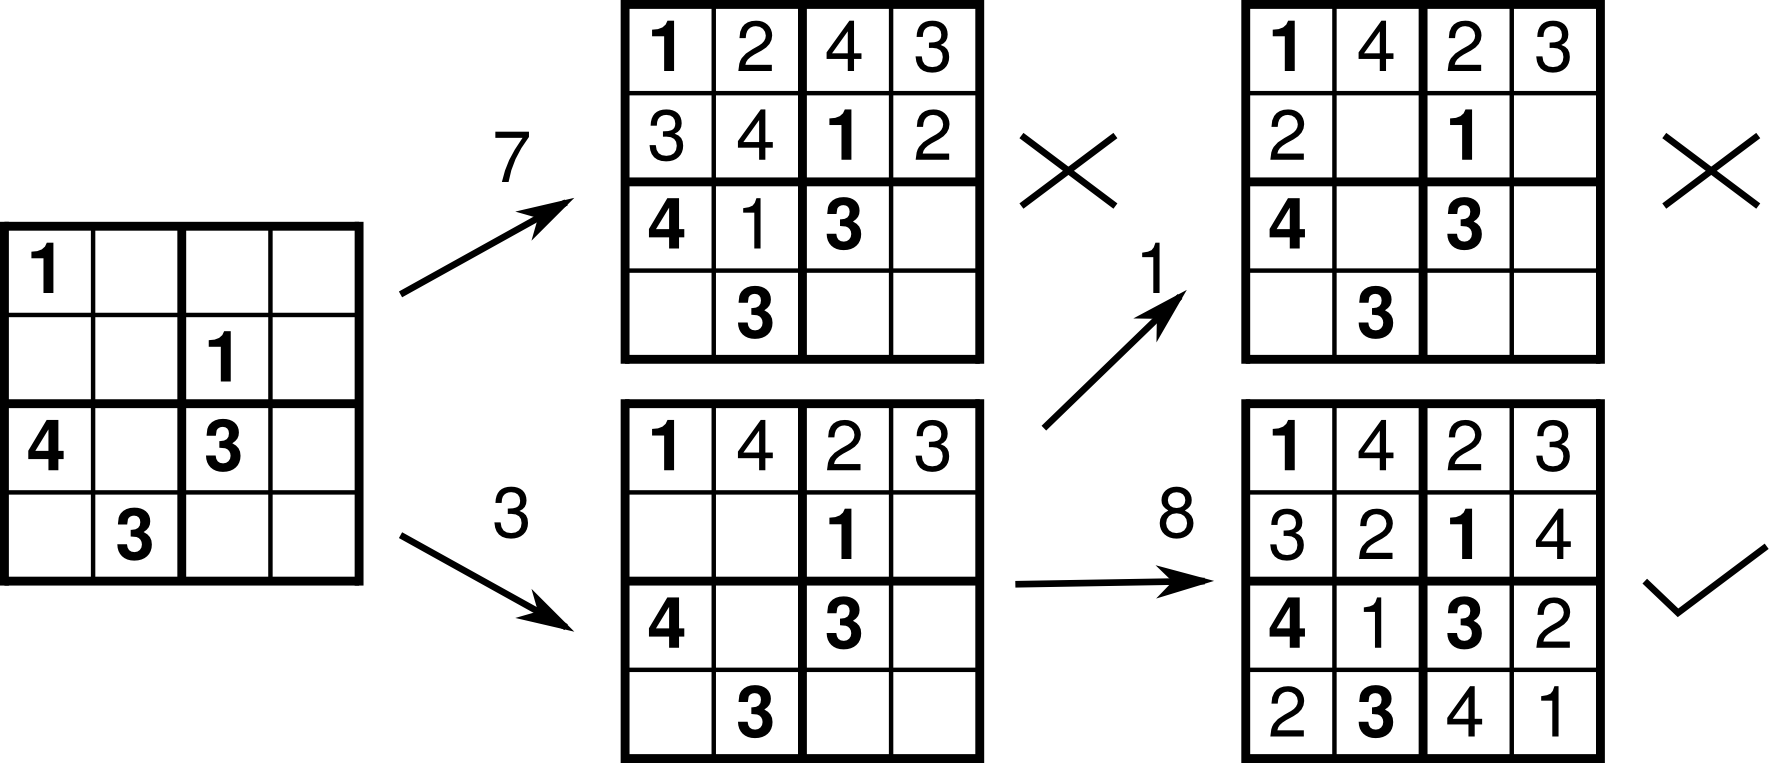
The basic approach to solving CSPs is the backtracking search. It starts with an empty variable assignment and tries to find a solution by assigning values to variables one by one. Whenever it finds a violation of a constraint, it backtracks. In this way the search explores the tree of feasible partial assignments. Fig. 2 shows the search tree for a sample Sudoku (for readability of the figure we select variables “by rows”, a more efficient approach is to select the most constrained variable in each step).
The run time of a backtracking algorithm grows exponentially with the number of variables. Nevertheless, the Sudoku puzzle can be easily solved by computer using the backtracking search. For humans, however, this is not a favoured approach. As can be seen in Fig. 2, even for a small Sudoku, some branches in the search can be quite long. For humans, systematic search is laborious, error-prone, and definitely not entertaining.
2.2.2 Constraint Propagation
Another approach to solving CSP is to find values of (some) variables by reasoning about constraints. For each variable we define a current candidate set – a set of such values that do not lead to direct violation of any constraint (see Fig. 1). By reasoning about candidate sets and constraints we can often derive solution without any search.
For our example from Fig. 1, it is easy to see that the value of variable must be , because constraints restrict the domain of the variable to a single value. Thus we can assign the value to the variable without any search. Using this partial assignment we can straighten constraints on other variables (and show, for example, that also has to be ).
Constraint propagation is not guaranteed to find a solution, but it may be more efficient than backtracking search and can also be combined with backtracking search to produce superior results. We are interested in constraint propagation particularly because this is the natural way how humans try to solve CSPs.
Let us consider specifically the case of the Sudoku puzzle. Human solving of Sudoku proceeds by sequence of steps in which (correct) values are filled into cells. Two basic techniques directly correspond to the rules of the puzzle (see also Fig. 1):
- Naked single technique
-
(also called singleton, single value, forced value, exclusion principle): For a given cell there is only one value that can go into the cell, because all other values occur in row, column or sub-grid of the cell (any other number would lead to a direct violation of rules).
- Hidden single technique
-
(also called naked value, inclusion principle): For a given unit (row, column or sub-grid) there exists only one cell which can contain a given value (all other placements would lead to a direct violation of rules).
Sudoku problems solvable by iteration of these two techniques are further denoted as “simple Sudoku”. Most of the publicly used puzzles which are ranked as easy or mild are simple Sudokus. There exists many advanced techniques, such as pointing, chaining, naked and hidden pairs (see, e.g., Sudoku Explainer [17]), but we do not elaborate on these techniques in order to keep Sudoku-specific details minimized.
2.2.3 Other Approaches
Due to the popularity of Sudoku, researches have used the Sudoku puzzle as a case study for large number of artificial intelligence techniques, for example: neural networks [39]; simulated annealing [25]; genetic algorithms [27], gramatical evolution [31], and harmony search [9]; particle swarm optimization [30], bee colony optimization and artificial immune system optimization [16]; message passing [10] and belief propagation [29].
Most of these approaches, however, are not very successful – they are usually significantly slower than a straightforward combination of backtracking and constraint propagation222It is a rather simple programming exercise to write a Sudoku solver which can solve 1000 Sudoku puzzles under 1 second using backtracking and constraint propagation., most of them even cannot solve all Sudoku puzzles. Nevertheless, our focus here is not the computational performance, but on predicting human results. But even in this aspect these techniques do not seem promising. They are usually based on randomized local improvement and parallel search using a population of candidate solutions – these approaches do not bear much resemblance to human problem solving and thus it does not seem plausible that these techniques could be useful for predicting human behavior. Results for difficulty rating metrics based on two of these techniques (simulated annealing, harmony search) [21] support this intuition, and therefore we do not further elaborate on these approaches.
2.3 Data on Human Sudoku Solving
Now we describe the data on human problem solving activity that we use for evaluation of difficulty metrics and provide analysis of the data.
2.3.1 Data Sources
For obtaining data on human problem solving we exploited the current popularity of on-line puzzle solving and particularly the popularity of Sudoku puzzle. The data were obtained from three Sudoku web portals. The individual data entries obtained from such a source have worse quality than data from controlled laboratory experiments (e.g., it is probable that some solvers where distracted while solving a puzzle). However, in this way we can obtain significantly more data (by several orders of magnitude) than is feasible from any laboratory experiment. As we demonstrate, the data are very robust and thus can be used for evaluation.
The first dataset is from the web portal fed-sudoku.eu from the year 2008. We have in total 1089 puzzles, the mean number of solvers is 131 per puzzle. For each solution we have the total time taken to complete the puzzle. Each solution is identified by a user login, i.e., we can pair solutions by the same user. Most users solved many puzzles, i.e., the data reflect puzzle solving by experienced solvers. The server provides listings of results and hall of fame. Thus although there is no control over the users and no monetary incentives to perform well, users are well motivated.
The second dataset is from the web portal sudoku.org.uk. The data are from years 2006-2009; there was one puzzle per day. In this case we have only summary data provided by the server: total number of solvers (the mean is 1307 solvers per puzzle) and the mean time to solve the puzzle (no data on individual solvers). We have data about 1331 puzzles, but because of the significant improvement of human solvers during years 2006 and 2007 we have used for the evaluation only 731 puzzles (see the discussion bellow).
The third dataset is from the web portal czech-sudoku.com. This web portal was used in a different way from the other two. The portal provides not just the time to solve the puzzle, but also the record of each play. More specifically, each move (filling a number) and time to make the move are stored. From this portal we analyzed these detailed records for about 60 users and 15 puzzles.
2.3.2 Analysis of Data
As a measure of problem difficulty for humans we use the mean solution time. Since our data do not come from a controlled experiment and mean is susceptible to outlier values, it is conceivable that this measure of difficulty is distorted. To get confidence in this measure of problem difficulty, we analyzed the robustness of the detailed data from fed-sudoku.eu portal. In addition to mean we also computed median time, median time for active solvers (those who solved more than 900 puzzles), and mean of normalized times (normalized time is the ratio of solution time to mean solution time of the user). All these metrics are highly correlated (in all cases ). Thus it seems that is is not very important in which particular way we choose to measure the human performance. In fact, the use of median, which is a more stable metric than mean, leads to slightly better results for all studied metrics for the fed-sudoku.eu dataset. Nevertheless, for consistency we use as a difficulty measure the mean (for the sudoku.org.uk we do not have any other data). The relative ordering of rating techniques is not dependent on this choice.
Another issue that has to be considered is the improvement of human problem solving capacities during time. Are solvers getting consistently better and thus distorting our “mean time” metric of puzzle difficulty? In both our datasets there is a correlation between time to solve a puzzle and a number of days since the start of the “experiment”. This correlation is presumably caused by improvement in users abilities to solve the puzzle. For fed-sudoku.eu the correlation is and it is statistically significant; however, it is not statistically significant within first half of the year and the results for the first half of the year and the whole year are nearly identical. For the sudoku.org.uk dataset the correlation is more important and it does distort results. Over the whole set the correlation is , which is caused particularly by the improvement during the first two years. For the analysis we use only data after 600 days, for these data the correlation is not statistically significant.
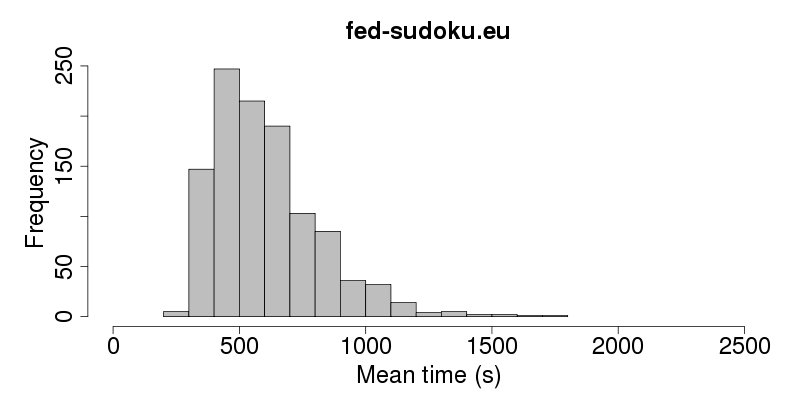
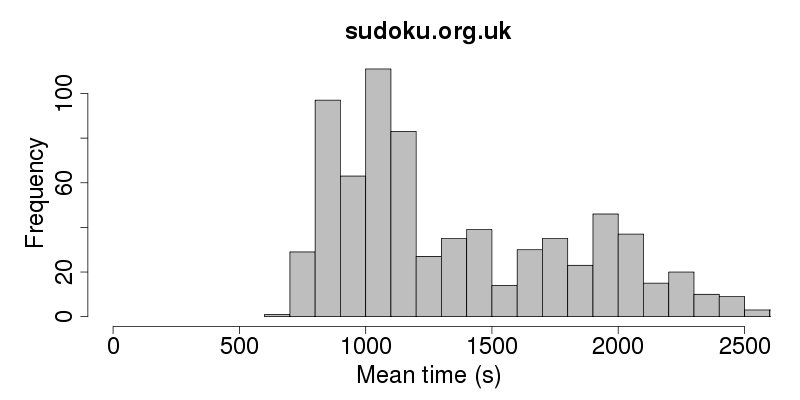
Fig. 3 shows histograms of mean time for the two datasets. Solution times for the fed-sudoku.eu are smaller than for sudoku.org.eu (mean solution time 8 minutes versus 23 minutes) and have smaller variance. We suppose that the main reason is that fed-sudoku.eu is used mainly by rather expert puzzle solvers, whereas sudoku.org.eu by general public, and sudoku.org.eu also seems to include more difficult puzzles (we can compare the difficulty of puzzles only indirectly via our metrics). This diversity between the two datasets is an advantage – despite the difference, our main results (Section 4) are the same over both datasets, and thus we can be quite confident that the results are not an artifact of a particular dataset.
3 Predicting Human Behaviour
Our main aim is the difficulty rating, i.e., predicting the time to solve a puzzle. But we are also interested in predicting human behaviour during problem solving, i.e., predicting the order of cell filling. Such prediction can be useful for example for application in tutoring systems [4] or for detection of cheating in Internet Sudoku competitions (if the user fills repeatedly cells in wrong order, then it is probable that he did use computer solver to solve the puzzle).
3.1 Computational Model of Human Solver
A straightforward333Straightforward in principle, not necessary in realization. approach to predicting human behaviour is to develop a computational model of human behaviour and then simulate it. We describe a general model of a human Sudoku solving, and provide a concrete instantiation, which we evaluate using the data on human problem solving.
3.1.1 General Model
We propose a simple model of human CSP solving, which is based on the following assumptions444We are not aware of any scientific research which could be used to support these assumptions, but there is ample support for them in popular books about puzzle solving. As we show later, our model, which is based on these assumptions, gives good prediction of human behaviour and thus provides indirect support for these assumptions.. Humans are not good at performing systematic search, and they are not willing to do so. Humans rather try to solve CSPs by ‘logic techniques’, i.e., by constraint propagation. Moreover humans prefer ‘simple’ techniques over ‘difficult’ ones (we elaborate on difficulty of logic techniques bellow).
The model proceeds by repeatedly executing the following steps until a problem is solved (see Fig. 4 for illustration):
-
1.
Let be the simplest logic technique which yields for the current state some result (variable assignment, restriction of a candidate set).
-
2.
Let by an action which can be performed by the technique . If there are several possibilities how to apply in the current state, select one of them randomly.
-
3.
Apply and obtain new current state.
Note that this model makes two additional simplifying assumptions: 1) a solver does not make any mistakes (i.e., no need to backtrack); 2) a solver is always able to make progress using some logic technique, i.e., a solver does not need to perform search. These assumptions are reasonable for Sudoku puzzle and are supported by our data on human problem solving. For other CSPs it may be necessary to extend the model.

3.1.2 Logic Techniques and Their Difficulty Rating
To specify the stated abstract model, we have to provide list of logic techniques and their difficulty rating. The usual approach used by Sudoku tools is based on a list of logic techniques which are supposed to be simulations of techniques used by humans; each of these techniques is assigned difficulty rating. This rating is provided by the tool developer, usually based on personal experience and common knowledge. Table 1 gives an example of such ratings.
| Technique | Rating | Technique | Rating |
|---|---|---|---|
| Hidden single | 1.2 | Naked Single | 2.3 |
| Direct Pointing | 1.7 | Direct Hidden Triple | 2.5 |
| Direct Claiming | 1.9 | Pointing | 2.6 |
| Direct Hidden Pair | 2.0 | Claiming | 2.8 |
This approach has the disadvantage that it contains lot of ad hoc parameters and it is highly Sudoku-specific, i.e., it gives us limited insight into human problem solving and it is not portable to other problems (the success of the approach is based on significant experience with the problem).
We propose an alternative approach to classification of logic techniques. The approach is based on the assumption that many advanced logic techniques are in fact “short-cuts” for a search (what-if reasoning).
We therefore provide rating of difficulty of logic techniques with the use of search. This approach contains nearly no parameters and is not specific to Sudoku (i.e., it is applicable to any CSP). The only Sudoku specific issue is the selection and realization of “simple” techniques – in our case these are hidden single and naked single techniques (note that these techniques are basically derived from the rules of the problem). For most CSP problems it should be possible to derive basic simple techniques on a similar basis.
Let us suppose that we have a state in which the specified simple techniques do not yield any progress. For each unassigned variable (empty cell) we compute a “refutation score”, this score expresses the difficulty of assigning the correct value to this variable in the given state by refuting all other possible candidates.
For each wrong candidate value we denote the smallest number of simple steps which are necessary to demonstrate the inconsistency of the assignment. The “ideal refutation score” is obtained as a sum of values . If some of the values is not refutable by simple steps, we set the score to .
The computation of can be done by breadth-first search over possible puzzle states, but it is computationally expensive and anyway the systematic search does not correspond to human behavior. Therefore, we use randomized approach analogical to our main model – instead of computing the smallest number of steps necessary to refute a given value, we just use a randomized sequence of simple steps and count the number of steps needed to reach an inconsistency.
The variable (cell) with the lowest score is deemed to be the easiest to fill and the refutation score is used as a difficulty rating of an unknown logic technique. For all our considered Sudoku puzzles there was always at least one cell with finite score; for more complex problems it may be necessary to further specify the model for the case that all refutation scores have value .
3.1.3 Evaluation of the Model
Using the described notions we specify a “Simple Sudoku Solver” (SiSuS) model: the general model described in Section 3.1.1 with two hard-wired logic techniques (hidden single, naked single) of equal difficulty which uses refutation score when the basic techniques are not applicable (note that the model does not contain any numerical parameter values of the type described in Table 1).
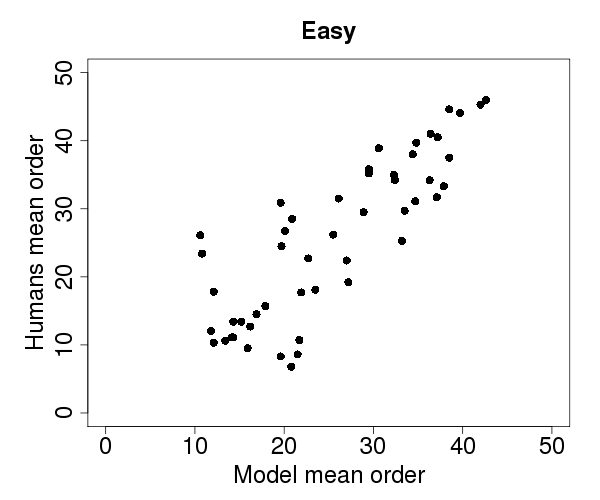
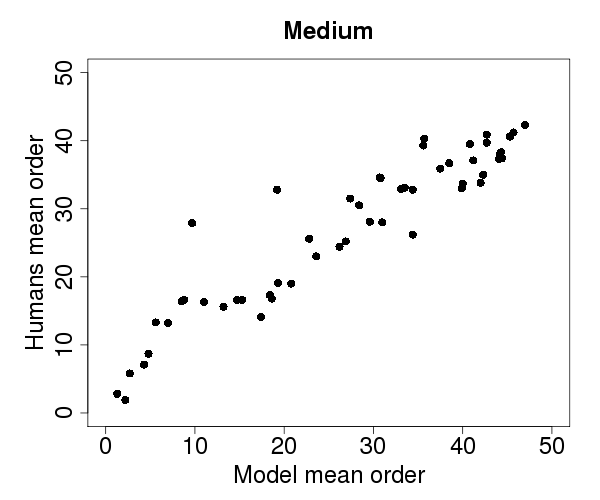
We have evaluated the SiSuS model over detailed records from czech-sudoku.com. To evaluate our model we compare the order in which the cells are filled by humans and the model. For the evaluation we used 15 selected puzzles of wide range of difficulty (from very easy to very difficult). Each puzzle was solved by 10 to 60 solvers.
 |
 |
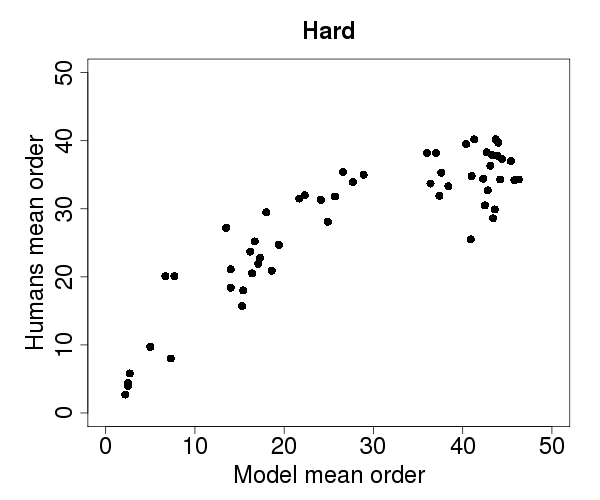 |
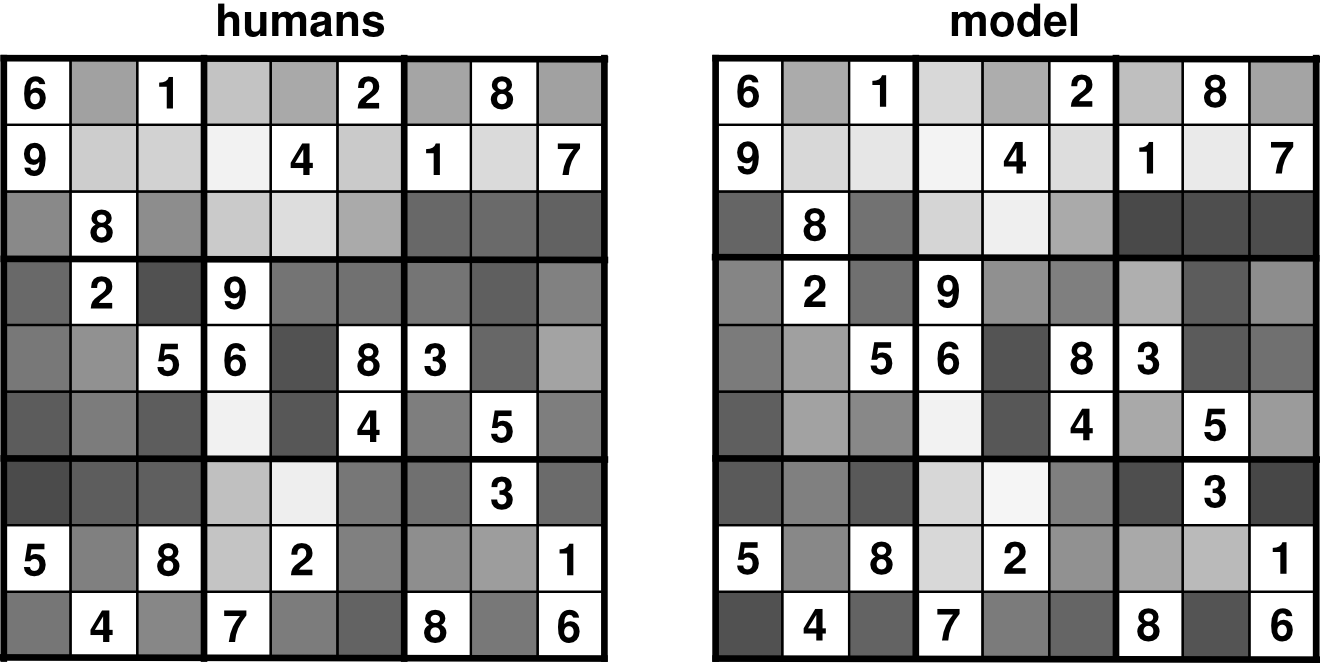
Based on the records of human solvers we computed the mean order for each cell. Similarly we computed for each cell mean order over 30 randomized runs of the model. Fig. 5 shows visualization of order of cell filling for humans and the model. Fig. 6 provides scatter plots for three sample puzzles (the puzzles were manually selected to be representative of the results). In most cases the correlation coefficient is between 0.85 and 0.95. Best results are obtained for puzzles of intermediate difficulty. For very easy puzzles there are many ways in which cells can be filled and therefore it is hard to predict the exact order (in this cases the order also differs among individual solvers). Difficult puzzles cannot be solved by the basic techniques used by the model and hence the prediction is again a bit worse. Nevertheless, given the simplicity of the SiSuS model, we consider the overall performance to be very good.
3.1.4 Difficulty Metrics Based on the Model
Note that difficulty rating is interwoven with modeling human solvers. Difficulty metrics are based on the data collected by simulating a model of human solver, but the behaviour of a model depends on the rating of difficulty of techniques. Models which incorporate many logic techniques depend on the intuition of the human designer (alternatively they could use some kind of bootstrapping).
Given a model of a human solver, a straightforward approach to difficulty rating is to run the model, count how often each logic technique is used and produce the overall rating as a simple function of these statistics. This is the approach used by most Sudoku generators. For our evaluation, we use the following metrics:
- Serate metric
-
Default metric used by the Sudoku Explainer tool [17]; it is a maximal difficulty of a used logic technique.
- Serate LM metric
-
Linear model over techniques used by the Sudoku Explainer tool; this approach is inspired by [24]. We compute how many times each logic technique555We take into account only techniques which were used in at least 0.5% of all technique applications. There are 13 such techniques, all other techniques were grouped together. was used over each problem. Using half of the problems as a training set we compute parameters for a linear model; the metric is evaluated on the remaining problems (a test set).
- Fowler’s metric
-
Default metric used by G. Fowler’s tool [8]; the metric is given by a (rather complicated) expression over number of occurrences of each logic technique (with ad hoc parameter values).
- Refutation sum metric
-
Mean sum of refutation scores (Section 3.1.2) over 30 randomized runs of the SiSuS model.
So far we have focused on the difficulty involved in single steps. The overall organization of these steps was considered only in a simple way as a simple function of difficulty ratings of individual steps. Insufficiency of this approach can be seen particularly for simple Sudokus – these problems are solvable by the basic simple techniques (i.e., the above describe metrics return very similar numbers), but for humans there are still significant differences in difficulty (some problems are more than two times more difficult than others).
Some of this additional difficulty can be explained by the concept of ‘dependency’ among steps in the solution process (applications of logic techniques). An important aspect of human CSP solving is “the number of possibilities leading to a next step” in each step. For example in our small Sudoku example from Fig. 4, there are 3 possibilities in the first step, 4 possibilities in the second and the third steps, and so on. It is quite clear that for the classical Sudoku it it makes a big difference if we can in the first step apply a logic technique at 10 different cells or only at just 2.
To apply this idea, we count in each step of the SiSuS model the number of possibilities to apply a simple technique. Since the model is randomized, we run several runs and compute for each step the mean number of possibilities. Fig. 7 illustrates a difference among several specific instances – it shows that for easy problem there are many possibilities for progress in each step whereas for hard problem there are only few of them.
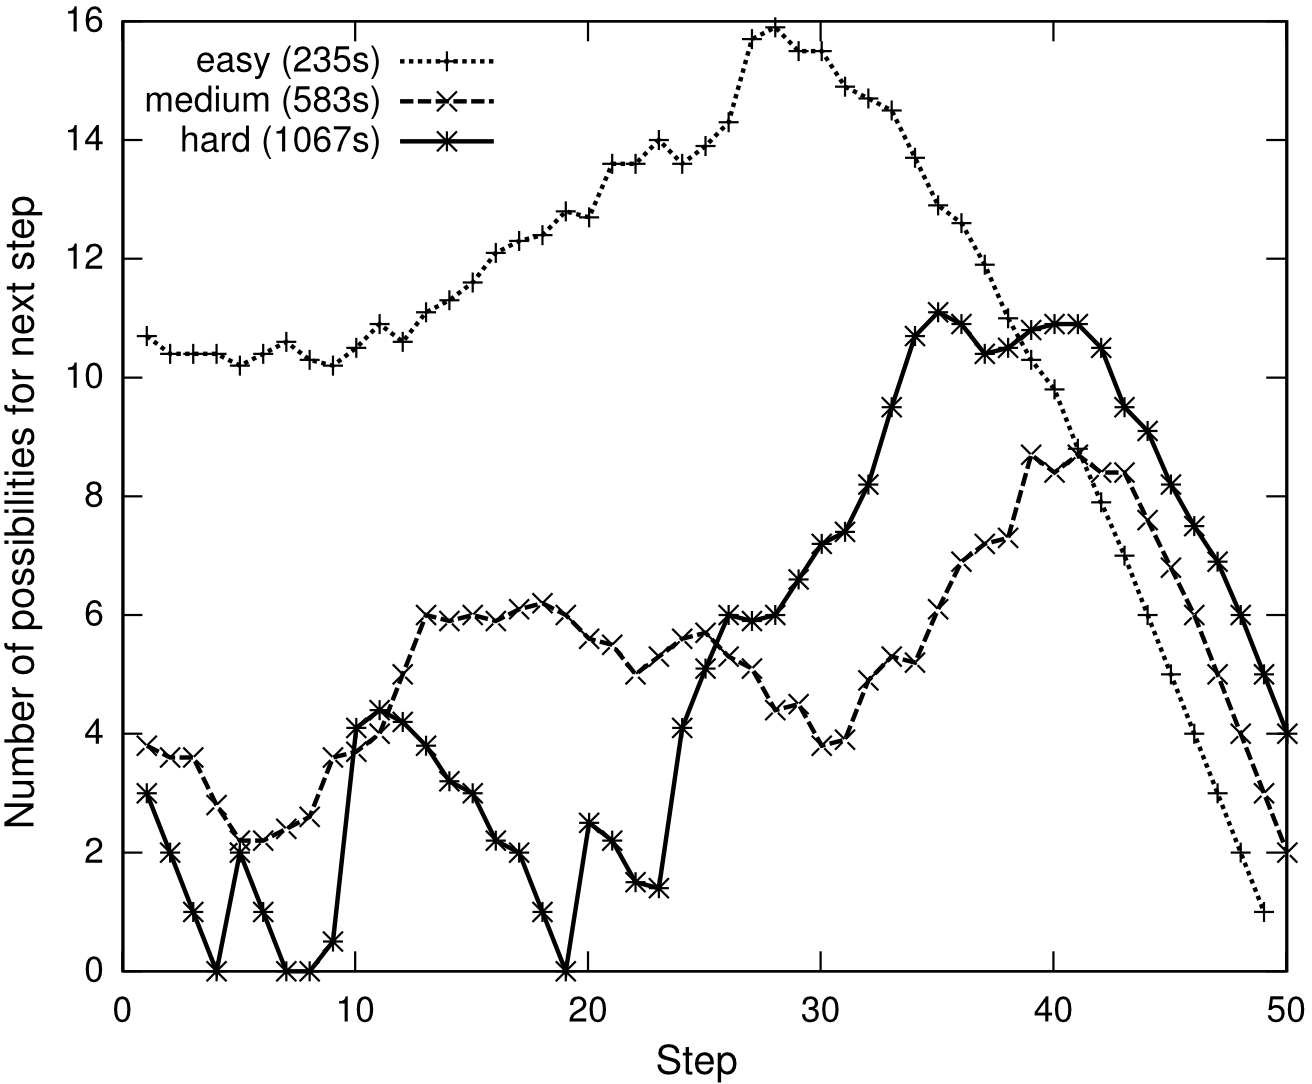
To specify a difficulty metric, we need to convert the graphs in Fig. 7 to a single number. We simply compute the mean over the first steps ( is a parameter of the metric). But what is a good value of ? As illustrated by examples in the Fig. 7, in the second half of the solution there are usually many possibilities for all problems; i.e., these steps probably do not contribute to the difficulty and therefore it is better to limit the parameter , on the other hand too small ignores potentially useful information. We have evaluated the preciseness of the metric with respect to the parameter over our datasets (Table 2). The results show that a suitable value of is slightly dependent on the dataset, but generally it is between 20 and 30 and results are not too much dependent on the precise choice of (for the interval 20 to 30).
| 5 | 10 | 15 | 20 | 25 | 30 | 35 | 40 | |
|---|---|---|---|---|---|---|---|---|
| fed-sudoku.eu all | 0.42 | 0.57 | 0.65 | 0.67 | 0.64 | 0.58 | 0.51 | 0.47 |
| fed-sudoku.eu simple | 0.57 | 0.64 | 0.70 | 0.73 | 0.74 | 0.73 | 0.70 | 0.66 |
| sudoku.org.uk all | 0.31 | 0.54 | 0.62 | 0.70 | 0.74 | 0.76 | 0.76 | 0.73 |
| sudoku.org.uk simple | 0.62 | 0.71 | 0.76 | 0.79 | 0.80 | 0.80 | 0.78 | 0.75 |
3.2 Constraint Relaxation
Now we describe completely different approach to difficulty rating – an approach inspired by research about computational difficulty of problems. This issue is well-studied for random CSP, where the structure of problems undergoes a sharp phase transition. This phenomenon was studied particularly for the SAT problem (satisfiability of boolean formulae) and the graph coloring problem [5, 28, 1]. Since Sudoku can be viewed as a graph coloring problem, we try to apply the ideas from this research and we study “random constraint relaxations” of Sudoku problems and evaluate their connections to difficulty for humans.
3.2.1 Phase Transition in the Random CSPs
Consider a random graph with vertices and with average connectiveness . The graph coloring problem undergoes sharp phase transition: when is low, the graph is colorable with very high probability and it is easy to find the coloring; when is high, the graph is non-colorable with high probability and it is easy to find a proof of non-colorability; between these two regions there is a sharp transition where it is difficult to decide colorability666These observations hold for large values of , they can be formalized and studied analytically for .. For example, for 9 colors the threshold of connectiveness is around 35. During the phase transition, it is even possible to distinguish several “sub-phases” called condensation, clustering, and freezing (there is an analogy with physical processes in spin glasses) [20].
A particular inspiration that we use is the concept of freezing. During this phase the set of all solutions can be divided into clusters in which colors of some vertices are frozen (i.e., they are the same in all solutions in that cluster) [20]. Another similar notion is a “backbone” variable [28], which is a variable frozen in all solutions.
3.2.2 Constraint Relaxation in Sudoku
In the study of phase transition, researchers focused on dependence of problem solutions and their properties on graph connectiveness. We apply this principle to Sudoku (viewed as a graph coloring problem). Sudoku graph, of course, is not a random graph, but rather a highly structured grid with a fixed connectiveness. Nevertheless, we can change its connectiveness and randomize it by relaxing some of the constraints, i.e., by randomly removing edges in the underlying graph . As we relax constraints, the Sudoku puzzle will no longer have a unique solution. How fast does the number of solutions increase with ? Is there a relation to human problem solving? Is there any analogy to “freezing”?
 |
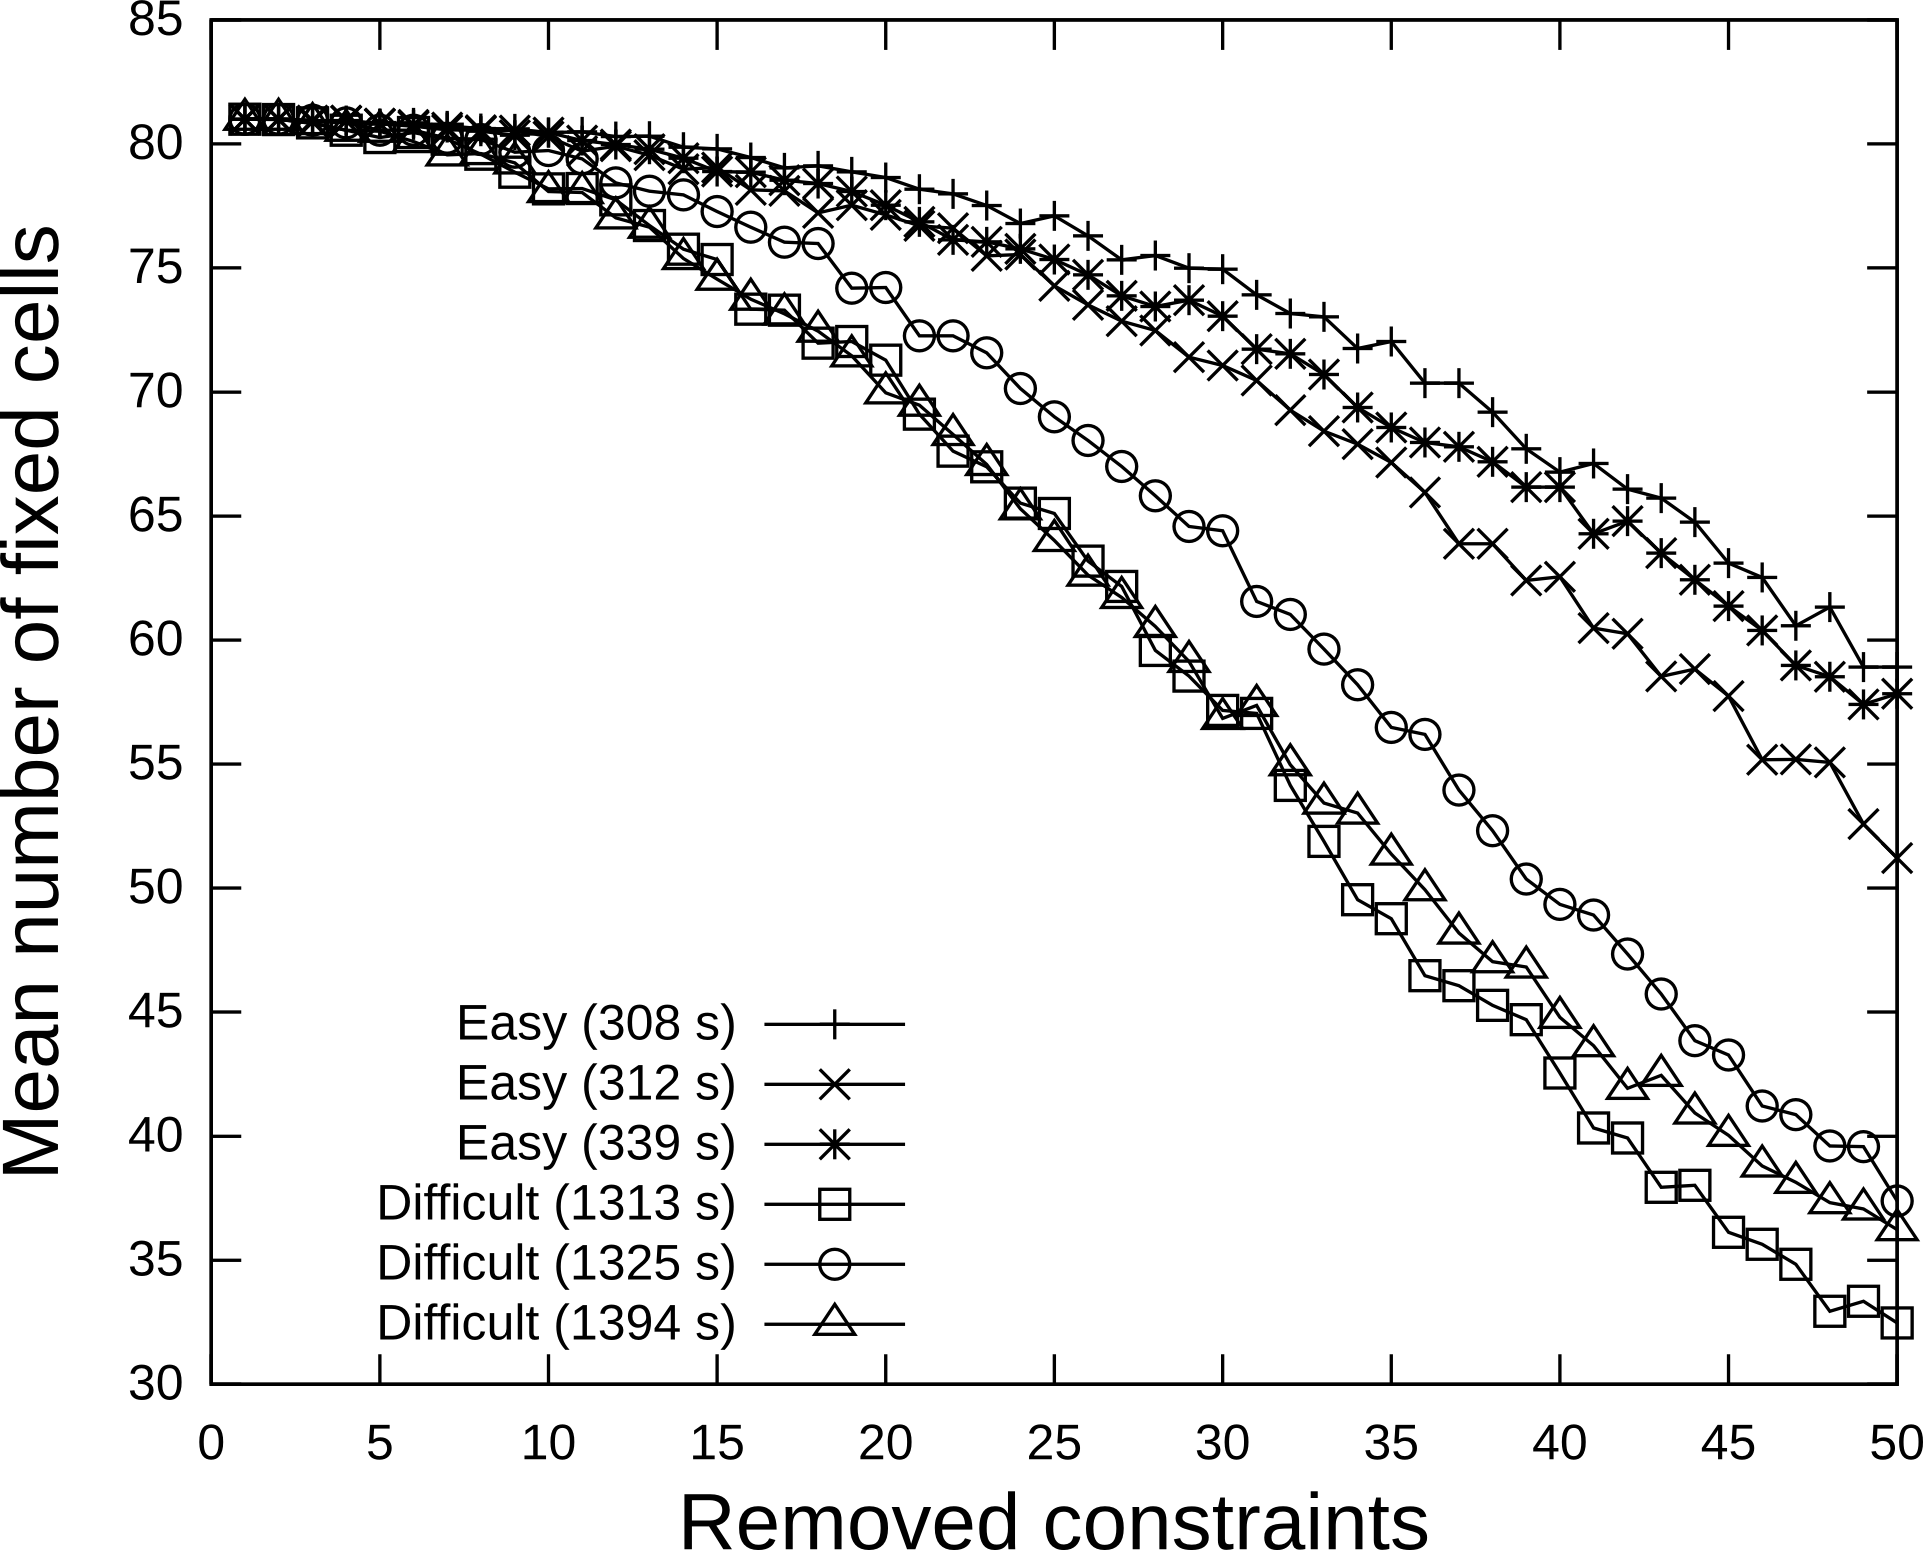 |
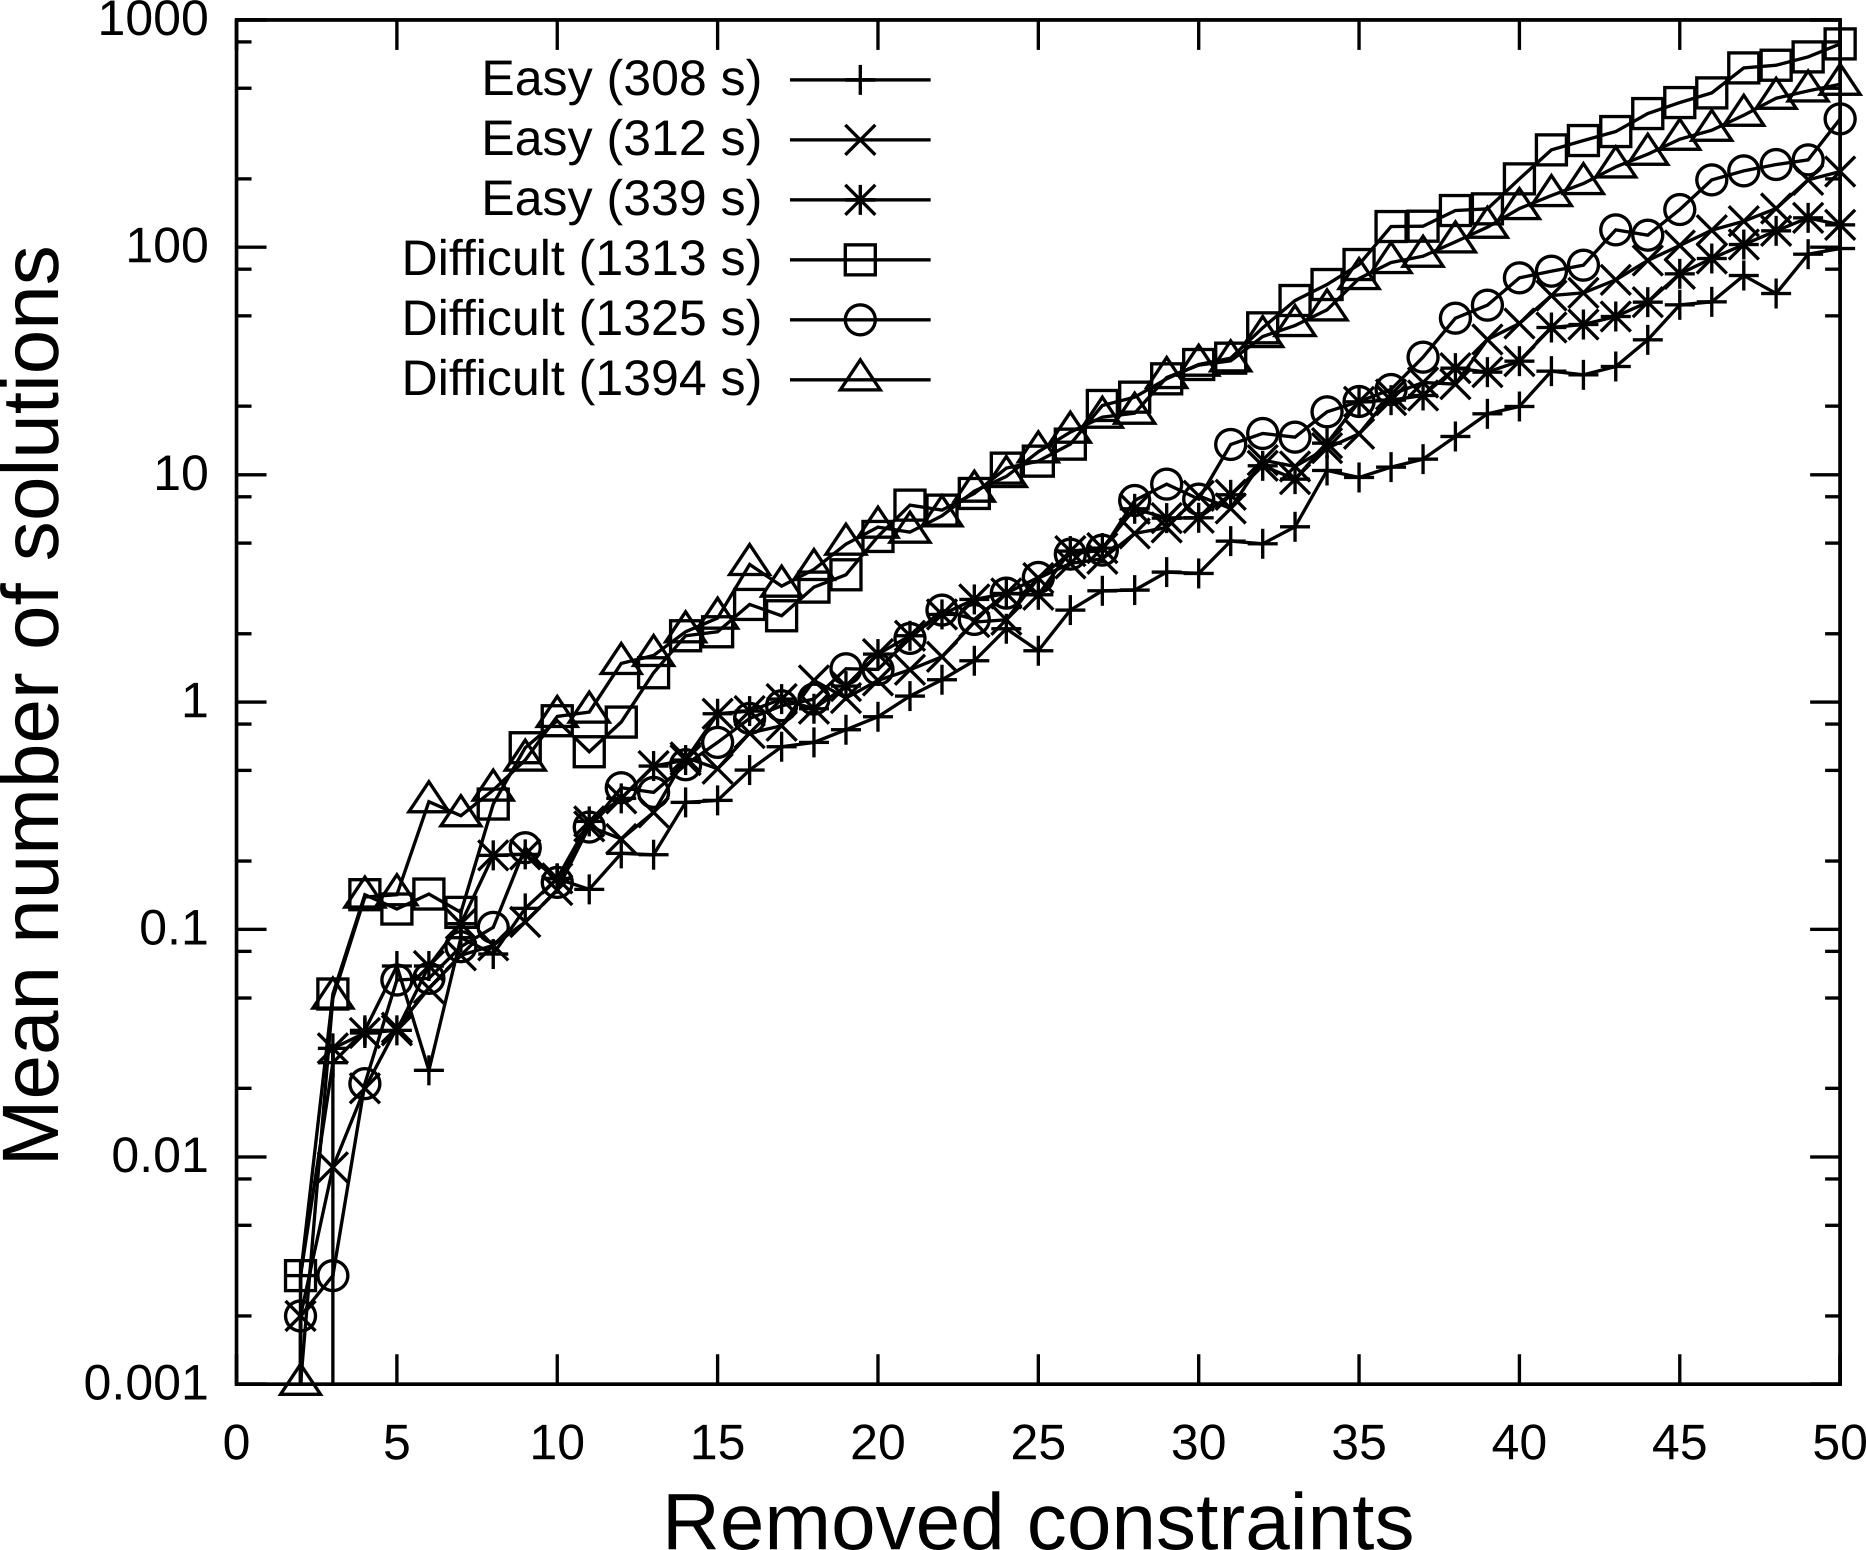
Fig. 8 illustrates some aspects of behaviour of Sudoku problems with constraints relaxed. The figure shows results for only 6 selected puzzles, nevertheless the trends are representative.
The first graph shows that the mean number of solutions777More precisely, we compute the number of solutions different from the “basic” one. grows exponentially with – it can be fitted well by the function , where depends on the particular puzzle and ranges between and . Results shown in the figure illustrate a general trend – more difficult puzzles have more solutions. We interpret this result as follows: easy puzzles have more “redundancy”, i.e., more ways how to reach a solution, this causes both the slower increase in number of solutions and simplifies solution for humans. The probability that a problem has a unique solution decreases nearly linearly with , it gets close to zero for . Difficult puzzles have lower probability of a unique solution than easy puzzles.
As an analogy to the concept of freezing, we propose to study fixedness of cells. A cell is fixed in problem with removed constraints if it has the same value in all solutions (i.e., this is the same as “backbone variable” [28]). The second graph shows for each puzzle the mean number of fixed cells with constraints removed. This property shows the largest difference between difficult and easy problems – it declines more slowly for easy problems.
Further, we define a fixedness of a particular cell with respect to a puzzle and parameter as a probability that the cell has fixed value in with constraints randomly removed. Fixedness of cells can be used as a predictor of order of filling – cells with higher fixedness are filled earlier. Predictions of order of cell filling are only only slightly worse than for the computational model; in few cases the prediction is even better than for the model.
Due to the exponential growth of number of solutions, it is not feasible to perform extensive analysis for values of over 50. In the evaluation we use the value – it is high enough so that differences among individual puzzles appear and yet the extensive analysis is still amenable.
3.3 Other Approaches
As we have discussed in Section 2.2, there are many different approaches to solving Sudoku. Each of these approaches could possibly serve as a basis for difficulty rating metric, typically by using a number of operations needed to find a solution. Several such metrics were evaluated over our data by Křivánek [21]:
-
•
metric based on backtracking search – the number of backtracking steps,
-
•
metric based on simulated annealing [25] – the number of steps during the search,
-
•
metric based on harmony search [9] – this approach is often not able to find a solution, so the metric is defined as the cost of the best candidate after 10 000 steps.
Results reported by Křivánek [21] show that these metrics are much less successful than metrics based on computational model and constraint relaxation (for more details see discussion below, particularly Table 3). This is not surprising, since these techniques proceed in significantly different way than humans. The same is true for the other approaches mentioned in Section 2.2 (e.g., genetic algorithm, belief propagation, particle swarm optimization). Thus we do not believe that some of them would lead to a successful difficulty rating metric888Although it is, of course, in principle possible. and we do not further elaborate on these other approaches.
4 Evaluation and Discussion
Now we evaluate the described difficulty rating metrics on the data sets described in Section 2.3 and discuss the obtained results and experiences.
4.1 Results
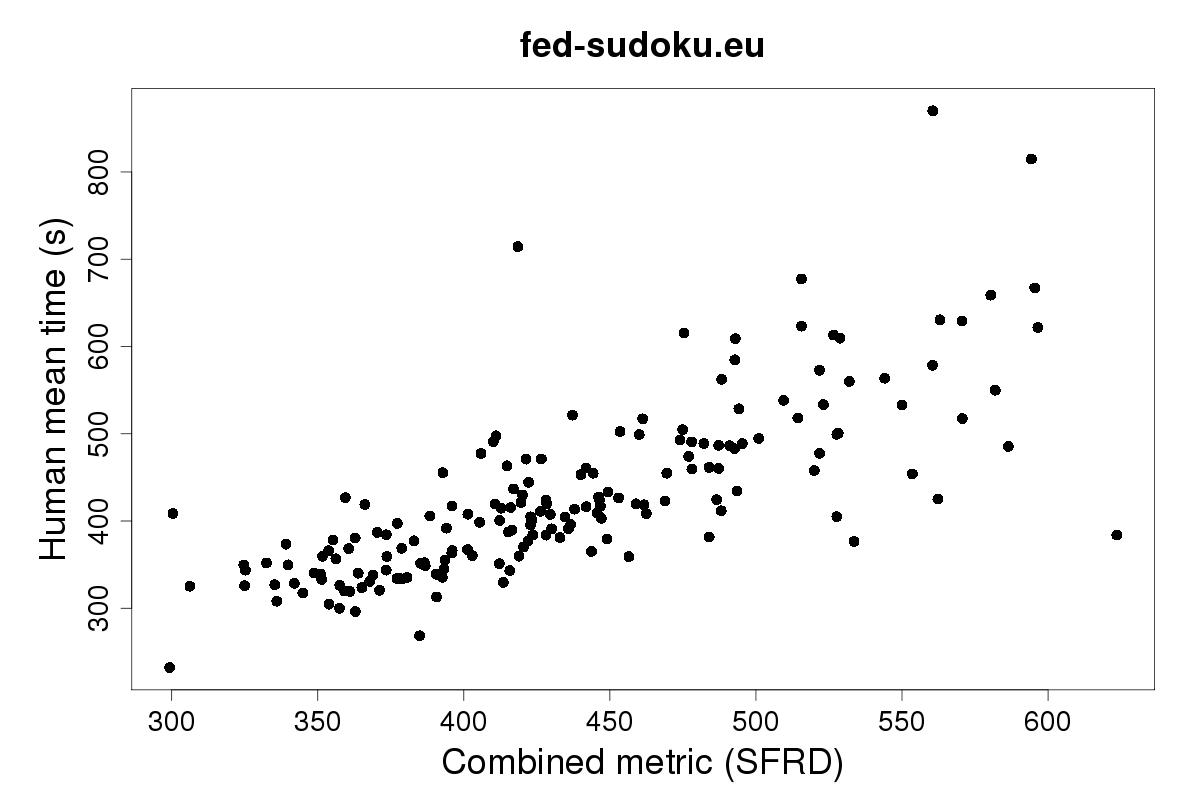
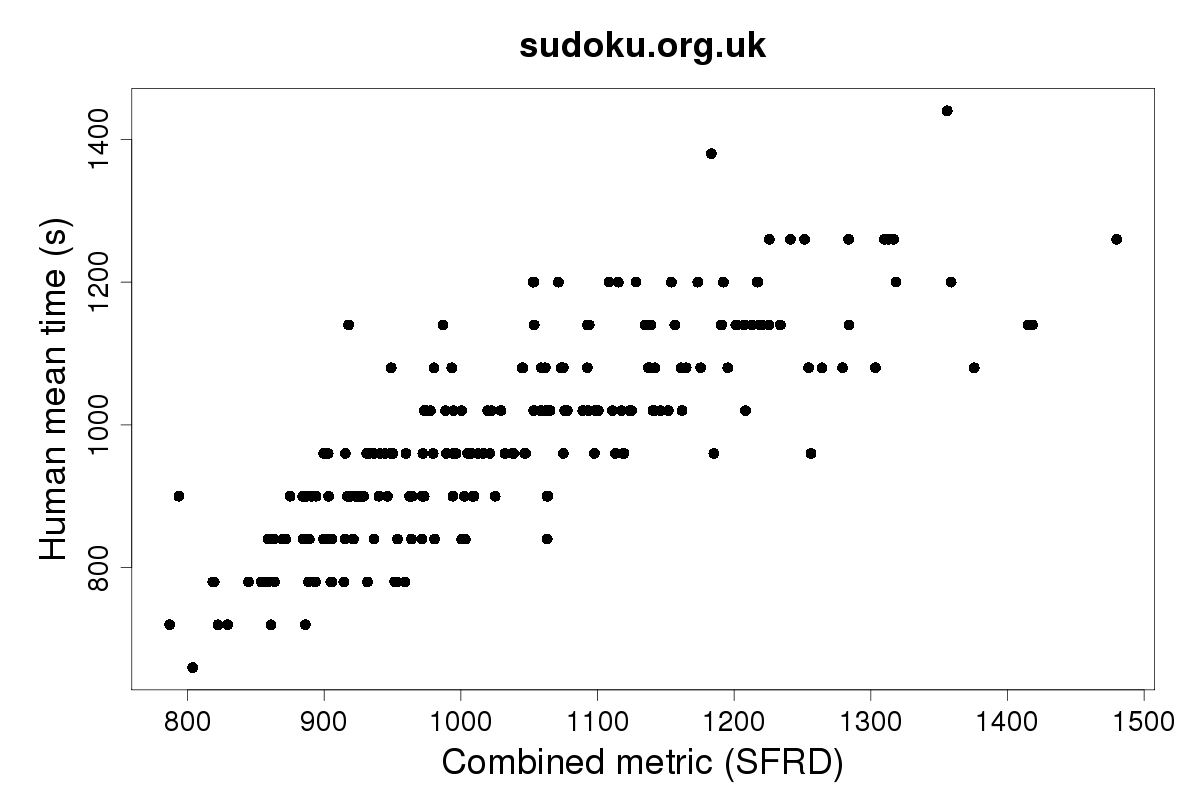
Results are given in Table 3. Fig. 9 gives scatter plots for combined metric SFRD as an illustration of the distribution of the data points. All approaches contain randomness; the metrics are thus based on averages over repeated runs. For measuring correlation we use the standard Pearson correlation coefficient999We have experimented with other measures (e.g., Spearman correlation coefficient). They gives different absolute values, but the relative ordering of results is the same.. All reported correlations are statistically significant.
Except for the metrics described above, we also evaluated combinations of metrics, more specifically linear models over several metrics. Parameters of linear models were determined over a training set (one half of the problems), results were evaluated over the other half of models (testing set). We evaluated two combined metrics obtained as linear models over other metrics. The first combined metric is based on data obtained only from our SiSuS model (linear combination of Refutation sum and Dependency metric; denoted “RD” in Table 3). The second combined metric is a based on four metrics (Serate, Fowler’s, Refutation sum, Dependency; denoted “SFRD” in Table 3).
| approach | metric | fed-sudoku | sudoku.org |
|---|---|---|---|
| algorithm based | backtracking | 0.16 | 0.25 |
| algorithm based | harmony search | 0.18 | 0.22 |
| static | number of givens | 0.25 | 0.27 |
| algorithm based | simulated annealing | 0.38 | 0.39 |
| constraint relaxation | number of solutions | 0.40 | 0.46 |
| constraint relaxation | fixedness | 0.56 | 0.61 |
| computational model | dependency | 0.67 | 0.69 |
| computational model | refutation sum | 0.68 | 0.83 |
| computational model | Fowler’s | 0.68 | 0.87 |
| computational model | Serate | 0.70 | 0.86 |
| computational model | Serate LM | 0.78 | 0.86 |
| linear combination | RD | 0.74 | 0.88 |
| linear combination | SFRD | 0.84 | 0.95 |
4.1.1 Comparison of Datasets
We get consistently better results for sudoku.org.uk than for fed-sudoku.eu. This is probably mainly due to the wider variability of difficulty in the sudoku.org.uk dataset (see the discussion of differences between these datasets in Section 2.3.2). Beside the difference in absolute numbers, all other below discussed trends are the same over both datasets.
This result is noteworthy in itself. Even through there are quite significant differences between the two datasets, the relative ordering of results is the same. This shows that data from Internet are usable (although care has to be taken, as discussed in Section 2.3) and lead to stable and robust results. The results also clearly demonstrate that in evaluation of difficulty rating metric we should focus only on relative comparisons; we cannot compare absolute numbers across different datasets. Datasets may differ in their solvers (average versus advanced solvers) and in ranges of problem difficulty. Results of difficulty rating are very dependent on the difficulty range of used problem instances. If the instances have very large differences in difficulty, then even a simple metric should be able to give a good prediction. If the instances have very similar difficulty then even precise difficulty rating metric will not achieve good correlation due to the noise in the data (even with extensive and robust data there will always be some noise in the data).
4.1.2 Comparison of Rating Metrics
Metrics based on backtracking and harmony search are even worse than the baseline metric “number of givens”. Simulated annealing leads to an improvement, but only a slight one. Constraint relaxation is the best approach from these not based on the computational model. Here the metric based on fixedness is better than metric based only on solution count. The results for constraint relaxation are notable, since this approach does not mimic neither human nor computational problem solving behaviour, yet it can predict problem difficulty.
Best results are achieved by metrics based on the computational model. In this case even an abstract model with few Sudoku specific rules performs well. The Refutation sum metric achieves only slightly worse results than classical metrics (Serate, Fowler’s), despite the fact that it is much more general and simpler technique with only few Sudoku specific aspects (particularly it does not have ad hoc parameters). Dependency metric, if used alone, is the weakest metric from the model based. But it works well on simple Sudokus101010Those solvable only by hidden single and naked single techniques, see Section 2.2.2., where it works better than the other metrics (since these cannot efficiently discriminate between simple Sudokus). Moreover, the dependency metric is partly orthogonal to other metrics, and thus it enables us to get improved results by using a combined metric.
Serate LM metric (linear model over data about the usage of 14 logic techniques) achieves similar results as basic Serate metric. Fowler’s metric, which differs in details and parameter values but uses the same basic approach as Serate, also achieves similar results. It seems that given the basic approach, the selection of exact parameter values is not that much important. Nevertheless, by combining 4 different metrics, we can significantly improve the overall performance and achieve really good performance of the metric.
4.1.3 Generalizability
We should not focus only on the performance of individual techniques, but also on their generalizability. How difficult is it to apply an approach to other problems? To apply the computational model approach we have to formulate “human logic techniques” for a particular problem. For Sudoku this is easy, but for more complex problems this can be challenging. Thus it is encouraging that even an abstract model with just two Sudoku specific techniques leads to a good difficulty rating metric.
The constraint relaxation approach is even more easily applicable to other problems – it is quite straightforward to relax constraints and study number of solutions and fixedness of variables. We have performed preliminary experiments with the Nurikabe puzzle and our experience supports these observations. Nurikabe is another constraint satisfaction puzzle, but with a global constraint. For evaluation we have used data about 45 puzzles, the data were collected using Problem Solving Tutor [14]. For Nurikabe puzzle it is non-trivial to formulate human logic techniques, whereas constraint relaxation is straightforward and in this case it even achieves better predictions () than the approach based on constraint propagation ().
5 Conclusions and Future Work
We describe and evaluate techniques for predicting human Sudoku solving behaviour, particularly for difficulty rating of puzzles and for predicting the order of cell filling. For evaluation we use extensive data on human problem solving (hundreds of puzzles and solvers), which were obtained from Internet Sudoku servers. Although such data collection is not done under controlled laboratory conditions, our analysis shows that data from the Internet may be robust and definitively useful. In our evaluation we used two very different datasets; although we did get different absolute results for each dataset, relative results (comparison among different techniques) was almost the same – this supports our belief in robustness and usefulness of the data collected from the Internet.
The best results are achieved by metrics based on the computation model which simulates human behaviour through constraint propagation. We have shown that by instantiating the model with only few and simple Sudoku-specific details, we can obtain quite reasonable difficulty rating metric (correlation coefficient up to 0.88). By combining several techniques which are specifically tuned for Sudoku we are able to obtain very good difficulty rating metric (correlation coefficient up to 0.95). We have identified two aspects which influence the problem difficulty: difficulty of individual logic steps during the solution and dependency among individual steps. Previously used techniques [8, 17] focused only on individual logic steps. The novel concept of dependency enabled us to significantly improve the performance of rating.
Another noteworthy approach is based on constraint relaxation. This approach leads to worse difficulty rating than the computational modeling approach. Yet it gives reasonable prediction, even through it does not mimic human reasoning in any way and it is easily applicable to other problems. Moreover, we believe that the concept of fixedness could bring a new insight into human problem solving and problem difficulty.
The main direction for future work is to apply the described notions (particularly the dependency concept and constraint relaxation) to other constraint satisfaction problems. Particularly, it may be interesting to study constraint satisfaction problems with non-unique solutions (e.g., problems like Pentomino puzzle) – for such problems the human behaviour is quite different from the deductive reasoning used in Sudoku-like problems with unique solutions. On more general level, it may be fruitful to focus more on relations among computational complexity, phase transition, and difficulty for humans.
Acknowledgement
The author thanks to webmasters of fed-sudoku.eu and czech-sudoku.com portals for providing the data, Jiří Šimša and Petr Jarušek for inspiring discussions, and Martin Křivánek for carrying out some of the experiments.
References
- [1] D. Achlioptas, A. Naor, and Y. Peres. Rigorous location of phase transitions in hard optimization problems. Nature, 435(7043):759–764, 2005.
- [2] J.R. Anderson, C.F. Boyle, and B.J. Reiser. Intelligent tutoring systems. Science, 228(4698):456–462, 1985.
- [3] J. Beck, M. Stern, and B.P. Woolf. Using the student model to control problem difficulty. In Proc. of the Seventh International Conference on User Modeling, pages 277–288. Springer, 1997.
- [4] A. Caine and R. Cohen. Tutoring an entire game with dynamic strategy graphs: The mixed-initiative sudoku tutor. Journal of Computers, 2(1):20–32, 2007.
- [5] P. Cheeseman, B. Kanefsky, and W. M. Taylor. Where the really hard problems are. In Proc. of the 12th International Joint Conference on Artificial Intelligence (IJCAI), pages 331–337. Morgan Kaufmann Publishers Inc., 1991.
- [6] M. Dry, M.D. Lee, D. Vickers, and P. Hughes. Human performance on visually presented traveling salesperson problems with varying numbers of nodes. Journal of Problem Solving, 1(1):20–32, 2006.
- [7] B. Felgenhauer and F. Jarvis. Enumerating possible Sudoku grids, 2005. Available at http://www.afjarvis.staff.shef.ac.uk/sudoku/.
- [8] G. Fowler. A 9x9 sudoku solver and generator, 2009. AT&T Labs Research, available at http://www2.research.att.com/~gsf/.
- [9] Z. Geem. Harmony search algorithm for solving sudoku. In Knowledge-Based Intelligent Information and Engineering Systems, pages 371–378. Springer, 2010.
- [10] J. Goldberger. Solving sudoku using combined message passing algorithms. Technical report, School of Engineering, Bar-Ilan University, 2007.
- [11] M. Henz and H.M. Truong. Sudoku Sat – A Tool for Analyzing Difficult Sudoku Puzzles. Tools and Applications with Artificial Intelligence, pages 25–35, 2009.
- [12] A.M. Herzberg and M.R. Murty. Sudoku squares and chromatic polynomials. Notices of the AMS, 54(6):708–717, 2007.
- [13] P. Jarušek and R. Pelánek. Difficulty rating of sokoban puzzle. In Proc. of the Fifth Starting AI Researchers’ Symposium (STAIRS 2010), pages 140–150. IOS Press, 2010.
- [14] P. Jarušek and R. Pelánek. Problem solving tutor, 2011. http://tutor.fi.muni.cz.
- [15] P. Jarušek and R. Pelánek. What determines difficulty of transport puzzles? In Proc. of Florida Artificial Intelligence Research Society Conference (FLAIRS 2011), pages 428–433, 2011.
- [16] J. Jilg and J. Carter. Sudoku evolution. In Games Innovations Conference, 2009. ICE-GIC 2009. International IEEE Consumer Electronics Society’s, pages 173–185. IEEE, 2009.
- [17] N. Juillerat. Sudoku Explainer, 2007. Available at http://diuf.unifr.ch/people/juillera/Sudoku/Sudoku.html.
- [18] K. Kotovsky, J.R. Hayes, and H. A. Simon. Why are some problems hard? Evidence from tower of Hanoi. Cognitive psychology, 17(2):248–294, 1985.
- [19] K. Kotovsky and H. A. Simon. What Makes Some Problems Really Hard: Explorations in the Problem Space of Difficulty. Cognitive Psychology, 22(2):143–83, 1990.
- [20] F. Krzkala and L. Zdeborova. Phase transitions and computational difficulty in random constraint satisfaction problems. In Journal of Physics: Conference Series, volume 95, page 012012. IOP Publishing, 2008.
- [21] M. Křivánek. Difficulty rating of sudoku puzzles: comparison of several techniques. Master’s thesis, Masaryk University Brno, 2011.
- [22] P. R. La Monica. Much ado about sudoku. CNNMoney.com, 2005.
- [23] N.Y.L. Lee, G.P. Goodwin, and P.N. Johnson-Laird. The psychological puzzle of Sudoku. Thinking & Reasoning, 14(4):342–364, 2008.
- [24] A. Leone, D. Mills, and P. Vaswani. Sudoku: Bagging a difficulty metric and building up puzzles, 2008. Mathematical Contest in Modeling, University of Washington.
- [25] R. Lewis. Metaheuristics can solve sudoku puzzles. Journal of heuristics, 13(4):387–401, 2007.
- [26] I. Lynce and J. Ouaknine. Sudoku as a SAT problem. In 9th International Symposium on Artificial Intelligence and Mathematics (2006). Springer, 2006.
- [27] T. Mantere and J. Koljonen. Solving, rating and generating Sudoku puzzles with GA. In IEEE Congress on Evolutionary Computation (CEC 2007), pages 1382–1389, 2007.
- [28] R. Monasson, R. Zecchina, S. Kirkpatrick, B. Selman, and L. Troyansky. Determining computational complexity from characteristic’phase transitions’. Nature, 400(6740):133–137, 1999.
- [29] T.K. Moon and J.H. Gunther. Multiple constraint satisfaction by belief propagation: An example using sudoku. In Adaptive and Learning Systems, 2006 IEEE Mountain Workshop on, pages 122–126. IEEE, 2006.
- [30] A. Moraglio, C. Di Chio, J. Togelius, and R. Poli. Geometric particle swarm optimization. Journal of Artificial Evolution and Applications, 2008:1–14, 2008.
- [31] M. Nicolau and C. Ryan. Solving sudoku with the gauge system. Genetic Programming, pages 213–224, 2006.
- [32] B. O’Sullivan and J. Horan. Generating and Solving Logic Puzzles through Constraint Satisfaction. In Proc. of the 22nd national conference on Artificial intelligence, volume 2, pages 1974–1975. AAAI Press, 2007.
- [33] R. Pelánek. Difficulty rating of sudoku puzzles by a computational model. In Proc. of Florida Artificial Intelligence Research Society Conference (FLAIRS 2011), pages 434–439, 2011.
- [34] R. Pelánek. Human problem solving: Sudoku case study. Technical Report FIMU-RS-2011-01, Masaryk University Brno, 2011.
- [35] Z. Pizlo and Z. Li. Solving combinatorial problems: The 15-puzzle. Memory and Cognition, 33(6):1069, 2005.
- [36] H. A. Simon and A. Newell. Human problem solving. Prentice Hall, 1972.
- [37] H. Simonis. Sudoku as a constraint problem. In Proc. 4th Int. Workshop on Modelling and Reformulating Constraint Satisfaction Problems, pages 13–27, 2005.
- [38] T. Yato and T. Seta. Complexity and completeness of finding another solution and its application to puzzles. IEICE Transactions on Fundamentals of Electronics, Communications and Computer Sciences, 86(5):1052–1060, 2003.
- [39] T.W. Yue and Z.C. Lee. Sudoku solver by q’tron neural networks. Intelligent Computing, pages 943–952, 2006.