Molecular cloud formation as seen in synthetic Hi and molecular gas observations
Abstract
We present synthetic Hi and CO observations of a numerical simulation of decaying turbulence in the thermally bistable neutral medium. We first present the simulation, which produces a clumpy medium, with clouds initially consisting of clustered clumps. Self-gravity causes these clump clusters to merge and form more homogeneous dense clouds. We apply a simple radiative transfer algorithm, throwing rays in many directions from each cell, and defining every cell with as molecular. We then produce maps of Hi, CO-free molecular gas, and CO, and investigate the following aspects: i) The spatial distribution of the warm, cold, and molecular gas, finding the well-known layered structure, with molecular gas being surrounded by cold Hi and this in turn being surrounded by warm Hi. ii) The velocity of the various components, finding that the atomic gas is generally flowing towards the molecular gas, and that this motion is reflected in the frequently observed bimodal shape of the Hi profiles. This conclusion is, however, tentative, because we do not include feedback that may produce Hi gas receding from molecular regions. iii) The production of Hi self-absorption (HISA) profiles, and the correlation of HISA with molecular gas. In particular, we test the suggestion of using the second derivative of the brightness temperature Hi profile to trace HISA and molecular gas, finding significant limitations. On a scale of several parsecs, some agreement is obtained between this technique and actual HISA, as well as a correlation between HISA and the molecular gas column density. This correlation, however, quickly deteriorates towards sub-parsec scales. iv) The column density PDFs of the actual Hi gas and those recovered from the Hi line profiles, finding that the latter have a cutoff at column densities where the gas becomes optically thick, thus missing the contribution from the HISA-producing gas. We also find that the power-law tail typical of gravitational contraction is only observed in the molecular gas, and that, before the power-law tail develops in the total gas density PDF, no CO is yet present, reinforcing the notion that gravitational contraction is needed to produce this component.
keywords:
turbulence – ISM: clouds – ISM: evolution – ISM: kinematic and dynamics – ISM: structure1 Introduction
The present view of the interstellar medium (ISM) is that it is in general highly turbulent (e.g., Vázquez-Semadeni et al., 2000; Mac Low & Klessen, 2004; Elmegreen & Scalo, 2004; Ballesteros-Paredes & Hartmann, 2007), and that dense, cold clouds form where turbulent compressions or larger-scale instabilities produce converging flows that in turn cause the density to increase locally (e.g., Dobbs et al., 2014; Molinari et al., 2014). Indeed, numerical simulations of converging flows in the warm neutral medium (WNM) including self-gravity but no stellar feedback (Vázquez-Semadeni et al., 2007, 2011; Hennebelle et al., 2008; Heitsch & Hartmann, 2008; Heitsch et al., 2009; Banerjee et al., 2009a) show in general that, once a dense cloud is formed by this mechanism, it quickly becomes gravitationally unstable, and begins to undergo gravitational collapse. An important feature of this collapse is that it begins in gas that should be primarily atomic, with molecule formation occurring as a consequence of the gravitational contraction, as initially proposed on theoretical grounds by Franco & Cox (1986) and Hartmann et al. (2001). Simulations including a self-consistent treatment of the chemistry (e.g., Clark et al., 2012; Clark & Glover, 2013) indeed show that this is so, and that H2 molecule formation occurs relatively early during the collapse, while CO formation only occurs some 2 Myr before star formation (SF) starts. Finally, simulations including stellar feedback (Vázquez-Semadeni et al., 2010; Colín et al., 2013) show that the infalling motions of the dense gas are not overturned by the action of the feedback. Rather, the clouds are progressively evaporated, with the escaping gas being warm and diffuse, while the dense gas continues to fall in.
The above picture of molecular clouds formed by flows implies that CO-identified molecular clouds (MCs) should be surrounded by cold atomic gas, perhaps mixed with CO-dark molecular gas, and that this medium should in turn be embedded in warm Hi, similarly to the classical picture of the ISM (see, e.g., the review by Blitz, 1993, and references therein), except for the additional property that the atomic and CO-dark components are expected to be flowing towards the MCs.
Observations partially support this view, since giant molecular clouds (GMCs), whose largest dimension reaches up to pc, appear to be the densest regions in the ISM, and are known to be embedded in CO-free molecular gas, which in turn is embedded in Hi superclouds, of sizes of up to 1 or 2 kpc (see, e.g., Molinari et al., 2014, and references therein). In order to distinguish whether molecular clouds are formed by Hi flows, it is necessary to establish the motions of the Hi. However, observationally establishing the direction of the motions that produce GMCs is a formidable problem, due to the confusion caused by the ubiquitous presence of Hi gas in the Galactic disk.
Several studies have been conducted to determine the signatures in line profiles and position-velocity (PV) space arising from the density and velocity features produced in the simulations. Early studies simply investigated line-of-sight (LOS) projections of the density field from numerical simulations, and perhaps investigated the column density in the velocity coordinate (line profiles and channel maps) (e.g., Ballesteros-Paredes et al., 1999; Pichardo et al., 2000; Ostriker et al., 2001; Ballesteros-Paredes & Mac Low, 2002), although without performing synthetic observations based on integration of the radiative transfer (RT) equation for the various lines involved. A further step was made by Ballesteros-Paredes & Mac Low (2002) who, in order to study the internal structure of molecular clouds, created synthetic CO and CS line profiles in local thermal equilibrium from numerical simulations of isothermal molecular clouds. They found that the density-size relation, rather than an intrinsic property of molecular clouds, is an artifact of the observational procedure (see also Ballesteros-Paredes et al., 2012). More recently, synthetic observations have been performed to varying degrees of approximation, and used to study to what extent the actual density and velocity structure of the atomic gas can be inferred from the line profiles (Hennebelle et al., 2007), or to show that infalling motions in the molecular gas produce realistic CO spectra: For example by matching the linewidths as well as the magnitude of the velocity dispersions seen in the 13CO filamentary structure of Galactic molecular clouds (Heitsch et al., 2009).
In this contribution we take one step further in this direction by combining synthetic observations of atomic and molecular gas from a numerical simulation of the formation of dense clouds in the turbulent ISM. These can help interpreting actual observations of MCs and their atomic envelopes, and help understanding the atomic-to-molecular transition in the ISM. Specifically, we use a simple radiative transfer (RT) algorithm on the output of a numerical simulation of decaying, self-gravitating turbulence in the ISM, in order to classify the gas as either being atomic or molecular, and then investigate various aspects, such as the spatial distribution of the molecular and cold and warm atomic components, as well as their velocities, and the signatures of these motions on the line profiles and intensity maps.
An important issue to assess is the production of Hi self-absorption (HISA) features by the cold atomic gas expected to surround the CO clouds. Although HISA is perhaps the most reliable method to detect cold Hi, it is not free from uncertainties and ambiguities. In particular, it is important to be able to distinguish between a true HISA feature, and lack of background emission. To this end, Knapp (1974) proposed four criteria, namely i) a fairly narrow dip (less than about 7 km s-1) appearing in the Hi spectrum; ii) an Hi velocity feature corresponding to a molecular emission line; iii) a dip appearing ‘on-cloud’ but not on the ‘off-cloud’ calibration profile, and iv) a slope of the dip steeper than the slope of the background emission profile to exclude the possibility of a line profile composed of a double gaussian peak. Based on later findings, the HISA detection criteria changed somewhat, most notably since molecular line emission is not always detected when a molecular cloud is positively identified, for example through optical extinction. Gibson et al. (2000) generalized the steepness requirement by stating that the profile wings need to be steeper than what superposition of neighboring emission lines would cause. Additionally, a certain amount of small-scale angular structure was required, as well as a certain minimum background level.
An automated HISA detection algorithm taking into account spatial and spectral features was developed by Gibson et al. (2005), while another example was presented by Kavars et al. (2005), who used both the first and second derivative (thresholded at certain levels) of the Hi profile to find HISA. They found that 60% of the HISA they detected coincides with molecular (CO) gas and proposed that HISA is related to an atomic-to-molecular phase transition. Goldsmith & Li (2005) determined that the cold Hi gas coincides with 13CO in five dark clouds they considered, and their models show that the cold Hi in those structures has densities between 2 and 6 cm-3 as compared to H2 central densities of 800 to 3000 cm-3.
Where the absorption coincides with molecular lines and has approximately the same linewidth, it has been referred to as ‘Hi narrow self-absorption’, or HINSA (Li & Goldsmith, 2003). Since strictly speaking we do not require molecular (CO) emission in order to identify Hi self-absorption, we will refer to these features as HISA regardless of whether they may be considered ‘narrow’, as a matter of convenience.
In general, Hi profiles typically look bi-modal on or near molecular clouds and it can be hard to distinguish without additional information what physical properties are behind this profile shape. In this contribution we therefore also aim to explore the extent to which we can distinguish true HISA from separate emission peaks, and how well the HISA is correlated with the presence of molecular gas at various evolutionary stages of the clouds.
This paper is structured as follows: First, we introduce the simulation and the synthetic observations derived from it in Sec. 2, and discuss the density and velocity structure of the various gas components in real space, emphasizing the general trend of inflow onto the dense gas in Sec. 3. Then, in Sec. 4 we discuss the nature of the synthetic line profiles, and in Sec. 5 we address the identification of HISA features and compare these features to those of the molecular gas. Next, we discuss the structure of the probability density functions of the simulation and the structure of the gas in the context of colliding gas flows. In Sec. 7 we close with a brief discussion and summary of our results.
2 The method
2.1 The numerical simulation
Our numerical simulation was performed using the Gadget-2 code (Springel et al., 2001), with SPH particles, and including prescriptions for sink particles taken from Jappsen et al. (2005) and for heating and cooling from Vázquez-Semadeni et al. (2007). The initial density and temperature of the simulation were set at and K, respectively, representing the mean ISM conditions at a spiral arm. The physical size of the numerical domain was 256 pc. The simulation was started by applying a Fourier turbulence driver with purely solenoidal modes between wavenumbers and for 0.65 Myr, reaching a maximum velocity dispersion of at Myr.
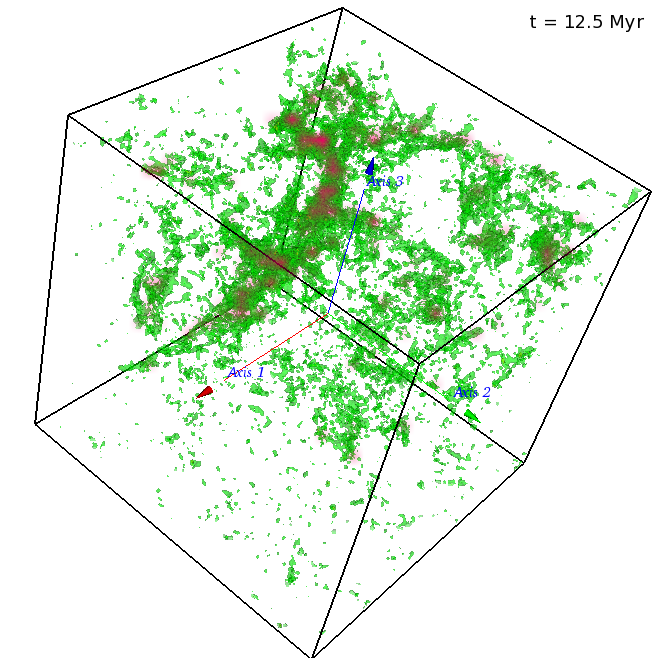
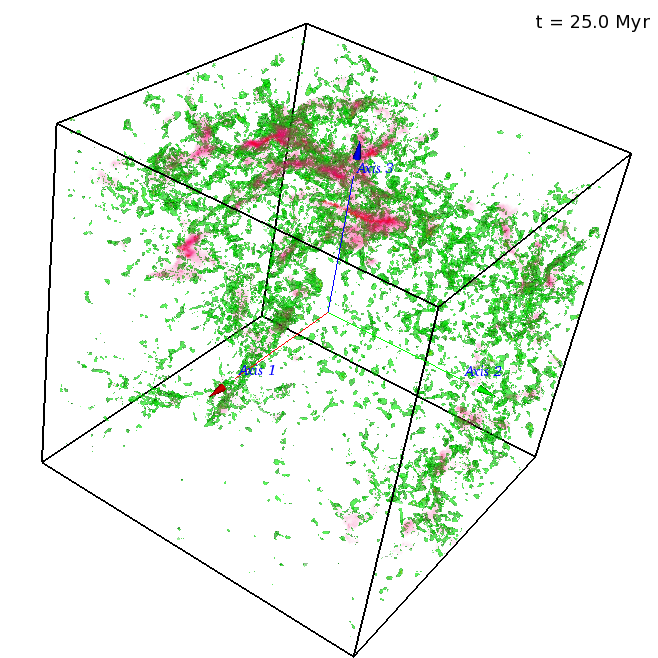
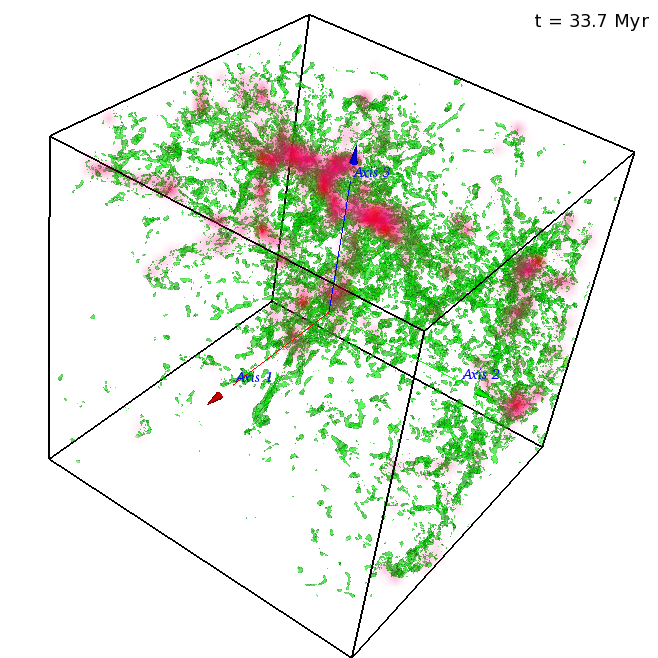
For the analyses presented in this paper, we consider three timesteps of the simulation, at 12.5, 25.0 and 33.7 Myr, where the latter is the final recorded timestep of this simulation. An octant of the simulation, of size 128 pc per side, containing the most massive clouds, was interpolated onto a uniform grid, giving an effective resolution of 0.5 pc. This resolution was chosen to provide a resolution comparable to observations of the interstellar medium in our Galaxy, while allowing easy manipulation of the data. Within this 128 parsec3 sub-volume, we focus on the entire sub-volume as well as on a further zoomed-in volume containing a dominant cloud feature (not necessarily the same cloud at each timestep). Images of the sub-volume at the three timesteps, after applying the RT prescription (cf. Sec. 2.2) are shown in Fig. 1.
2.2 Producing molecular gas
Once the data has been gridded, we proceed to distinguish between ‘atomic’ and ‘molecular’ gas. Note that the version of Gadget-2 that we use does not solve the chemistry explicitly, and so we use the simple criterion proposed by Heitsch & Hartmann (2008) for deciding which grid cell in the simulation are ‘atomic’ and which are ‘molecular’. While obviously faster than solving a full chemical network (e.g., Koyama & Inutsuka, 2000; Clark et al., 2012), this prescription is rather approximative, in particular because it assumes that molecules form as soon as the physical conditions allow for it, rather than following the time-dependent process of molecule formation. Thus, our results should be considered as providing upper limits for the amount of molecular gas present in the simulation.
The prescription we use is as follows: from each grid cell we emit 100 rays in random directions, that reach out to the edge of the numerical box, and compute the column density along each ray. The column density is converted to a visual extinction using the standard formula . We then compute the average extinction for each cell. If and K for a cell, we label its contents as molecular, meaning hydrogen is in the form of H2 molecules. If, in addition to satisfying the condition , the density in the cell satisfies the local condition , then we assume that the cell contains CO molecules, with a fixed relative abundance of CO(1-0) to total molecular gas number density of (e.g. Cernicharo & Bachiller, 1984; Pineda et al., 2008). The critical density is given by
| (1) |
where is the Einstein A, is the collisional cross section of the CO(1-0) molecule (ignoring higher transitions), and . The local gas temperature is available from the simulations at each resolution element. See Sec. 4 for further discussion.
An immediate implication of this procedure is that in our simulation, atomic and molecular gas are not mixed in a grid cell, which is either fully atomic, or fully molecular. Nevertheless, we can have mixing of atomic and molecular gas at scales larger than the grid cell size, if neighboring cells are in some cases atomic, and in other cases molecular. Therefore, it is perfectly feasible to have mixing of atomic and molecular gas along an observational line of sight although, as mentioned above, the molecular fraction we estimate will be an upper limit. In particular, we aim to investigate atomic gas that is about to turn molecular, and we expect our results, as they relate to Hi self-absorption and atomic-to-molecular conversion, to provide us with an informative, albeit only approximate, view. Note also that, since we distinguish between atomic and molecular gas by post-processing of the simulation data, this distinction has no effect on the evolution of the simulation. We plot the three-dimensional distribution of the atomic and the molecular gas qualitatively in Figure 1.
Finally, we note that, because our simulation does not include stellar feedback, the conversion of atomic gas into molecular gas and finally into stars is essentially a one-way process, although potentially molecular gas may become atomic again if the local drops below unity or if the temperature rises sufficiently. We have not traced individual particles, so whether, or to what extent, this occurred in our simulation is unknown. No photodissociation physics were included.
3 General morphology and cold gas fraction
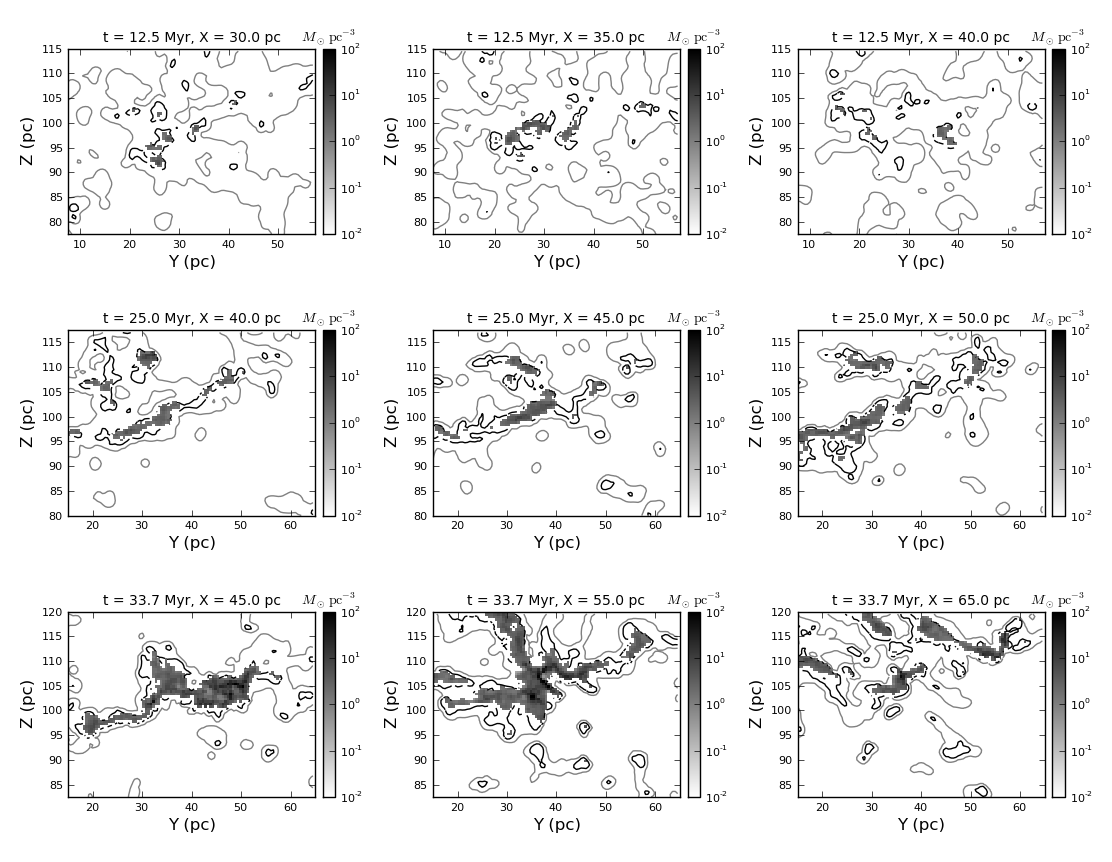
As time progresses in the simulation, filaments and clumps of gas begin to form by gravitational contraction onto the density peaks produced by the initial turbulence, aided by the thermal instability (Ballesteros-Paredes et al., 1999; Vázquez-Semadeni et al., 2007, 2009; Heitsch & Hartmann, 2008; Heitsch et al., 2009; Banerjee et al., 2009b; Gomez & Vazquez-Semadeni, 2013). Figure 2 shows slices through the mass density cubes of the atomic and molecular gas, zoomed in to show example molecular cloud structures. Molecular clouds are formed in filament-like structures before collapsing. The positions in parsecs refer to the offset from the (0,0,0) coordinate at one corner of the gridded cubes.
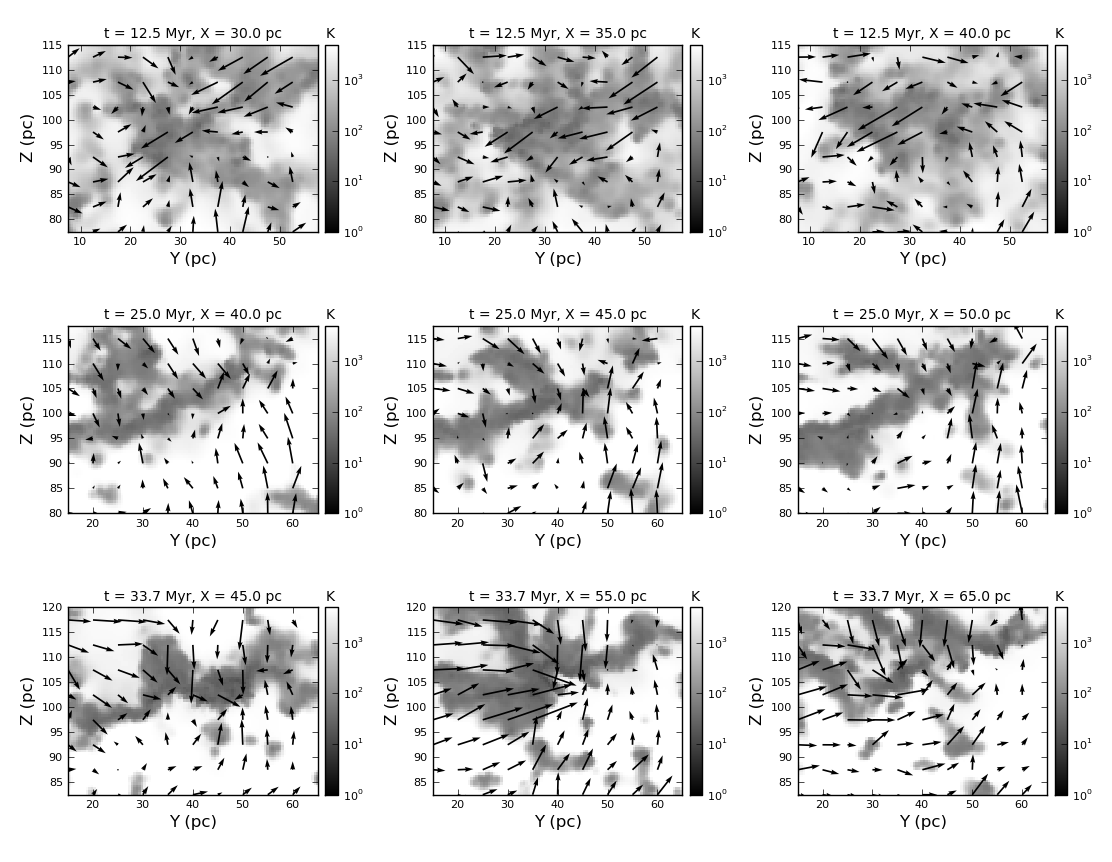
In Figure 3, for the same zoomed-in areas in the three timesteps, we show the velocity field in the direction and the gas temperature. As expected, comparing this figure with Figure 2, the low density gas has a high temperature (the equivalent of the warm neutral medium), while denser gas is cooler, and eventually turns molecular. However, it is also noticeable that there are cold Hi envelopes around the molecular gas.
| Time | ||||||
|---|---|---|---|---|---|---|
| (Myr) | () | () | () | (km s-1) | (km s-1) | (km s-1) |
| 12.5 (full) | 4.5 | 4.5 | 0.23 | |||
| (sub-region) | 5.9 | 5.9 | 0.49 | |||
| 25.0 (full) | 2.7 | 2.7 | 0.20 | |||
| (sub-region) | 3.3 | 3.3 | 0.41 | |||
| 33.7 (full) | 2.2 | 2.2 | 0.28 | |||
| (sub-region) | 2.5 | 2.5 | 0.55 |
In Table 1 we give the total, atomic, and molecular masses in the gridded volume as well as in the zoomed-in areas for the three times we study. It can be seen that the molecular mass fraction increases rapidly and that the velocity dispersion in the simulation decreases over time. The average density of the gridded volume increases slowly, namely 3.0, 3.5 and 4.1 cm-3 at each timestep respectively, where 3.0 cm-3 is also the average density of the full simulation volume. The increasing gas mass and density indicate that gas is flowing into the gridded volume, which was selected for its developing molecular cloud structures. This fact is also suggestive of gravitational contraction at the largest scales we are considering.
It is also instructive to compute the fraction of cold atomic gas in our simulation. This cold atomic gas exists when the local has not reached unity, at which point it would be deemed molecular. Krčo & Goldsmith (2010) found in their observational survey of molecular cores an abundance of cold Hi column density to total proton column density of or . In our simulation, we have computed the mass of cold Hi (being cooler than 50 K and having below unity) versus the total gas mass, finding ratios of 0.00014, 0.00055 and 0.00027 respectively for our three increasing timesteps, or consistently between half and one order of magnitude less than the values Krčo & Goldsmith (2010) found. This is probably a consequence of our ‘instantaneous molecule formation’ assumption which, as mentioned above, causes our molecular gas fractions to be upper limits. Also, this ratio can vary due to molecular clouds forming in a non-continuous fashion and due to gas entering and leaving the sub-volume of the simulation that we selected.
4 Synthetic Hi and CO profiles
4.1 Generation of the ‘observations’
One of the main goals of this contribution is to focus on the ‘observer’s perspective’. To this end, we derive Hi and CO line profiles. In order to perform the 21-cm Hi and CO(1-0) line profiles, we have assumed that both lines are in local thermodynamic equilibrium (LTE) for the population of the atom/molecule energy levels. This is a good approximation for the study of Hi profiles, since Hi clouds are dominated by collisions. In the case of molecular clouds, LTE is a reasonably good approximation to study the CO lines qualitatively, if the volume density is above a certain excitation threshold (Rohlfs & Wilson, 1996).
Since we know the detailed velocity, density and temperature fields, we have integrated the transfer equation along the line of sight, assuming that every pixel above the threshold has a blackbody emission at the corresponding temperature. The details can be found in Ballesteros-Paredes & Mac Low (2002). Here we just note that the Hi emission will come from every resolution element that is not deemed to be molecular, while the CO emission will come from molecular resolution elements ( and ) as well as having a number density above the local critical density, in order to avoid including molecules that are under-excited (Rohlfs & Wilson, 1996).
With this information, we can observe cold atomic gas as it is about to turn molecular. Even though atomic and molecular gas do not mix within individual cells in our synthetic observations, it can still appear that cold atomic gas coincides with molecular cores along a line of sight, if the cold atomic gas is either directly in front or behind the molecular gas. Because of this, our synthetic profiles should still look realistic, as long as they include a significant number of grid cells, which is generally the case. Note that, throughout this work, we use a velocity range of -15 to 15 and a velocity spacing of 0.15 .
For simplicity, we choose the line-of-sight direction along the -axis. Due to the randomness of the initial condition, there is no preferred direction and for our purposes it was unnecessary to specifically select clouds and produce synthetic line profiles along specific cloud axes. We leave those specific cuts for more specific future applications.
The CO line profiles were derived under the assumption that the ratio of the CO(1-0) to total molecular gas number density is (rather approximately) (e.g. Cernicharo & Bachiller, 1984; Pineda et al., 2008). In our case, varying the exact CO abundance leads only to a scaling effect in the line profiles, which in turn does not influence the morphology of the gas overall. Since we have not computed any actual chemical reactions, no further effects of the CO abundance exist in our simulation.
It is important to note that the critical density of molecular hydrogen is determined by the local temperature. Thus, a drawback of our approach is that we may miss some CO emission due to the limited resolution of the gridded volume, implying that we may be smoothing out a potentially clumpy medium. For example, if we have a molecular hydrogen density of 50 cm-3 with our standard grid cell size of (0.5 pc)3, and thus would not be labeled as CO by our procedure. However, it is possible that this gas was all concentrated in a volume of (0.23 pc)3 in the original SPH data cube, thus having a density of 500 cm-3, which, depending on the temperature, would already be quite close to the critical density for CO emission to occur, and therefore should be labeled as CO.
We will distinguish between column densities derived from the simulation directly and the inferred ‘observational’ column densities. The former are derived directly from the mass density cube by integration along the LOS (which is 128 pc), assuming a mean particle mass of for the calculation of , and for . On the other hand, for from the Hi and CO brightness temperature profiles we also produce velocity-integrated maps of () and () respectively. These are the ‘observational’ quantities. It should be noted that is only calculated to provide a familiar quantity and is not meant to predict any absolute values, as no distance to the simulation volume was used or any kind of telescope resolution effects. The Hi column density was computed from the Hi brightness temperature profile using the common assumption of the atomic gas being optically thin.
4.2 Analysis of the profiles
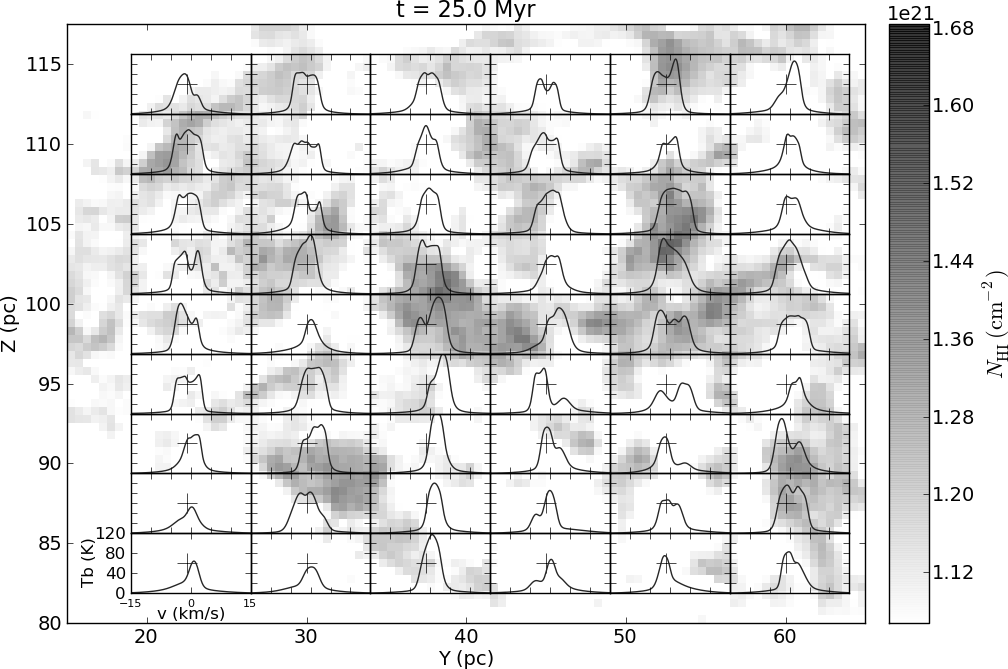
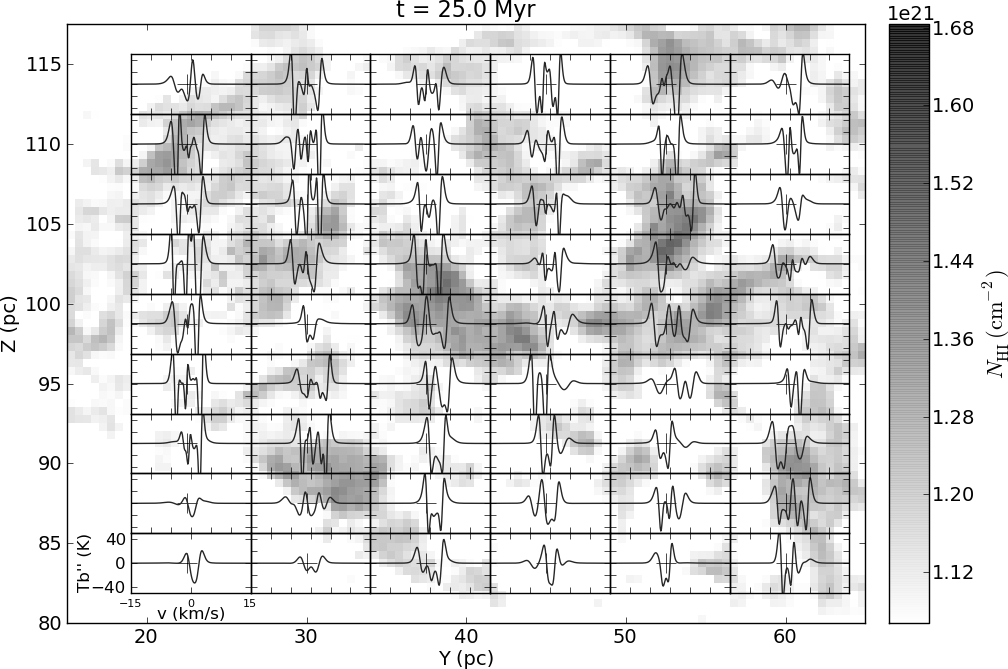
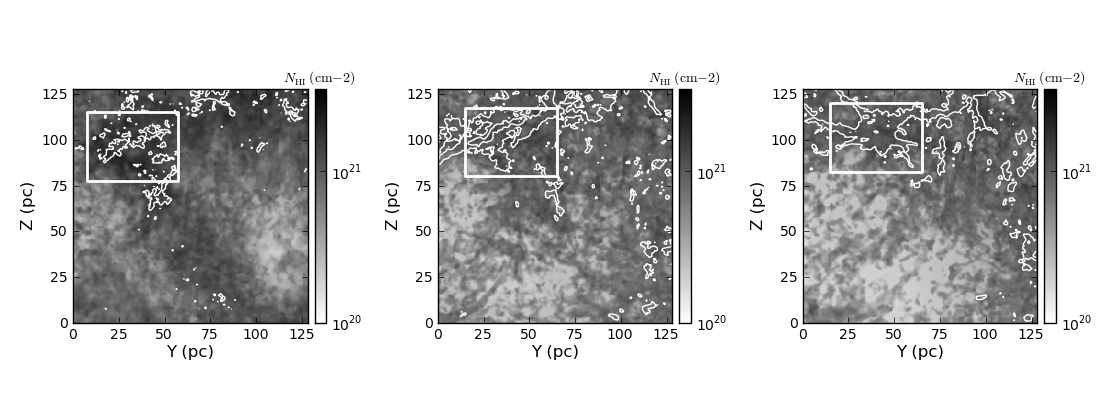
Figure 4 shows the integrated Hi column densities at our three timesteps and selection boxes (white rectangles) highlighting regions of interest because of the presence of molecular cloud structure. Extended gas structures are visible at a level of about 30 cm-3, permeating the entire 128-pc gridded volume. Our volume contains a large underdense region (below 1 cm-3) that persists throughout our three timesteps under consideration, surrounding the dense, evolving dense clouds.
It is remarkable that, in spite of the obvious constraints and limitations of the simulation, there is a striking resemblance to the Taurus molecular cloud and its immediate surroundings in the first timestep (Figure 4). The region contains a molecular cloud in the upper left hand side, next to something that appears to be a cavity in the Hi gas, surrounded by a diagonal band of Hi. This type of structure could be labeled as an Hi (super-)shell, although our simulations does not include the kind of supernova feedback that might produce Hi supershells. We merely point out the resemblance to caution that the 2D projection of the atomic gas may look like a supershell, but further kinematic confirmation should be sought.
Figure 5 shows a zoom into the selection box of the 25-Myr timestep, showing Hi brightness temperature profiles at various locations. The Hi profiles almost universally show a depression around the zero-offset velocity. This depression may be caused either by a lack of atomic gas or by self-absorption. It is hard to determine from the observations alone which of these possibilities is the actual cause of the dip in the profile, but in the rest of this contribution we will explore the possibility of doing so, taking advantage of our having the full information about the fluid variables available in our simulated volume.
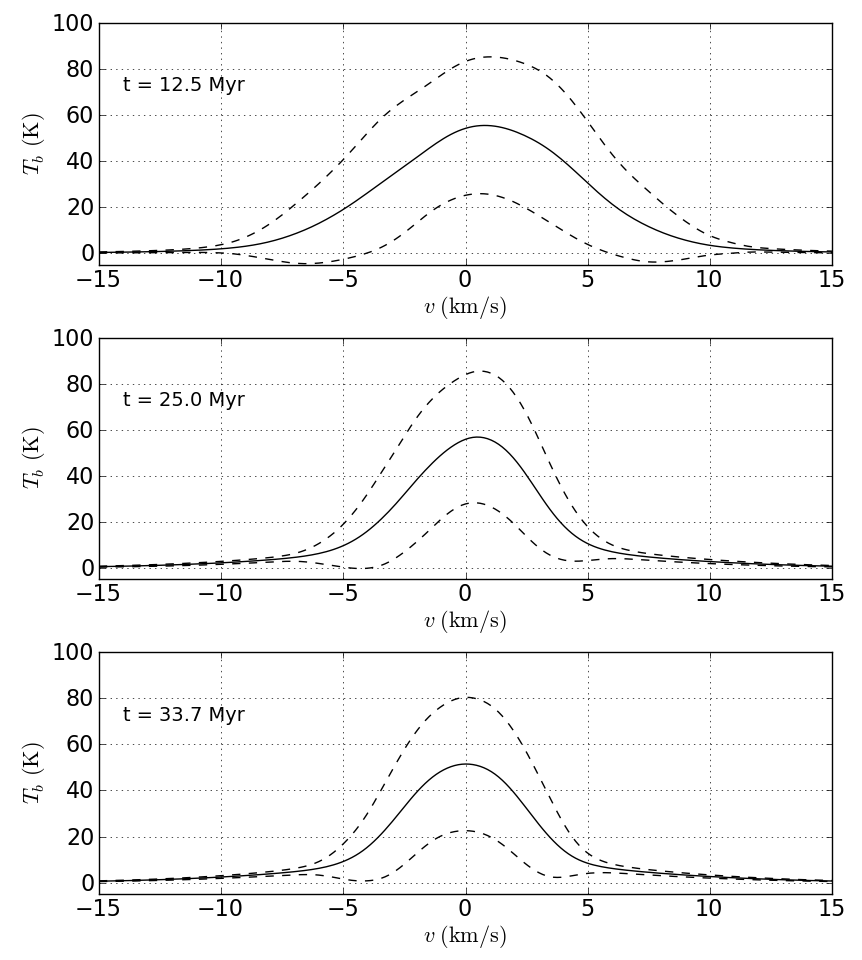
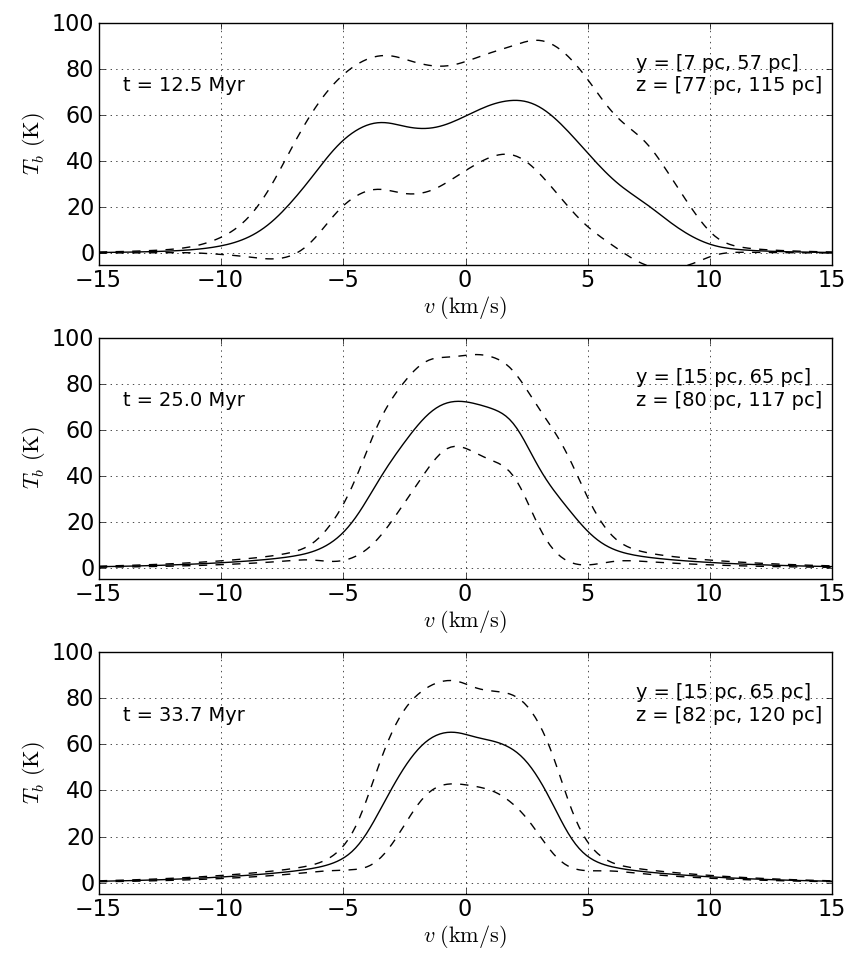
Averaging all Hi brightness profiles in the gridded cube leads to relatively featureless profiles (Figure 6, left column), although they do show that the velocity dispersion of the gas in the gridded cubes decreases as time progresses, due to the decaying turbulence. On the other hand, zooming into a specific region of the simulation box where molecular gas has formed yields profiles with more structure. Most notably, the profiles display the familiar central depression (Figure 6, right column).
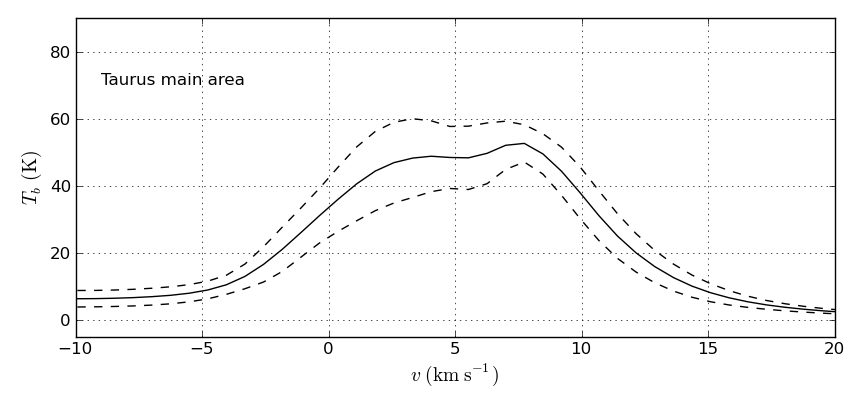
Since the smaller region is selected to be approximately at the same spatial location at all three times shown, the averaged profile changes significantly from one time to the other. At the middle time, very little structure is present, while at the other timesteps more structure is seen, which is most likely caused by converging flows of gas. Finally, to show the qualitative agreement, we show in Figure 7 an averaged Hi profile of the main Taurus region, using data from the Arecibo GALFA-Hi (Peek et al., 2011) survey. Particularly, the velocity dispersion is comparable. The Taurus cloud is estimated to have linear dimensions of 32 5 pc (e.g., Ballesteros-Paredes et al., 2009). Our simulation volume is large enough to contain Taurus-like structures. The velocity dispersion at the earlier time shown from our simulation is the closest to what is seen in Taurus, consistent with the view that the Taurus area is still relatively young (e.g., Hartmann et al., 2001; Luhman et al., 2003, 2007; Pineda et al., 2010).
5 Molecular gas and HISA
5.1 Identifying Hi self-absorption features
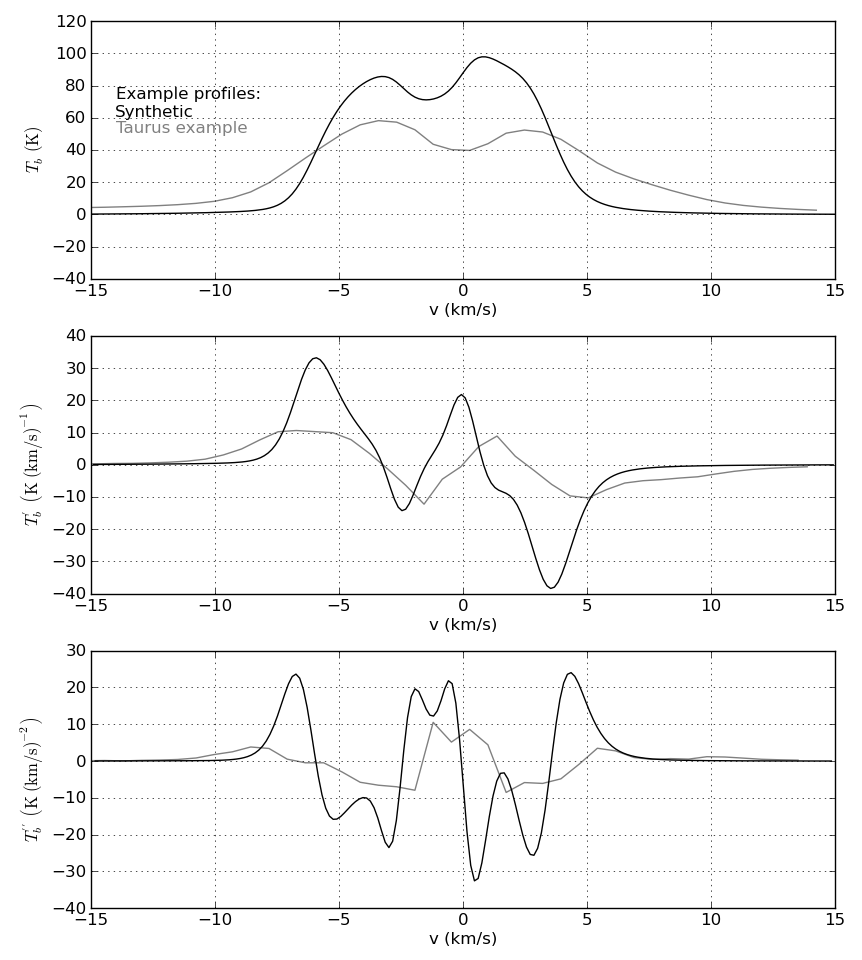
In Heiner & Vázquez-Semadeni (2013), we used the second derivative of the Hi profile as a tracer for Hi self-absorption, and by extension, as a tracer for cold atomic gas. This approach was inspired by Krčo et al. (2008), who used the second derivative of the Hi line profile in combination with molecular (CO) emission line data to correct the Hi profiles for self-absorption. Their rationale was that Hi line profiles are approximately gaussian in nature, and that the profiles of HISA are much narrower than those of the background emission, so that an Hi self-absorption feature will become progressively more dominant in progressively higher derivative profiles, while the overall emission profile will fade into the background. Krčo et al. (2008) concluded that using the second derivative is sufficient to locate potential self-absorption features with relative ease. Additionally, they required the presence of CO emission: When it was present, they referred to this as ‘Hi narrow self-absorption’, or HINSA for short, although we will stick to the more general term HISA here. In what follows, we will explore the uncertainties involved in using the second derivative of the Hi profile, whether or not supplemented by CO observations.
In the top panel of Figure 8 we show typical Hi line profiles, and their first and second derivatives respectively in the middle and bottom panels. The black lines represent a profile from our simulation at 12.5 Myr at an arbitrary location, whereas the gray line represents a typical Hi profile from the Taurus molecular cloud, from the GALFA survey. It can indeed be seen that the dips in the profiles become prominent in the second derivative, since sharper dips produce stronger features in the second derivative. The Taurus profile is starting to be dominated by noise in the second derivative, but its HISA-indicating peak is still prominent. Note that the wings of the second derivative of the profile in the synthetic case are much more prominent, which is a result of our brightness temperature profiles being steeper than a typical Taurus profile. This property is an important clue to the composition and physical conditions of the gas, but a more thorough investigation of this issue is beyond the immediate scope of this work.
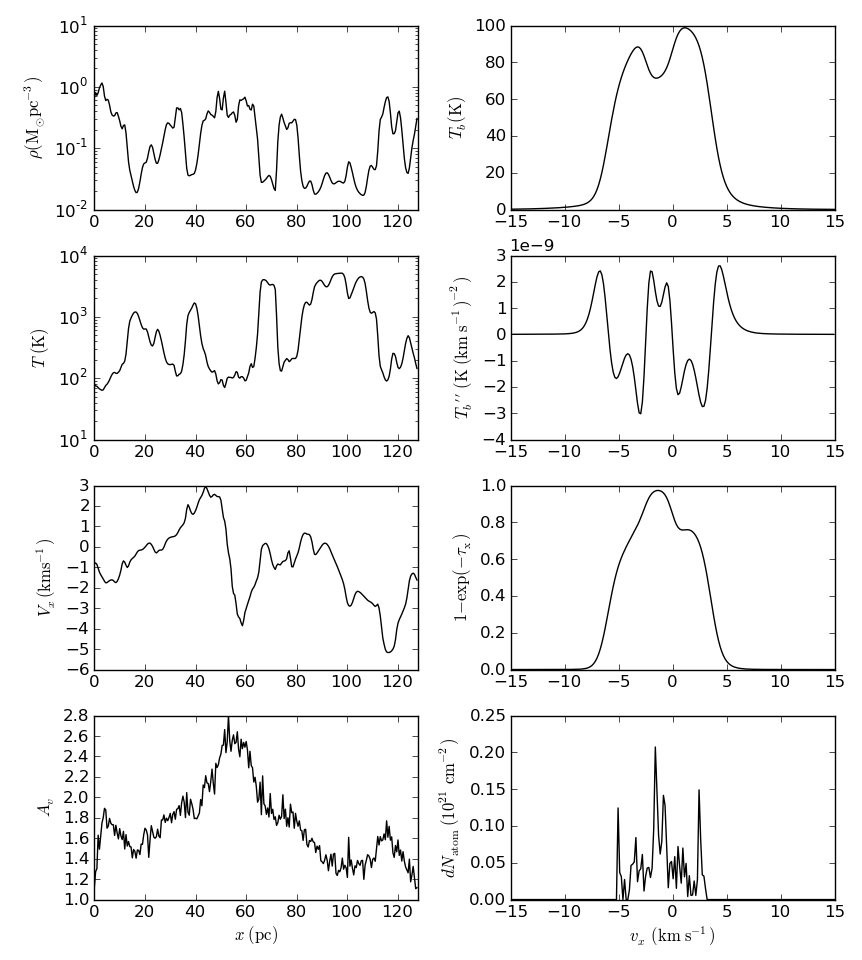
As mentioned above, it is often unclear from observations of the Hi line profile whether a dip in the profile is caused by self-absorption or by a lack of atomic gas. Depending on the local morphology of the cloud, the lack of atomic gas may imply the presence of molecular gas, but then an additional tracer of the molecules is needed. Figure 9 shows, for the position on the plane used in Figure 8, the density, temperature, velocity distribution and visual extinction along the spatial coordinate, as well as the brightness temperature, its second derivative, opacity and atomic column density per velocity interval (in the velocity coordinate). Hennebelle et al. (2007) showed similar plots and noted that individual cloudlets cannot be distinguished observationally along the line of sight due to thermal broadening. The same can be seen in our figure.
Since our goal is to test how well HISA correlates with the molecular emission, we need to make sure that what we identify as HISA is indeed due to Hi self-absorption, and not just to a lack of emission. To this end, we take advantage of the fact that the radiative transfer code producing the Hi line profile also records the local opacity. Thus, we can easily search for those instances where dips in the Hi profile closely match peaks in the opacity () along the velocity coordinate.
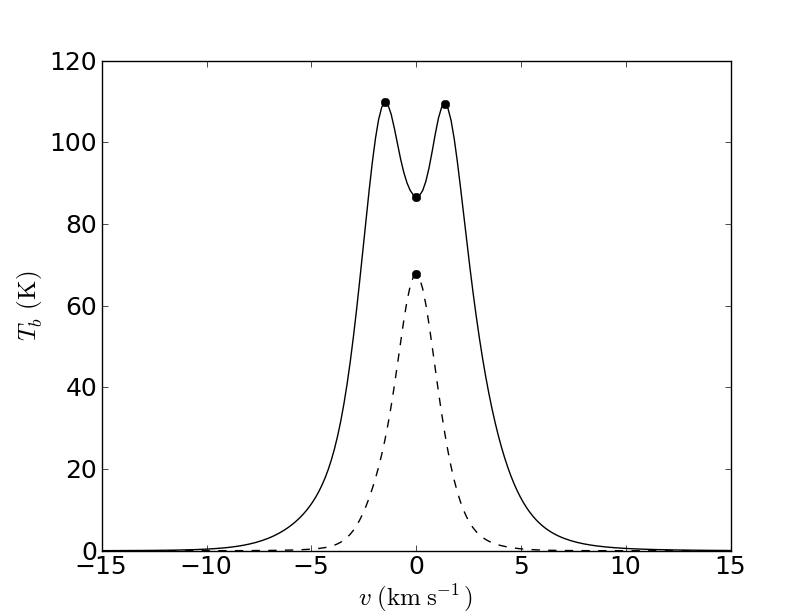
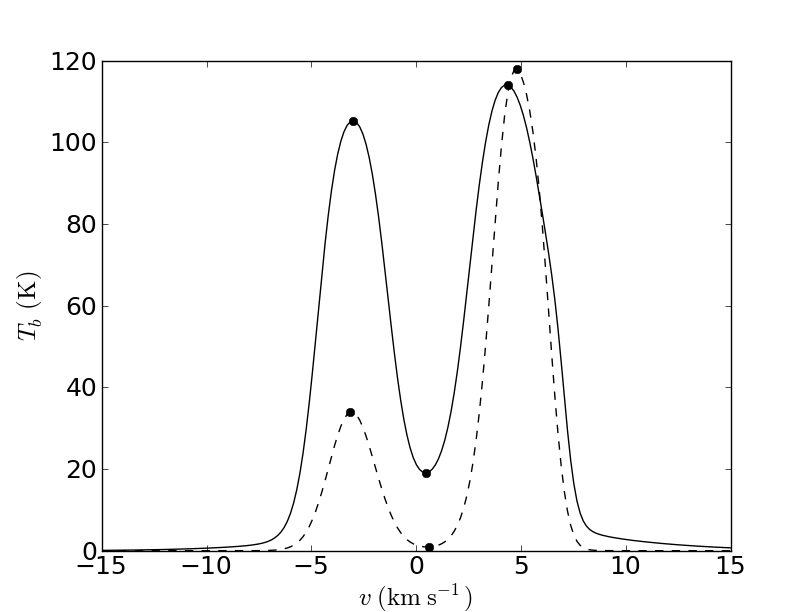
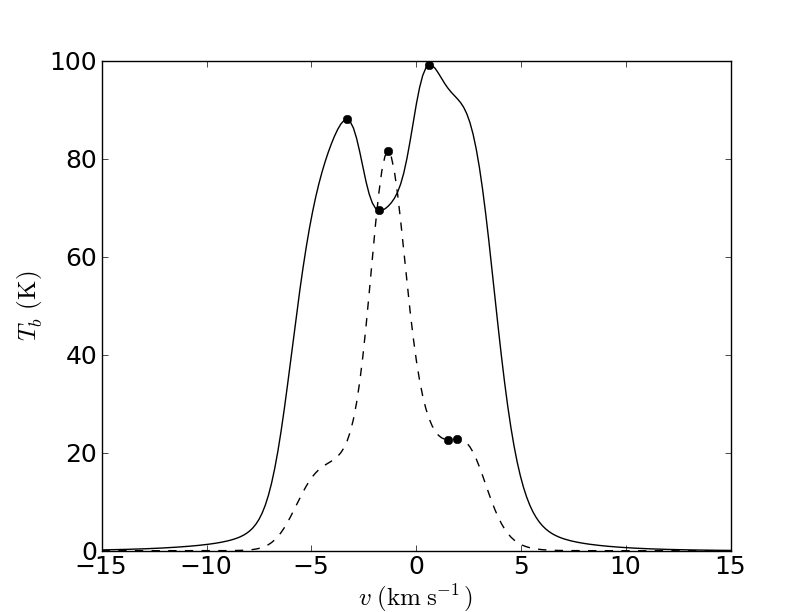
Figure 10 illustrates this process for a profile with an emission dip matched by an opacity peak (left panel), a non-HISA profile (middle panel), and a slightly more complex profile (right panel) — all taken from individual positions in the simulation. The peak in the opacity does not have to be exactly at the same velocity as the minimum brightness temperature of the Hi profile dip, as there could be foreground or background material emitting in the same velocity interval, partially filling up the dip and displacing it from the opacity peak. We thus (arbitrarily) choose to find opacity peaks in a range of , or four velocity channels in each direction.
Not all instances of HISA are located this way, though, as the profile on the right panel of Fig. 10 illustrates. The second opacity peak in this plot results in an inflexion point in the Hi profile, which we do not count as HISA, since we only flag local minima. But at least we guarantee that everything that we label as HISA indeed corresponds to self-absorption. Additionally, we record the depth of the HISA-induced feature relative to the adjacent peaks in the profile, a quantity we refer to as the dip depth. We use this information to check for correlations between the depth of the HISA features and the local molecular gas content.
Applying this Hi-minimum/opacity-peak matching process for every spatial pixel, we obtain a mask of locations where true HISA is detected. We will refer to this as the HISA mask map. In addition to being a mask, however, this map contains the values of the HISA dip depth, thus providing not only an on/off switch for where ‘true HISA’ is detected, but also a measure of the strength of the absorption feature. When we consider these values for comparison, we will indistinctly refer to this as the ‘HISA dip depth map’. To reduce the number of false positives, we also require that the matching opacity peak be closer to the dip in than the nearest opacity (local) minimum. This mask can then be compared to the HISA derived from the second-derivative method and to molecular gas emission.
5.2 Strength of the HISA features compared to the ‘real’ HISA
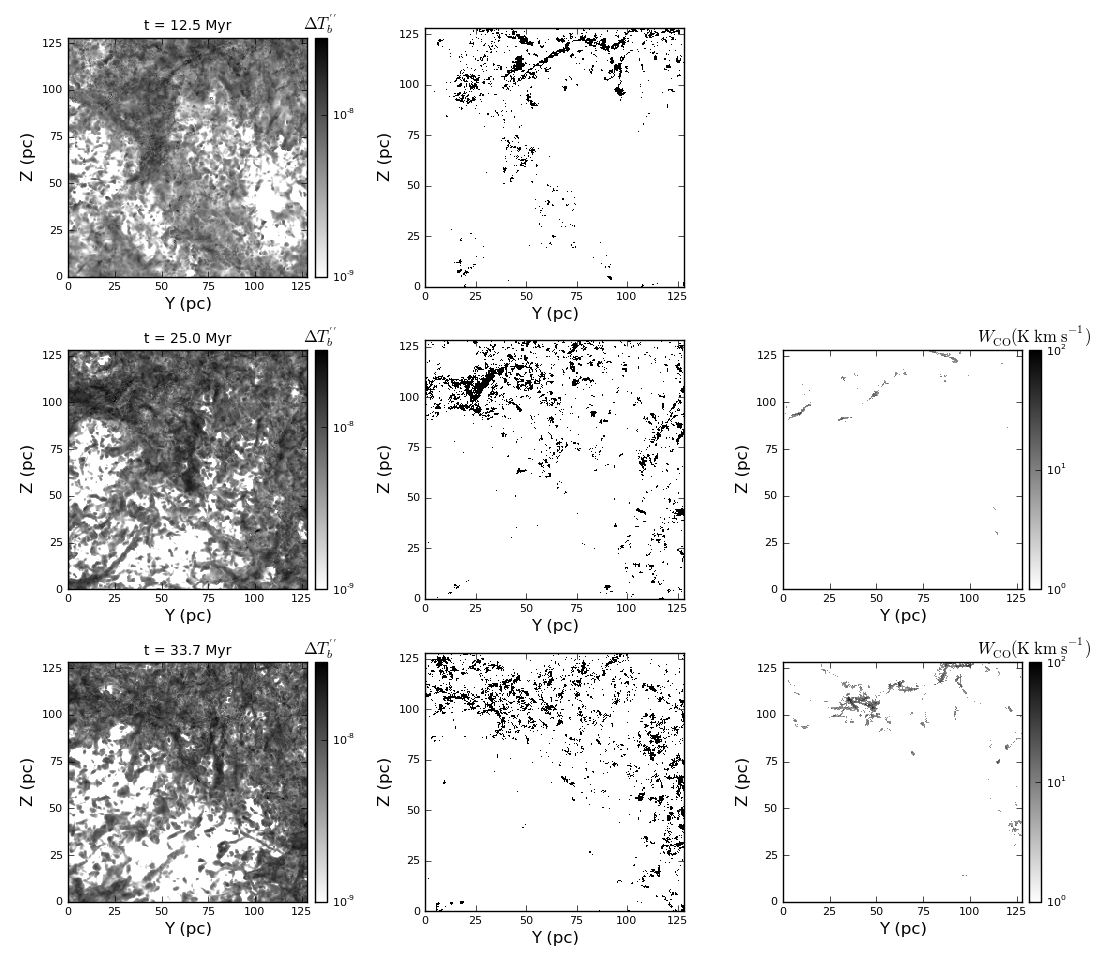
Analogously to the procedure inspired by Krčo et al. (2008) that we used in Heiner & Vázquez-Semadeni (2013), we have constructed a ’HISA strength’ map that is simply the maximum minus the minimum value of the second derivative of the Hi brightness temperature profile (). Since narrow self-absorption starts to feature prominently in the second derivative of the line profile, measuring the largest local difference in its value can be considered a reasonable proxy for the presence and the amplitude of the HISA feature. However, based on the Hi profile alone one cannot distinguish between HISA and the lack of atomic gas, which is why Krčo et al. (2008) required the presence CO emission at the position on the plane of the sky (POS) where HISA was to be identified, as a condition to declare the reduced Hi emission as indicative of HISA. In Heiner & Vázquez-Semadeni (2013), we did not explicitly require CO emission, but the region of interest (Taurus) is a well-known molecular cloud, with a well-known presence of CO, so dropping the CO requirement had no obvious consequences. Now, we can begin to use our simulation to estimate how reliably the HISA strength map, by itself, traces HISA.
Figure 11 shows, from left to right, the HISA strength map, the HISA mask and the integrated CO intensity. It can be seen that the HISA strength map shows the most features, which in part can be seen on the HISA mask. Finally, only a small fraction of the features in either map are seen in CO emission.
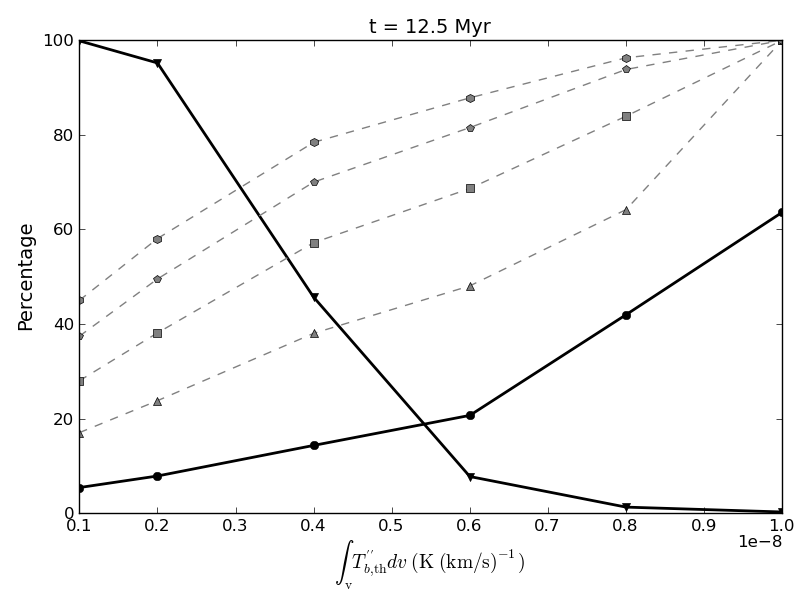
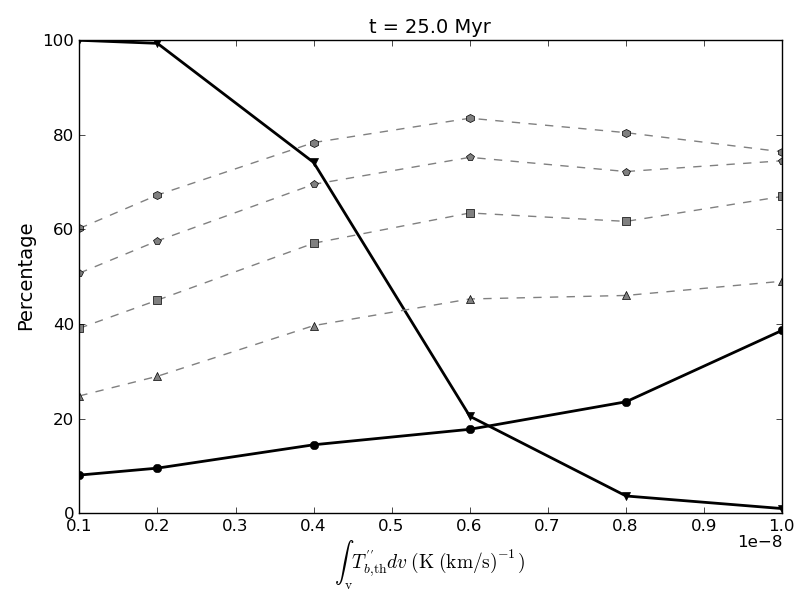
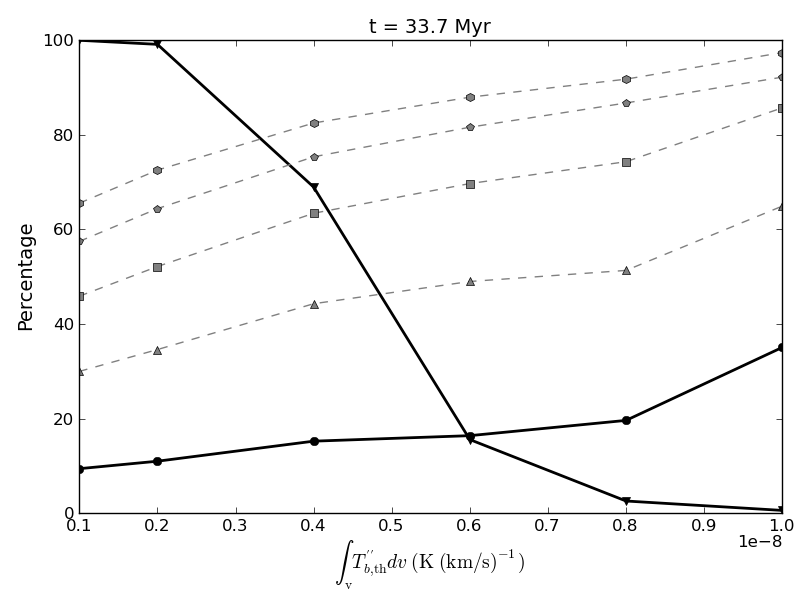
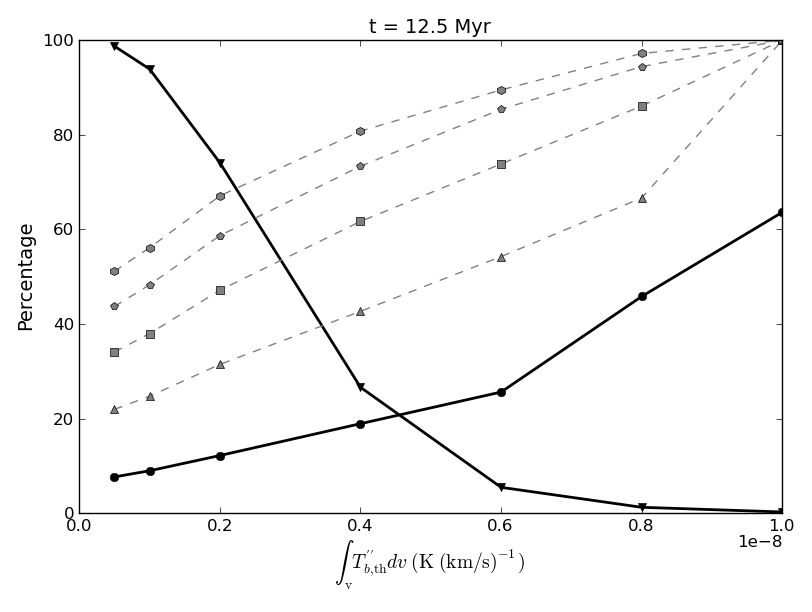
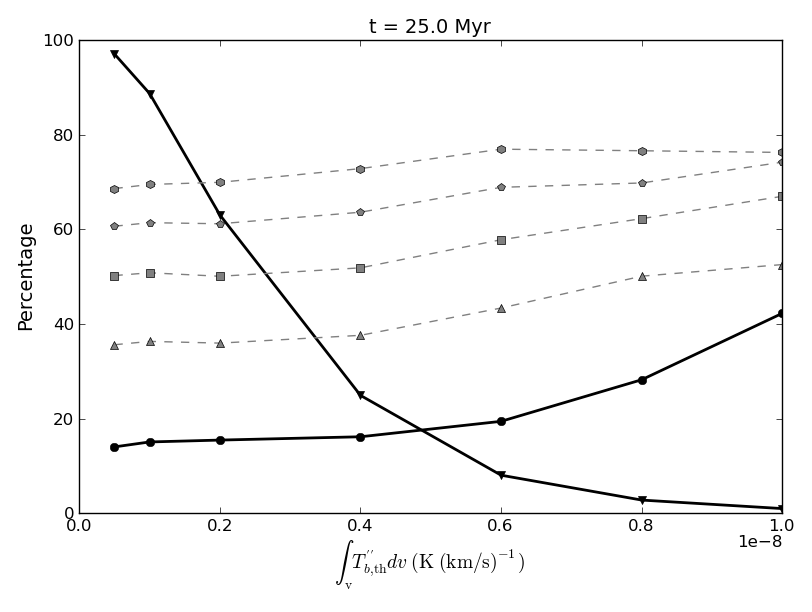
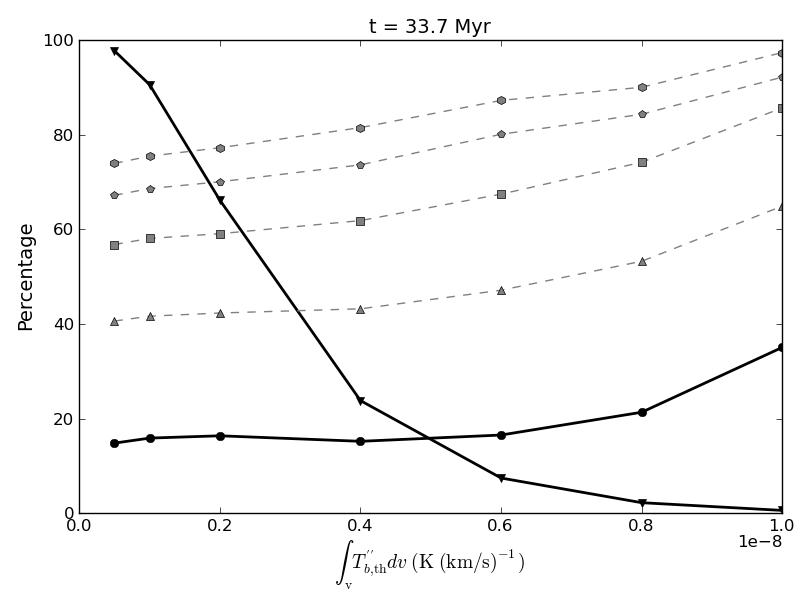
By using the term HISA strength, we assume (or imply) that higher values of HISA strength correspond to higher odds of a particular pixel in the map representing actual HISA. In reality, there is no clear relation between the HISA strength and any actual HISA amplitude. Still, we test this assumption in Figure 12, by showing how well the pixels in the HISA strength map correspond with the HISA mask.
In order to make this comparison, we adopted a slightly different definition of HISA strength that allows different thresholding values, namely, we used increasing threshold values of the integrated second derivative of the Hi profile, summing the contributions of the points along the LOS that are above the threshold. This allows us to consider a scale of increasing HISA strength. As this threshold is increased, fewer and fewer pixels will be captured in the spatial plane. Thus, we only count the number of pixels that are left after applying each threshold value, and then check how many of those pixels also lie on the HISA mask.
We define a ‘match success rate’ as the percentage of pixels where the HISA strength pixels above a certain threshold match with corresponding HISA mask pixels (implicitly assuming the HISA mask to be superior, although not perfect). We also counted the percentage of pixels in the HISA mask map that are above the threshold in the HISA strength map. This latter percentage drops monotonically for increasing values of the threshold, reflecting the declining number of pixels in the HISA strength map as the threshold value increases. Combining the two percentages (Fig. 12) shows that while the success rate goes up for increasing values of the threshold, the number of points with which this is achieved goes down. For lack of a perfect correspondence, a balance should be achieved between the success rate and the number of pixels with which this is achieved if one were to optimize the detection of HISA.
Since we already noted that the HISA strength map and the HISA mask agree well on a coarse scale, but less accurately on a fine scale (cf. Fig. 11), we also check for nearby HISA mask pixels for every HISA strength map pixel, which is effectively a form of smoothing. Figure 12 also shows the success rates when HISA mask pixels are found within one, two and three pixels respectively, where by ‘a distance of one pixel’ we mean that we search in a -pixel box (or, equivalently, in a -pc box) with the HISA strength map pixel at the center. Interestingly, even searching within just one pixel already doubles the typical success rate, while searching within three pixels (a -pc box) approximately quadruples the original success rate or more. This means that, while the HISA strength maps do not correspond very well to the occurrence of actual HISA (as approximated by the HISA mask map) on a pixel-by-pixel basis, they do correspond in majority to actual HISA within a distance of about 3 pc.
Comparing the three different timesteps, the first thing to note is the sharp drop in the percentage reflecting the number of pixels above the threshold values. At the highest threshold value, this percentage reaches a nearly zero value in all three timesteps, indicating that applying a higher threshold will yield no improvement. Next, for the first timestep we see that the success rate increases sharply with an increasing threshold, although the number of pixels in the mask drops sharply as well. However, for the other two timesteps the success rate does not rise as sharply with an increasing threshold, even when smoothing is applied. Basically, in these cases, increasing the threshold value does not significantly improve the correspondence, and the only way to improve it is to apply smoothing.
One potential problem with using the second derivative of the brightness temperature profile () is that in our simulations, the wings of the profile become very prominent in the profile, which is indicative of steep line profile wings (see e.g. Figure 8). In the profile, these wings can have higher amplitudes than the peak caused by HISA at the center of the profile. Because of our definitions of HISA strength that are directly related to the amplitude of , it is possible that our HISA strength measures are contaminated by profiles that are purely steep with no absorption feature. By comparison, the Taurus line profiles have relatively broad and shallow wings and therefore do not suffer from this problem: the peak in is caused almost exclusively due to dips in the center of the profile. However, this could be due partially to the poorer velocity resolution of the Taurus data.
In order to see whether this contamination influenced our success rate, we blindly blanketed out (i.e. set to 0) the outer wings of the second derivative. This is fairly trivial since all emission profiles increase initially from both ends of the velocity axis towards a peak. The resulting success rate plots are shown in Figure 13, where it can be seen that this procedure has very little if any effect on the success rate. In other words, the steep profiles and the resulting dominant wings in the second derivative of the line profile do not cause significant problems in the identification of HISA features.
5.3 Comparing HISA to the CO emission
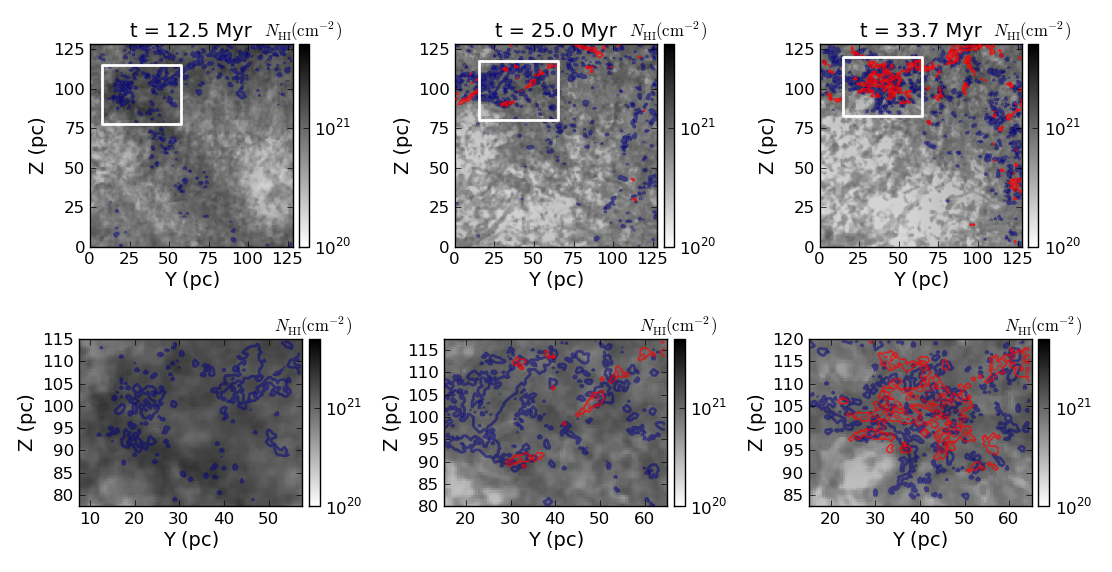
After considering to what extent HISA strength maps can trace actual HISA, we will now look at the connection between HISA and molecular gas: Firstly, the CO gas. A one-to-one relation should not be expected, since HISA itself is caused by atomic rather than molecular gas, but it is generally thought that the presence of HISA is a sign of atomic gas in the process of turning molecular. Therefore, HISA should at least be expected to occur near molecular gas.
In the top panels of Figure 14 we show qualitatively how the atomic gas (, grayscale) and the CO emission (, thin red contours) relate to the HISA mask map (thick blue contours). We remind the reader that no CO emission was produced at the first timestep. In the bottom panels of Figure 14 we zoom into a smaller region (roughly the same region in all three timesteps). It can be seen that the HISA mask dip depth contours mostly border the CO emission contours as one might expect from cold atomic gas moving towards sites where it turns molecular.
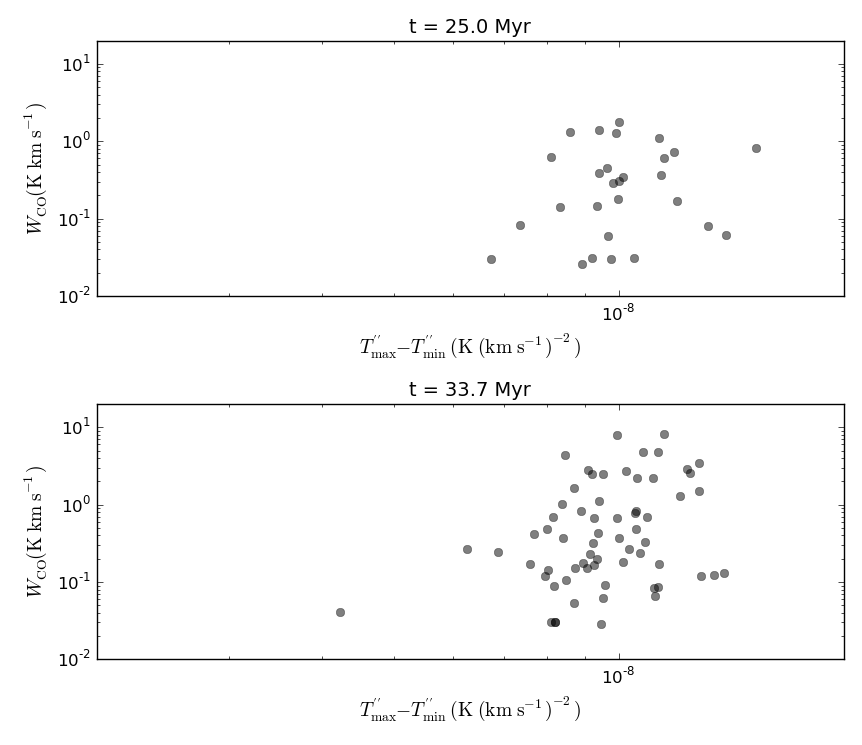
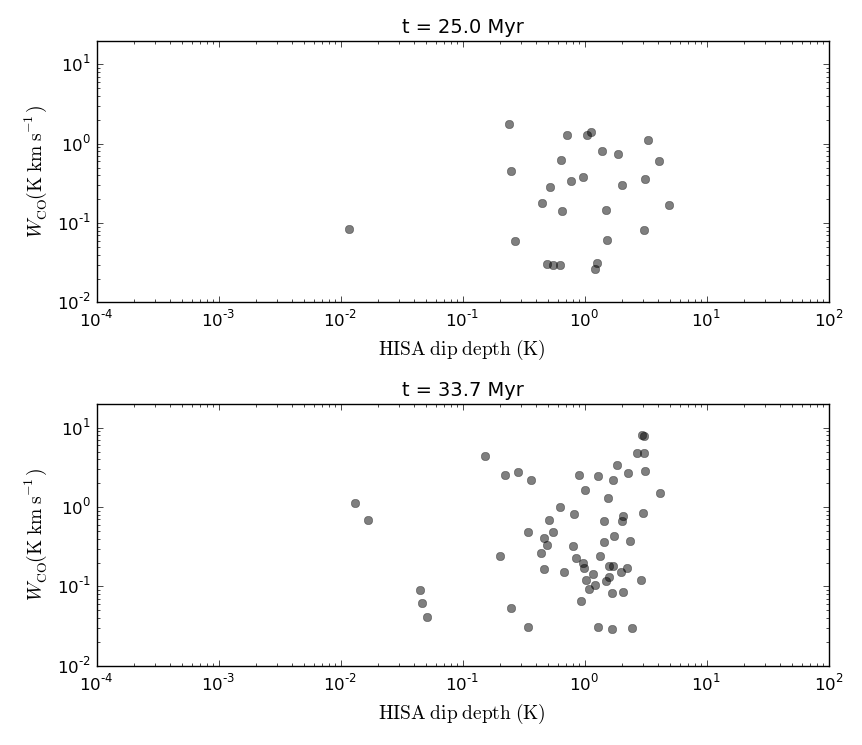
We compared the two HISA measures to the integrated CO emission and found a very poor correlation (if any), even after averaging the data to -pc pixels, as shown in Figure 15. The averaging size was chosen based on the possible correlation between the HISA features and the molecular gas: See the next Section. Of course if the correlation is very poor as is the case here, smoothing of any kind does not improve the correlation much. There are relatively few points in these plots as only resolution elements above the critical density of CO result in CO emission and therefore the CO gas is a subset of the total molecular gas.
5.4 Comparing HISA to the total molecular gas and CO-free gas
| Time (Myr) | Res. (pc) | ||
|---|---|---|---|
| 12.5 | 1 | 0.38 | 0.19 |
| 2 | 0.44 | 0.26 | |
| 4 | 0.53 | 0.35 | |
| 8 | 0.65 | 0.55 | |
| 16 | 0.75 | 0.79 | |
| 25.0 | 1 | 0.33 | 0.20 |
| 2 | 0.40 | 0.26 | |
| 4 | 0.48 | 0.33 | |
| 8 | 0.56 | 0.50 | |
| 16 | 0.64 | 0.59 | |
| 33.7 | 1 | 0.26 | 0.17 |
| 2 | 0.33 | 0.25 | |
| 4 | 0.42 | 0.42 | |
| 8 | 0.50 | 0.61 | |
| 16 | 0.54 | 0.72 |
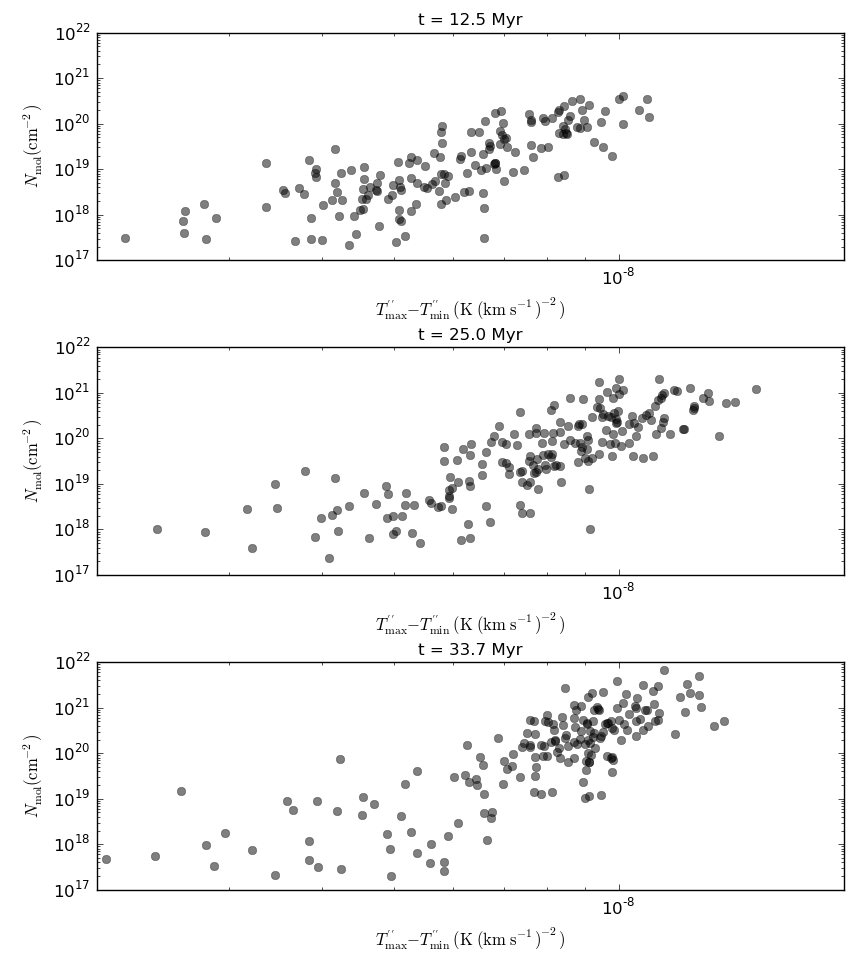
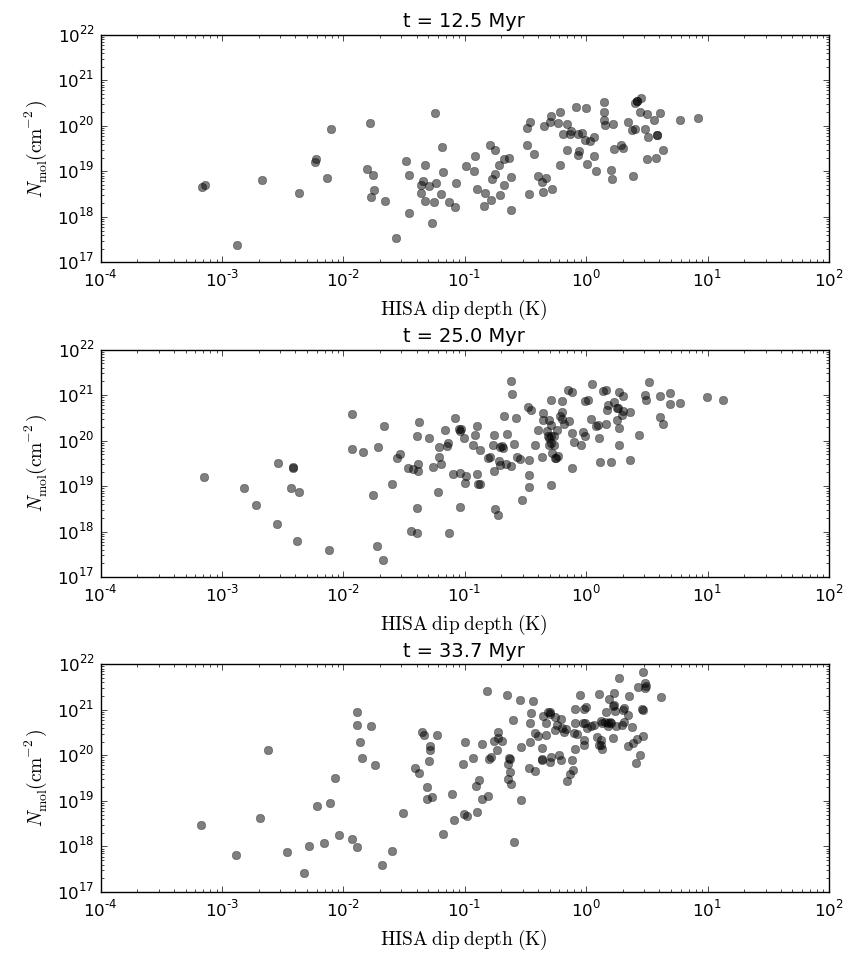
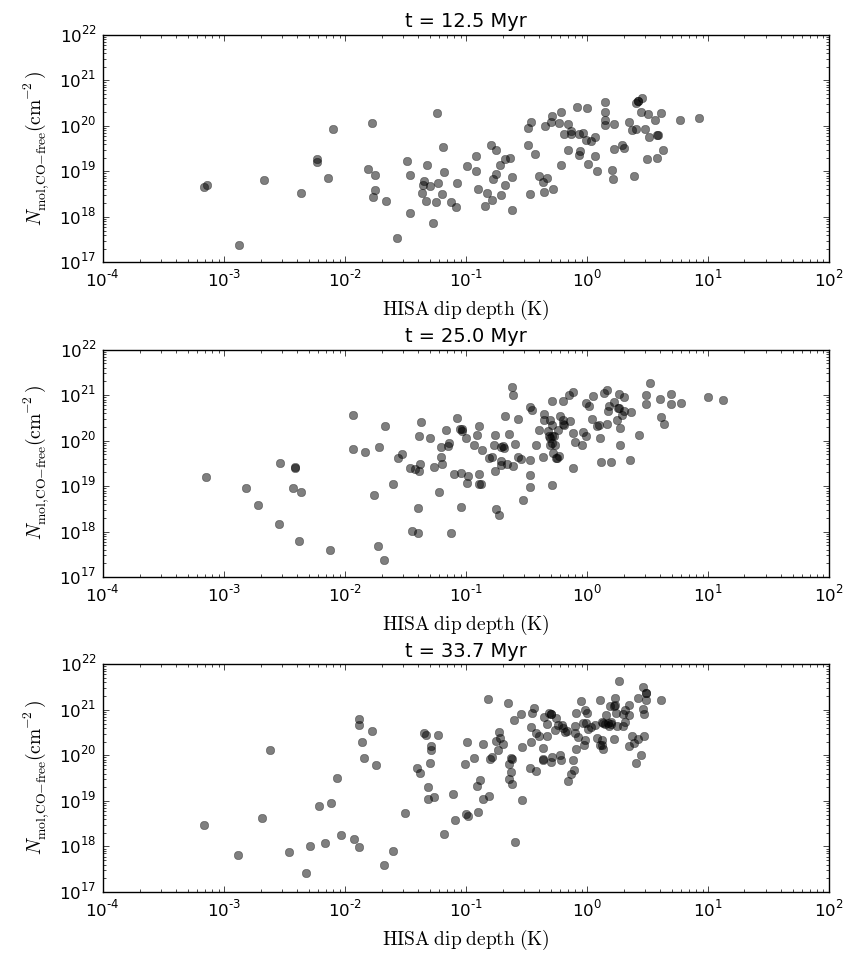
We now compare the HISA strength and HISA mask maps to the maps, keeping in mind that the correspondence between HISA strength and HISA mask is far from perfect (see the success rate plots, Figs. 12 and 13). In the top left panel of Figure 16, we show the HISA strength measure against the molecular gas column density (the quantity derived directly from the simulations as described previously), having averaged the data to -pc pixels. Averaging over fewer pixels worsens the correlation and at the native 0.5 pixel separation there is barely any correlation visible. This indicates that indeed there is a correlation, although only at the level of neighboring positions, rather than at the same projected position in the POS.
The top right panel of Figure 16 shows the same correlation, but using the HISA dip depth map values. It can be seen that deeper dips tend to correspond to a higher molecular column density. Taking these two figures together, it can be noted that both the HISA strength and the HISA mask methods seem to show a similar weak correlation, even though the HISA strength and HISA mask maps are not identical.
Table 2 lists the correlation coefficients for various pixel sizes. Pearson’s r correlation coefficient is a measure of how strongly two quantities are correlated, with a value of 0 meaning no linear correlation, and a value of 1 meaning a perfect linear correlation. We used the SciPy library111http://www.scipy.org to compute this coefficient, which uses the standard definition of Pearson’s r. We computed and for each timestep and pixel size, where the pixel values were calculated as averages over the number of native pixels (0.5 pc)2 contained within each pixel. It can be seen that the correlation coefficients increase with increasing pixel size.
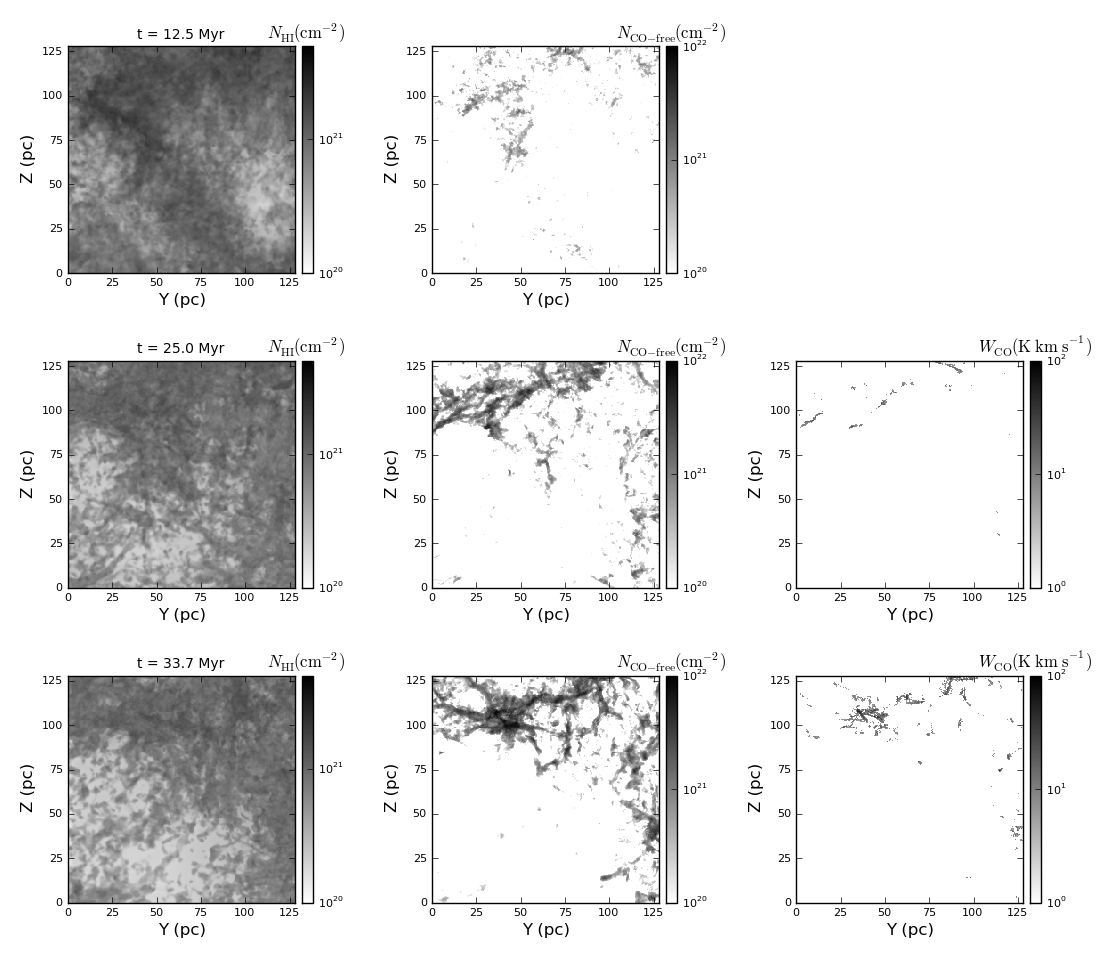
For completeness, we show in the bottom panel of Figure 16 the correlation between the CO-free gas column density, which is virtually indistinguishable from the plots with the total molecular gas column density. The reason for this is that the CO-emitting gas constitutes a small enough fraction of the total molecular gas content (in terms of particle number density) to be unnoticeable on a logarithmic scale. Qualitatively, we show the maps of the CO-free and CO-emitting gas in Figure 17 next to the atomic hydrogen column density map. The percentages of CO-free gas mass relative to the total molecular gas mass are dropping steadily at each successive timestep: Respectively, 100, 93 and 79 per cent. These values could in principle be compared to the dark gas fractions reported recently by Smith et al. (2014), although their simulations were set up differently and also included explicit modeling of the gas chemistry.
6 General structure of the clouds
6.1 Evolution of the PDFs
In order to show the distribution of the gas density in the simulation volume, we produced the (volume weighted) volume ()- and column () density probability density functions, as plotted in Figures 18 and 19. In all cases we fit (by-eye) a log-normal gaussian to the higher density end of the distribution to draw attention to the qualitative shape of the PDFs.
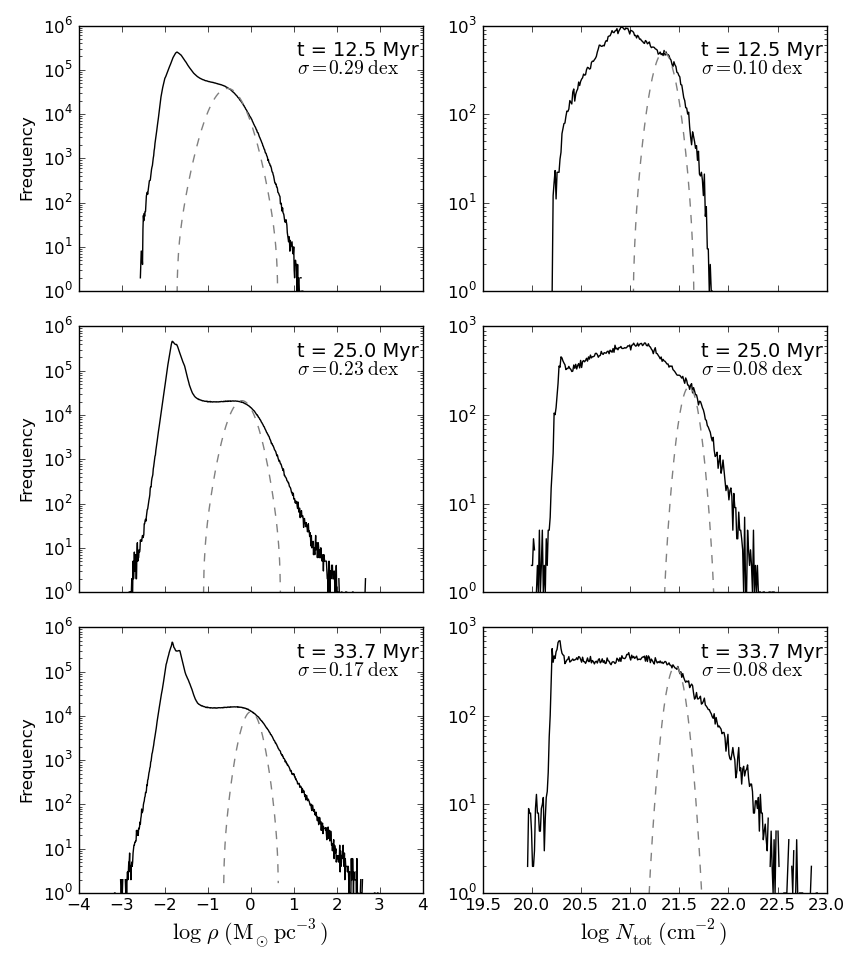
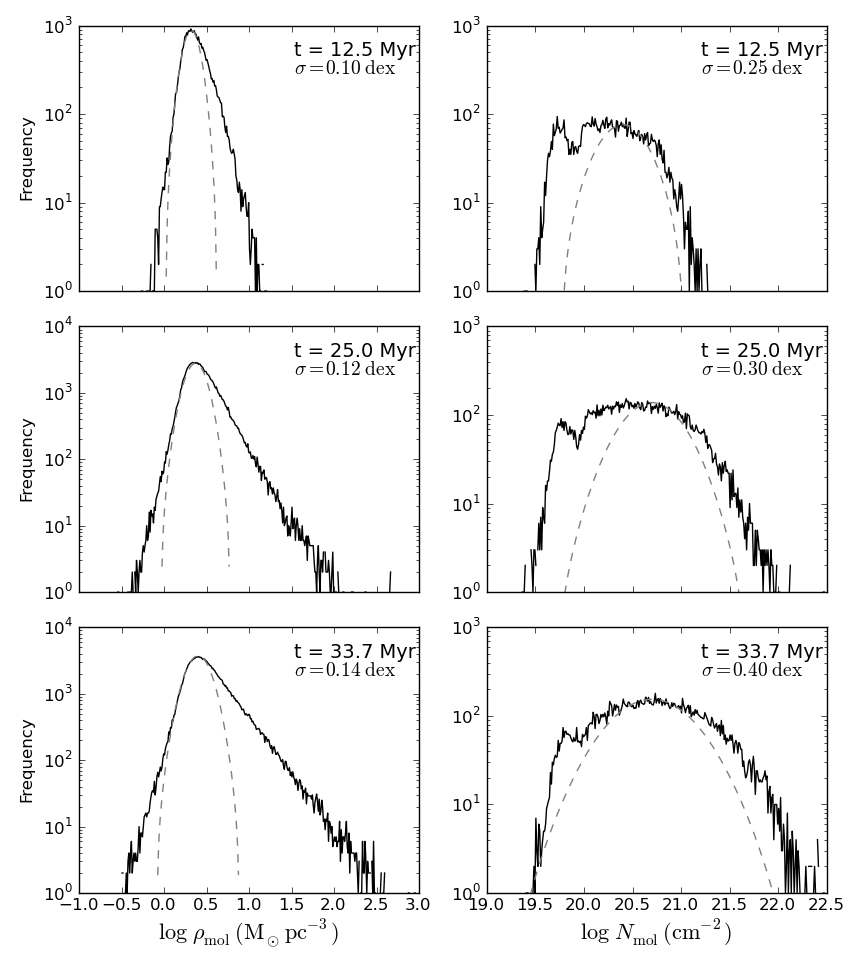
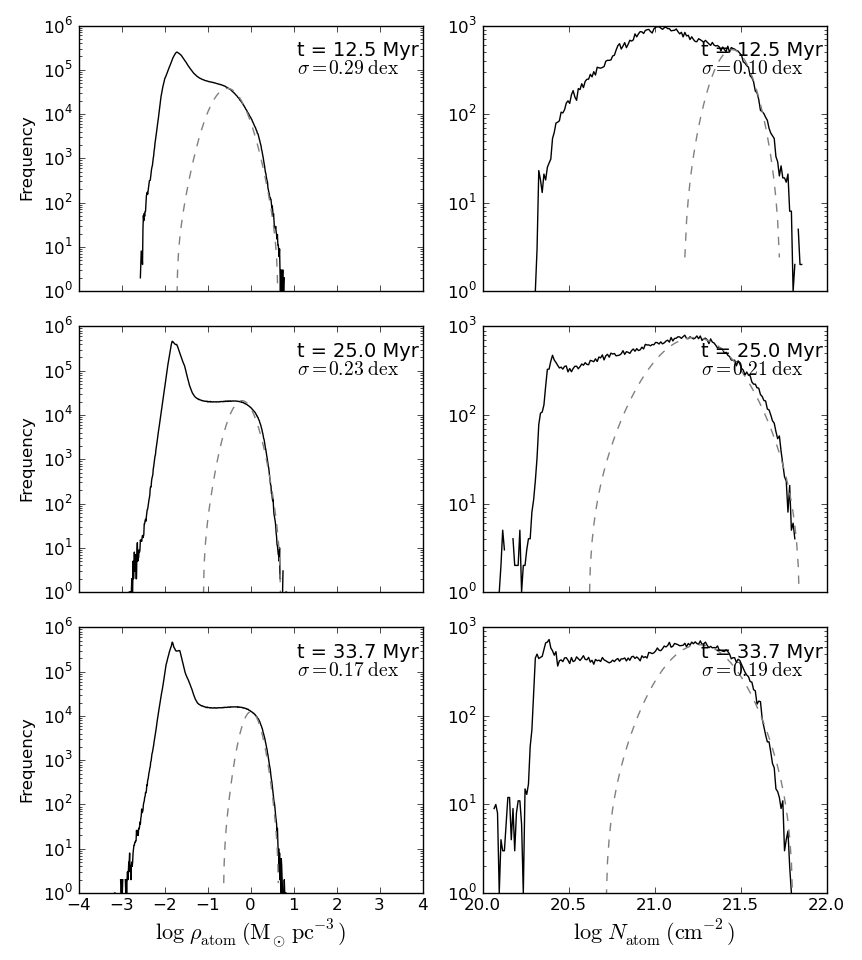
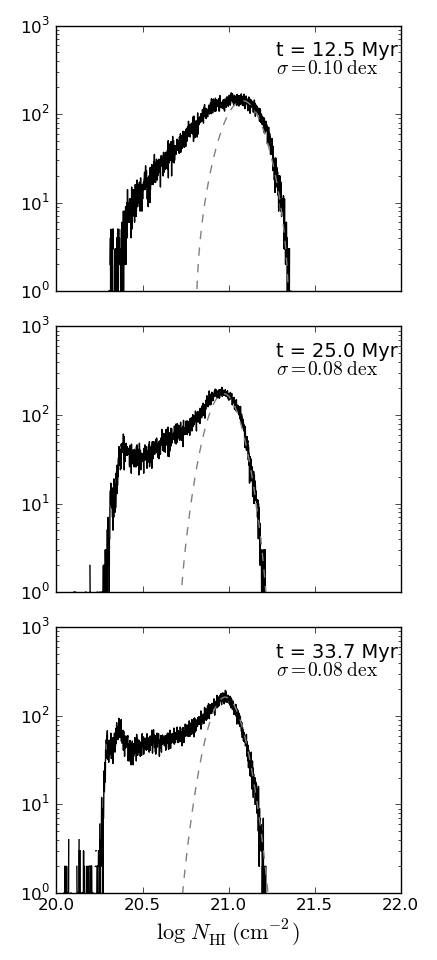
We note that all -PDFs, except those for the molecular gas, show the characteristic bimodal shape of thermally bistable gas (Vázquez-Semadeni et al., 2000; Gazol et al., 2005; Gazol & Kim, 2013; Audit & Hennebelle, 2005). A corresponding feature is also observed in the -PDFs, although with a much more lower amplitude.
The log-normal shape of the PDFs is expected to occur for nearly isothermal flows when no star formation is happening and the flow is turbulence-dominated. In our case this is particularly obvious in the first timestep, when molecular gas already exists but is not enough to result in CO emission. Conversely, in the two last timesteps, when gravity has become the dominant driving force, a power-law tail is seen to have developed at the high density end of the PDFs (Figure 18, first and third columns). This is caused by the molecular gas part of the gas, as can be seen in the third column of Figure 18, whereas the PDFs in Figure 19 (depicting the atomic gas) show no obvious power-law tails. It should also be noted that the power-law tail in the molecular column density PDFs (Figure 18, right two columns) is not so prominent due to line-of-sight confusion. Although not a conclusive proof, these results are consistent with, and strongly support, the scenario that molecules themselves are not necessary for gravitational collapse, and that instead they are formed as a consequence of collapse in all three directions allowing a visual extinction above unity to be achieved (Hartmann et al., 2001; Heitsch & Hartmann, 2008; Glover & Clark, 2012).
Figure 19 also shows both the atomic gas N-PDF (computed directly from the simulation; middle column) and the column density PDF (-PDF) derived from the synthetic observations (right column). It can be seen that the column densities derived from the synthetic observations have a smaller dynamic range: The gas column becomes optically thick at a value of several times , which in turn causes Hi self-absorption features to appear in the line profiles. Conversely, the atomic column density shows a larger dynamic range since it is computed directly from the simulation before the effects of self-absorption are taken into account. The column density values are limited because the gas ultimately becomes molecular. Otherwise the profiles look qualitatively the same: a low-density background-level peak and a log-normal shape.
6.2 Accretion onto molecular clouds and kinematics
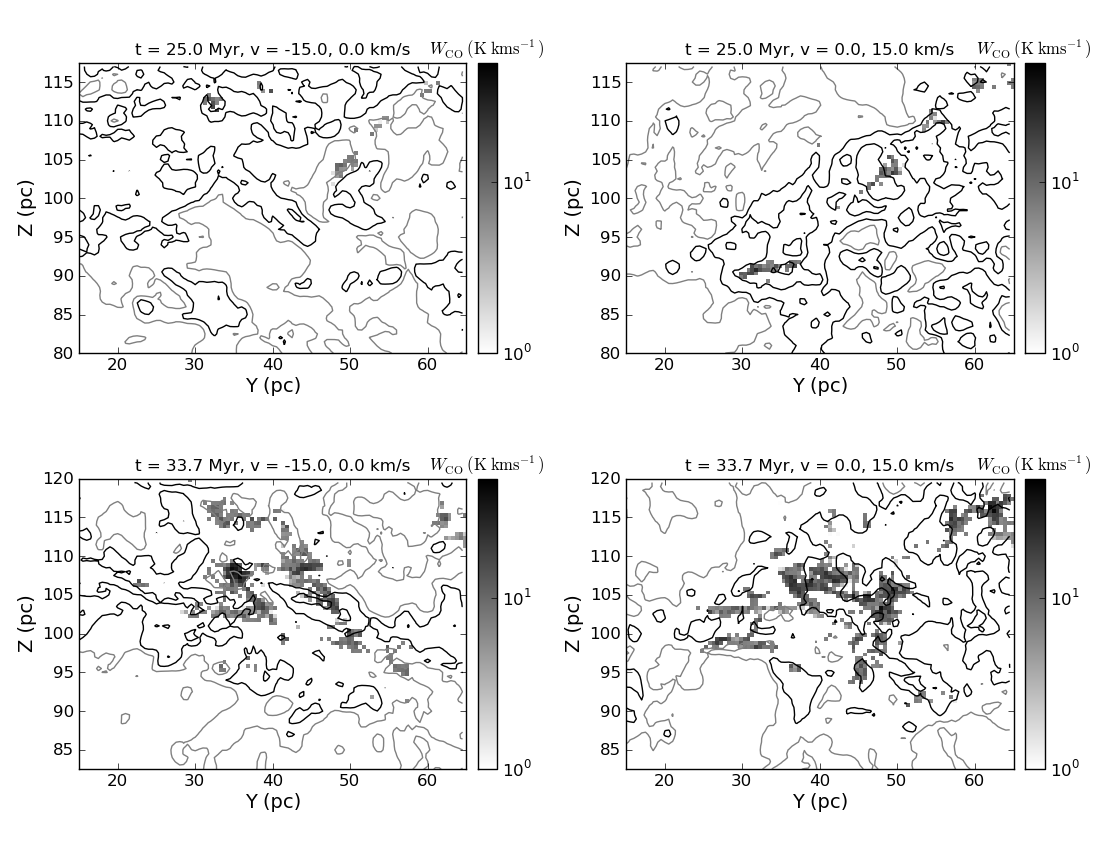
As discussed in Sec. 3, the dense molecular clouds in the simulation grow by accretion of Hi gas. It is thus important to investigate the signatures of this process in the observational domain. Figure 20 shows the Hi and CO brightness temperature (contours and grayscale respectively) at the last two timesteps (top and bottom rows, respectively), and in two velocity intervals, from to and from 0 to (left and right columns, respectively). Different subregions of the simulation were chosen in each timestep, so that each was centered on a prominent cloud structure at the given timestep. The first timestep ( Myr), is not shown because, as mentioned above, no CO emission is produced at that time.
There is only a very vague structure visible of CO gas surrounded by atomic gas, possibly due to projection effects. We also note that channel maps such as these may show more small-scale structure than the three-dimensional maps, or slices through these maps. The reason for this is that there is no strictly uniform relation between the velocity and the spatial axis, a certain amount of randomization of the structure takes place (Pichardo et al., 2000).
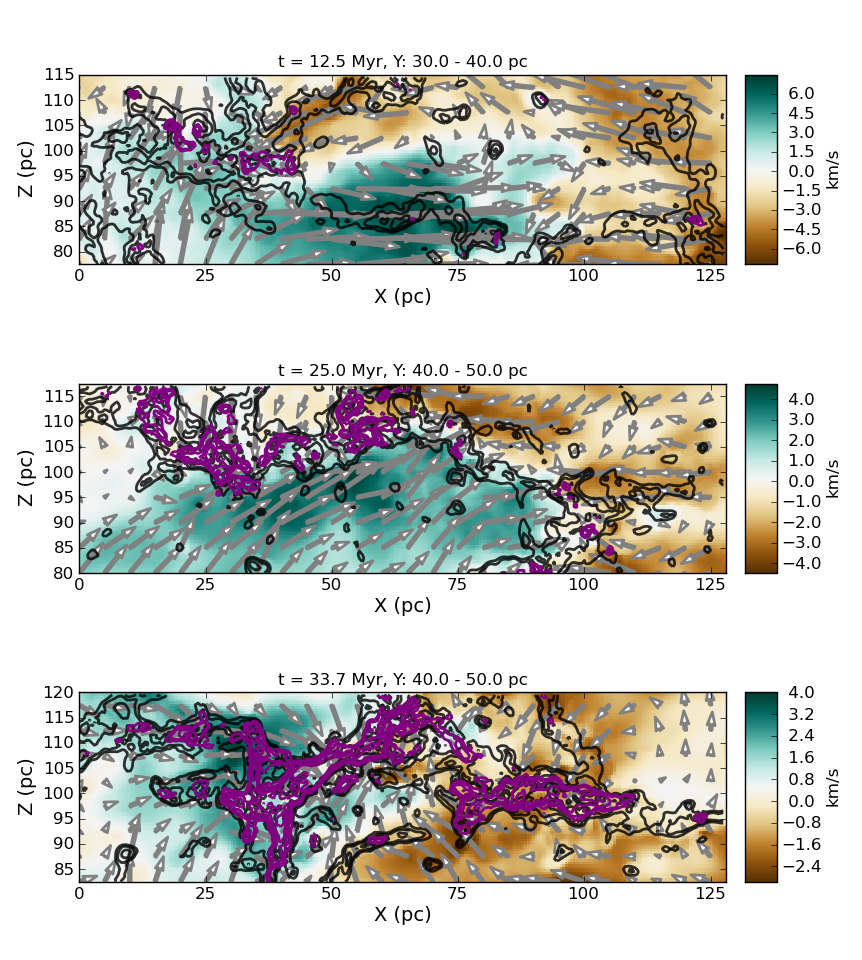
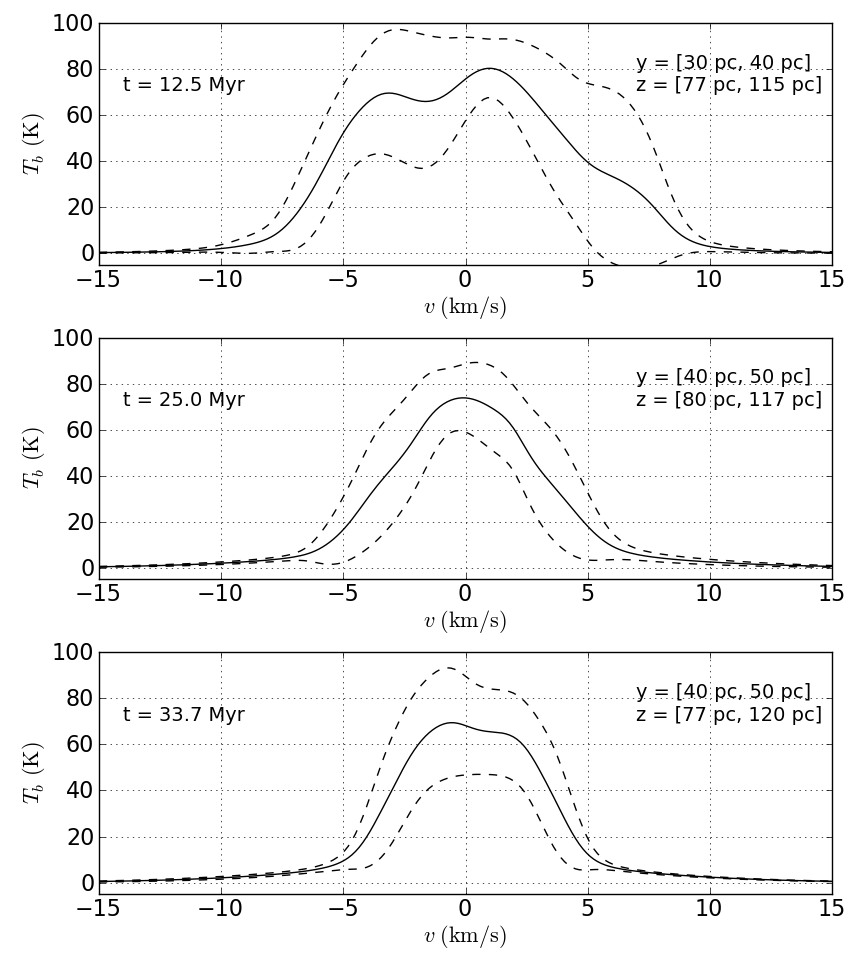
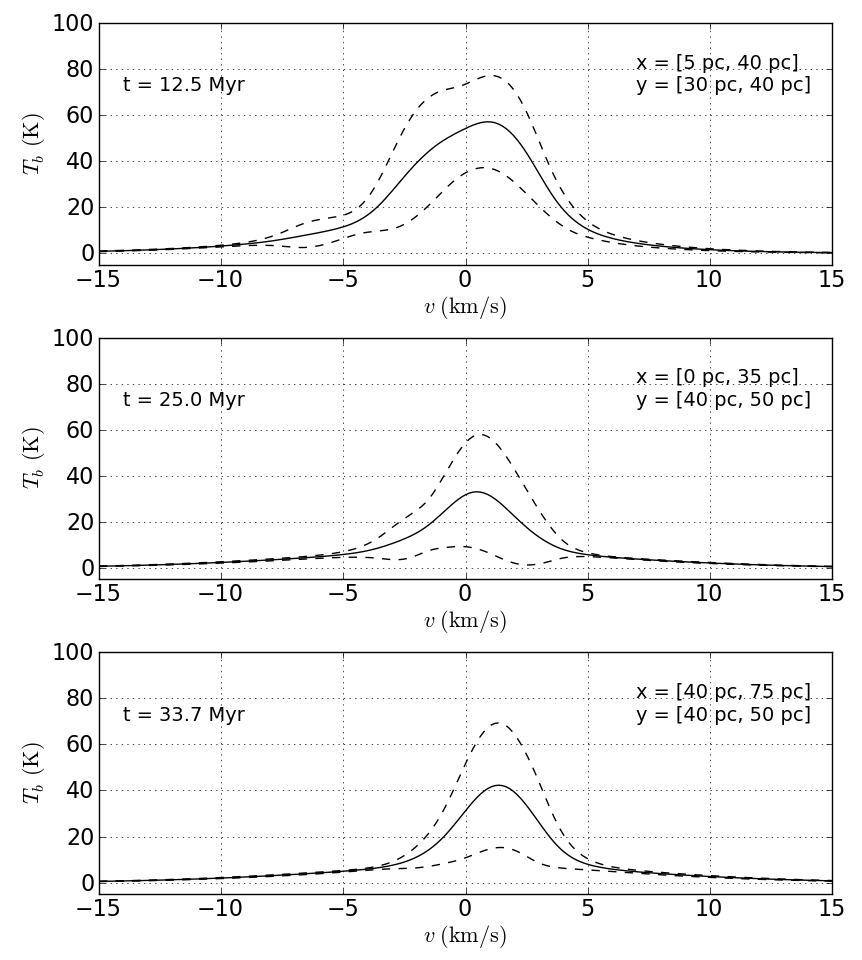
In Figure 21 we plot cuts of the density field of both the Hi (thin black contours) and the molecular (thick purple contours) gas density on the -plane, as well as the projection of the velocity vector on this plane (grey arrows) and the -component of the velocity field (color scale). The green colors indicate a positive velocity, from left to right along the x-axis, whereas the brown colors indicate the opposite direction. In the middle and right panels of Figure 21 we show the line profiles extracted from the same regions, as seen by an observer at the right of the fields (middle panels) or from above them (right panels). It is clear from these figures that the Hi gas is in the process of accreting onto the dense molecular cloud.
The top-left panel of Figure 21 (at Myr) shows that the dense structure on the left side of the field, centered at pc, and which contains both Hi and (CO-free) molecular gas, is accreting diffuse Hi material predominantly along the vertical () direction. There is also a converging flow along the -direction, with the collision region centered roughly at pc, but this flow seems to not have formed a dense cloud yet, and instead it seems to be carrying previously formed, predominantly atomic clouds spanning the ranges :: pc and :: pc, respectively. In the middle-left panel ( Myr), the flow seems to have joined the two components described above into a single, long filament stretching along most of the -extension of the region, with the positive (blue) and negative (brown) components of the velocity being located below-left and above-right of the cloud complex, respectively. The complex is highly molecular at the left, but still mostly atomic at the right part of the field. Finally, in the bottom-left panel, the complex is seen to have become mostly molecular, and is still accreting diffuse Hi material mostly along the vertical ()-direction. Although not shown here, at this time the cloud is copiously forming stars.
In the middle and right panels, we note that the accretion process often results in double-peaked Hi line profiles. Such features are common in observations of Hi in the neighborhood of molecular clouds (see, e.g., the top panel of Fig. 8), and our results from this Section suggest that such bimodal profiles are often the result of the Hi flow onto the molecular clouds.
7 Discussion and conclusions
7.1 Limitations
One of the key missing features in the present study is the inclusion of supernova (SN) feedback, which should maintain the turbulence driving at the scales of our simulation. This may, in turn, have a significant effect on the evolution and structure of the clouds, although its relative importance compared to the gravitational driving of the motions in the clouds is uncertain. Supernovae tend to explode in regions that have been previously evacuated by ionizing radiation and winds from the massive stars, and numerical simulations of this scenario (albeit without self-gravity) suggest that the dense clouds are not strongly affected by the supernovae (e.g., de Avillez & Breitschwerdt, 2004; Hill et al., 2012). In a future study, we plan to repeat our analysis in the presence of ionization and SN feedback, as well as the magnetic field and ambipolar diffusion.
Another important and obvious improvement we can make to our model is a more detailed treatment of the formation and destruction of molecular gas (cf. e.g. Smith et al., 2014). For example, we assume that the formation of molecular gas happens on a timescale that is very small relative to the timesteps we considered, but if we follow the evolution of the gas particles more closely a minimum timescale for molecular gas formation can be imposed as well as a certain balance of photodissociation. As a consequence, the molecular and CO fractions in our simulation must be considered as upper limits. At least our approach provides a first order approximation to the evolution of atomic and molecular gas.
7.2 Summary
We have presented a numerical simulation where ‘molecular’ clouds are identified by using a post-facto processing of the particles in the simulation volume: molecular gas was assumed to have formed if the local temperature had dropped below 50 K and the local average extinction, . We also created synthetic observations of Hi and CO, the latter assumed to exist at a grid cell if the conditions for molecular gas were satisfied and besides the local density satisfied , where is the critical density for CO formation (cf. Sec. 2.2).
We used two different methods to identify (potential) HISA features. One, we used the amplitude of the second derivative of the Hi brightness temperature profile, dubbed ‘HISA strength’. Two, we identified HISA features by matching local minima in the Hi brightness temperature profile to peaks in the calculated opacity at the same velocity (that we call ‘HISA mask’), thereby distinguishing between dips in the profile caused by HISA and those caused by the absence of atomic gas. Although this method is superior because it uses local gas opacity information, it cannot be applied to actual observations since this kind of information is generally not available. Nevertheless, it provides a means of testing the goodness of the first method. We then compared the location and intensity of the HISA features with the presence of molecular gas and looked at the structure of the gas. Finally, we investigated the density and column-density PDFs of the gas, the latter obtained both directly from the simulation data and from the synthetic observations. We focused on three timesteps of the simulation, namely at , 25 and 33.7 Myr. The first timestep corresponds to a time when the clouds are still developing and no SF is occurring in the simulation. The second corresponds to a time when SF is at an early phase, while the latter corresponds to a time when SF is copious. At this time, the effects of stellar feedback are clearly missing and should be included in future studies. Our main results were as follows:
-
•
At the first of the timesteps studied, significant quantities of molecular gas exist, but no significant CO has formed yet. That is, the molecular gas is ‘CO-free’. Instead, at the last of the three timesteps, CO is abundant. This result is consistent with the scenario that gravitational contraction drives the formation of CO molecules (cf. Heitsch & Hartmann, 2008).
-
•
At the chosen resolution of our gridded data (0.5 pc pixel separation), there is a very poor spatial correlation between the HISA strength and the HISA mask. The correlation improves if matches with neighbouring pixels (in the projected plane of the sky, POS) are allowed.
-
•
However, both HISA indicators show a weak but significant correlation with the molecular gas column density on a scale of a few to several parsecs on the POS. At smaller scales no correlation is visible. This suggests that HISA is located on the periphery of the molecular emission, rather than coincident with it.
-
•
The volume and column density PDFs extracted from the simulation show the expected transition from a purely log-normal shape to one with a power-law tail when molecular clouds form. However, the power-law tail is only seen in the molecular components, and not in the Hi, suggesting again that molecule formation is directly correlated with gravitational infall.
-
•
At least in our simulation, most of the multi-peaked Hi line profiles in the neighborhood of molecular clouds are caused by bulk Hi flows into the molecular clouds, rather than by Hi self-absorption.
Acknowledgments
JSH and the computer cluster on which the numerical simulations were carried out are supported by CONACYT grant 102488 to Enrique Vázquez-Semadeni.
References
- Audit & Hennebelle (2005) Audit E., Hennebelle P., 2005, A&A, 433, 1
- Ballesteros-Paredes et al. (2012) Ballesteros-Paredes J., D’Alessio P., Hartmann L., 2012, MNRAS, 427, 2562
- Ballesteros-Paredes et al. (2009) Ballesteros-Paredes J., Gómez G. C., Loinard L., Torres R. M., Pichardo B., 2009, MNRAS, 395, L81
- Ballesteros-Paredes & Hartmann (2007) Ballesteros-Paredes J., Hartmann L., 2007, Revista Mexicana de Astronomía y Astrofísica, 43, 123
- Ballesteros-Paredes et al. (1999) Ballesteros-Paredes J., Hartmann L., Vázquez-Semadeni E., 1999, ApJ, 527, 285
- Ballesteros-Paredes & Mac Low (2002) Ballesteros-Paredes J., Mac Low M.-M., 2002, ApJ, 570, 734
- Banerjee et al. (2009a) Banerjee R., Horn S., Klessen R. S., 2009a, in Protostellar Jets in Context, Tsinganos K., Ray T., Stute M., eds., Springer, Berlin, pp. 421–427
- Banerjee et al. (2009b) Banerjee R., Vázquez-Semadeni E., Hennebelle P., Klessen R. S., 2009b, MNRAS, 398, 1082
- Blitz (1993) Blitz L., 1993, in Protostars and Planets III, Levy E. H., Lunine J. I., eds., pp. 125–161
- Cernicharo & Bachiller (1984) Cernicharo J., Bachiller R., 1984, A&AS, 58, 327
- Clark & Glover (2013) Clark P. C., Glover S. C. O., 2013, ArXiv e-prints
- Clark et al. (2012) Clark P. C., Glover S. C. O., Klessen R. S., Bonnell I. A., 2012, MNRAS, 424, 2599
- Colín et al. (2013) Colín P., Vázquez-Semadeni E., Gómez G. C., 2013, MNRAS
- de Avillez & Breitschwerdt (2004) de Avillez M. A., Breitschwerdt D., 2004, A&A, 425, 899
- Dobbs et al. (2014) Dobbs C. L., Pringle J. E., Naylor T., 2014, MNRAS, 437, L31
- Draper et al. (2007) Draper P. W., Currie M. J., Jenness T., Leech J., Economou F., Berry D. S., Taylor M. B., 2007, in Astronomical Society of the Pacific Conference Series, Vol. 376, Astronomical Data Analysis Software and Systems XVI, Shaw R. A., Hill F., Bell D. J., eds., p. 695
- Elmegreen & Scalo (2004) Elmegreen B. G., Scalo J., 2004, ARA&A, 42, 211
- Franco & Cox (1986) Franco J., Cox D. P., 1986, Publications of the Astronomical Society of the Pacific, 98, 1076
- Gazol & Kim (2013) Gazol A., Kim J., 2013, ApJ, 765, 49
- Gazol et al. (2005) Gazol A., Vázquez-Semadeni E., Kim J., 2005, ApJ, 630, 911
- Gibson et al. (2005) Gibson S. J., Taylor A. R., Higgs L. A., Brunt C. M., Dewdney P. E., 2005, ApJ, 626, 214
- Gibson et al. (2000) Gibson S. J., Taylor A. R., Higgs L. A., Dewdney P. E., 2000, ApJ, 540, 851
- Glover & Clark (2012) Glover S. C. O., Clark P. C., 2012, MNRAS, 421, 9
- Goldsmith & Li (2005) Goldsmith P. F., Li D., 2005, ApJ, 622, 938
- Gomez & Vazquez-Semadeni (2013) Gomez G. C., Vazquez-Semadeni E., 2013, ArXiv e-prints
- Hartmann et al. (2001) Hartmann L., Ballesteros-Paredes J., Bergin E. A., 2001, ApJ, 562, 852
- Heiner & Vázquez-Semadeni (2013) Heiner J. S., Vázquez-Semadeni E., 2013, MNRAS, 429, 3584
- Heitsch et al. (2009) Heitsch F., Ballesteros-Paredes J., Hartmann L., 2009, ApJ, 704, 1735
- Heitsch & Hartmann (2008) Heitsch F., Hartmann L., 2008, ApJ, 689, 290
- Hennebelle et al. (2007) Hennebelle P., Audit E., Miville-Deschênes M.-A., 2007, A&A, 465, 445
- Hennebelle et al. (2008) Hennebelle P., Banerjee R., Vázquez-Semadeni E., Klessen R. S., Audit E., 2008, A&A, 486, L43
- Hill et al. (2012) Hill A. S., Joung M. R., Mac Low M.-M., Benjamin R. A., Haffner L. M., Klingenberg C., Waagan K., 2012, ApJ, 750, 104
- Jappsen et al. (2005) Jappsen A.-K., Klessen R. S., Larson R. B., Li Y., Mac Low M.-M., 2005, A&A, 435, 611
- Kavars et al. (2005) Kavars D. W., Dickey J. M., McClure-Griffiths N. M., Gaensler B. M., Green A. J., 2005, ApJ, 626, 887
- Knapp (1974) Knapp G. R., 1974, AJ, 79, 527
- Koyama & Inutsuka (2000) Koyama H., Inutsuka S.-I., 2000, ApJ, 532, 980
- Krčo & Goldsmith (2010) Krčo M., Goldsmith P. F., 2010, ApJ, 724, 1402
- Krčo et al. (2008) Krčo M., Goldsmith P. F., Brown R. L., Li D., 2008, ApJ, 689, 276
- Li & Goldsmith (2003) Li D., Goldsmith P. F., 2003, ApJ, 585, 823
- Luhman et al. (2007) Luhman K. L., Allers K. N., Jaffe D. T., Cushing M. C., Williams K. A., Slesnick C. L., Vacca W. D., 2007, ApJ, 659, 1629
- Luhman et al. (2003) Luhman K. L., Briceño C., Stauffer J. R., Hartmann L., Barrado y Navascués D., Caldwell N., 2003, ApJ, 590, 348
- Mac Low & Klessen (2004) Mac Low M.-M., Klessen R. S., 2004, Reviews of Modern Physics, 76, 125
- Molinari et al. (2014) Molinari S. et al., 2014, ArXiv e-prints
- Ostriker et al. (2001) Ostriker E. C., Stone J. M., Gammie C. F., 2001, ApJ, 546, 980
- Peek et al. (2011) Peek J. E. G. et al., 2011, ApJS, 194, 20
- Pichardo et al. (2000) Pichardo B., Vázquez-Semadeni E., Gazol A., Passot T., Ballesteros-Paredes J., 2000, ApJ, 532, 353
- Pineda et al. (2008) Pineda J. E., Caselli P., Goodman A. A., 2008, ApJ, 679, 481
- Pineda et al. (2010) Pineda J. L., Goldsmith P. F., Chapman N., Snell R. L., Li D., Cambrésy L., Brunt C., 2010, ApJ, 721, 686
- Rohlfs & Wilson (1996) Rohlfs K., Wilson T., 1996, Tools of Radio Astronomy, 2nd ed. Springer, Berlin, New York
- Smith et al. (2014) Smith R. J., Glover S. C. O., Clark P. C., Klessen R. S., Springel V., 2014, ArXiv e-prints
- Springel et al. (2001) Springel V., Yoshida N., White S. D. M., 2001, New Astron., 6, 79
- Vázquez-Semadeni et al. (2011) Vázquez-Semadeni E., Banerjee R., Gómez G. C., Hennebelle P., Duffin D., Klessen R. S., 2011, MNRAS, 414, 2511
- Vázquez-Semadeni et al. (2010) Vázquez-Semadeni E., Colín P., Gómez G. C., Ballesteros-Paredes J., Watson A. W., 2010, ApJ, 715, 1302
- Vázquez-Semadeni et al. (2000) Vázquez-Semadeni E., Gazol A., Scalo J., 2000, ApJ, 540, 271
- Vázquez-Semadeni et al. (2007) Vázquez-Semadeni E., Gómez G. C., Jappsen A. K., Ballesteros-Paredes J., González R. F., Klessen R. S., 2007, ApJ, 657, 870
- Vázquez-Semadeni et al. (2009) Vázquez-Semadeni E., Gómez G. C., Jappsen A.-K., Ballesteros-Paredes J., Klessen R. S., 2009, ApJ, 707, 1023