The Massive and Distant Clusters of WISE Survey II: Initial Spectroscopic Confirmation of Galaxy Clusters Selected from 10,000 Square Degrees
Abstract
We present optical and infrared imaging and optical spectroscopy of galaxy clusters which were identified as part of an all-sky search for high-redshift galaxy clusters, the Massive and Distant Clusters of WISE Survey (MaDCoWS). The initial phase of MaDCoWS combined infrared data from the all-sky data release of the Wide-field Infrared Survey Explorer (WISE) with optical data from the Sloan Digital Sky Survey (SDSS) to select probable clusters of galaxies over an area of 10,000 deg2. Our spectroscopy confirms 19 new clusters at , half of which are at , demonstrating the viability of using WISE to identify high-redshift galaxy clusters. The next phase of MaDCoWS will use the greater depth of the AllWISE data release to identify even higher redshift cluster candidates.
1 Introduction
Studies of massive clusters of galaxies have provided the first evidence for the existence of dark matter (Zwicky, 1937), showed the importance of environment in galaxy evolution (Dressler, 1980), and currently can provide competitive constraints on cosmological parameters (Allen, Evrard, & Mantz, 2011; Benson et al., 2013). Much of the power of such studies derives primarily from the extreme cluster masses ( M☉). The largest area surveys can identify the rarest, most massive clusters. The ROSAT All-Sky Survey resulted in catalogs of very massive galaxy clusters at low to moderate redshifts (Ebeling et al., 1998, 2001, i.e., the BCS at and MACS at ). More recently, the Planck mission has provided an all-sky catalog of very massive galaxy clusters at (Planck Collaboration et al., 2013), while the South Pole Telescope (SPT) and Atacama Cosmology Telescope (ACT) detect high-mass clusters reaching even above over several thousand square degrees (Williamson et al., 2011; Marriage et al., 2011; Reichardt et al., 2012). However, until recently no surveys were capable of identifying massive clusters at over the full extragalactic sky.
The primary means of identifying clusters of galaxies include optical/infrared searches for galaxy overdensities, X-ray searches that detect the hot gas of the intracluster medium, and mm-wave searches that rely on the Sunyaev-Zel’dovich (SZ) effect. The latter technique is nearly mass-limited due to the weak redshift dependence of the detection signal, which makes SZ surveys ideal for cosmological tests based upon evolution of the cluster mass function. Similar to the SZ, surveys at X-ray wavelengths have the advantage of being able to estimate cluster masses directly from their data (if the cluster redshifts are known). However, the X-ray signal drops dramatically with redshift, and X-ray surveys so far have not been able to cover very large areas to the depth necessary to find large numbers of very massive clusters at high redshifts. In the future, eROSITA (Predehl et al., 2010) should provide an upgrade to the prospects of large-area X-ray cluster surveys.
Using infrared imaging, cluster searches that detect galaxy overdensities provide the greatest reach in redshift and mass sensitivity at high-redshift, extending to and below M☉ (e.g., Eisenhardt et al., 2008; Papovich et al., 2010; Brodwin et al., 2011; Stanford et al., 2012; Zeimann et al., 2012; Galametz et al., 2012; Muzzin et al., 2013; Wylezalek et al., 2013). The limiting factor for Spitzer is the relatively limited areas (e.g., deg2, Ashby et al., 2013) for which it is feasible to obtain moderate-depth IRAC imaging. The Wide-field Infrared Survey Explorer mission (WISE; Wright et al., 2010) offers the means to find massive clusters at over the full extragalactic sky using methods pioneered with the IRAC camera aboard the Spitzer Space Telescope. We are conducting the next generation high-redshift cluster search using WISE, the Massive and Distant Clusters of WISE Survey (MaDCoWS). We have already published the first cluster confirmed from MaDCoWS (Gettings et al., 2012). Here we report on the initial results of follow-up observations to confirm an initial sample of WISE-selected galaxy clusters selected to be at . Brodwin et al. (in prep) will present Sunyaev-Zel’dovich (SZ) measurements and cluster masses for some of the clusters in this paper.
2 WISE Selection of Cluster Candidates
The key aspect of the WISE mission enabling detection of high-redshift galaxy clusters is the excellent photometric sensitivity at 3.4 and 4.6 m (W1 and W2, respectively). The WISE All-Sky Data Release achieves 5 sensitivity limits better than 0.07 and 0.1 mJy in unconfused regions in W1 and W2.111http://wise2.ipac.caltech.edu/docs/release/allsky/expsup/sec6_3a.html These sensitivities correspond to areas near the ecliptic plane and represent the typical minimum depth for the All-Sky survey. The effective exposure times of the observations vary significantly with ecliptic latitude due to the survey design, increasing from twelve 7.7s exposures at the ecliptic plane to more than a hundred near the ecliptic poles. An overview of the methodology was given in Gettings et al. (2012), and full details of the MaDCoWS galaxy cluster search method will be presented in a future paper; here we summarize.
The search method is based on WISE All-Sky Release data, augmented by -band photometry from the Sloan Digital Sky Survey (SDSS). At 3.4 m, the apparent magnitude of an galaxy is only weakly dependent upon redshift at due to evolutionary and k-corrections which offset the impact of increasing luminosity distance. Consequently, a magnitude-limited galaxy sample selected at 3.4 m has a nearly uniform luminosity limit at this epoch. This is even more true for the 4.6m band (Eisenhardt et al. 2008), but the All-Sky WISE release is not deep enough to select at W2. In contrast, this redshift dependence increases in strength at progressively shorter wavelengths, enabling color selection of distant galaxies.
The MaDCoWS search exploits these properties using a set of magnitude and color cuts in WISE and optical bands to isolate a population of galaxies. After cleaning the WISE catalog of flagged sources and applying a 3.4 m cut to ensure spatial uniformity in depth, we match the WISE catalog to the SDSS DR8 photometric catalog (Aihara et al., 2011). In the current version of the MaDCoWS search, which covers 15 of the 19 clusters in this paper, we then reject sources with and , effectively removing the foreground galaxy population. The other four clusters presented here are from a preliminary search which employed the same technique but lacked the current optimization of these color and magnitude cuts. Once foreground sources are removed, we input the remaining sources to a wavelet search to identify overdensities on a scale of , which corresponds to a physical size of Mpc at . From the resulting wavelet-smoothed density maps we select the most-significant overdensities as MaDCoWS candidate clusters.
The remaining sources are smoothed with a Gaussian-difference wavelet kernel tuned to enhance structures on scales of , corresponding to a physical size of Mpc at . From these maps we identified the most statistically significant overdensities for further investigation. The centroids of the detections are used below to define the cluster center. A more detailed description of the creation of the MaDCoWS cluster catalog will be presented in a forthcoming publication (Gettings et al., in preparation)
3 Follow-Up Observations
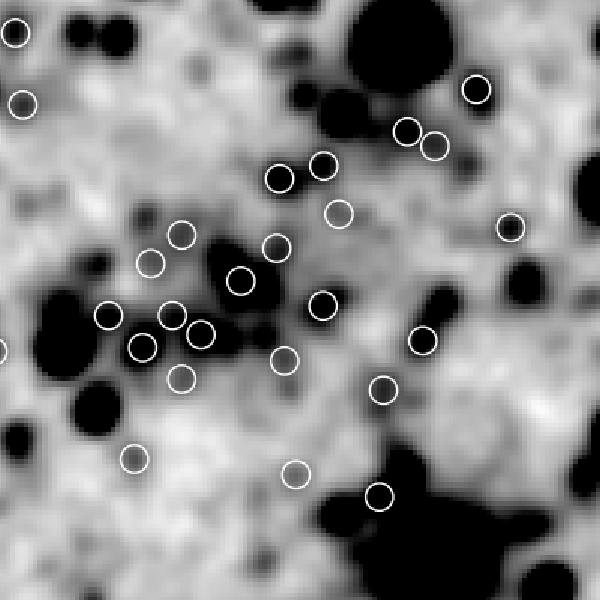
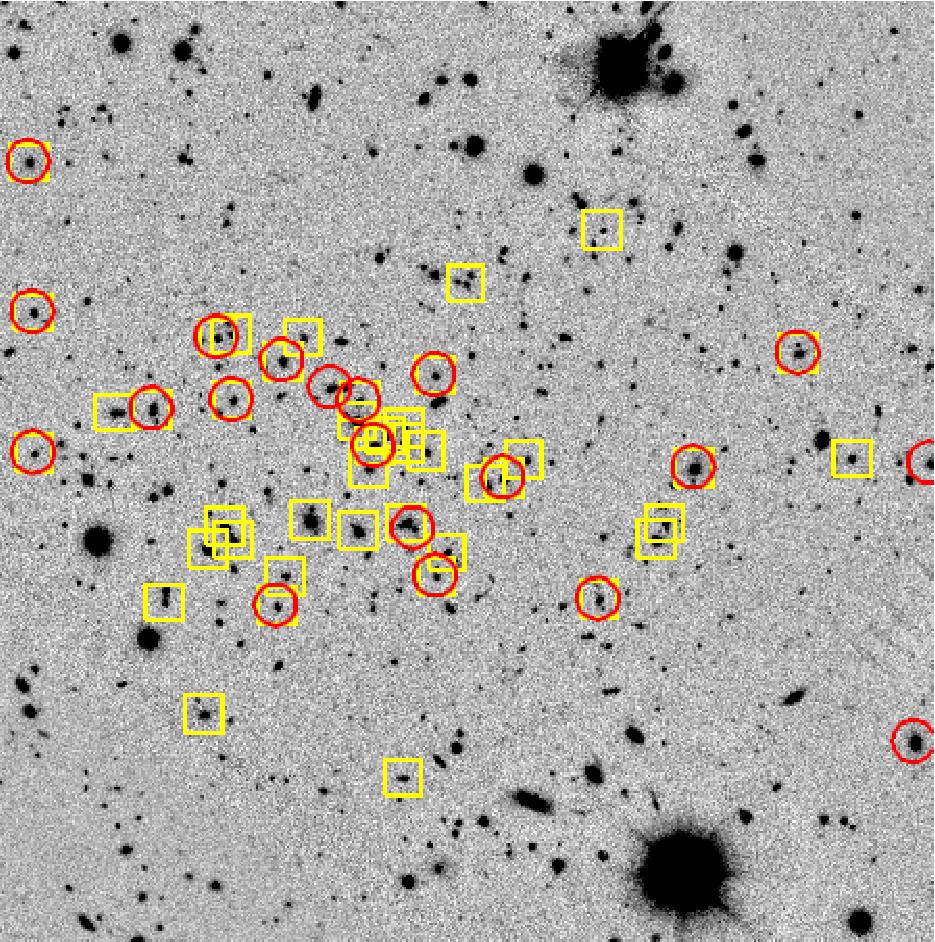
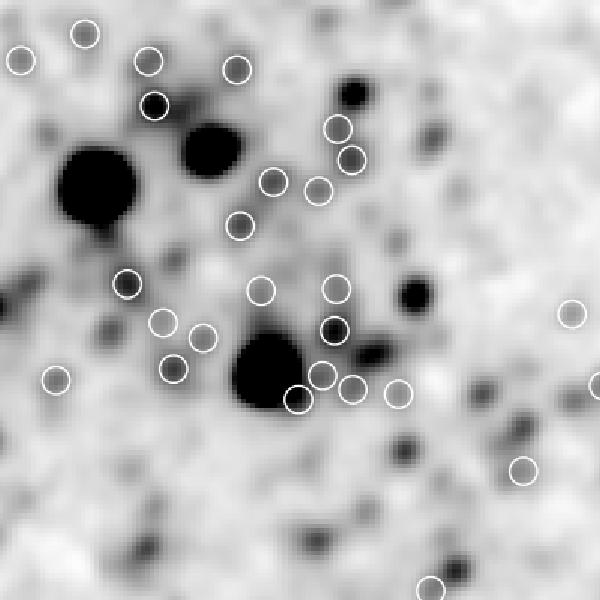
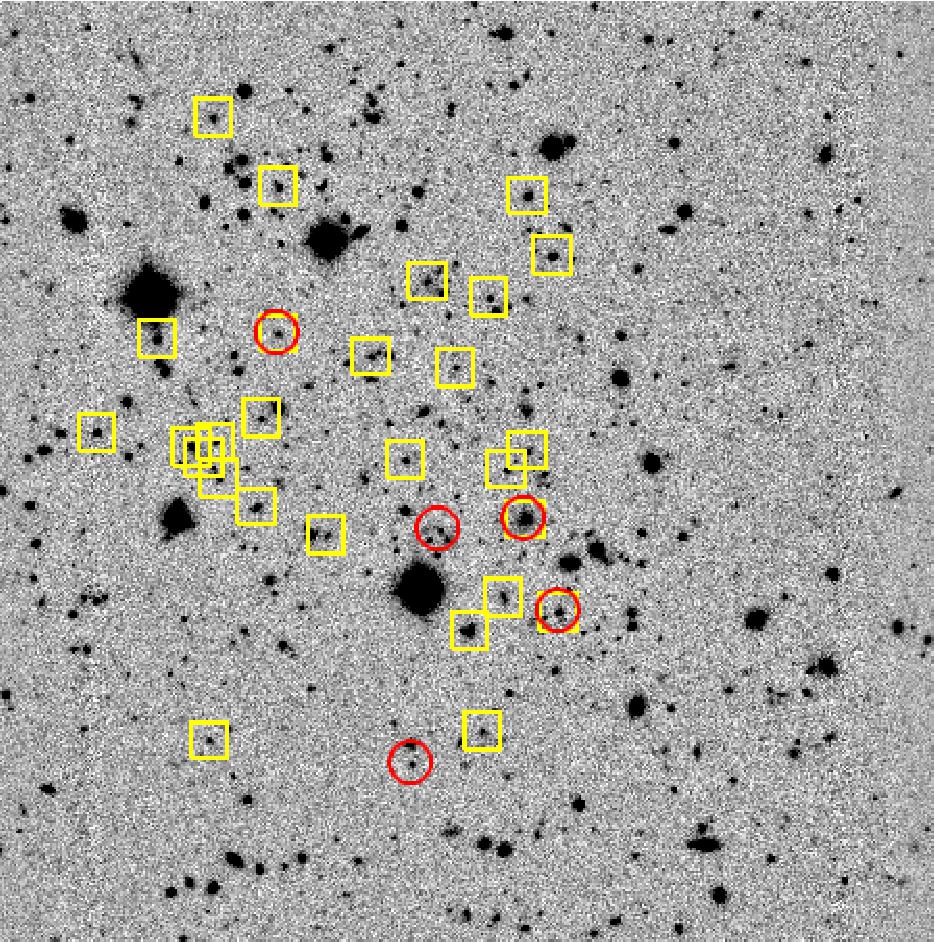
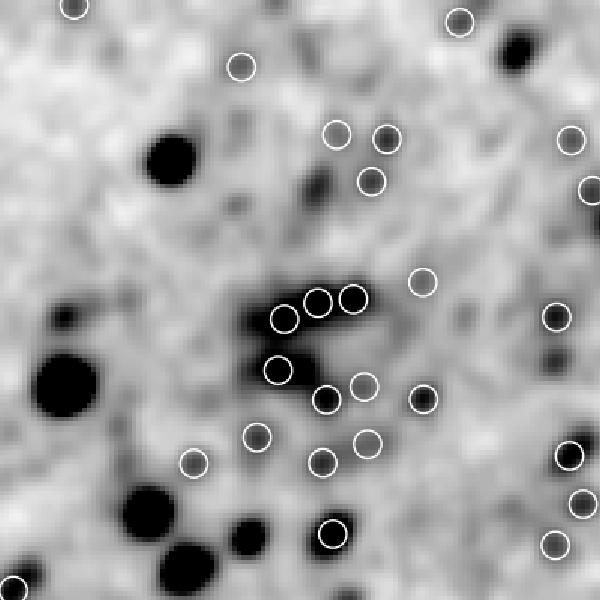
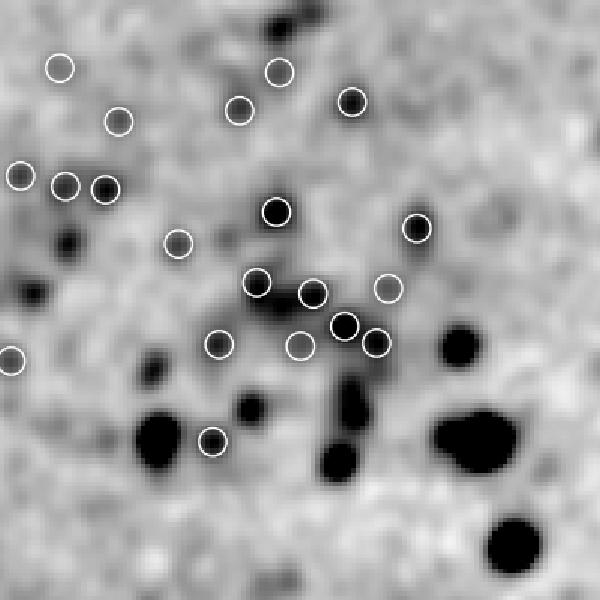
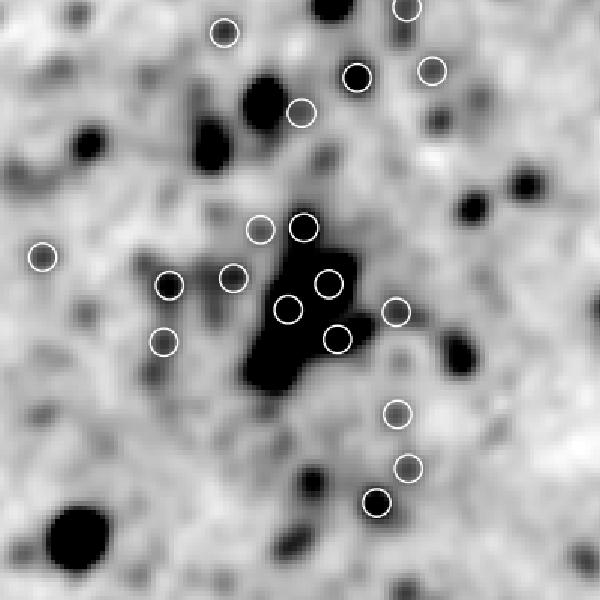
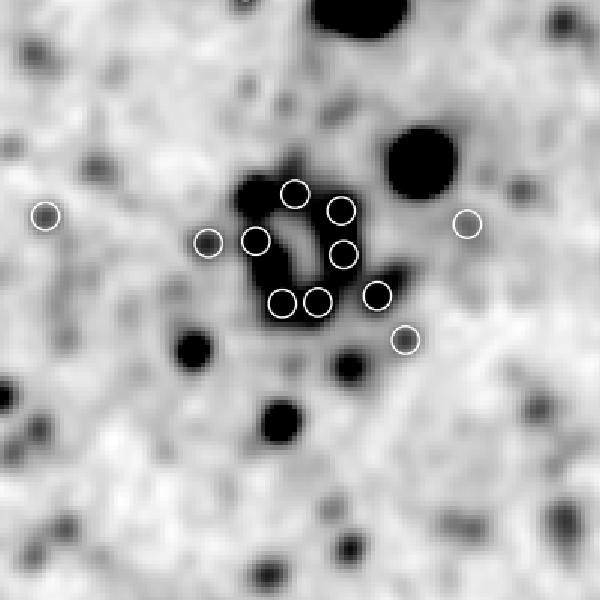
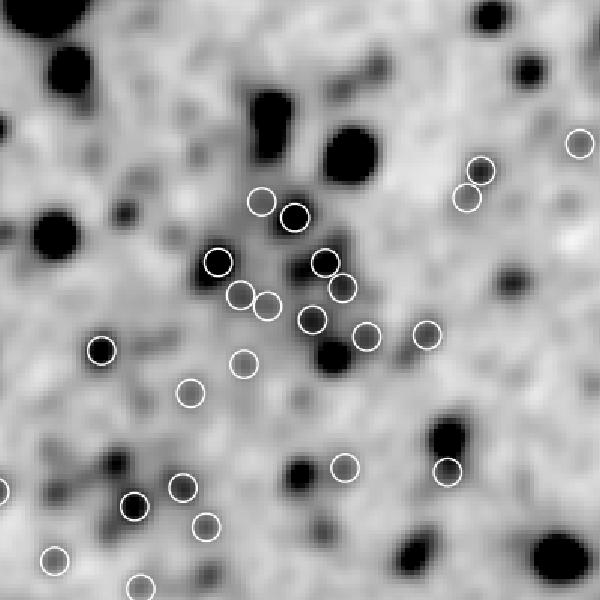
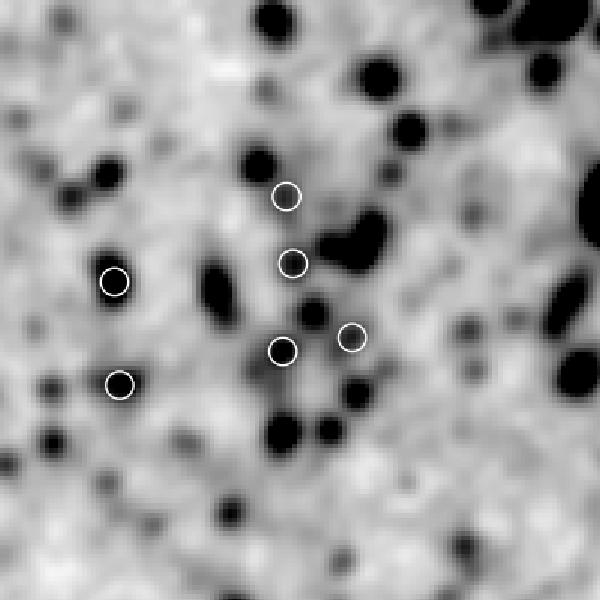
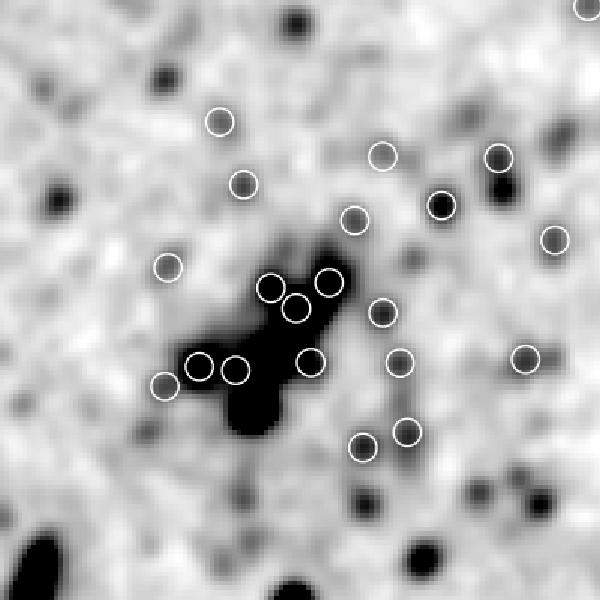
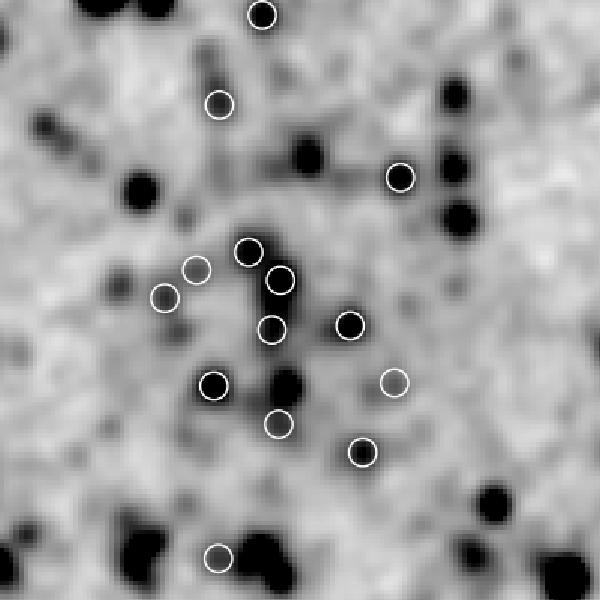
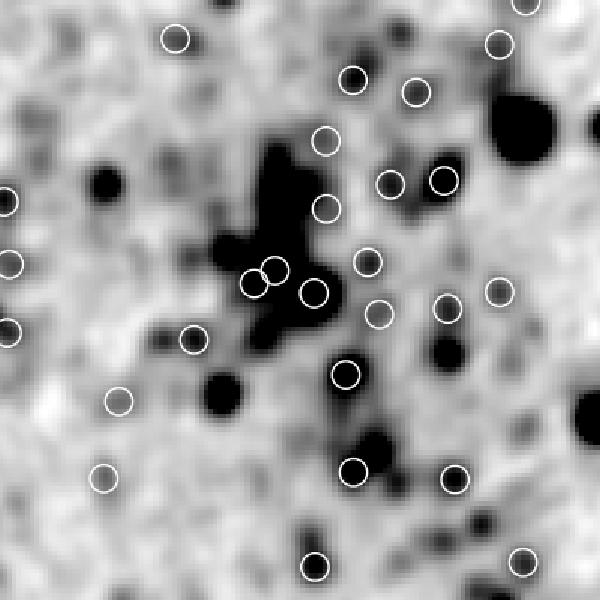
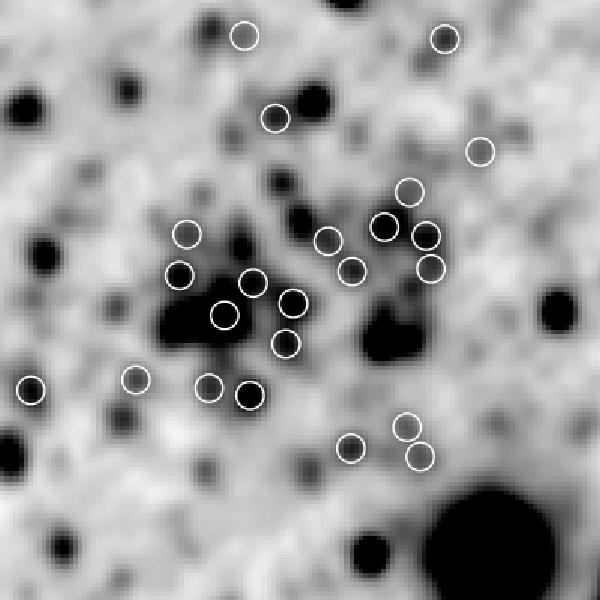
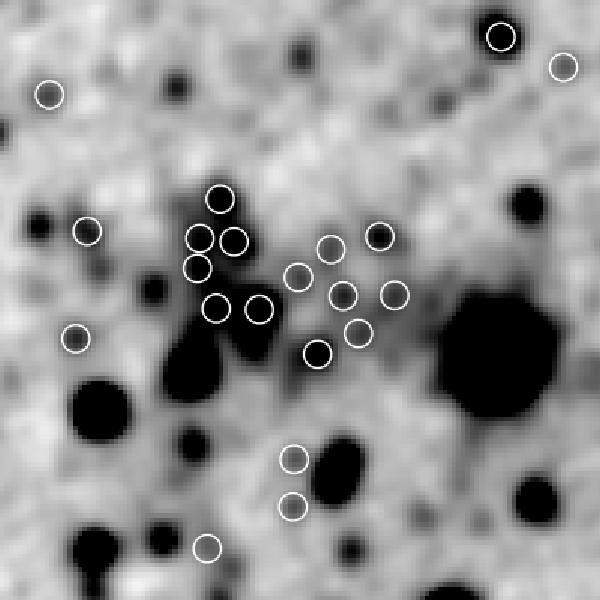
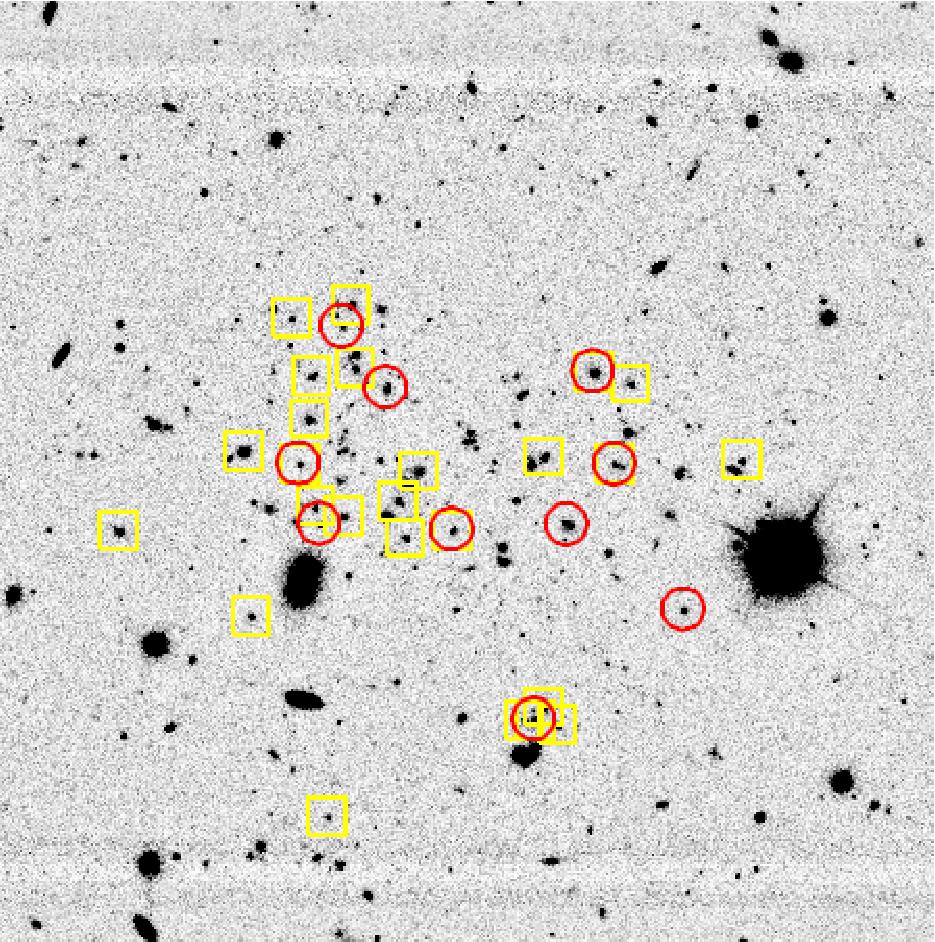
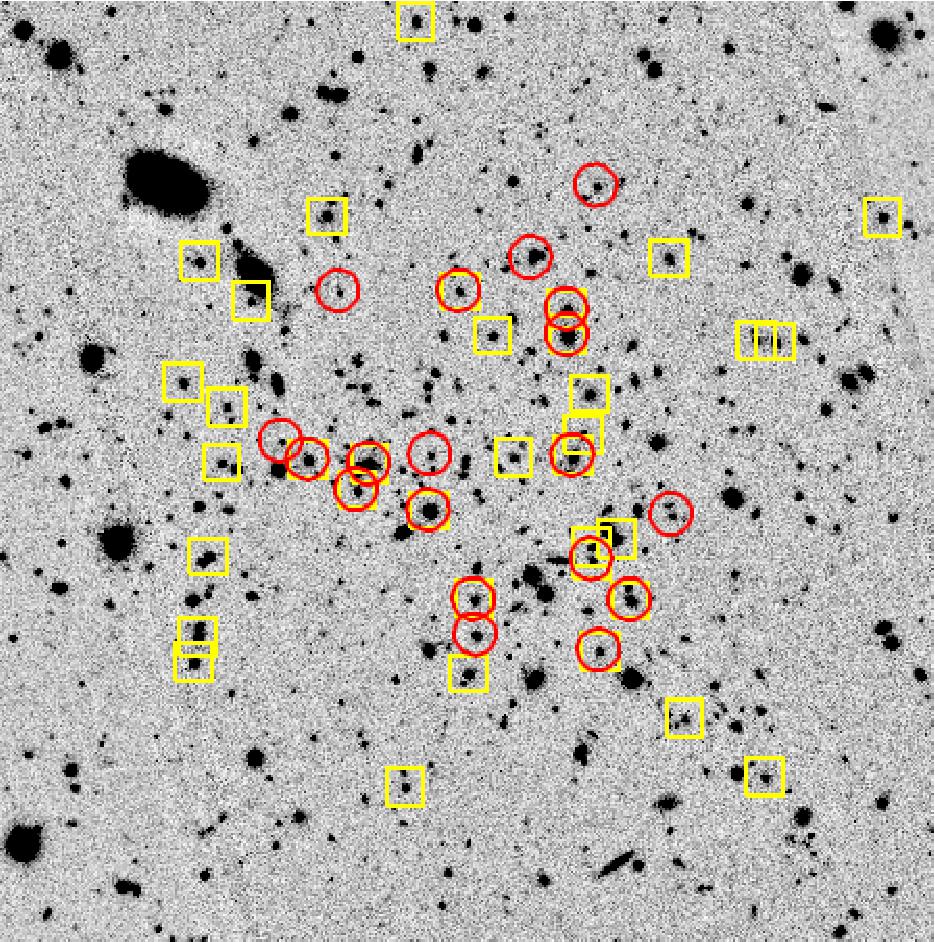
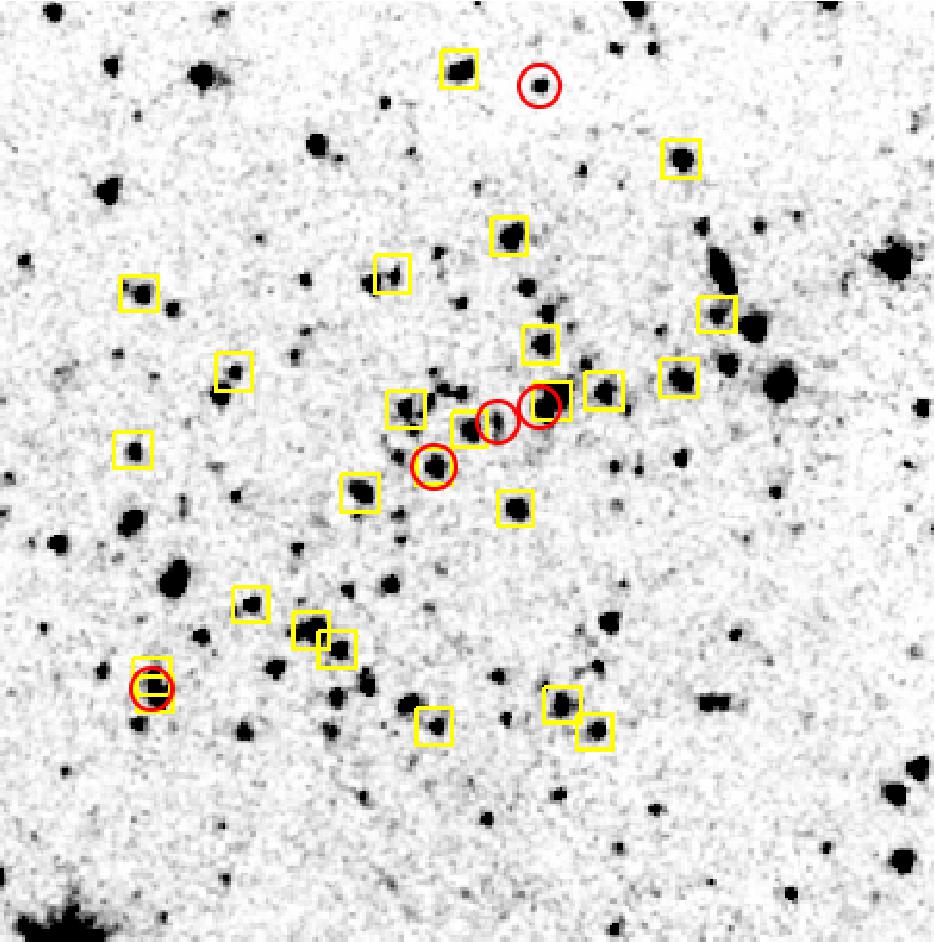
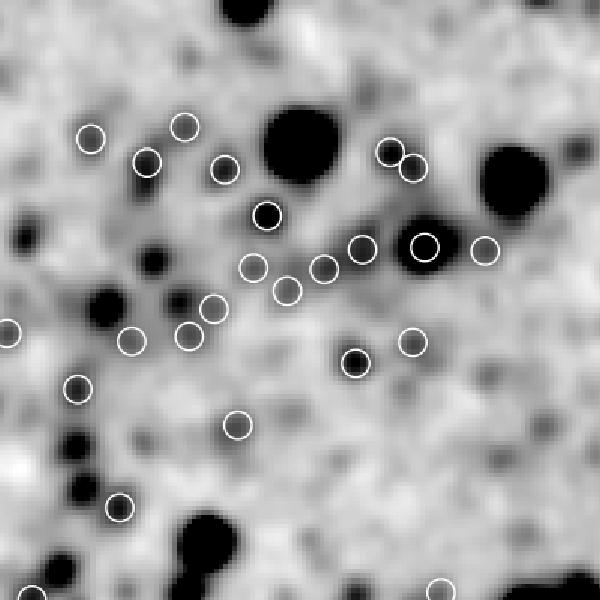
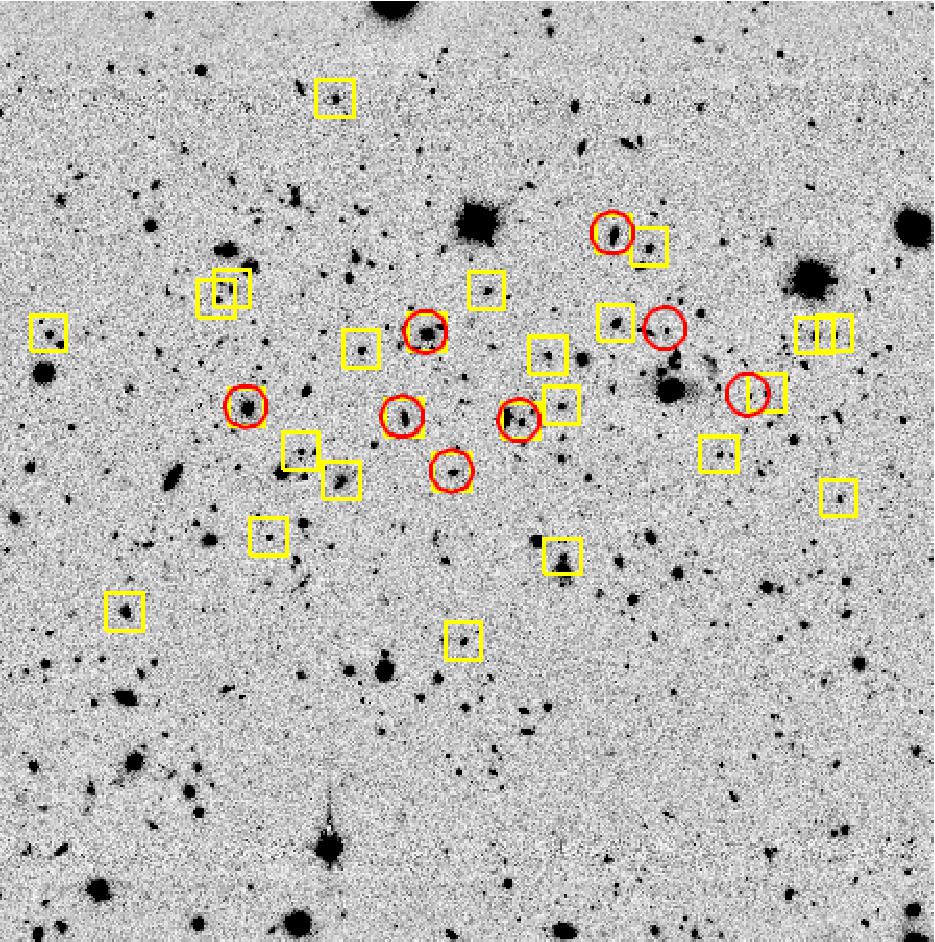
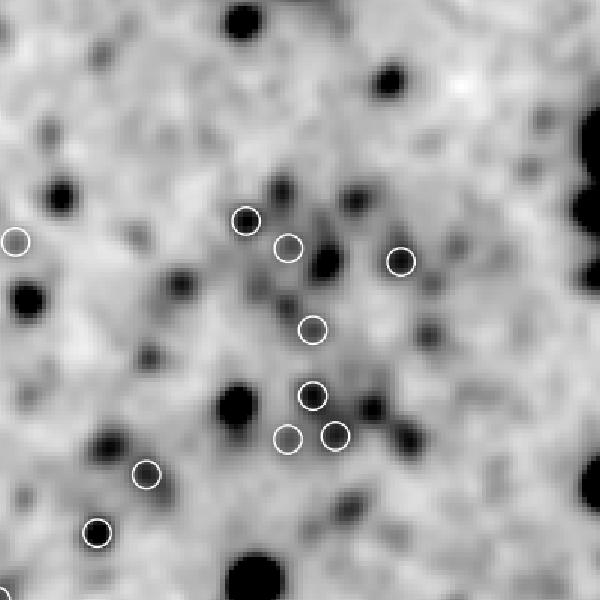
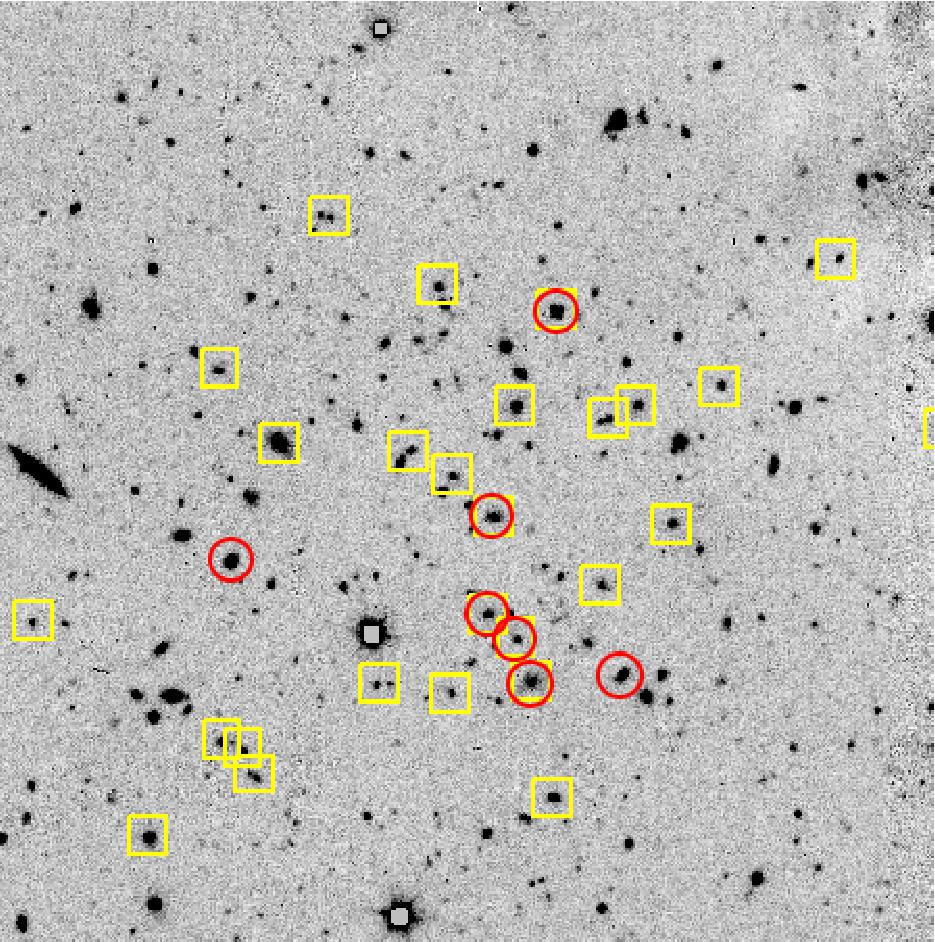
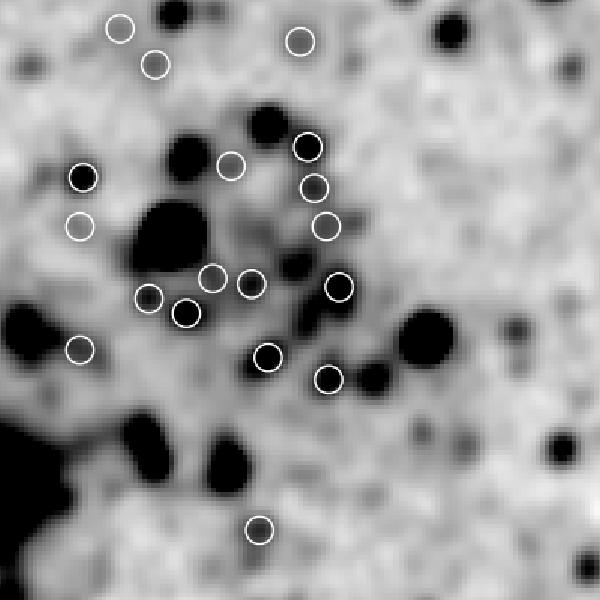
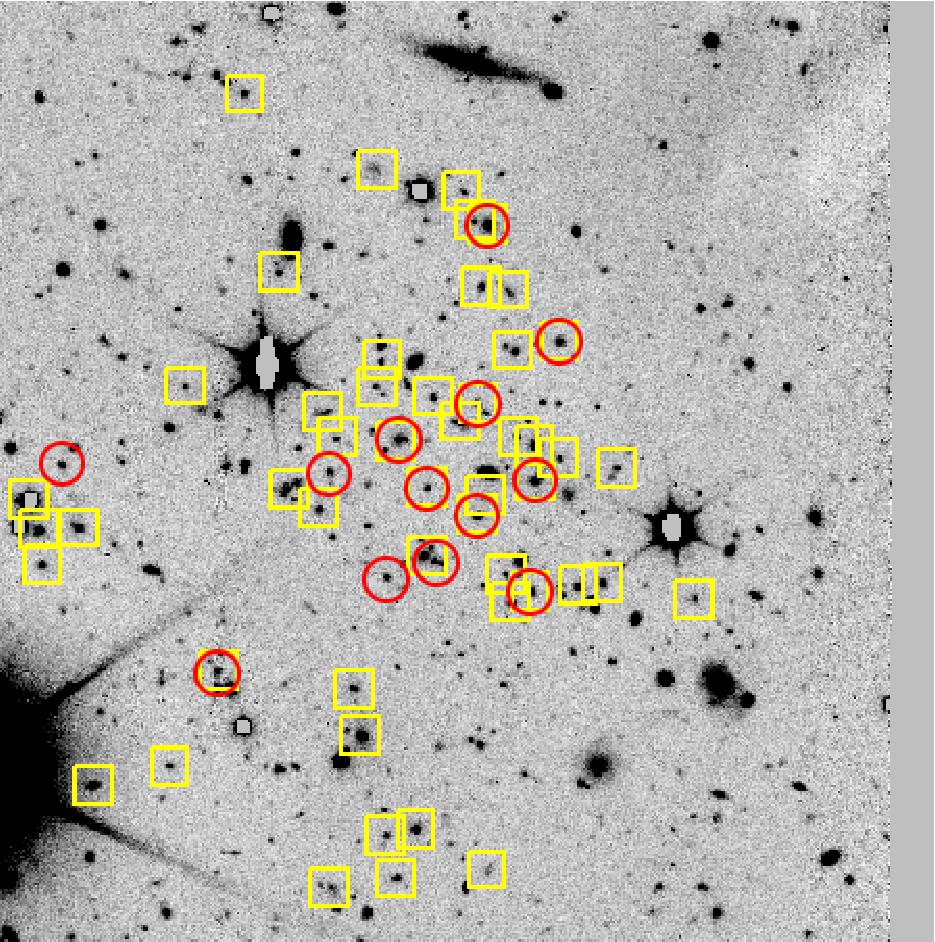
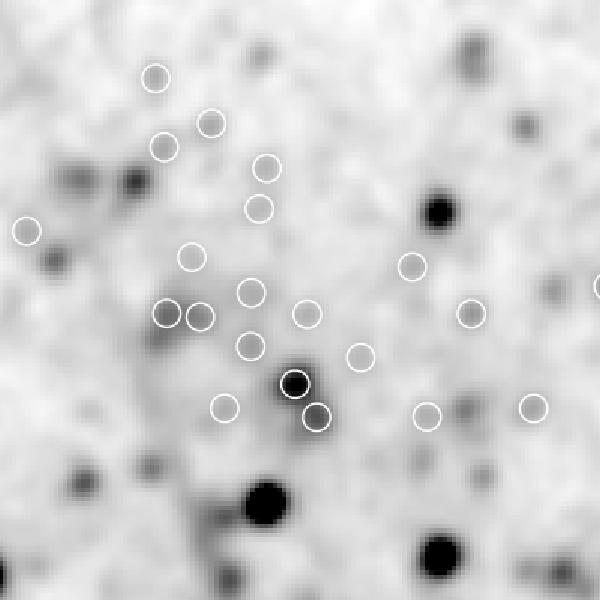
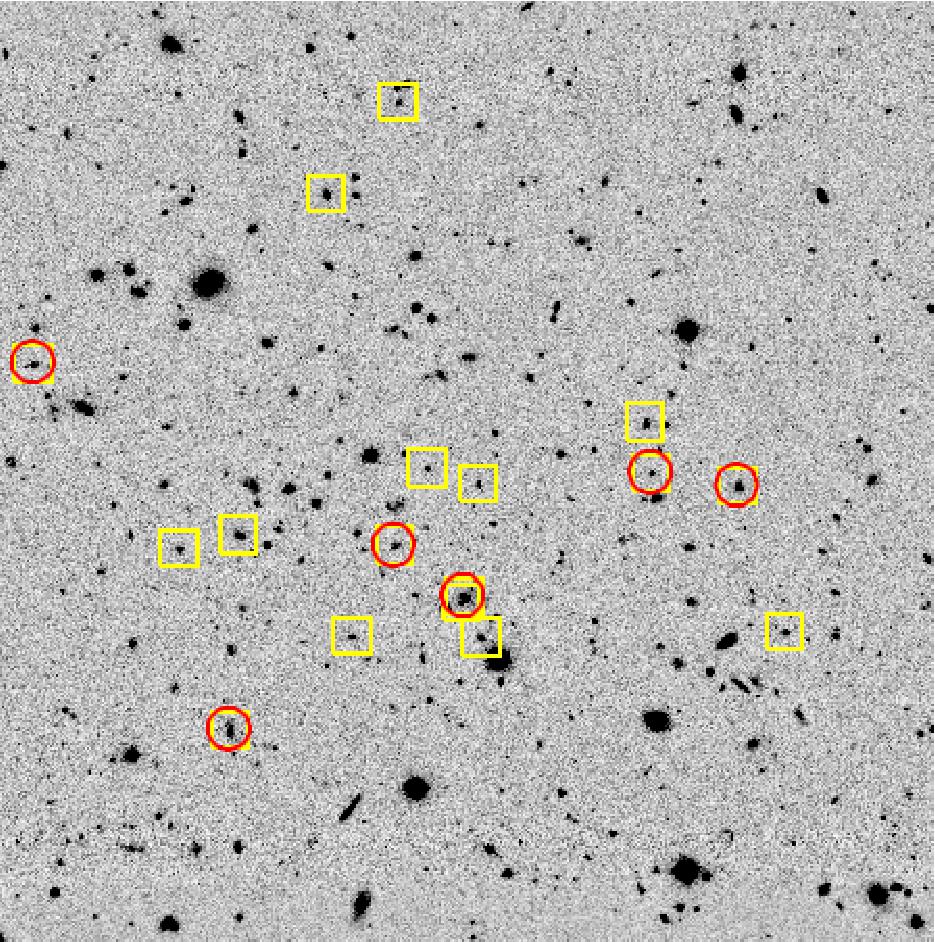
As described below, we have been carrying out follow-up observations to confirm WISE-selected candidate clusters. Images of the spectroscopically confirmed candidates are shown in Figure 1, and listed in Table 1. Optical imaging was obtained with the Gran Telescopio Canarias (GTC) and Gemini-North, Infrared Array Camera (IRAC; Fazio et al. 2004) imaging with the , and optical spectroscopy with Keck and Gemini-North, as described below. In general, cluster candidates were chosen for optical spectroscopic confirmation based primarily on three factors: the appearance of a red sequence in the color-magnitude diagram, their visual appearance in the optical imaging, and the galaxy overdensity as measured in the IRAC images.
3.1 GTC Imaging
We obtained -band imaging for five of the candidate clusters in Table 1 using the optical imaging instrument OSIRIS on the GTC in queue mode in August 2012. A total of 18 minutes of exposure time was obtained on each of these clusters, using six dithered 180 second integrations. The data were processed using standard reduction procedures in IRAF and astrometrically calibrated to the USNO-B1.0 catalog (Monet et al., 2003) using SCAMP and SWarp (Bertin, 2006; Bertin et al., 2002). The seeing in these optical images is approximately arcsec. Photometric calibration of final, stacked images was performed using DR10 (Ahn et al., 2014) photometry of SDSS stars in each field.
3.2 Gemini-North Imaging
As part of a queue program at Gemini-North (Brodwin, PI) which includes spectroscopy, we obtained GMOS and -band imaging in the 2013A and 2013B semesters on 12 of the candidates listed in Table 1. A series of dithered exposures was obtained in each band, s in the -band, and s in the -band. The data were processed using standard reduction procedures in IRAF and astrometrically calibrated to the USNO-B1.0 catalog (Monet et al., 2003) using SCAMP and SWarp. The seeing in the GMOS images is typically arcsec. Photometric calibration was obtained using DR10 photometry of SDSS stars that appear in each field.
3.3 IRAC Imaging
As part of a larger survey of MaDCoWS candidates (Gonzalez, PI), we obtained IRAC and m imaging in Cycle 9 for 200 MaDCoWS cluster candidates including all of the clusters in Table 1; here we make use of the IRAC data for only 7 of the candidates listed in Table 1 in the cases where our optical imaging is either incomplete or nonexistent. A series of six dithered 30 s exposures was obtained with IRAC in each channel for a total exposure time of s. The basic calibrated data were reduced and mosaiced using MOPEX (Makovoz & Khan, 2005) and resampled to a pixel scale of arcsec. The PSF in the IRAC images has a FWHM arcsec. A more detailed presentation of the MaDCoWS IRAC program will be made in a future publication.
3.4 Keck Spectroscopy
The optical/infrared catalogs described below in Section 4.1 were used to design slit-masks for use with DEIMOS at the W. M. Keck Observatory to obtain redshifts of potential cluster galaxies. For clusters where Gemini photometry was available, we used the red sequence as primary targets, whereas for clusters with GTC imaging, we used colors to select targets, and for the clusters with only imaging, we selected on the basis of [3.6][4.5] color. The general approach to designing the slit masks was to rely on the red sequence as the source of the highest priority objects, weighting by cluster-centric radius, and then filling in the masks with other galaxies at larger radii selected by WISE W1W2 color. The slitlets in the masks had widths of and minimum lengths of 5 arcsec. Spectra were obtained using the 600 line grating and the GG495 filter on three observing runs in the 2012B, 2013A, and 2013B semesters, when conditions were generally clear with seeing of . Table 1 lists the observation dates for each cluster. For most masks we obtained three 1200 s exposures, with longer exposure times being devoted to the higher redshift candidates. The DEIMOS spectra were reduced using the DEEP2 pipeline. The relative spectral response of the extracted spectra was calibrated via observations of Feige 34 and BD 28+4211.
3.5 Gemini-N Spectroscopy
Using the optical catalogs created from GMOS preimaging, we designed slit masks for GMOS to obtain redshifts of potential cluster galaxies, following a similar procedure to design masks. Spectra were obtained using slit widths, the R400 grating, and the RG810 filter. Three sets of nod and shuffle sequences were obtained at each of two central wavelength settings (8100 and 8200 Angstroms). Each nod and shuffle sequence used arcsec nods, with 9 cycles of 60 s exposures, so the total on-source exposure time was 6480 s. The seeing was in the to range. Table 1 lists the observation dates for each cluster. The GMOS spectra were reduced using standard procedures in IRAF.
4 Results
4.1 Color-magnitude Diagrams
For all of the imaging described above, SExtractor (Bertin & Arnouts, 1996) catalogs were generated using the longer wavelength image for detection. Photometry was obtained from the shorter wavelength image using SExtractor in dual band mode. Magnitudes were measured using circular apertures with a diameter of 2.5 arcsec, except for the clusters where we use IRAC images for which the aperture size is 4 arcsec diameter, and were aperture-corrected. All magnitudes are on the AB system.
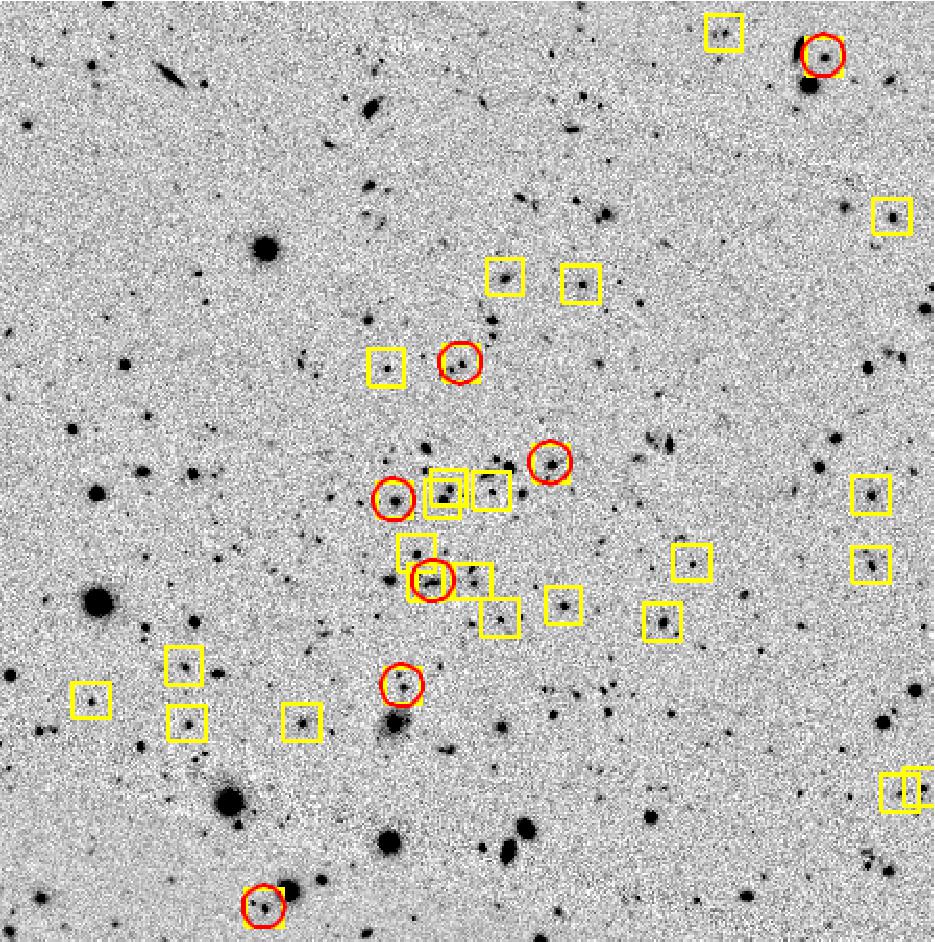
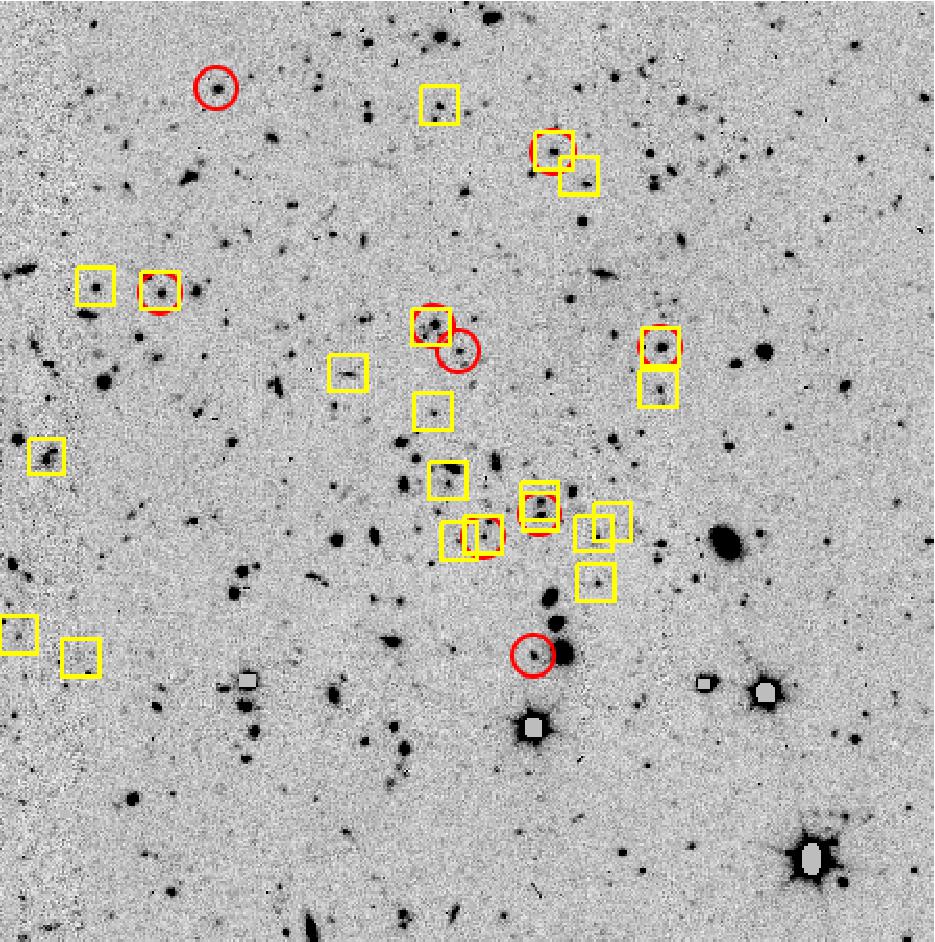
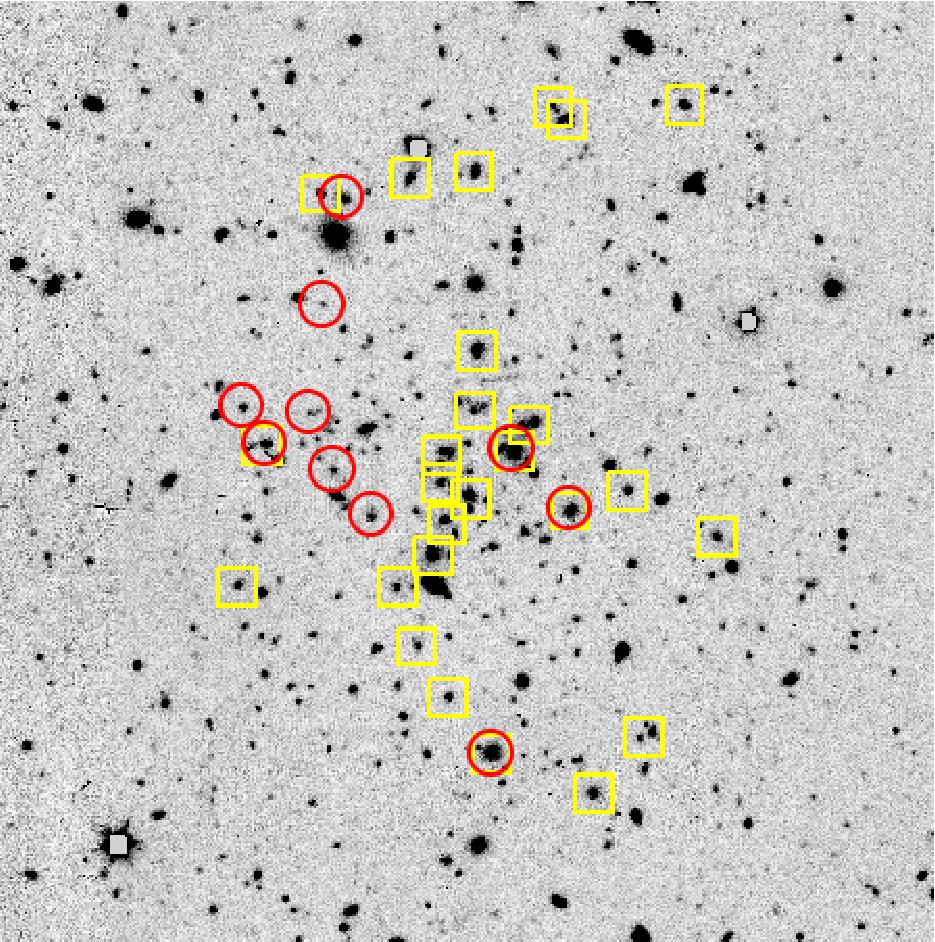
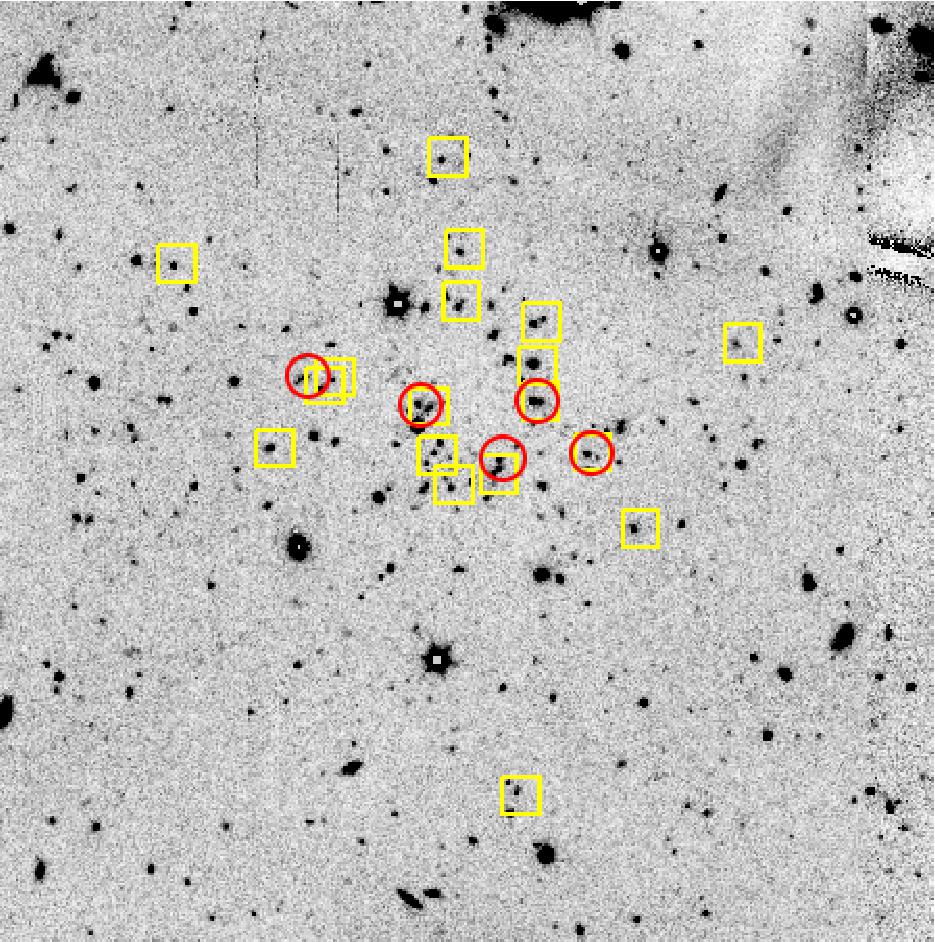
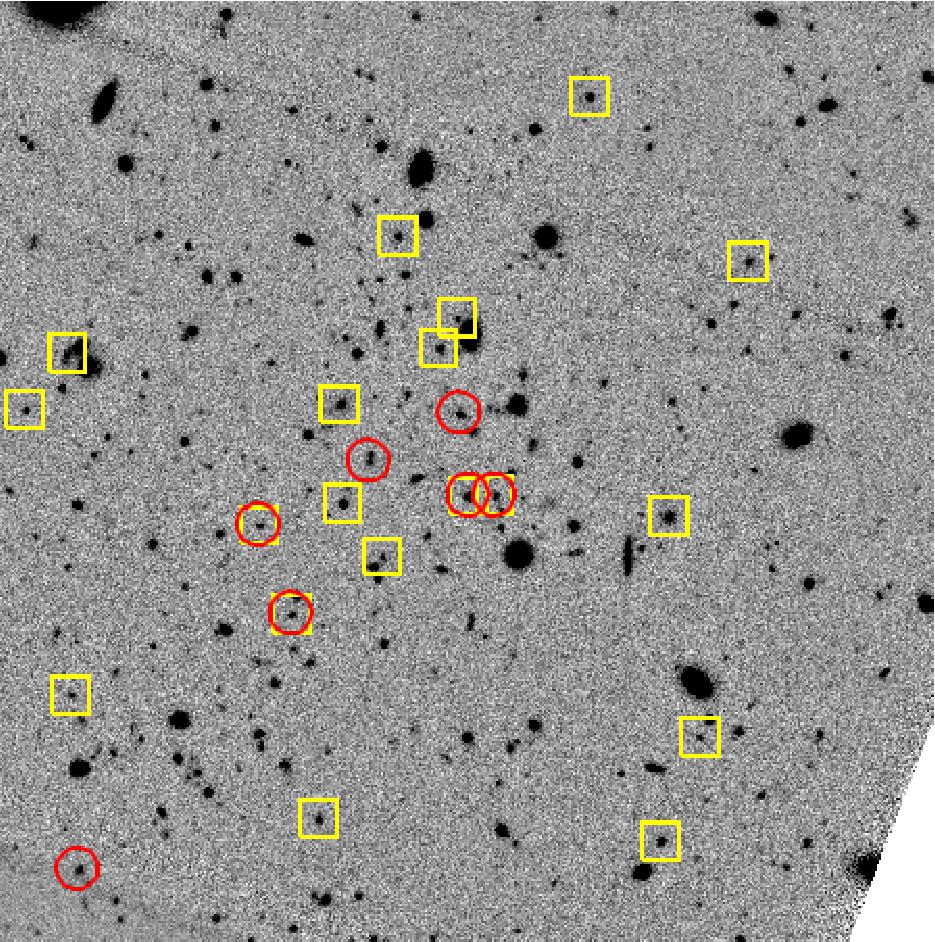
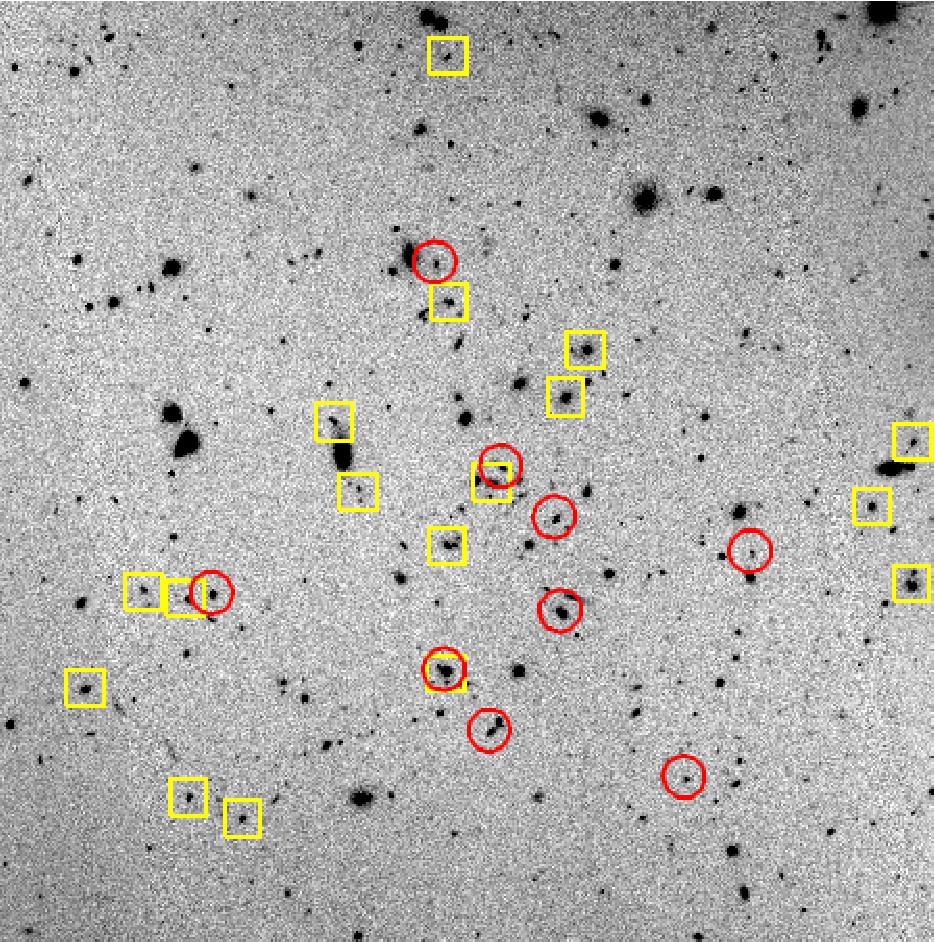
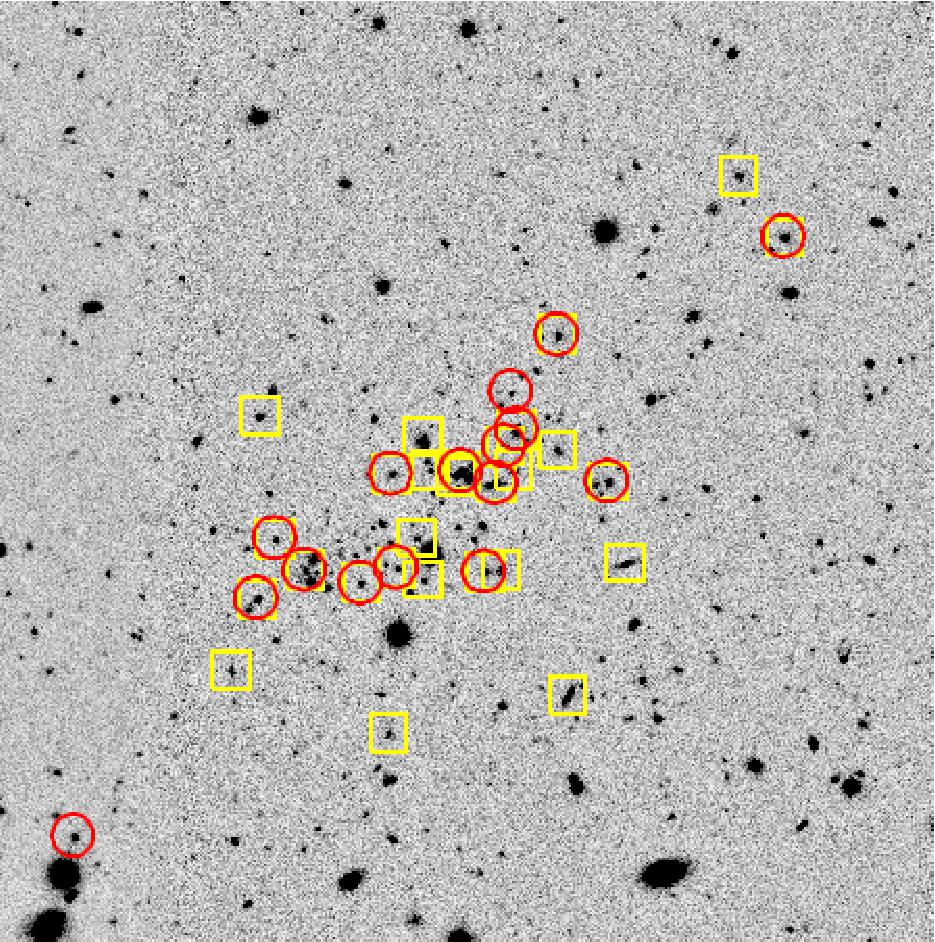
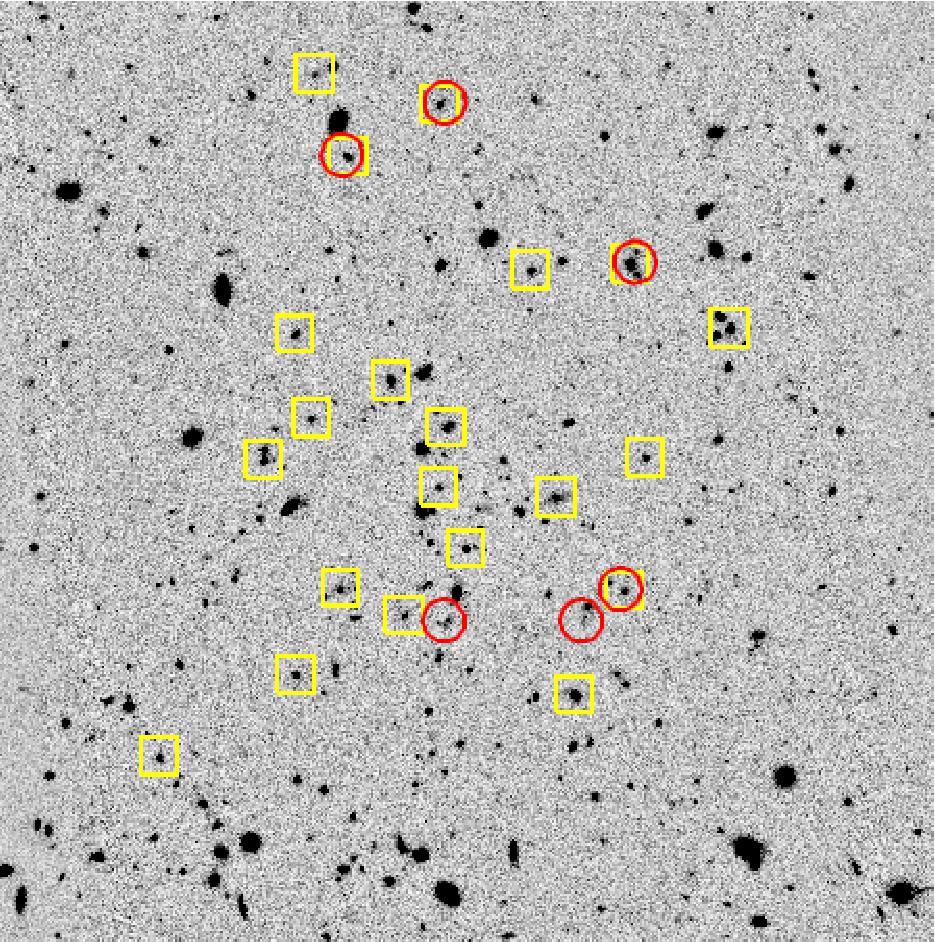
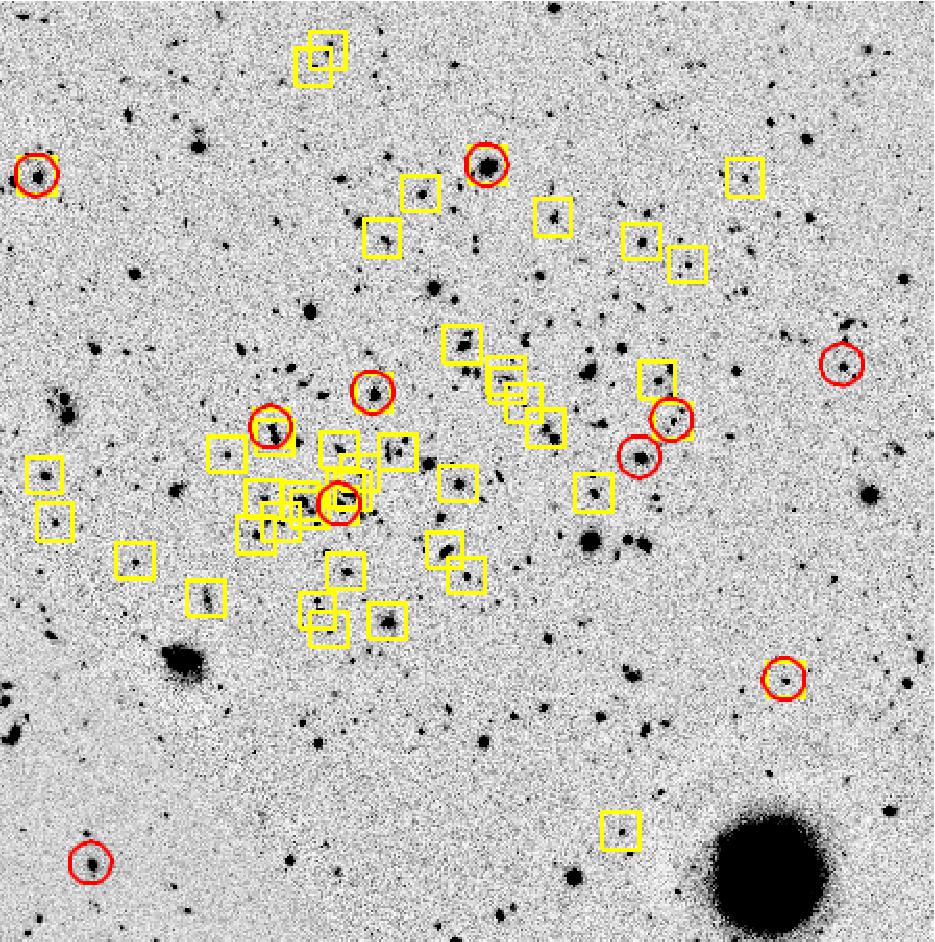
Color magnitude diagrams (CMDs) were constructed for all the confirmed clusters in Table 1, and are presented in Figure 2. For MOO 1625+2629 and MOO 1210+3154 we do not have any optical imaging, so the CMDs use [3.6] [4.5] colors, which have a more limited power to discriminate the red sequence of a cluster from field galaxies. For reference, the luminosity and color of an galaxy appropriate to each cluster’s redshift are shown in the CMDs. The color was calculated from a passive evolution model using EzGal (Mancone & Gonzalez, 2012) with the following parameters: the 2007 version of a Bruzual & Charlot (2003) simple stellar population (SSP) model, , Solar metallicity, and a Chabrier (2003) IMF. The luminosity is calculated using a normalization of the Bruzual-Charlot model to the Coma cluster luminosity function (De Propris et al., 1998). The spectroscopic member galaxies are marked by red circles, and objects within the red sequence are marked by yellow squares. The red sequence is defined as magnitudes within one magnitude of L∗, and 0.3 magnitudes of the model color.
4.2 Redshifts
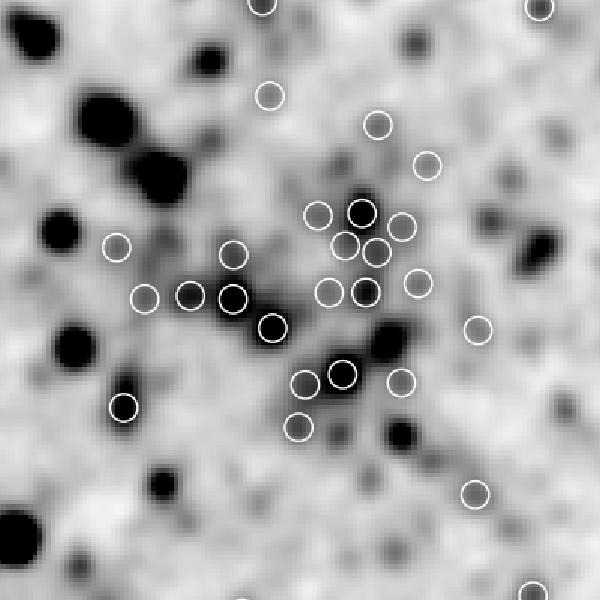
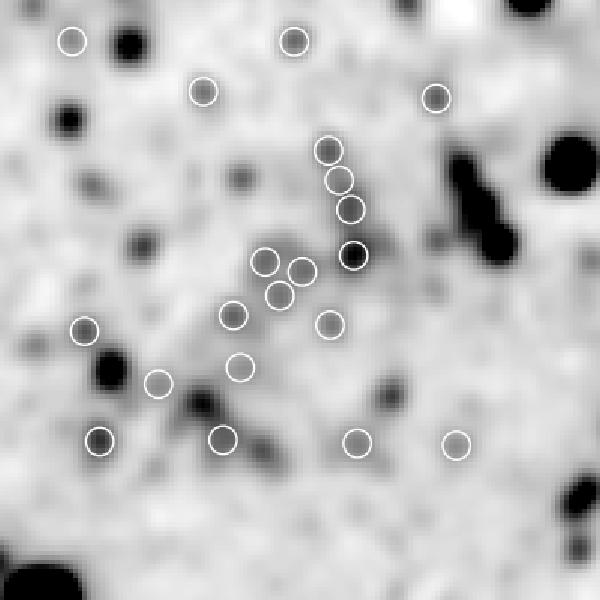
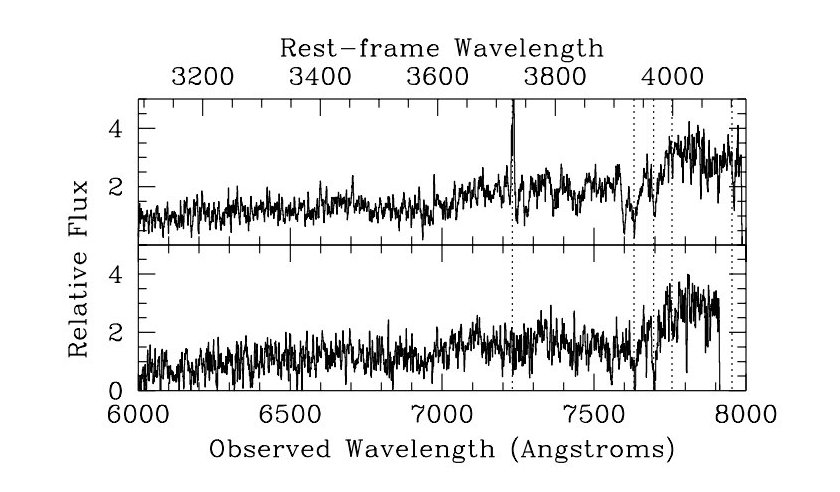
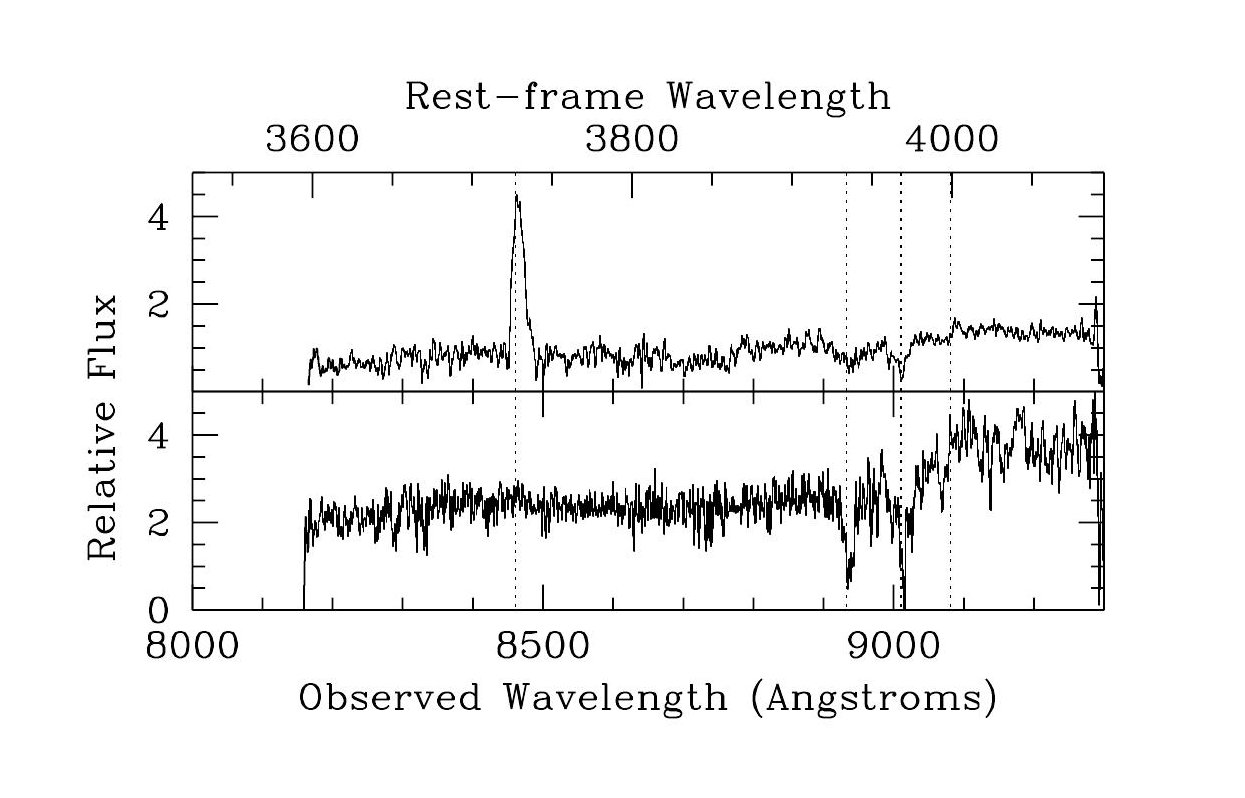
Redshifts of objects in each cluster were determined by visual inspection of the reduced spectra and identification of prominent spectral features including the 4000 Angstrom break, the Ca H+K absorption lines, and the [O II] emission line. Sample spectra are shown in Figure 3 for one of the lower-redshift clusters and for one of the higher redshift clusters. Redshift information for all the cluster members is given in Table 2. The spectroscopic member galaxies are marked in the color-magnitude diagrams as well as in the optical/infrared images shown in Figures 1 and 2, respectively. Clusters for which at least 5 objects have redshifts within km s-1 and within a radius of 2 Mpc are considered to be confirmed.
The overall results of the spectroscopy are summarized in Table 3, which lists the confirmed clusters with their mean redshifts, and in Figure 4. The redshift histogram shows that the MaDCoWS selection technique effectively identifies galaxy clusters. Four of the new clusters, represented in Figure 4 by the open areas of the histogram, were selected with a preliminary version of the search criteria but are not in the final selection of cluster candidates. They have a redshift distribution broadly similar to the final selection.
The spectroscopic results can be used to make a preliminary assessment of the purity of the sample, with the caveat that the selection method has evolved over the course of the spectroscopic campaigns, as both the spectroscopic results and IRAC imaging were used to refine the cluster search. To assess the purity of the MaDCoWS sample, we consider the confirmation rate of cluster candidates that are among the 200 highest significance detections in the current iteration of the WISE search. From this list, we have spectroscopically confirmed 14 clusters. In addition to these, we obtained optical spectroscopy of 6 other candidates in the current MaDCoWS selection. For one candidate the redshifts show the presence of multiple groups along the line of sight and so we deem this candidate to be a failure. For the remaining five candidates, we find a spread of redshifts with no definitive evidence of groups or clusters. Because only one mask was obtained on each of these five candidates, we cannot yet confidently state whether they are real or spurious. Considering the limiting cases where all or none of these five candidates are spurious, we find that the purity lies in the range 70-95%.
5 Discussion
We have presented imaging and spectroscopy that confirms 19 new galaxy clusters in the range, which were selected using the All-Sky WISE data release. This set of new clusters, which includes nine at , robustly demonstrates the viability of conducting an all-sky search for such objects using WISE. The distribution of the cluster redshifts indicates that our final MaDCoWS selection technique identifies galaxy clusters primarily in the range. To date, five of the clusters in Table 3 have been observed by CARMA and have measured SZ decrements, consistent with M200 in the range M⊙ range (Brodwin et al., in prep.). As a result, the clusters identified by MaDCoWS are expected to form a valuable sample for obtaining cosmological constraints, and for better understanding of the formation of massive clusters and their constituent galaxy populations at .
The color-magnitude diagrams, optical images, and spectroscopy suggest that the MaDCoWS clusters span a variety of cluster types. Some clusters such as MOO 15141316 appear to be relaxed, with a centrally concentrated core of galaxies, a well-defined red sequence, and few emission-line objects. But other clusters span the range of possible combinations of these characteristics, some having few emission-line objects but little if any spatial concentration in a core region, and others having a relatively high fraction of emission-line galaxies and a well-formed cluster core. The optical spectroscopy was being carried out while we were fine-tuning the WISE selection procedure, and this could contribute to the variety of cluster properties in the confirmed clusters. As the number of confirmed clusters and members in each cluster increases, it will become possible to draw more robust conclusions about the galaxy populations in MaDCoWS clusters.
The prospects for extending the redshift reach, the upper mass range, and the effective area of MaDCoWS are excellent. Some of the newly confirmed clusters were chosen for follow-up without the benefit of seeing the IRAC images, which were obtained later than the observing runs at the ground-based telescopes. Now that we can fully exploit our IRAC imaging of the 200 richest WISE cluster candidates to select targets for future follow-up at e.g. CARMA and Keck, we expect that the mean cluster mass of the MaDCoWS cluster sample will rise. Additionally, the clusters presented here were discovered using the original All-Sky WISE data. The AllWISE data release (Cutri et al. 2013), which contains twice the exposure time in the W1 and W2 bands, now provides deeper photometry in the W1 and W2 bandpasses, enabling a search extending to higher redshifts which we are now undertaking. In the future, the prospect of combining the one year of AllWISE survey data with the three years of additional survey data expected from the recently reactivated NEOWISE survey (Mainzer et al. in prep) should allow us to select at W2 and identify robust cluster candidates to . Finally, the area so far covered by MadCoWS has been restricted to that of the SDSS, as their optical imaging efficiently suppresses low-redshift interlopers that would otherwise be selected by the WISE W1W2 color. As more area is covered by optical imaging surveys of similar quality, such as the Dark Energy Survey, we will expand the area of our WISE search for the most massive galaxy clusters at and above.
References
- Aihara et al. (2011) Aihara, H., Allende Prieto, C., An, D., et al. 2011, ApJS, 193, 29
- Allen, Evrard, & Mantz (2011) Allen, S., Evrard, A., & Mantz, A. 2011, ARA&A, 49, 409
- Ahn et al. (2014) Ahn, C.P. et al. 2014, ApJS, in press
- Ashby et al. (2013) Ashby, M., et al. 2013, ApJS, 209, 22
- Benson et al. (2013) Benson, B. et al. 2013, ApJ, 763, 147
- Bertin (2006) Bertin, E. 2006, in Astronomical Society of the Pacific Conference Series, Vol. 351, Astronomical Data Analysis Software and Systems XV, ed. C. Gabriel, C. Arviset, D. Ponz, & S. Enrique, 112
- Bertin & Arnouts (1996) Bertin, E., & Arnouts, S. 1996, A&AS, 117, 393
- Bertin et al. (2002) Bertin, E., Mellier, Y., Radovich, M., et al. 2002, in Astronomical Society of the Pacific Conference Series, Vol. 281, Astronomical Data Analysis Software and Systems XI, ed. D. A. Bohlender, D. Durand, & T. H. Handley, 228
- Brodwin et al. (2011) Brodwin, M. et al. 2011, ApJ, 732, 33
- Bruzual & Charlot (2003) Bruzual, G., & Charlot, S. 2003, MNRAS, 344, 1000
- Chabrier (2003) Chabrier, G. 2003, PASP, 115, 763
- De Propris et al. (1998) De Propris, R., Eisenhardt, P., Stanford, S.A., & Dickinson, M. 1998, ApJ, 503, 45
- Dressler (1980) Dressler, A. 1980, ApJ, 236, 351
- Ebeling et al. (1998) Ebeling, H., Edge, A. C., Bohringer, H., et al. 1998, MNRAS, 301, 881
- Ebeling et al. (2001) Ebeling, H., Edge, A. C., & Henry, J. P. 2001, ApJ, 553, 668
- Eisenhardt et al. (2008) Eisenhardt, P. R. M., Brodwin, M., Gonzalez, A. H., et al. 2008, ApJ, 684, 905
- Fazio et al. (2004) Fazio, G.G., Hora, J.L, Allen, L.E. 2004, ApJS, 154, 10
- Galametz et al. (2012) Galametz, A. et al. 2012, ApJ, 749, 169
- Gettings et al. (2012) Gettings, D. P., Gonzalez, A. G., Stanford, S. A., et al. 2012, ApJ, 759, 23
- Makovoz & Khan (2005) Makovoz, D.., Khan, I., 2005, in Astronomical Society of the Pacific Conference Series, Vol. 347, ADASS XIV, ed. P. Shopbell, M. Britton, & R. Ebert, 81
- Mancone & Gonzalez (2012) Mancone, C. L., & Gonzalez, A. H. 2012, PASP, 124, 606
- Marriage et al. (2011) Marriage, T. A., Acquaviva, V., Ade, P. A. R., et al. 2011, ApJ, 737, 61
- Monet et al. (2003) Monet, D. G., Levine, S. E., Canzian, B., et al. 2003, AJ, 125, 984
- Muzzin et al. (2013) Muzzin, A. et al. 2013, ApJ, 767, 39
- Papovich (2008) Papovich, C. 2008, ApJ, 676, 206
- Papovich et al. (2010) Papovich, C., Momcheva, I., Willmer, C. N. A., et al. 2010, ApJ, 716, 1503
- Planck Collaboration et al. (2013) Planck Collaboration et al. 2013, , arXiv:1303.5089
- Predehl et al. (2010) Predehl, P. et al. 2010, arxiv:1001.2502
- Reichardt et al. (2012) Reichardt, C. L., Stalder, B., Bleem, L. E., et al. 2012, ArXiv e-prints
- Stanford et al. (2012) Stanford, S. A., Brodwin, M., Gonzalez, A. H., et al. 2012, ApJ, 753, 164
- Williamson et al. (2011) Williamson, R., Benson, B. A., High, F. W., et al. 2011, ApJ, 738, 139
- Wright et al. (2010) Wright, E. L., Eisenhardt, P. R. M., Mainzer, A. K., et al. 2010, AJ, 140, 1868
- Zeimann et al. (2012) Zeimann, G. R., Stanford, S. A., Brodwin, M., et al. 2012, ApJ, 756, 115
- Wylezalek et al. (2013) Wylezalek, D. et al. 2013, ApJ, 769, 79
- Zwicky (1937) Zwicky, F. 1937, ApJ, 86, 217
| Cluster ID | (J2000) | (J2000) | Imaging22Source of imaging used to create color-magnitude diagrams in Figure 2. | Spectroscopy–Instrument: UT Dates |
|---|---|---|---|---|
| MOO11MOO stands for MaDCoWS Overdense ObjectJ00121602 | 00:12:13.0 | 16:02:16 | GMOS | DEIMOS: 2013-09-08, 2013-09-09 |
| MOO J00243303 | 00:24:44.9 | 33:03:10 | GMOS | GMOS: 2013-11-25, DEIMOS: 2013-09-09 |
| MOO J01251344 | 01:25:22.4 | 13:44:35 | GMOS | GMOS: 2013-11-26, DEIMOS: 2013-09-08 |
| MOO J01300922 | 01:30:36.4 | 09:22:36 | GTC, IRAC | DEIMOS: 2012-10-18, 2012-10-19 |
| MOO J01331057 | 01:33:55.6 | 10:57:44 | GTC, IRAC | DEIMOS: 2012-10-18, 2012-10-19 |
| MOO J02121813 | 02:12:04.1 | 18:14:13 | GTC, IRAC | DEIMOS: 2012-10-18 |
| MOO J02240620 | 02:24:51.3 | 06:20:17 | GMOS | GMOS: 2013-12-04 |
| MOO J02452018 | 02:45:07.9 | 20:18:15 | GMOS | GMOS: 2012-10-16+17, DEIMOS: 2012-10-18+19 |
| MOO J03190025 | 03:19:25.6 | 00:25:20 | GMOS | DEIMOS: 2013-09-07 |
| MOO J11553901 | 11:55:45.4 | 39:01:06 | GMOS | GMOS: 2013-05-28 |
| MOO J12103154 | 12:10:54.3 | 31:54:40 | IRAC | DEIMOS: 2013-05-09 |
| MOO J13195519 | 13:19:38.3 | 55:19:07 | GMOS | GMOS: 2013-06-30, 2013-07-01 |
| MOO J13353004 | 13:35:41.7 | 30:04:13 | GMOS | GMOS: 2013-04-19 |
| MOO J15141346 | 15:14:43.8 | 13:46:32 | GMOS | GMOS: 2013-04-19, DEIMOS: 2013-07-13 |
| MOO J16252629 | 16:25:03.4 | 26:29:54 | IRAC | DEIMOS: 2013-09-09 |
| MOO J22050917 | 22:05:37.5 | 09:17:28 | GMOS | GMOS: 2013-10-27 |
| MOO J23200620 | 23:20:16.8 | 06:20:32 | GTC, IRAC | DEIMOS: 2012-10-18 |
| MOO J23480846 | 23:48:19.9 | 08:46:01 | GTC, IRAC | DEIMOS: 2012-10-13, 2012-10-19 |
| MOO J23551030 | 23:55:01.0 | 10:30:43 | GMOS | DEIMOS: 2013-09-09 |

| Object11The object ID is created from the cluster MOO ID followed by the RA and Dec of the object. | (J2000) | (J2000) | z | Q | Type |
|---|---|---|---|---|---|
| 0012+1602.001213.6+160204 | 00:12:13.699 | 16:02:04.7 | 0.946 | B | E |
| 0012+1602.001218.7+160246 | 00:12:18.742 | 16:02:46.0 | 0.946 | A | A |
| 0012+1602.001211.2+160151 | 00:12:11.249 | 16:01:51.3 | 0.940 | B | A |
| 0012+1602.001209.9+160216 | 00:12:09.983 | 16:02:16.4 | 0.950 | A | A |
| 0012+1602.001208.6+160238 | 00:12:08.601 | 16:02:38.2 | 0.949 | B | A |
| 0012+1602.001214.7+160231 | 00:12:14.799 | 16:02:31.6 | 0.938 | A | E |
| 0012+1602.001218.7+160219 | 00:12:18.732 | 16:02:19.1 | 0.941 | B | A |
| 0012+1602.001212.5+160214 | 00:12:12.507 | 16:02:14.4 | 0.950 | B | A |
| 0012+1602.001206.8+160217 | 00:12:06.854 | 16:02:17.2 | 0.952 | B | A |
| 0012+1602.001217.1+160227 | 00:12:17.166 | 16:02:27.6 | 0.943 | A | A |
| 0012+1602.001214.2+160220 | 00:12:14.223 | 16:02:20.5 | 0.941 | A | E |
| 0012+1602.001216.3+160241 | 00:12:16.302 | 16:02:41.2 | 0.938 | A | E |
| 0012+1602.001218.7+160314 | 00:12:18.799 | 16:03:14.7 | 0.932 | A | E |
| 0012+1602.001213.4+160234 | 00:12:13.415 | 16:02:34.1 | 0.952 | B | A |
| 0012+1602.001216.1+160229 | 00:12:16.104 | 16:02:29.3 | 0.952 | A | A |
| 0012+1602.001223.6+155749 | 00:12:23.627 | 15:57:49.7 | 0.948 | A | E |
| 0012+1602.001229.7+155802 | 00:12:29.705 | 15:58:02.4 | 0.947 | A | E |
| 0012+1602.001215.4+160236 | 00:12:15.437 | 16:02:36.8 | 0.942 | A | E |
| 0012+1602.001213.4+160155 | 00:12:13.403 | 16:01:55.7 | 0.940 | B | A |
| 0012+1602.001222.7+160126 | 00:12:22.798 | 16:01:26.1 | 0.930 | B | A |
| 0012+1602.001214.0+160033 | 00:12:14.099 | 16:00:33.7 | 0.948 | A | A |
| 0012+1602.001214.4+160229 | 00:12:14.418 | 16:02:29.1 | 0.942 | B | A |
| 0012+1602.001215.5+160150 | 00:12:15.516 | 16:01:50.0 | 0.944 | B | A |
Note. — Redshifts of individual galaxies. This is a partial listing of the member galaxies in only one cluster; redshifts of individual galaxies for all the clusters will be available electronically. The Q column describes the quality of the redshift using the following codes: A = high degree of certainty based on multiple features; B = reasonable certainty based on at least two features. In the Type column, E means the optical spectrum has an emission line (nearly always [O II]3727), and A means it is an absorption line (Ca HK, D4000) spectrum.



| Cluster ID | Mean Redshift | Members | A/E |
|---|---|---|---|
| MOO J0012160211Sunyaev-Zel’dovich decrements (significance ) were measured by CARMA for these clusters (Brodwin et al., in prep.) | 0.944 | 23 | 15/9 |
| MOO J00243303 | 1.115 | 6 | 5/1 |
| MOO J01251344 | 1.128 | 11 | 6/5 |
| MOO J01300922 | 1.146 | 11 | 6/5 |
| MOO J01331057 | 0.957 | 13 | 3/10 |
| MOO J02121813 | 1.098 | 6 | 4/2 |
| MOO J02240620 | 0.816 | 7 | 5/2 |
| MOO J02452018 | 0.757 | 14 | 2/12 |
| MOO J0319002511Sunyaev-Zel’dovich decrements (significance ) were measured by CARMA for these clusters (Brodwin et al., in prep.) | 1.194 | 20 | 16/4 |
| MOO J1155390111Sunyaev-Zel’dovich decrements (significance ) were measured by CARMA for these clusters (Brodwin et al., in prep.) | 1.009 | 7 | 4/3 |
| MOO J12103154 | 1.046 | 11 | 7/4 |
| MOO J1319551911Sunyaev-Zel’dovich decrements (significance ) were measured by CARMA for these clusters (Brodwin et al., in prep.) | 0.936 | 15 | 11/4 |
| MOO J13353004 | 0.980 | 10 | 7/3 |
| MOO J1514134611Sunyaev-Zel’dovich decrements (significance ) were measured by CARMA for these clusters (Brodwin et al., in prep.) | 1.059 | 20 | 16/4 |
| MOO J16252629 | 1.199 | 7 | 4/3 |
| MOO J22050917 | 0.930 | 7 | 7/0 |
| MOO J23200620 | 0.923 | 7 | 3/4 |
| MOO J23480846 | 0.891 | 16 | 7/9 |
| MOO J23551030 | 1.266 | 9 | 5/4 |
Note. — The last column provides the numbers of members which have absorption-line (A) and emission-line (E) spectra, as defined in Table 2.