Effects of stellar flybys on planetary systems: 3D modeling of the circumstellar disks damping effects.
Abstract
Context. Stellar flybys in star clusters are suspected to affect the orbital architecture of planetary systems causing eccentricity excitation and orbital misalignment between the planet orbit and the equatorial plane of the star.
Aims. We explore whether the impulsive changes in the orbital elements of planets, caused by an hyperbolic stellar flyby, can be fully damped by the circumstellar disk surrounding the star. The time required to disperse stellar clusters is in fact comparable to circumstellar disk’s lifetime. Since we perform 3D simulations, we can also test the inclination excitation and damping.
Methods. We have modelled in 3D with the SPH code VINE a system made of a solar type star surrounded by a low density disk with a giant planet embedded in it approached on a hyperbolic encounter trajectory by a second star, of similar mass and with its own disk. Different inclinations between the disks, planet orbit and star trajectory have been considered to explore various encounter geometries. We focus on an extreme configuration where a very deep stellar flyby perturbs a Jovian planet on an external orbit. This allows to test in full the ability of the disk to erase the effects of the stellar encounter.
Results. We find that the amount of mass lost by the disk during the stellar flyby is less than in 2D models where a single disk was considered. This is mostly related to the mass exchange between the two disks at the encounter. The damping in eccentricity is slightly faster than in 2D models and it occurs on timescales of the order of a few kyr. During the flyby both the disks are warped due to the mutual interaction and to the stellar gravitational perturbations, but they quickly relax to a new orbital plane. The planet is quickly dragged back within the disk by the tidal interaction with the gas. The only trace of the flyby left in the planet system, after about yr, is only a small misalignment, lower than , between the star equatorial plane and the planet orbit.
Conclusions. In a realistic model based on 3D simulations of star–planet–disk interactions, we find that stellar flybys cannot excite significant eccentricities and inclinations of planets in stellar clusters. The circumstellar disks hosting the planets damp on a short timescale all the step changes in the two orbital parameters produced during any stellar encounter. All records of past encounters are erased.
Key Words.:
Planets and satellites: dynamical evolution and stability — Planet–Disk interactions— Methods: numerical1 Introduction
Stars generally do not form alone but in bound clusters on a timescale of about Myr (Hillenbrand, 1997; Palla & Stahler, 2000). The embedded cluster phase lasts only a few Myr and, according to Allen et al. (2007), Fall et al. (2009), Chandar et al. (2010), and Dukes & Krumholz (2012), after about Myr, of stars born in clusters have dispersed into the field. This occurs because, after a few crossing times (Allen et al., 2007), embedded clusters lose their gaseous component, the system becomes super–virial and the cluster rapidly dissolves. A cluster, before its dissipation, is a crowded place and its dynamical evolution is characterized by frequent stellar flybys. The close encounters can have significant effects on both disks and planetary systems surrounding the stars. They can alter the disk morphology causing also mass loss and excite planet orbits. It is expected that, in the period of higher frequency of stellar encounters, circumstellar disks are still present around stars. The lifetime of disks is in fact comparable to the cluster bound phase being in the range – Myr, as suggested by Haisch et al. (2001), or even longer, up to – Myr, as recently argued by Bell et al. (2013). Therefore, to explore the effects of close stellar encounters on planetary systems in clusters, one has to account for the presence of circumstellar disks around the stars.
Recent N–body numerical modeling of the dynamical evolution of planetary systems around stars in clusters (Malmberg et al., 2011, 2007; Malmberg & Davies, 2009; Zakamska & Tremaine, 2004) have shown that scattering interactions with other stars may excite the eccentricity and inclination of planets populating the outer parts of the system. The steep changes in the orbital elements would be observable also at present and might contribute to explain the large eccentricities of extrasolar planets discovered so far and the presence of misaligned systems. However, Marzari & Picogna (2013) have shown that the planet’s eccentricity, excited during a close stellar flyby, is damped on a short timescale ( kyr) by the interaction with the circumstellar disk harbouring the planet in spite of the disk’s low density related to its viscous evolution and photoevaporation occurred during the planet growth. As a consequence, the coincidence of the cluster lifetime with that of the circumstellar disks plays against a significant role of stellar flybys in affecting the present planet dynamical architecture.
The simulations presented in Marzari & Picogna (2013) were based on the 2D code FARGO and considered a single disk around the star with planets while the perturber star was assumed diskless. In this paper we extend that model using a 3D SPH code and including two disks, one around each star. This allows us to better model close stellar flybys where the two disks closely interact. In addition, we can also explore the excitation of the planet inclination and its subsequent damping due to the interaction with the disk (Marzari & Nelson, 2009; Bitsch & Kley, 2011; Cresswell et al., 2007). We concentrate in this paper on the effects of a single deep close stellar encounter on a planet still embedded in its birth disk. If the effects of an extremely close flyby can be erased by the disk, we expect that also the cumulative effects of multiple but more distant encounters can be absorbed by the disk. We will also explore the effects on the disk morphology of the stellar tidal force and of the mutual disk interaction during the encounter.
The paper is organized as follows. In Sect. 2 we describe the numerical algorithm used to model the disks and planet evolution during and after a hyperbolic close encounter with another star. In Sect. 3 we outline the different flyby configurations we have modeled while Sect 4,5 and 6 are devoted to the presentation of the numerical outcomes. In Sect. 7 we discuss our results and their implications for the evolution of planetary systems in stellar clusters.
2 The numerical model
The hydrodynamical code used to model the evolution of the disks surrounding both stars is VINE (Wetzstein et al., 2009; Nelson et al., 2009). It is based on the smoothed particle hydrodynamics (SPH) algorithm, which solves the hydrodynamical equations by replacing the fluid with a set of particles (Gingold & Monaghan, 1977). The code has been updated to improve momentum and energy conservation as described in Picogna & Marzari (2013). Variable smoothing and softening lengths have been introduced as in Price & Monaghan (2004), Springel & Hernquist (2002) and Price & Monaghan (2007). To realistically model the gas accretion onto the planet, we implemented the algorithm described in Ayliffe & Bate (2009). The planet potential is modified adding a “surface” potential term in the following way:
| (1) |
for . and are the initial mass and radius of the planet, respectively. When an SPH particle reaches the surface of the planet () the net force is , whereas if becomes smaller than , the potential becomes strongly repulsive and the particle is driven back to the planet surface.
The disk around each star has an initial density at AU of g/cm3, approximately of the Minimum Mass Solar Nebula. Its radius extends out to AU with a density profile declining as , corresponding to a superficial density decreasing as . The total mass of each disk is , about times less massive than the disks modeled in Forgan & Rice (2009). The reason of such a low density is justified by the presence of a fully formed giant planet in the disk. In our scenario, core–accretion and gas infall already occurred and most of the gas is expected to have been either accreted by the star because of viscous evolution or dispersed by photo–evaporation. In addition, if eccentricity and inclination damping occurs in light disks, it would be even more efficient in massive disks. In modeling these light disks we can neglect the effects of self–gravity and adopt the isothermal approximation since they are optically thin. The disk scale height is set to giving a temperature at AU from the star of about K. Since during the stellar encounter the disks may become warped, the isothermal temperature profile is always computed respect to the average median plane of the disk. Each disk is simulated with SPH particles for a total of million particles for the whole system.
We adopted the standard SPH artificial viscosity (Monaghan & Gingold, 1983), introducing a linear () and a quadratic () term whose initial values are set to and , respectively. Meru & Bate (2012) showed that these terms can be compared to the Shakura & Sunyaev (1973) –viscosity parameter defined as where is the kinematic viscosity, is the sound speed and H is the vertical pressure scale height. Using their relations we find that, away from the close approach, the corresponding in our models is about .
One disk harbors a Jupiter size planet orbiting at AU on a circular orbit not inclined respect to the disk. We set the planet on an outside trajectory since we want to maximize the effects of the stellar encounter in order to test if, in spite of the highly perturbing configuration, the disk is still able to damp the planet eccentricity and inclination after the flyby. The second star is started on a hyperbolic orbit with a minimum impact parameter fixed at the beginning of the simulation. The initial distance between the two stars is AU (approximately yr before the encounter) and the relative velocity at infinity is set to km/s, a typical value in clusters. Different inclinations are considered for the passing star to test the amount of disk warping and planet excitation in inclination. The two disks are oriented at different angles up to the extreme case of prograde-retrograde encountering disks where one is rotating in the direction of the encounter orbit, and the other against it.
Prior to the encounter, the planet begins to carve a gap. We might have let the disk–planet system to evolve longer in order to allow the planet to create a full gap. However, as also shown in Fragner & Nelson (2009) and Marzari & Picogna (2013), a close stellar encounter strongly perturbs the disk and planetary orbit, cancelling out any pre-existing structure including a gap around the planet. A new gap is created some time after the stellar flyby when the disk relaxes, as shown in our simulations.
3 Definition of the different flyby geometry and disk inclinations
Due to the large amount of CPU time required by each 3D run, we have performed a limited number of simulations covering, by necessity, a small but meaningful portion of the initial phase space. We look for the most perturbed configurations since our goal is to test the ability of the gaseous disk to damp the planet orbital parameters after the stellar encounter even in extreme conditions. In Tab. 1 we summarize the main initial parameters of each simulation (first 5 columns of the table) while the changes of some relevant disk properties, during the evolution of the system, are given in the other columns. Their meaning will be described later on.
To compute the initial set up for the disks and the hyperbolic encounter, we start from a coplanar configuration where the hyperbolic trajectory of the second star has the pericenter on the positive –axis while the star harbouring the planet is at the origin of the – frame. We then tilt the hyperbolic orbit around the –axis by an angle to vary the approach geometry. We also rotate the disk of the second star around the –axis by an angle . The disk of the primary star has instead its median plane on the – plane. We could have further varied the initial configuration by rotating both the disks around the and –axis, but due to the heavy CPU load of each simulation, we considered only the rotations defined by and .
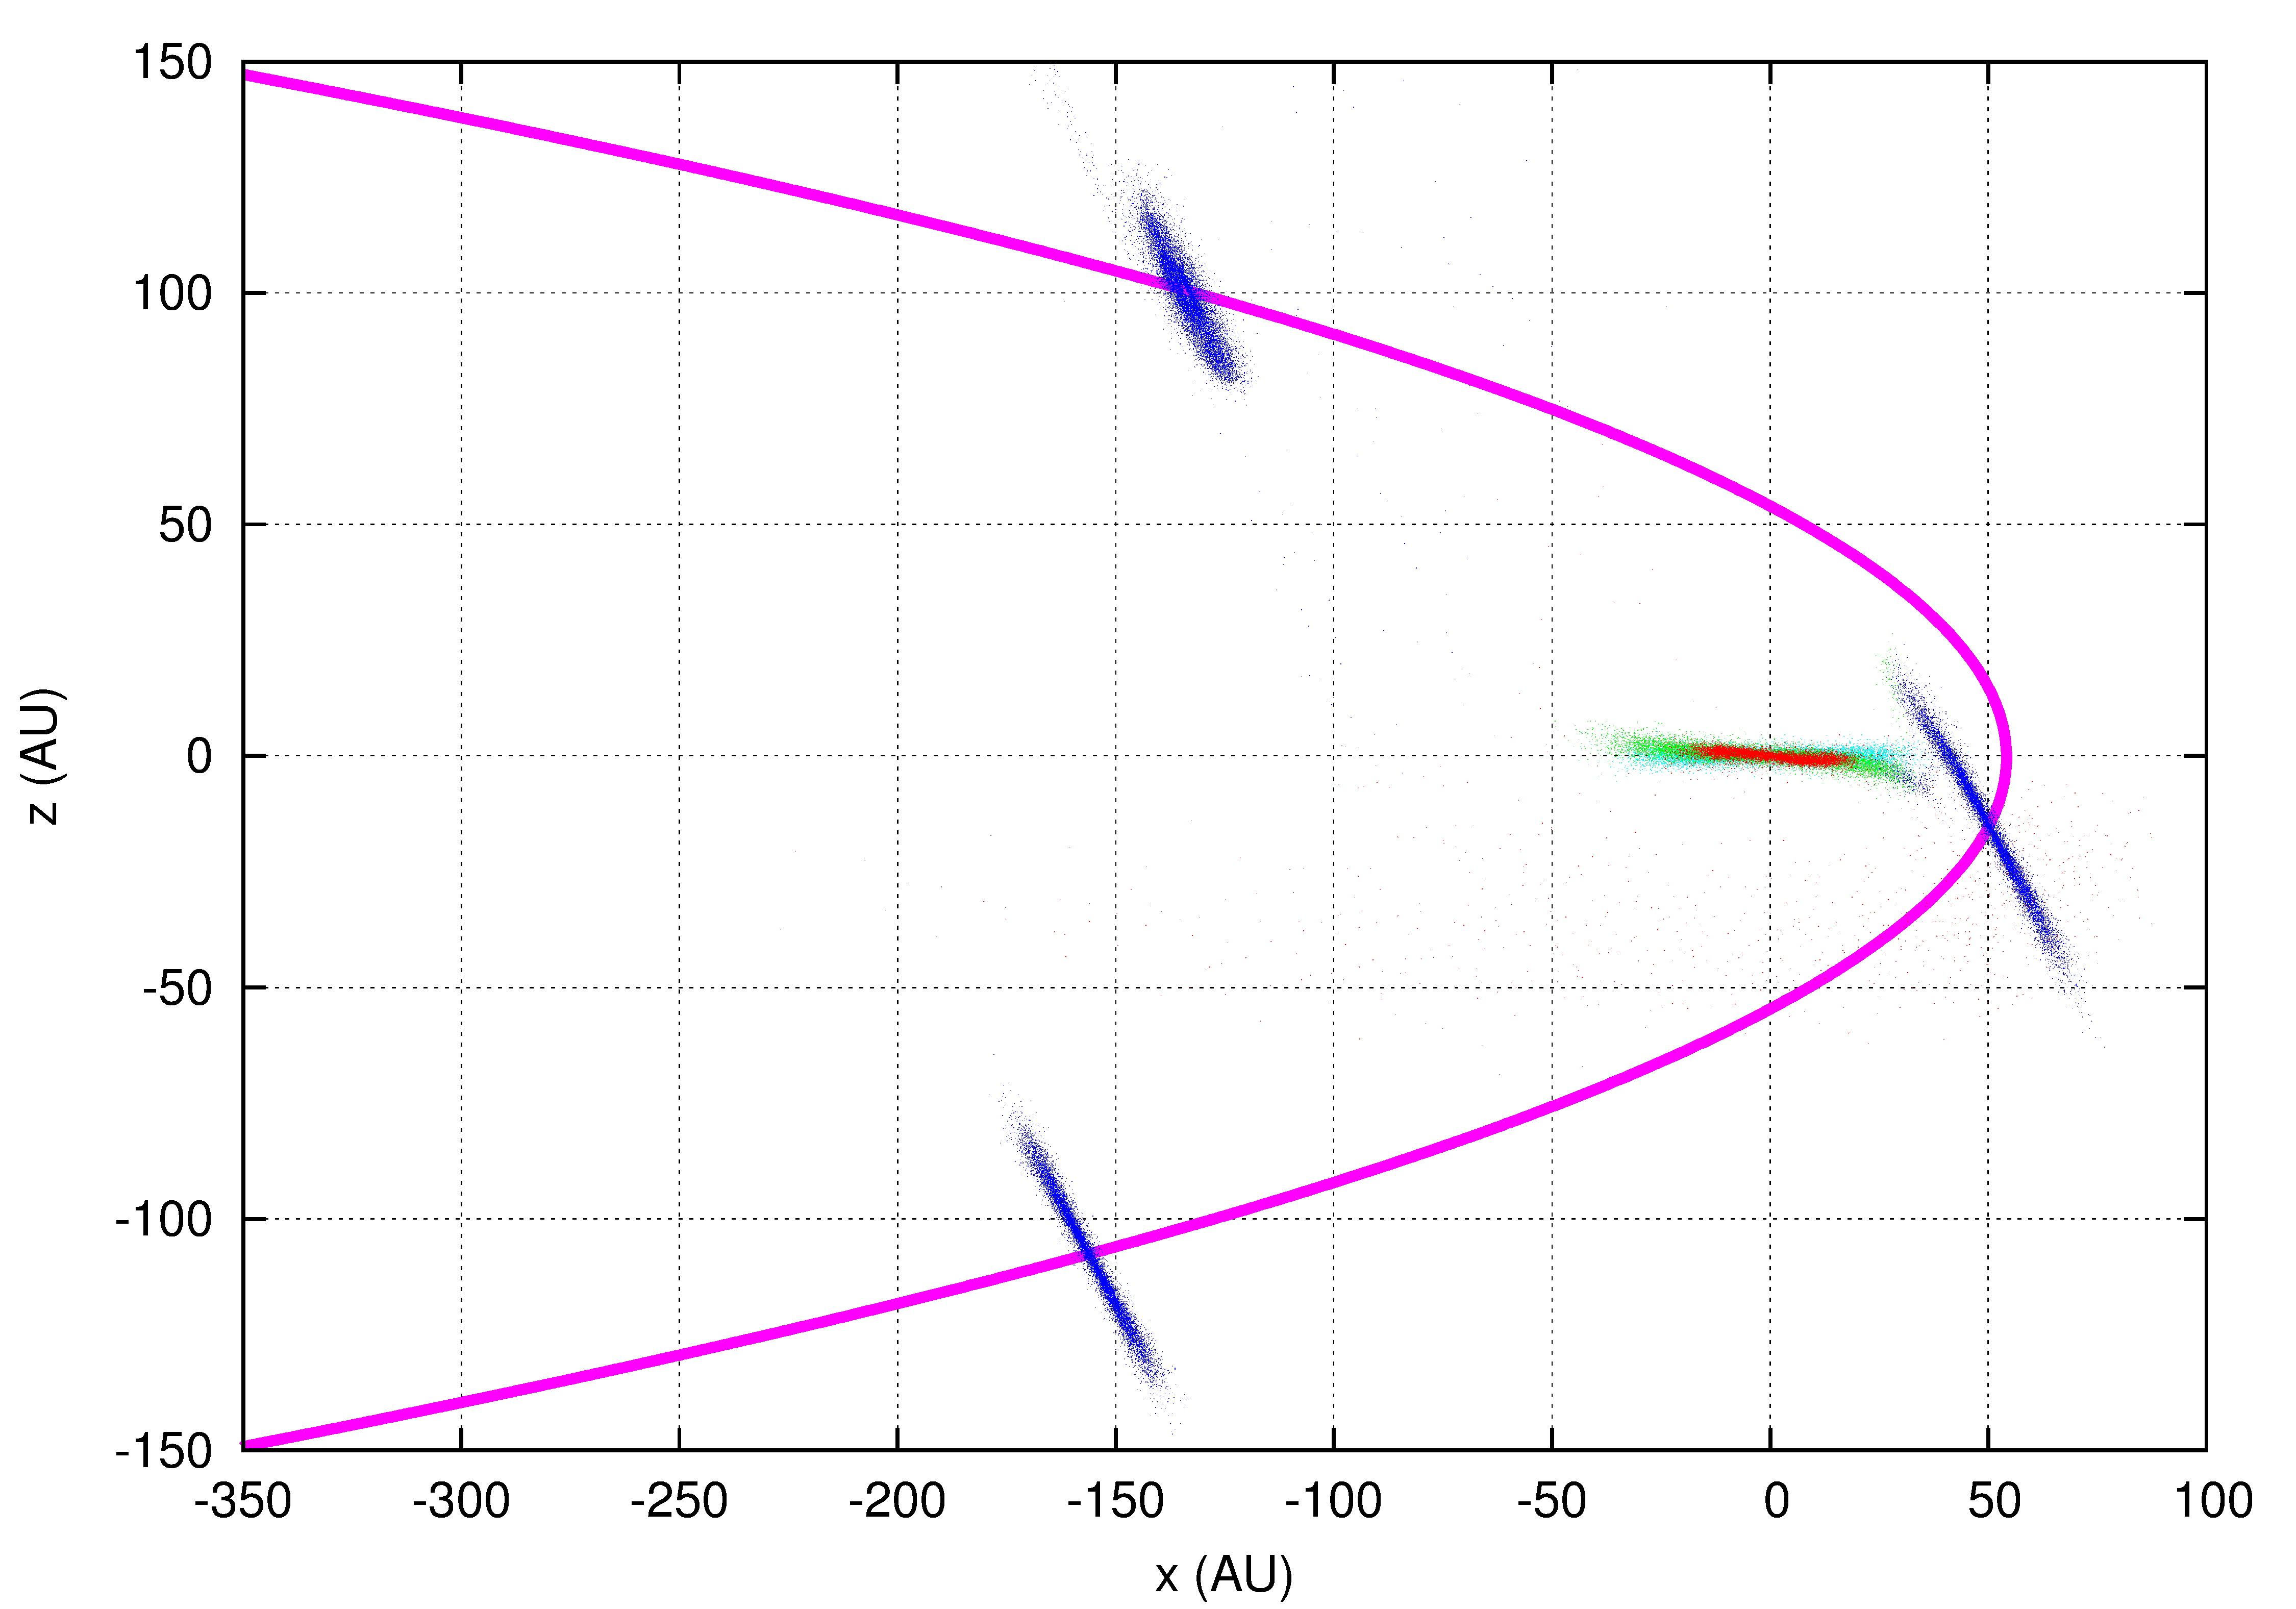
In Fig. 1a we show an example of this procedure giving a full 3D view of the encounter geometry for the case h where the disk is inclined of respect to the primary disk and the hyperbolic trajectory is inclined of respect to the primary disk plane. The hyperbolic trajectory is shown during the pericenter passage and the two disks are plotted at 3 different evolutionary times. A 2D projection in the (x,z) plane (Fig. 1b) of the previous plot gives an additional view of the mutual orientations of stars and disks.
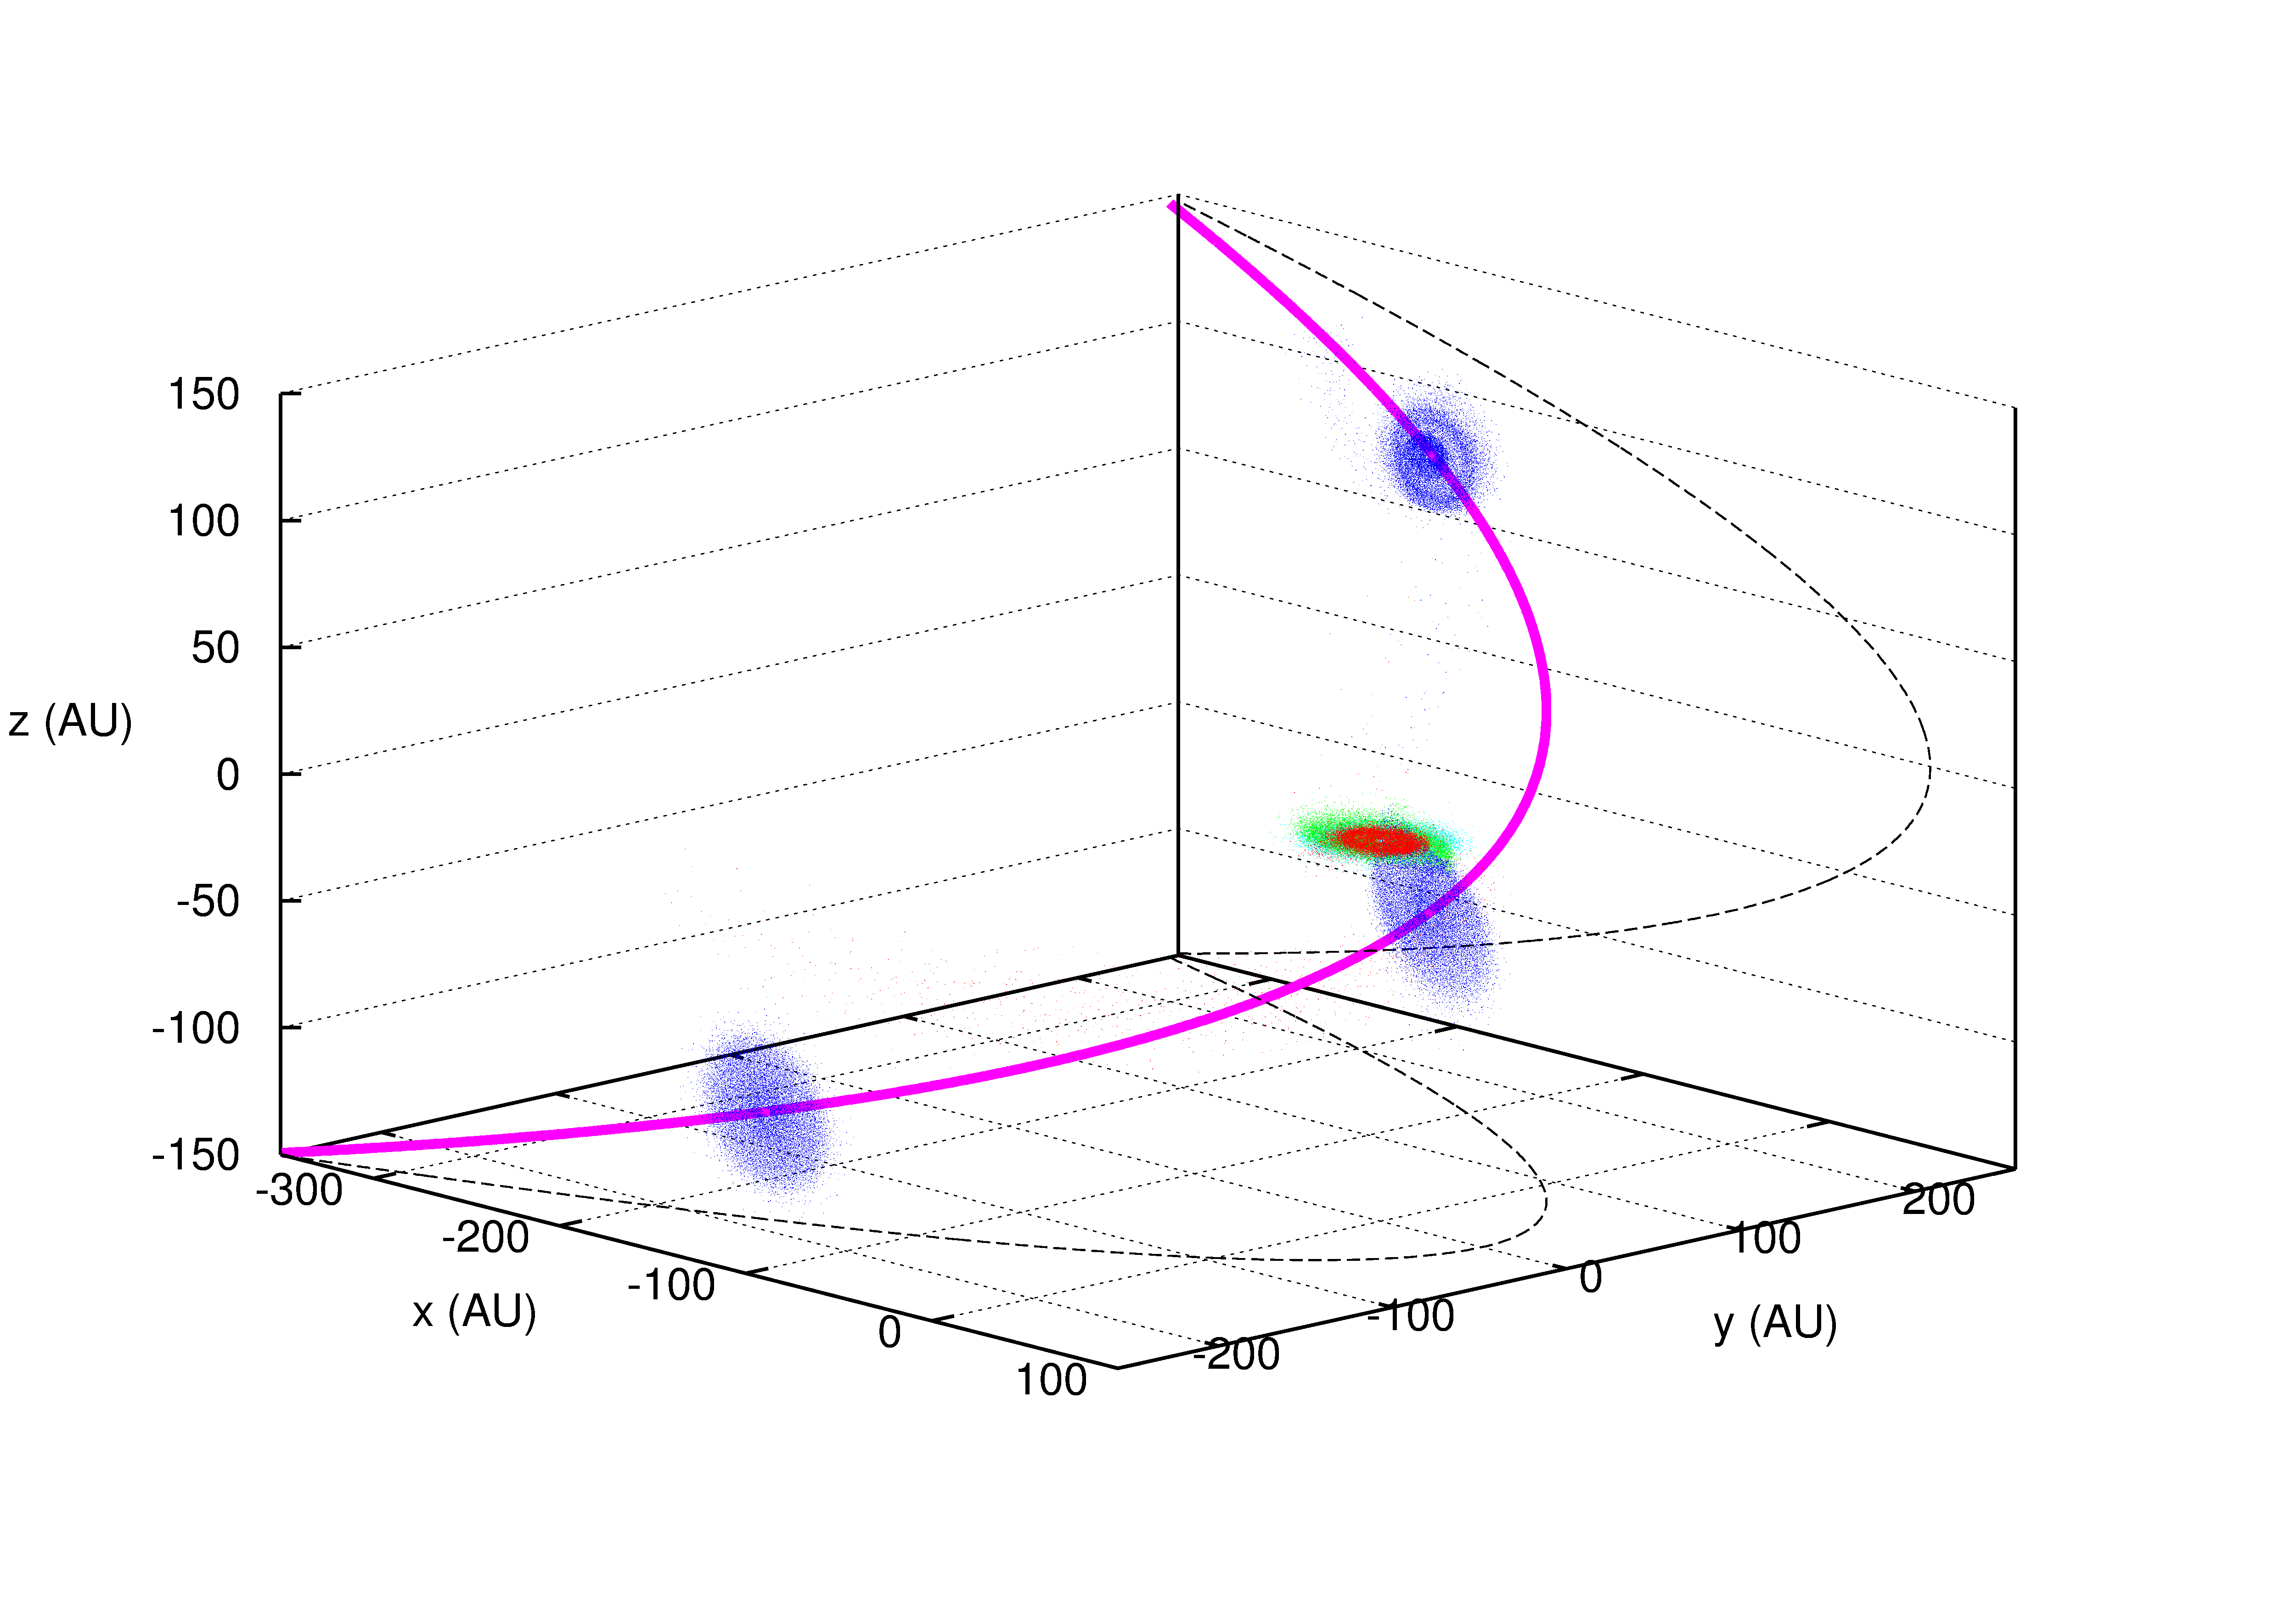
In a test case we also changed the minimum approach distance (case b) and we also performed a simulation with no disk around the second star to compare with all other cases with two disks (case d). This model is relevant for understanding the role of the disk around the second star in the evolution of the planet.
4 Cases a, b and c: .
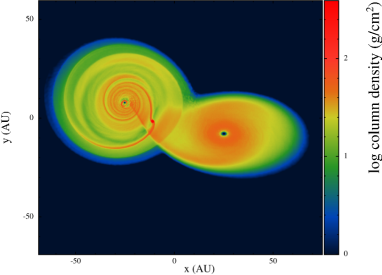
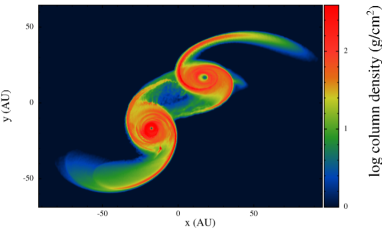
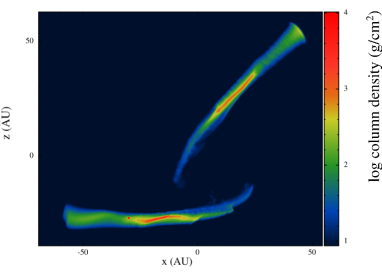
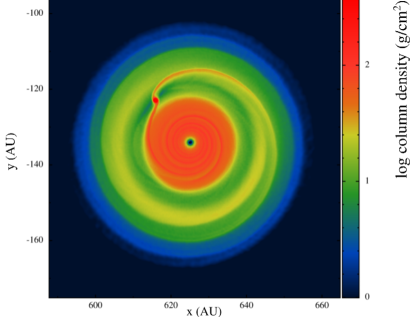
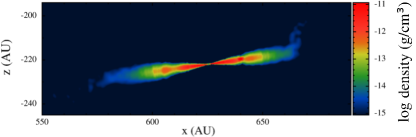
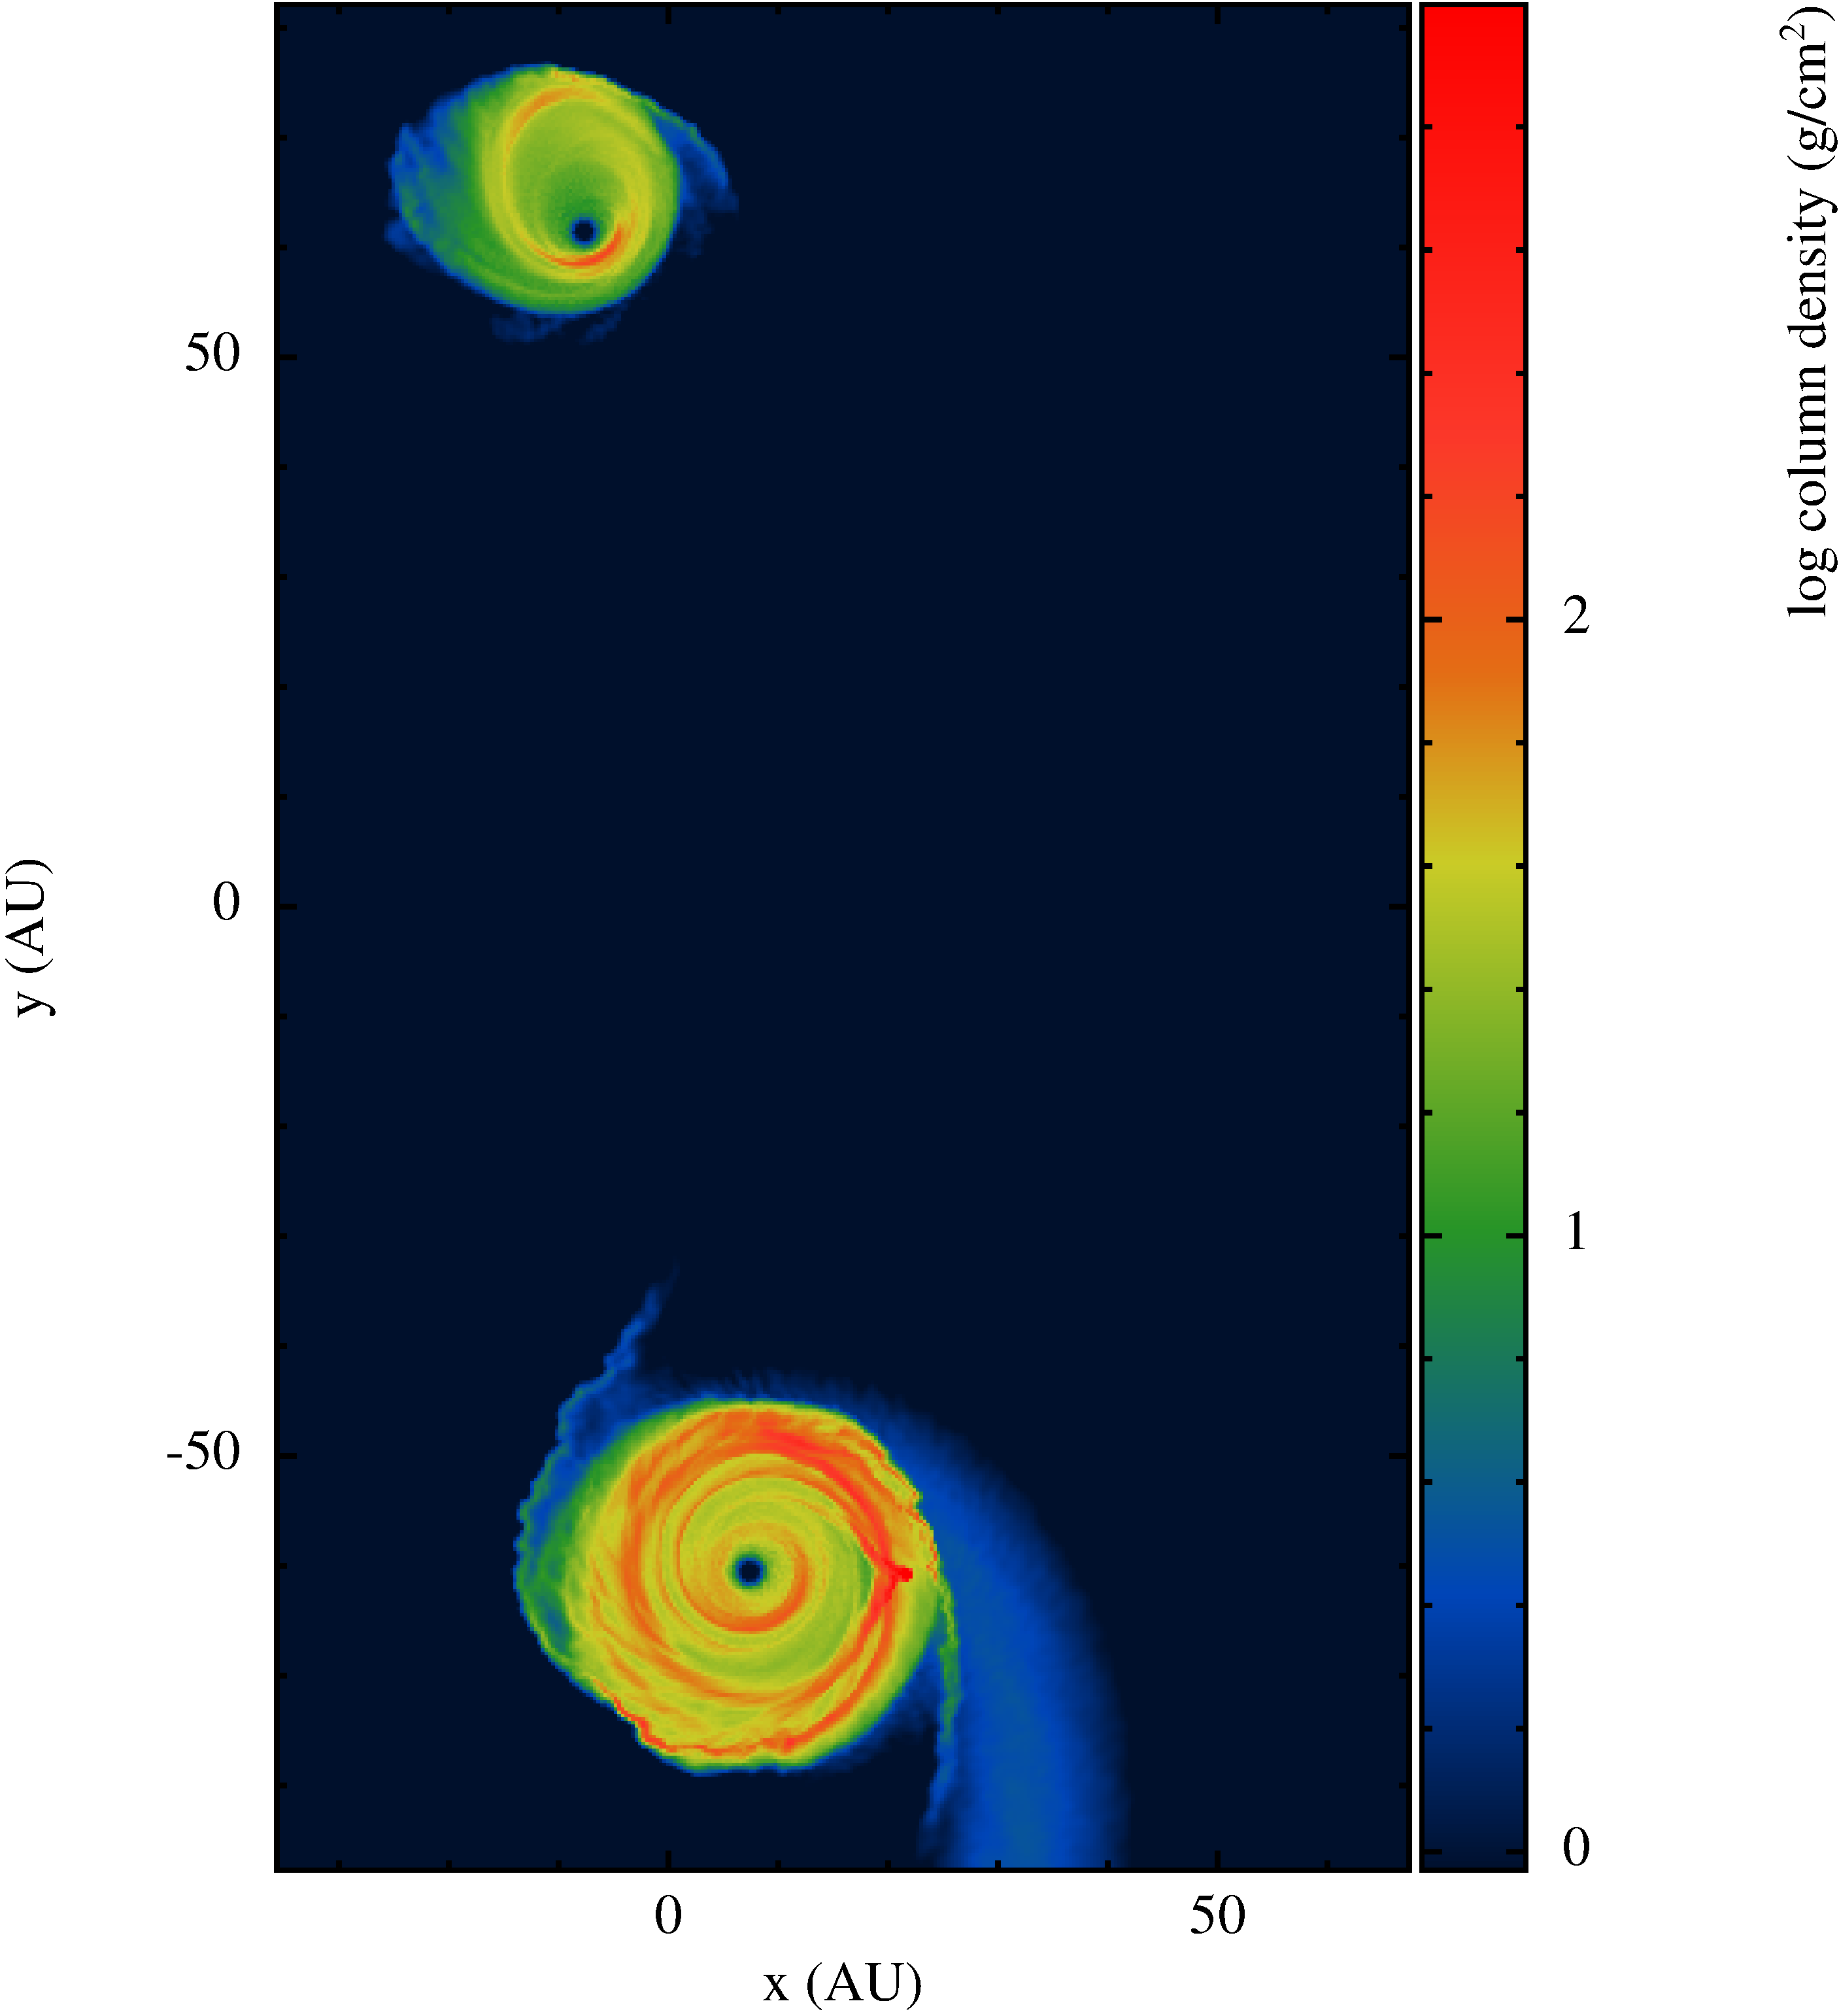
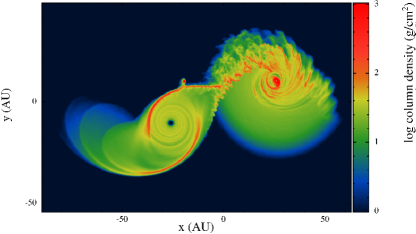
We first analyze the models where the disks are mutually inclined of i.e. . In two cases with this configuration we test the dependence on the periapse distance of the hyperbolic orbit on the evolution of the disks and planet orbit (cases a and b). In the third case c we incline also the hyperbolic trajectory setting . This last case is more general in terms of geometric configuration and we will adopt it as reference case comparing its outcome to the other two. In Fig. 2 the evolution of the disks and planet are shown at different times for case c. At the minimum distance (first two plots) the disks begin to interact becoming highly eccentric and strongly warped. The outer edge of the disk around the passing star overlaps close to the center with that of the primary star. At subsequent times, the disks are very distorted, and tidal tails are launched causing a significant mass exchange. It is noteworthy that in the third plot the disk around the passing star (secondary star) appears very eccentric, but this is a perspective effect. When the integrated density is computed, the inclined disk is projected on the – plane and so it appears more eccentric due to its inclination. About yr after the flyby, the primary disk is returned to a quiet state and the planet has carved a new gap in the disk, as illustrated in Fig. 3.
4.1 Evolution of the planet orbit
The planet in case c, which appears in the plots of Fig. 2 and Fig. 3 as a local overdensity, is moved on an inclined and eccentric orbit after the stellar flyby due to the gravitational pull of the passing star. However, the subsequent interaction with the disk damps both the eccentricity and inclination and, on a short timescale, the planet is driven back on an almost circular orbit not inclined respect to the disk plane. All the effects of the stellar flyby have been erased apart from a shift in semimajor axis. However, the final planet orbit may be slightly inclined respect to the equatorial plane of the primary star since the disk, after a warped phase, relaxes into an inclined configuration (see Fig. 3, bottom plot). The planet, tidally interacting with the disk, is dragged back not to the star equatorial plane but to the disk median plane, slightly tilted, after the flyby, respect to the star equatorial plane.
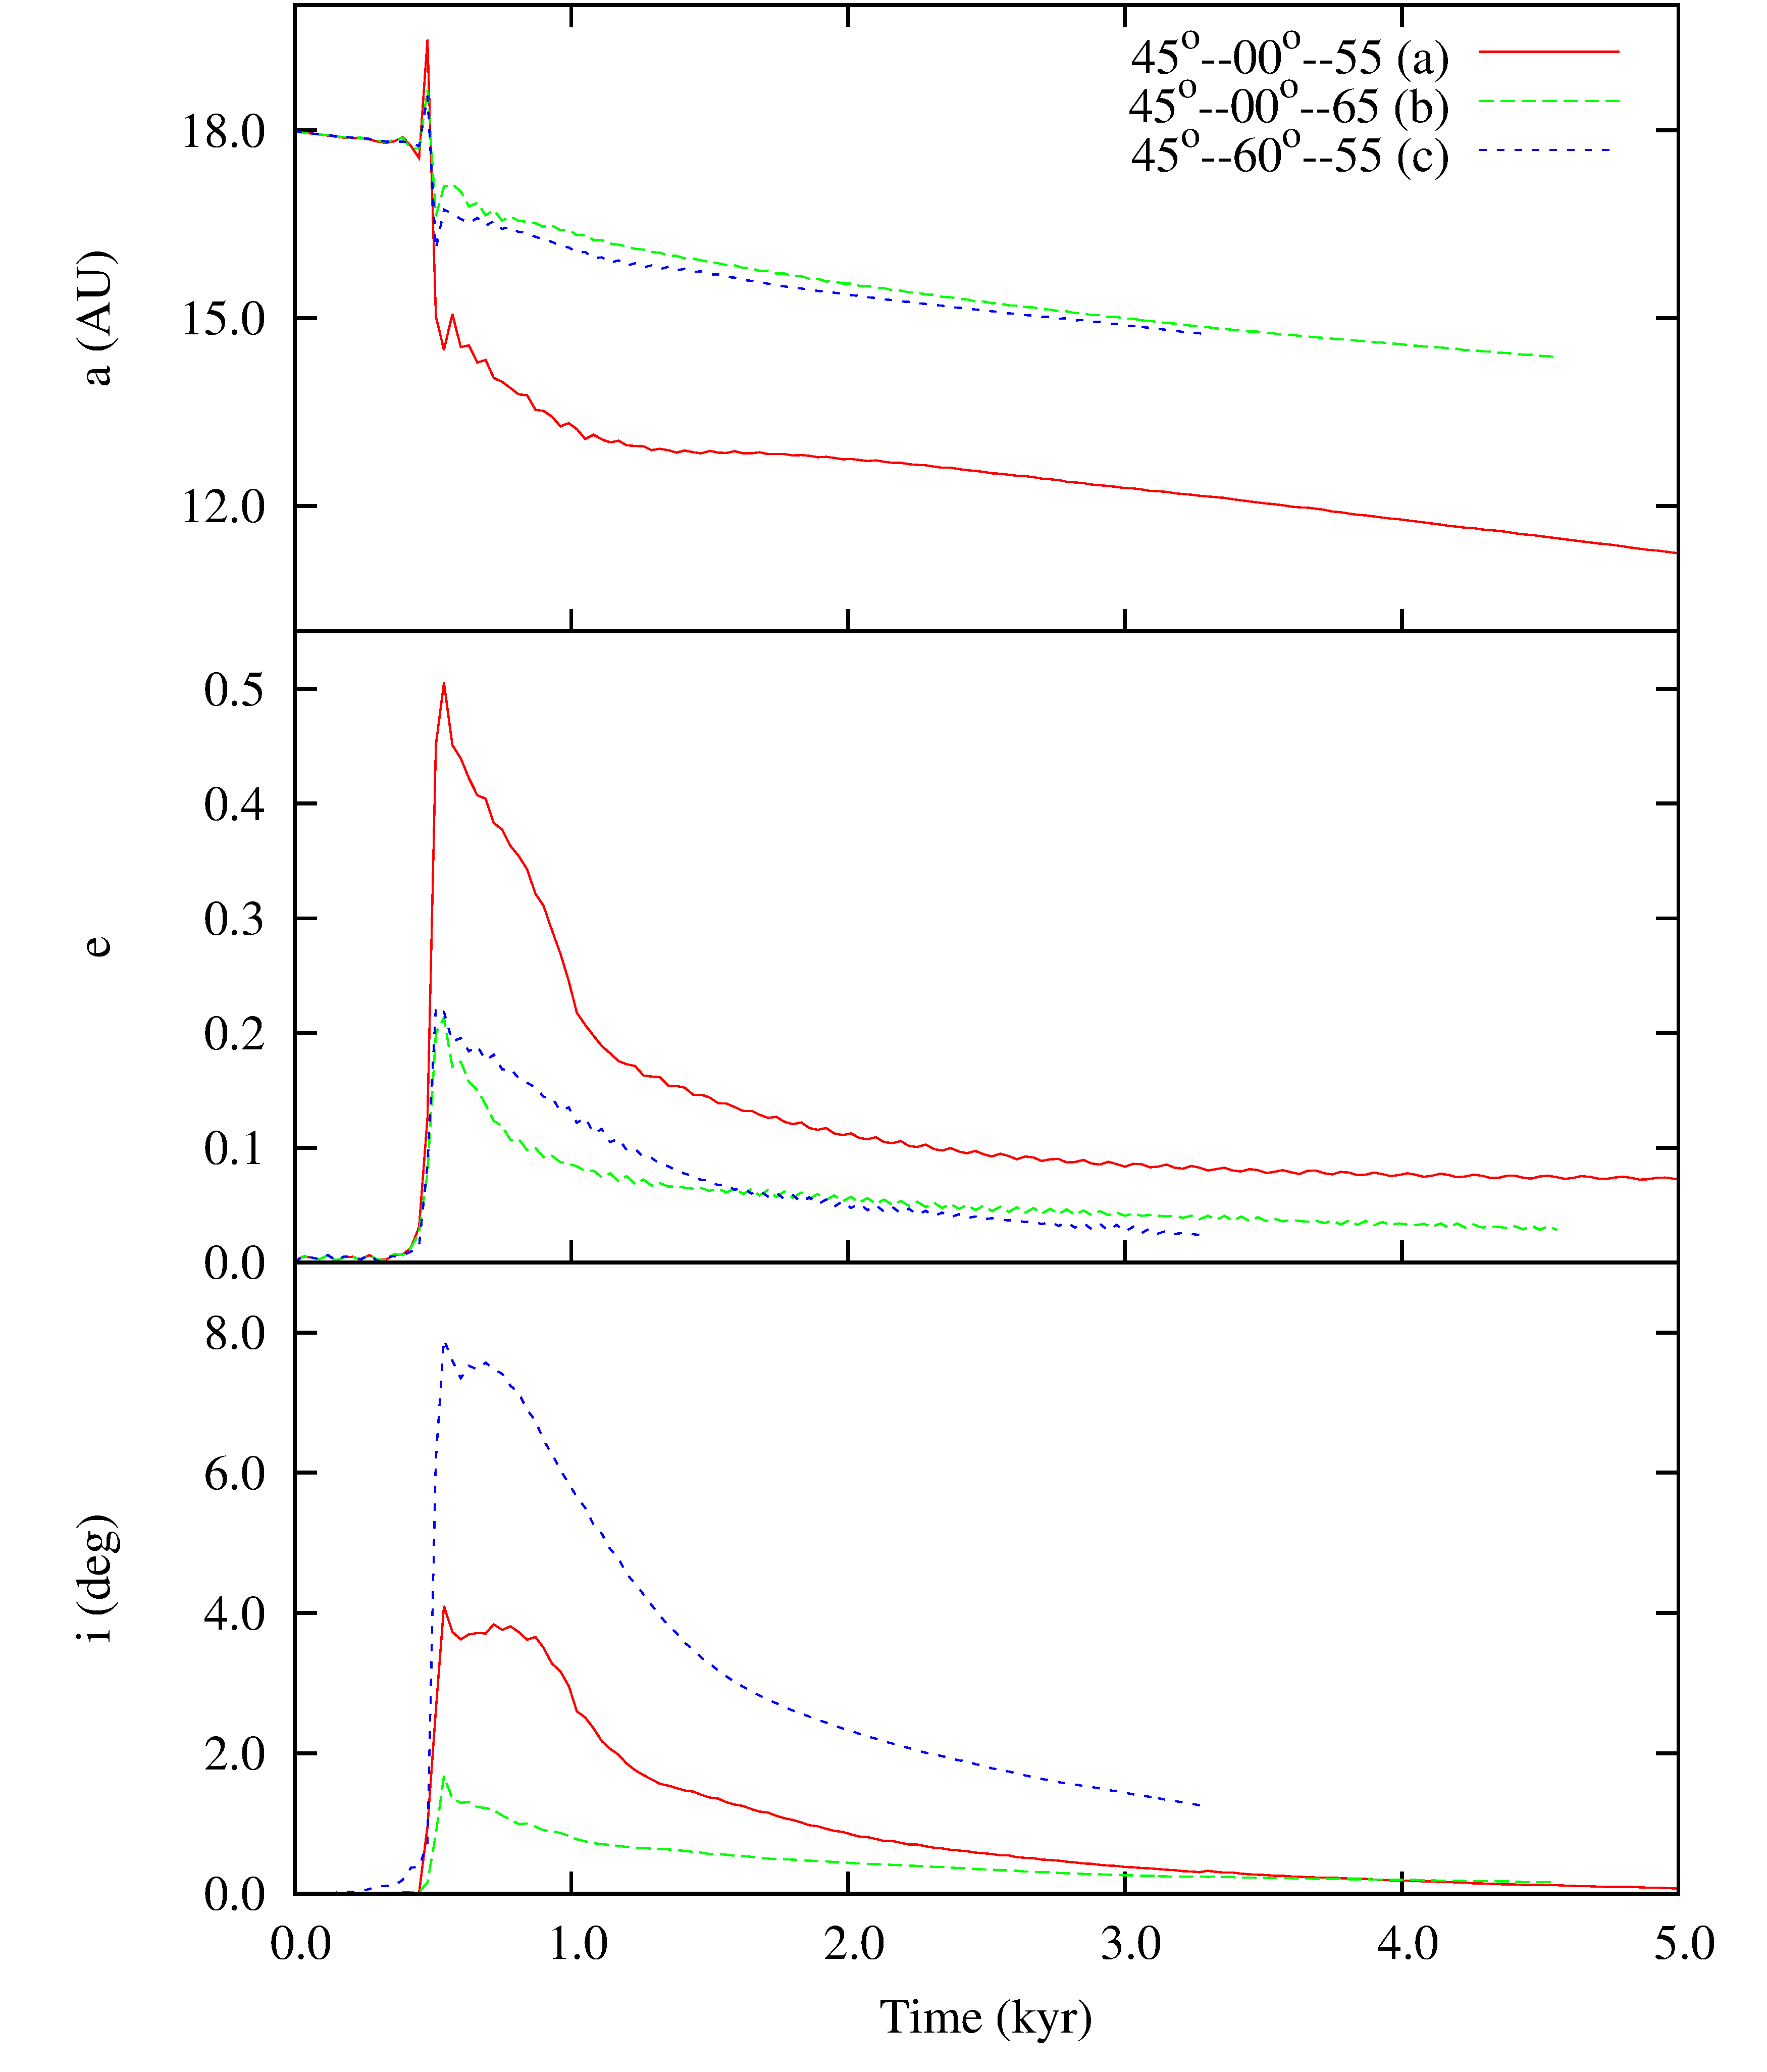
In Fig. 4 we show the time evolution of the orbital parameters of the planet in the simulations a, b, and c. The semimajor axis, after a jump caused by the stellar encounter, decreases with time due to the tidal interaction with the disk. A new gap around its orbit is forming, as shown in Fig. 3 (top plot) for the case c ( and ), but it is not yet deep enough to cause the slow type I migration which will probably start at later times. The delay is also due to the initially inclined orbit of the planet respect to the disk which slows down the gap carving.
The eccentricity pumped up by the stellar flyby is quickly damped when the second star departs from the primary after the encounter. This is illustrated in Fig. 4 middle panel. In the most perturbed configuration (case a) the eccentricity grows up to and is quickly reduced to in less than yr. After this initial phase, the damping is slower occurring at a rate of about yr-1 leading to a full damping on a timescale, in the worst case, of a few yr. In cases b and c the initial eccentricity excitation is of the same order of magnitude. The inclination of the hyperbolic orbit of case c possibly reduces the strength of the passing star perturbations on the planet eccentricity as it does the larger flyby minimum distance in case b. However, the damping appears to be faster in case c where the final eccentricity, after yr from the flyby, is only .
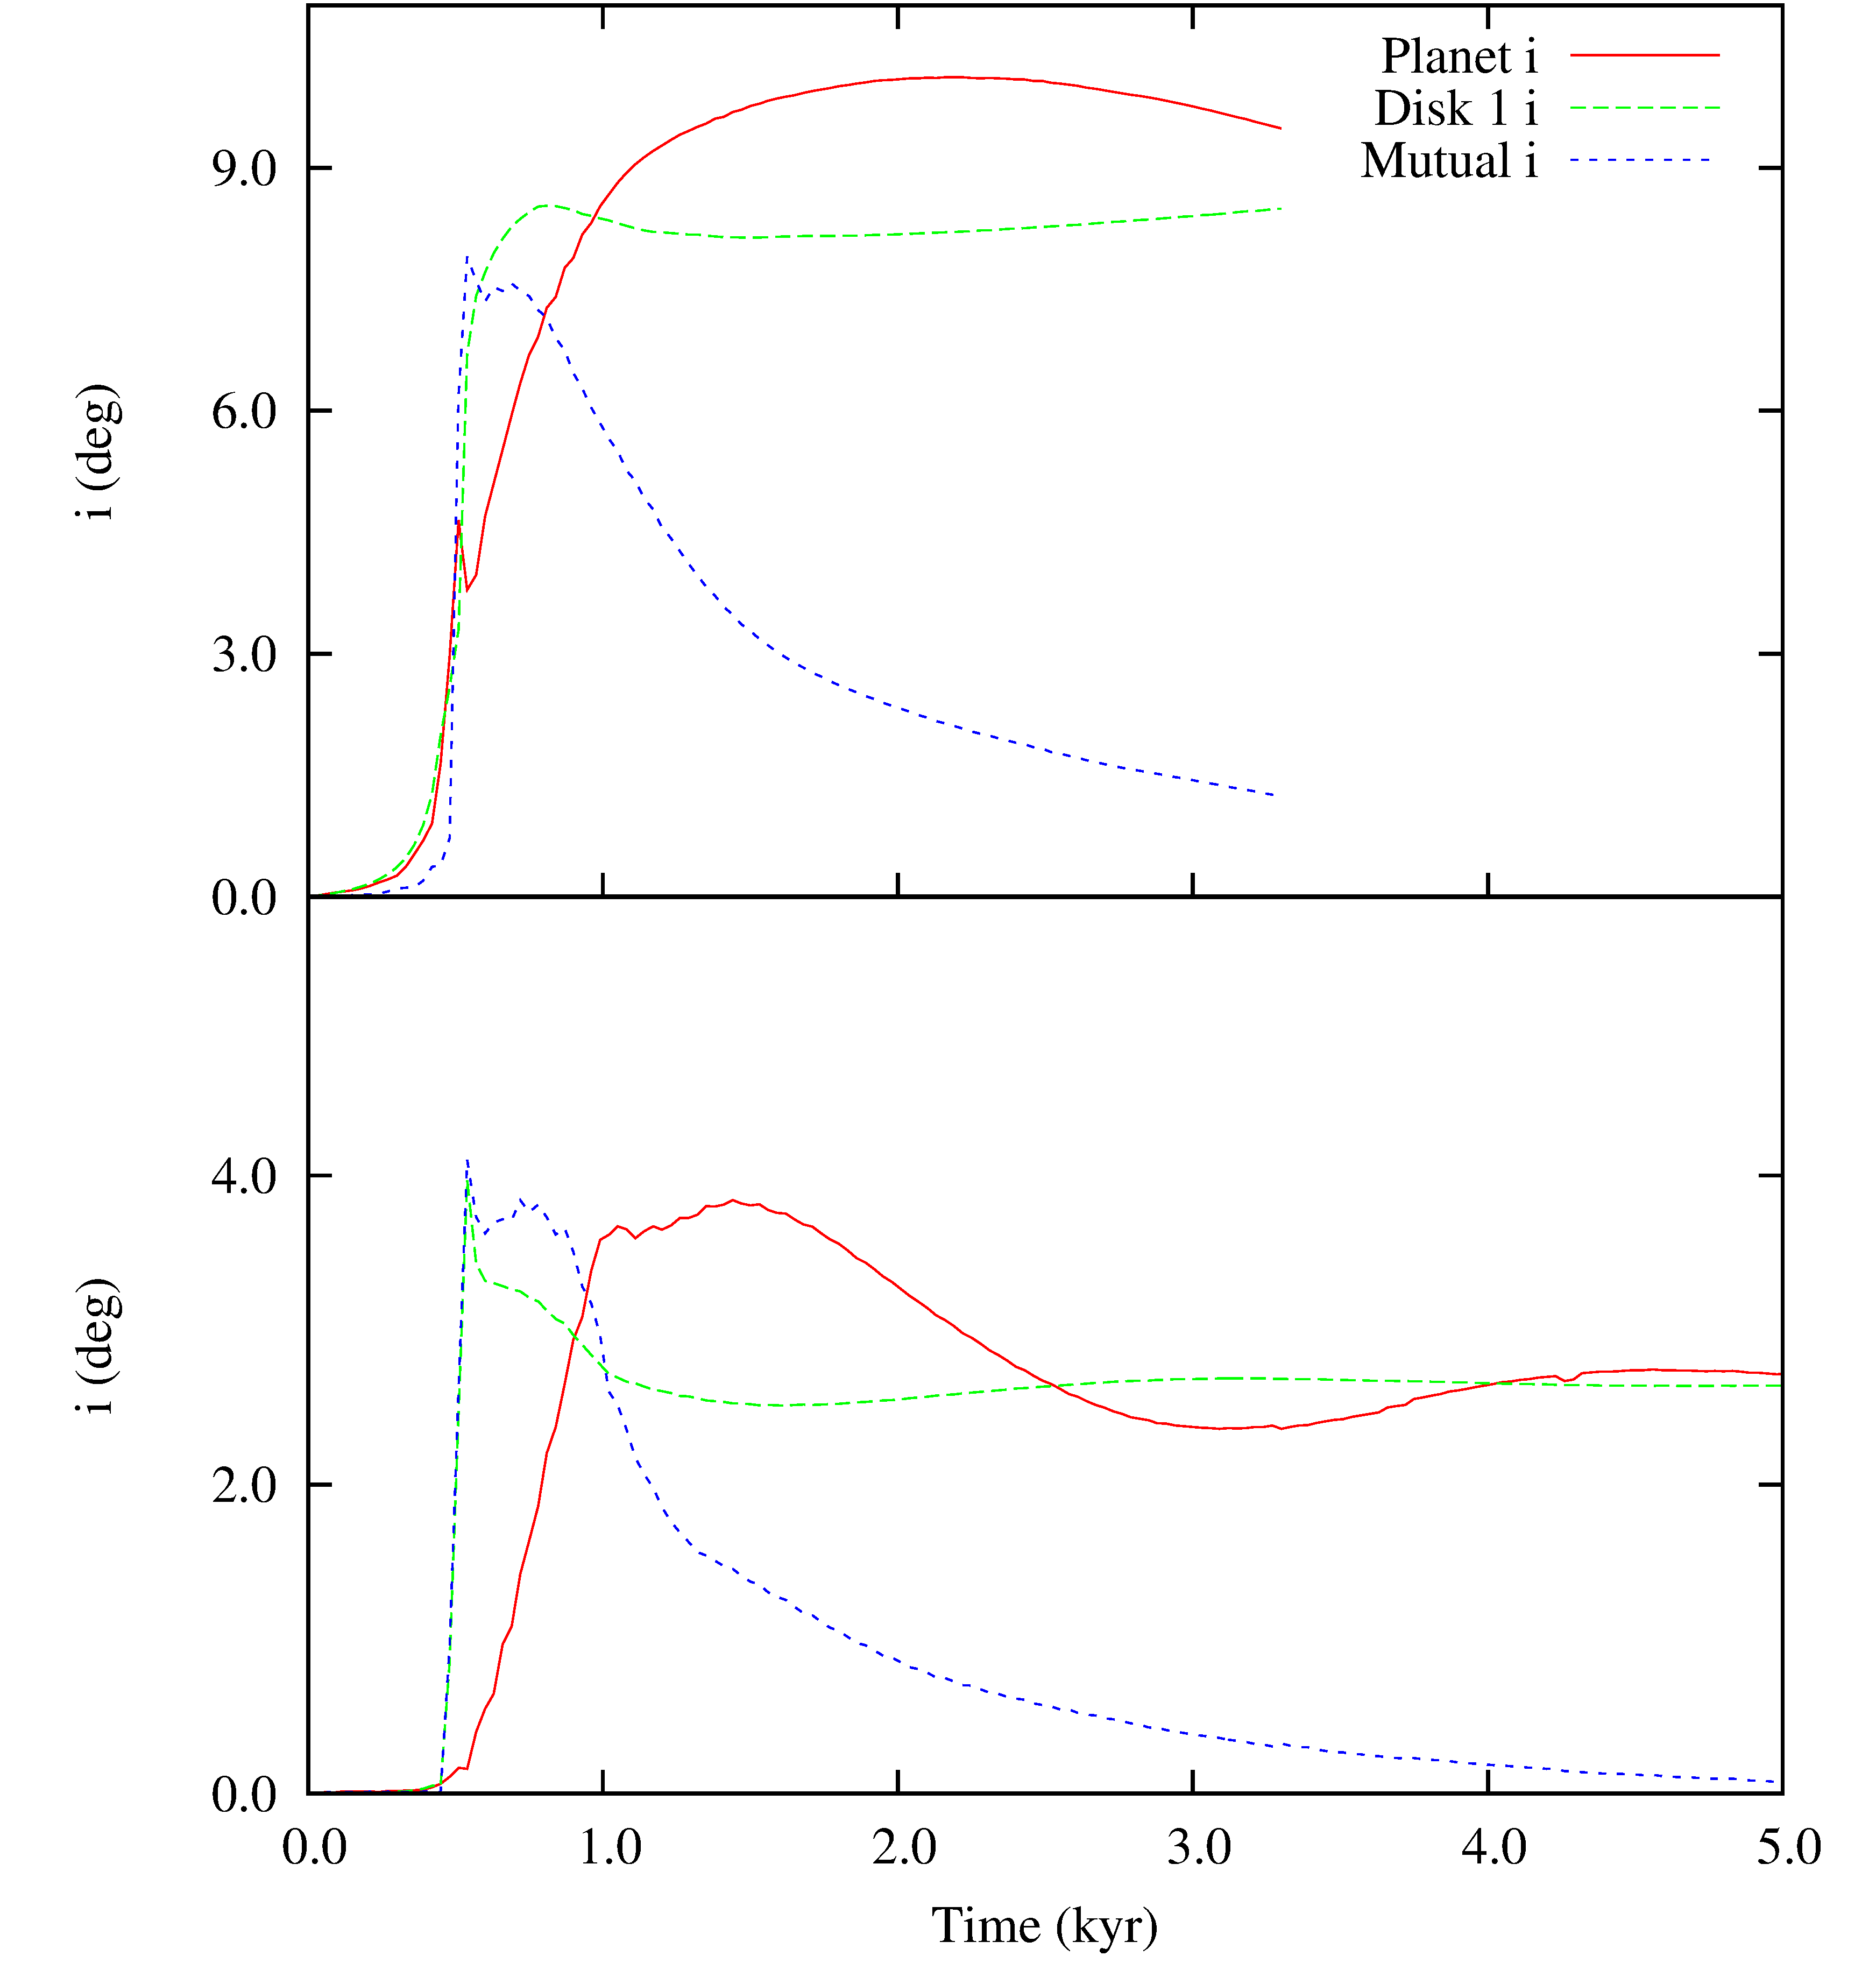
In case c the inclination of the planet respect to the equatorial plane of its host star is excited during the flyby up to about . After the stellar encounter also the disk is inclined respect to its initial plane and its inclination is about as shown in Fig. 5, top plot. The gravitational interaction between the planet and disk drives the planet back into the disk and its inclination is slowly brought to the same value of that of the disk. The mutual inclination between the planet and the disk decreases smoothly with time to a low value of about when the simulation was stopped after kyr. In Fig. 5, bottom plot, we show the evolution of the disk and planet inclinations in the case a. The orbit of the planet is not excited in inclination by the stellar flyby since . However, the disk around the primary star is first warped and then it settles down to an inclination of about . The planet inclination grows until the mutual inclination between planet and disk is negligible.
The outcome of these models confirms that the presence of the disk leads to a fast damping of the eccentricity and inclination due to the stellar flyby, erasing any trace of the event in the trajectory of the planet. Such an event might be recorded in the inclination of the disk (and then of the planet) respect to the equatorial plane of the star but the expected tilting would be very small. It could accelerate the inward migration of the planet by restarting type I migration after the stellar flyby when the gap is erased but soon a new gap would be cleared and type II migration restored.
5 Coplanar cases d, e, and f
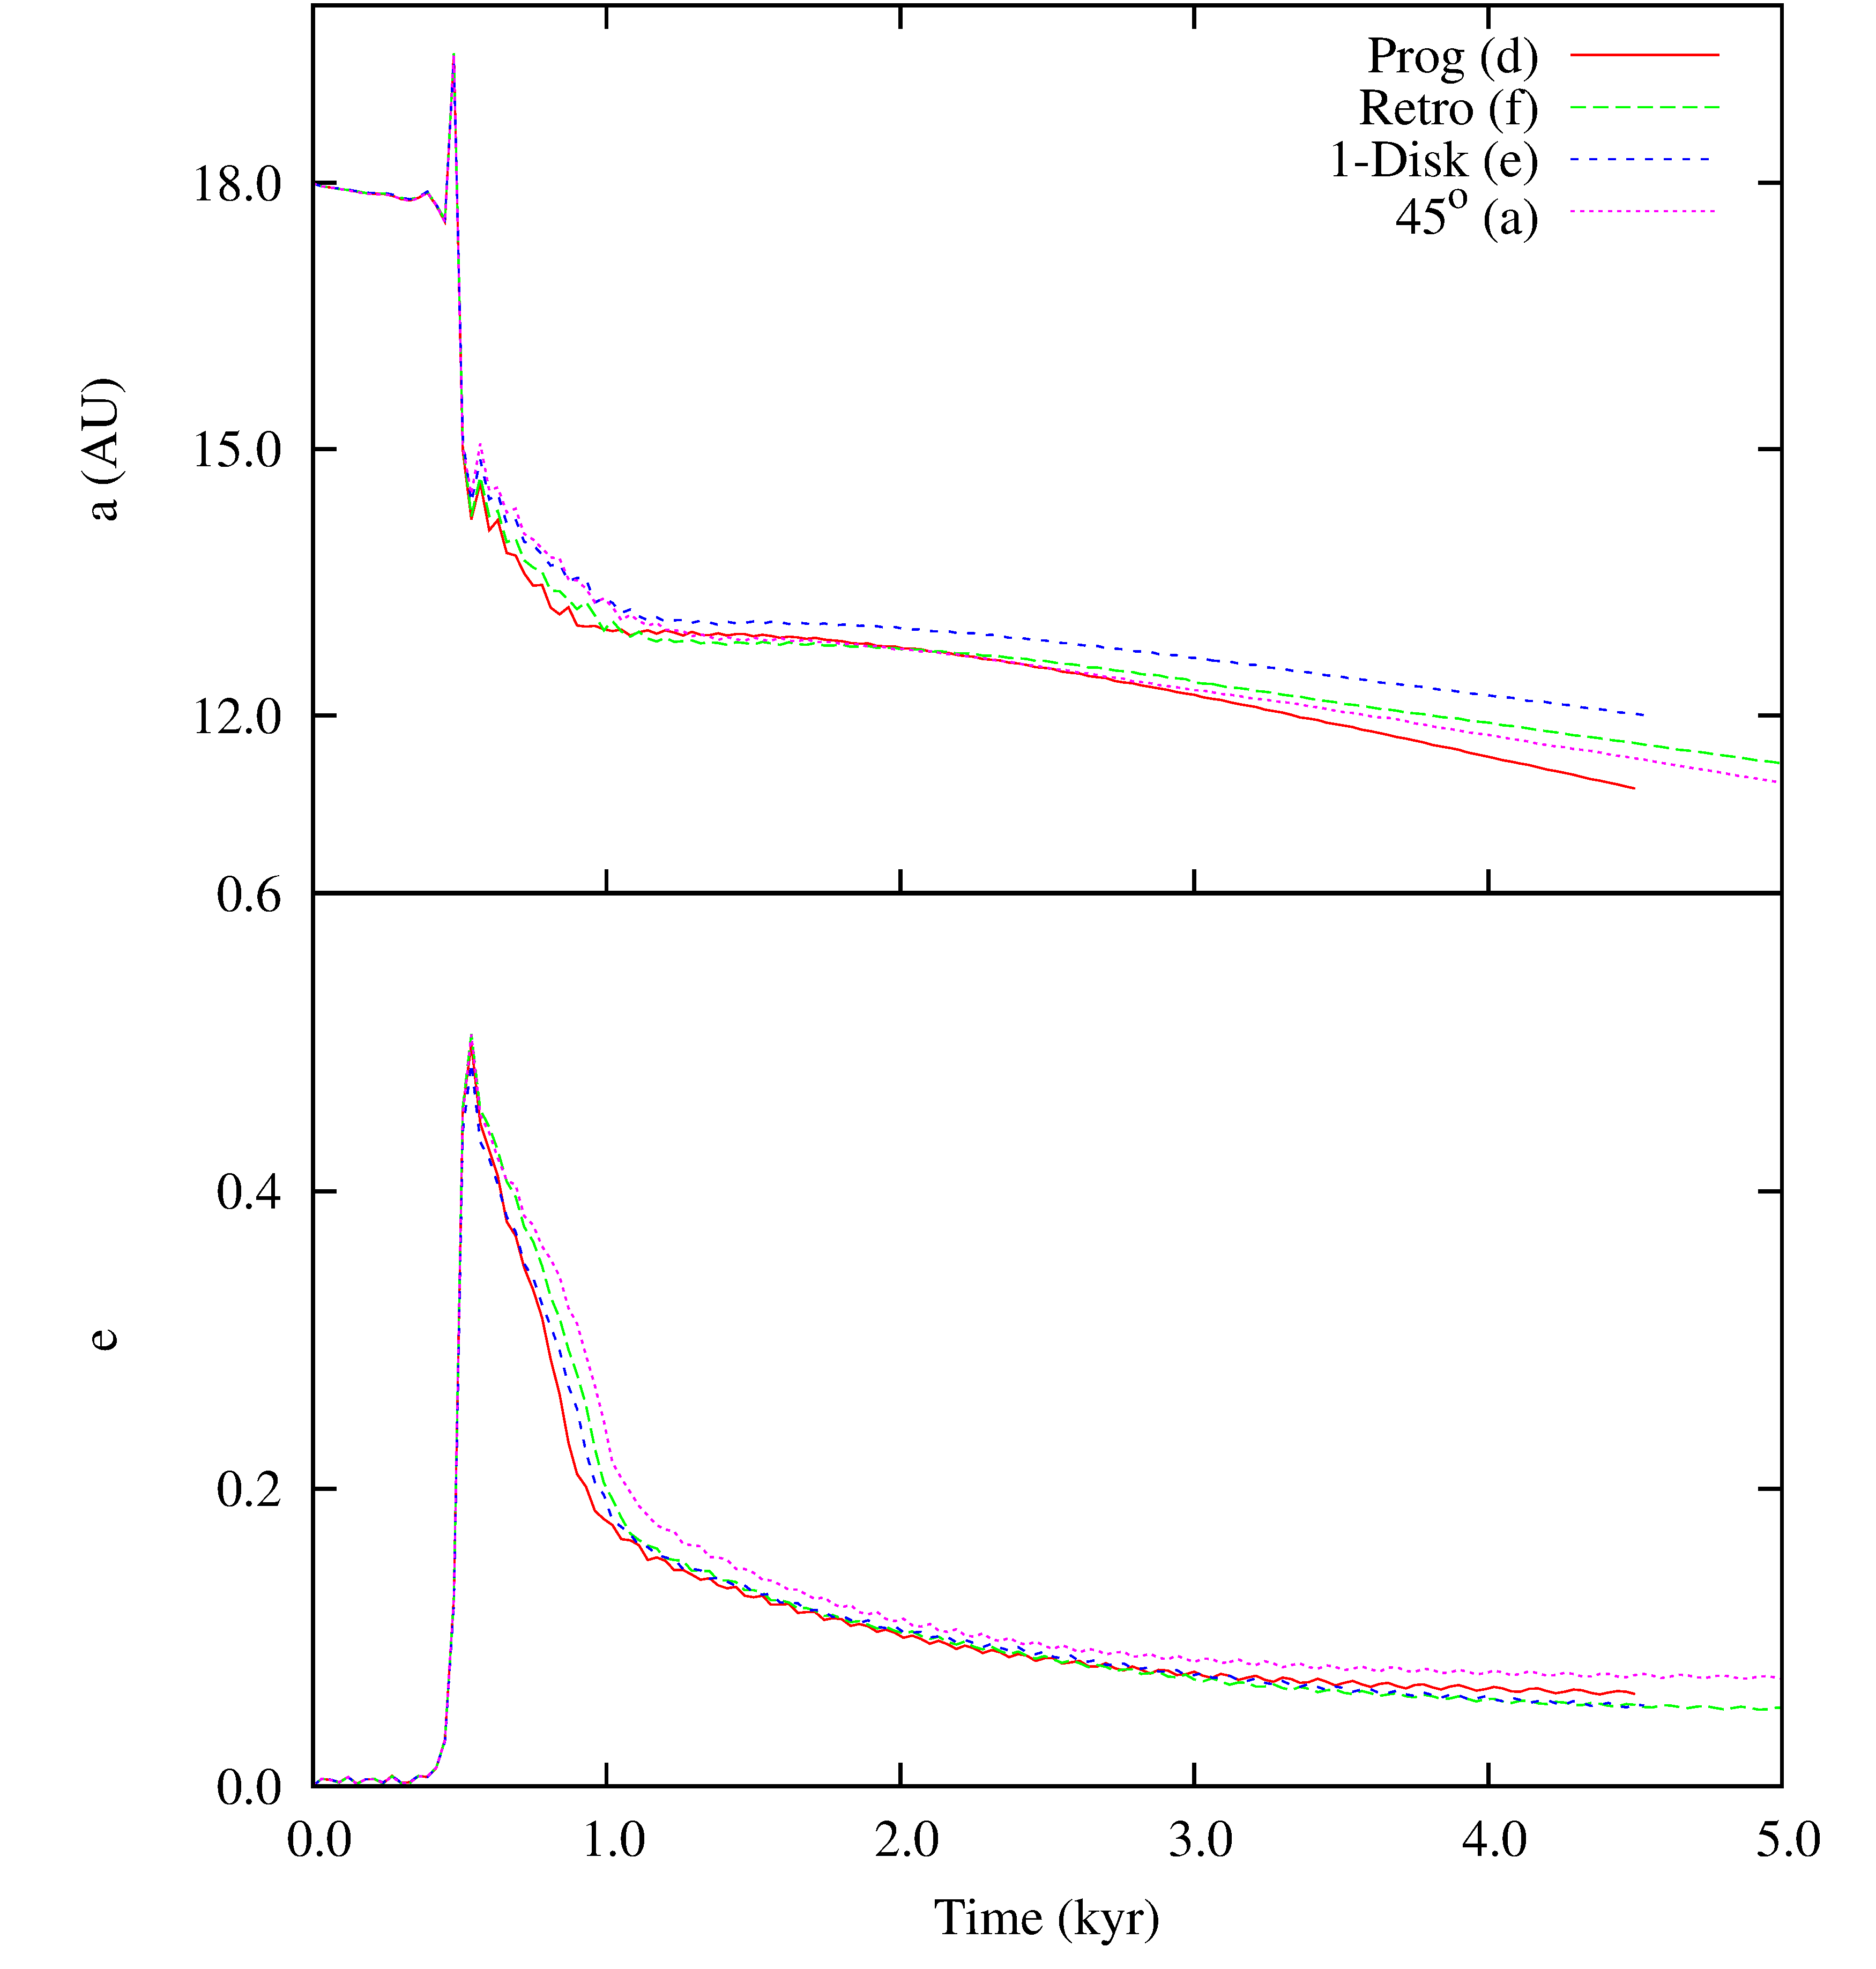
These models assume a coplanar initial configuration for the disks and for the hyperbolic orbit of the passing star, i.e. and . They are the analogous of 2D models except that the disks are computed in 3D. We do not have changes in inclination and we concentrate only on the semimajor axis and eccentricity variations. As illustrated in Fig. 6, the eccentricity and semimajor axis jumps in the three cases d, e, and f are about the same. This confirms that the gravitational perturbations of the passing star dominates the dynamical evolution of the planet during the flyby. The subsequent damping is not significantly influenced by the different evolution and mass loss of the disk (see Tab. 1) but it is slightly faster compared to that of case a (, ), shown as a reference in Fig. 6. This is possibly due to the disk–planet mutual inclination that, in case a, reduces the tidal interaction.
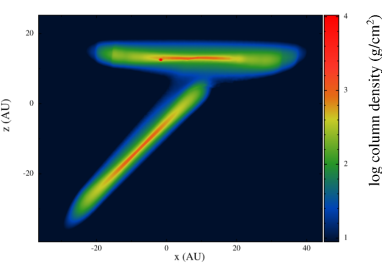
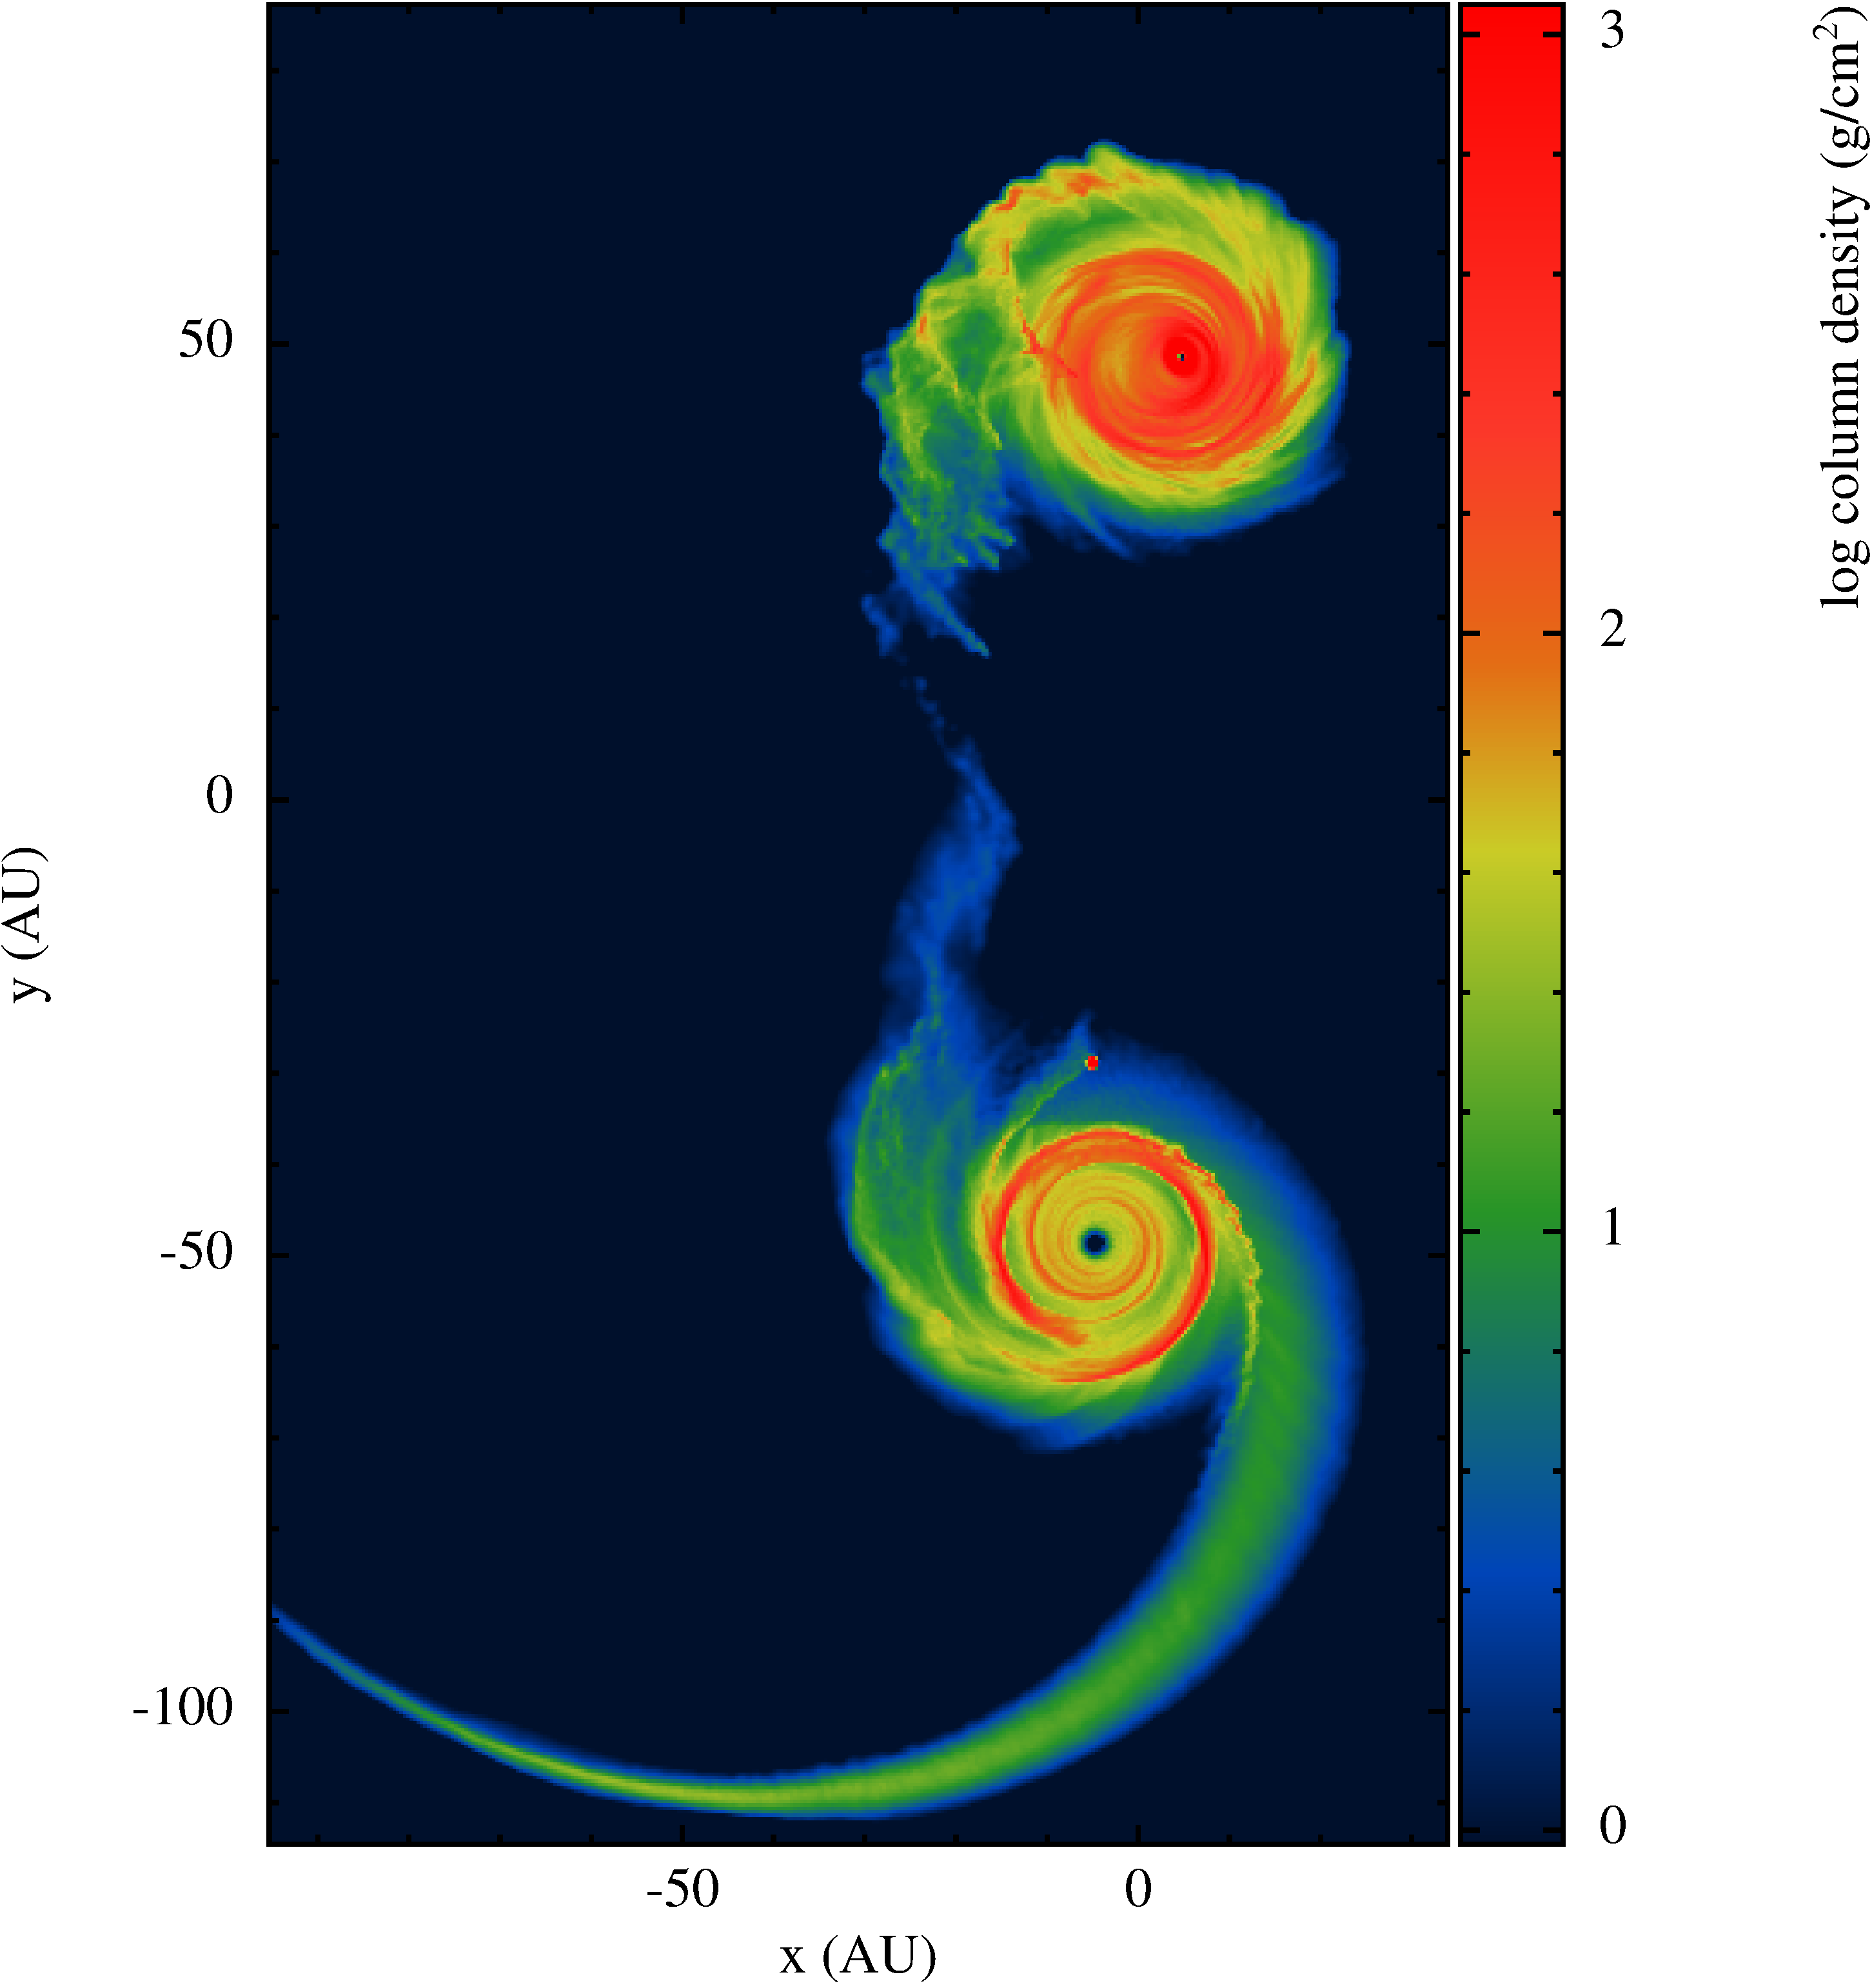
We considered the prograde-retrograde encountering configuration as an extreme case with one disk (that hosting the planet) rotating in the direction of the encounter orbit, and the other rotating against the encounter. The star is on a hyperbolic orbit coplanar to both disks. The evolution of the disks is not symmetric since for one disk (the primary) the secondary star is on a prograde trajectory while for the second disk the primary star is seen as moving on a retrograde trajectory. In Fig. 10 the disk integrated column density is shown shortly after the stellar flyby (top panel) and years later (bottom panel). The two disks are not perturbed in a symmetric way, as for the coplanar prograde case, and only the primary shows a consistent mass loss along the trailing tidal wave. The disk around the secondary passing star does not become significantly elliptic and it does not develop tidal waves before the encounter. It appears to be less perturbed by the primary star gravity and this is in agreement with the findings of Hall et al. (1996) claiming that the angular momentum transfer between a perturber and a disk in a retrograde configuration is smaller. A similar effect was also observed in Forgan & Rice (2009) for more massive disks. At the pericenter of the flyby the two disks come in contact and mass is transferred from one to the other. As it can be noted in Fig. 10, the primary disk shows the usual spiral structure with the trailing arm extending into the secondary disk. Due to the direct interaction between the disks, the upper part of the secondary disk (retrograde respect to the primary star) is strongly distorted while the bottom part of the disk is almost circular and unperturbed. According to Tab. 1 the primary disk loses approximately of its mass while the secondary disk gains of its initial mass.
In spite of the strong differences in the disk evolution between the prograde and retrograde cases, the orbital evolution of the planet is not significantly different. This reinforces the idea that the tidal damping of the planet eccentricity is a robust mechanism that does not depend significantly on the disk evolution. Once the perturbing effects of the star flyby are passed, and this occurs on a short timescale, the disk relaxes and drives the planet back to a circular non–inclined orbit.
5.1 Mass exchanged by disks or lost to infinity
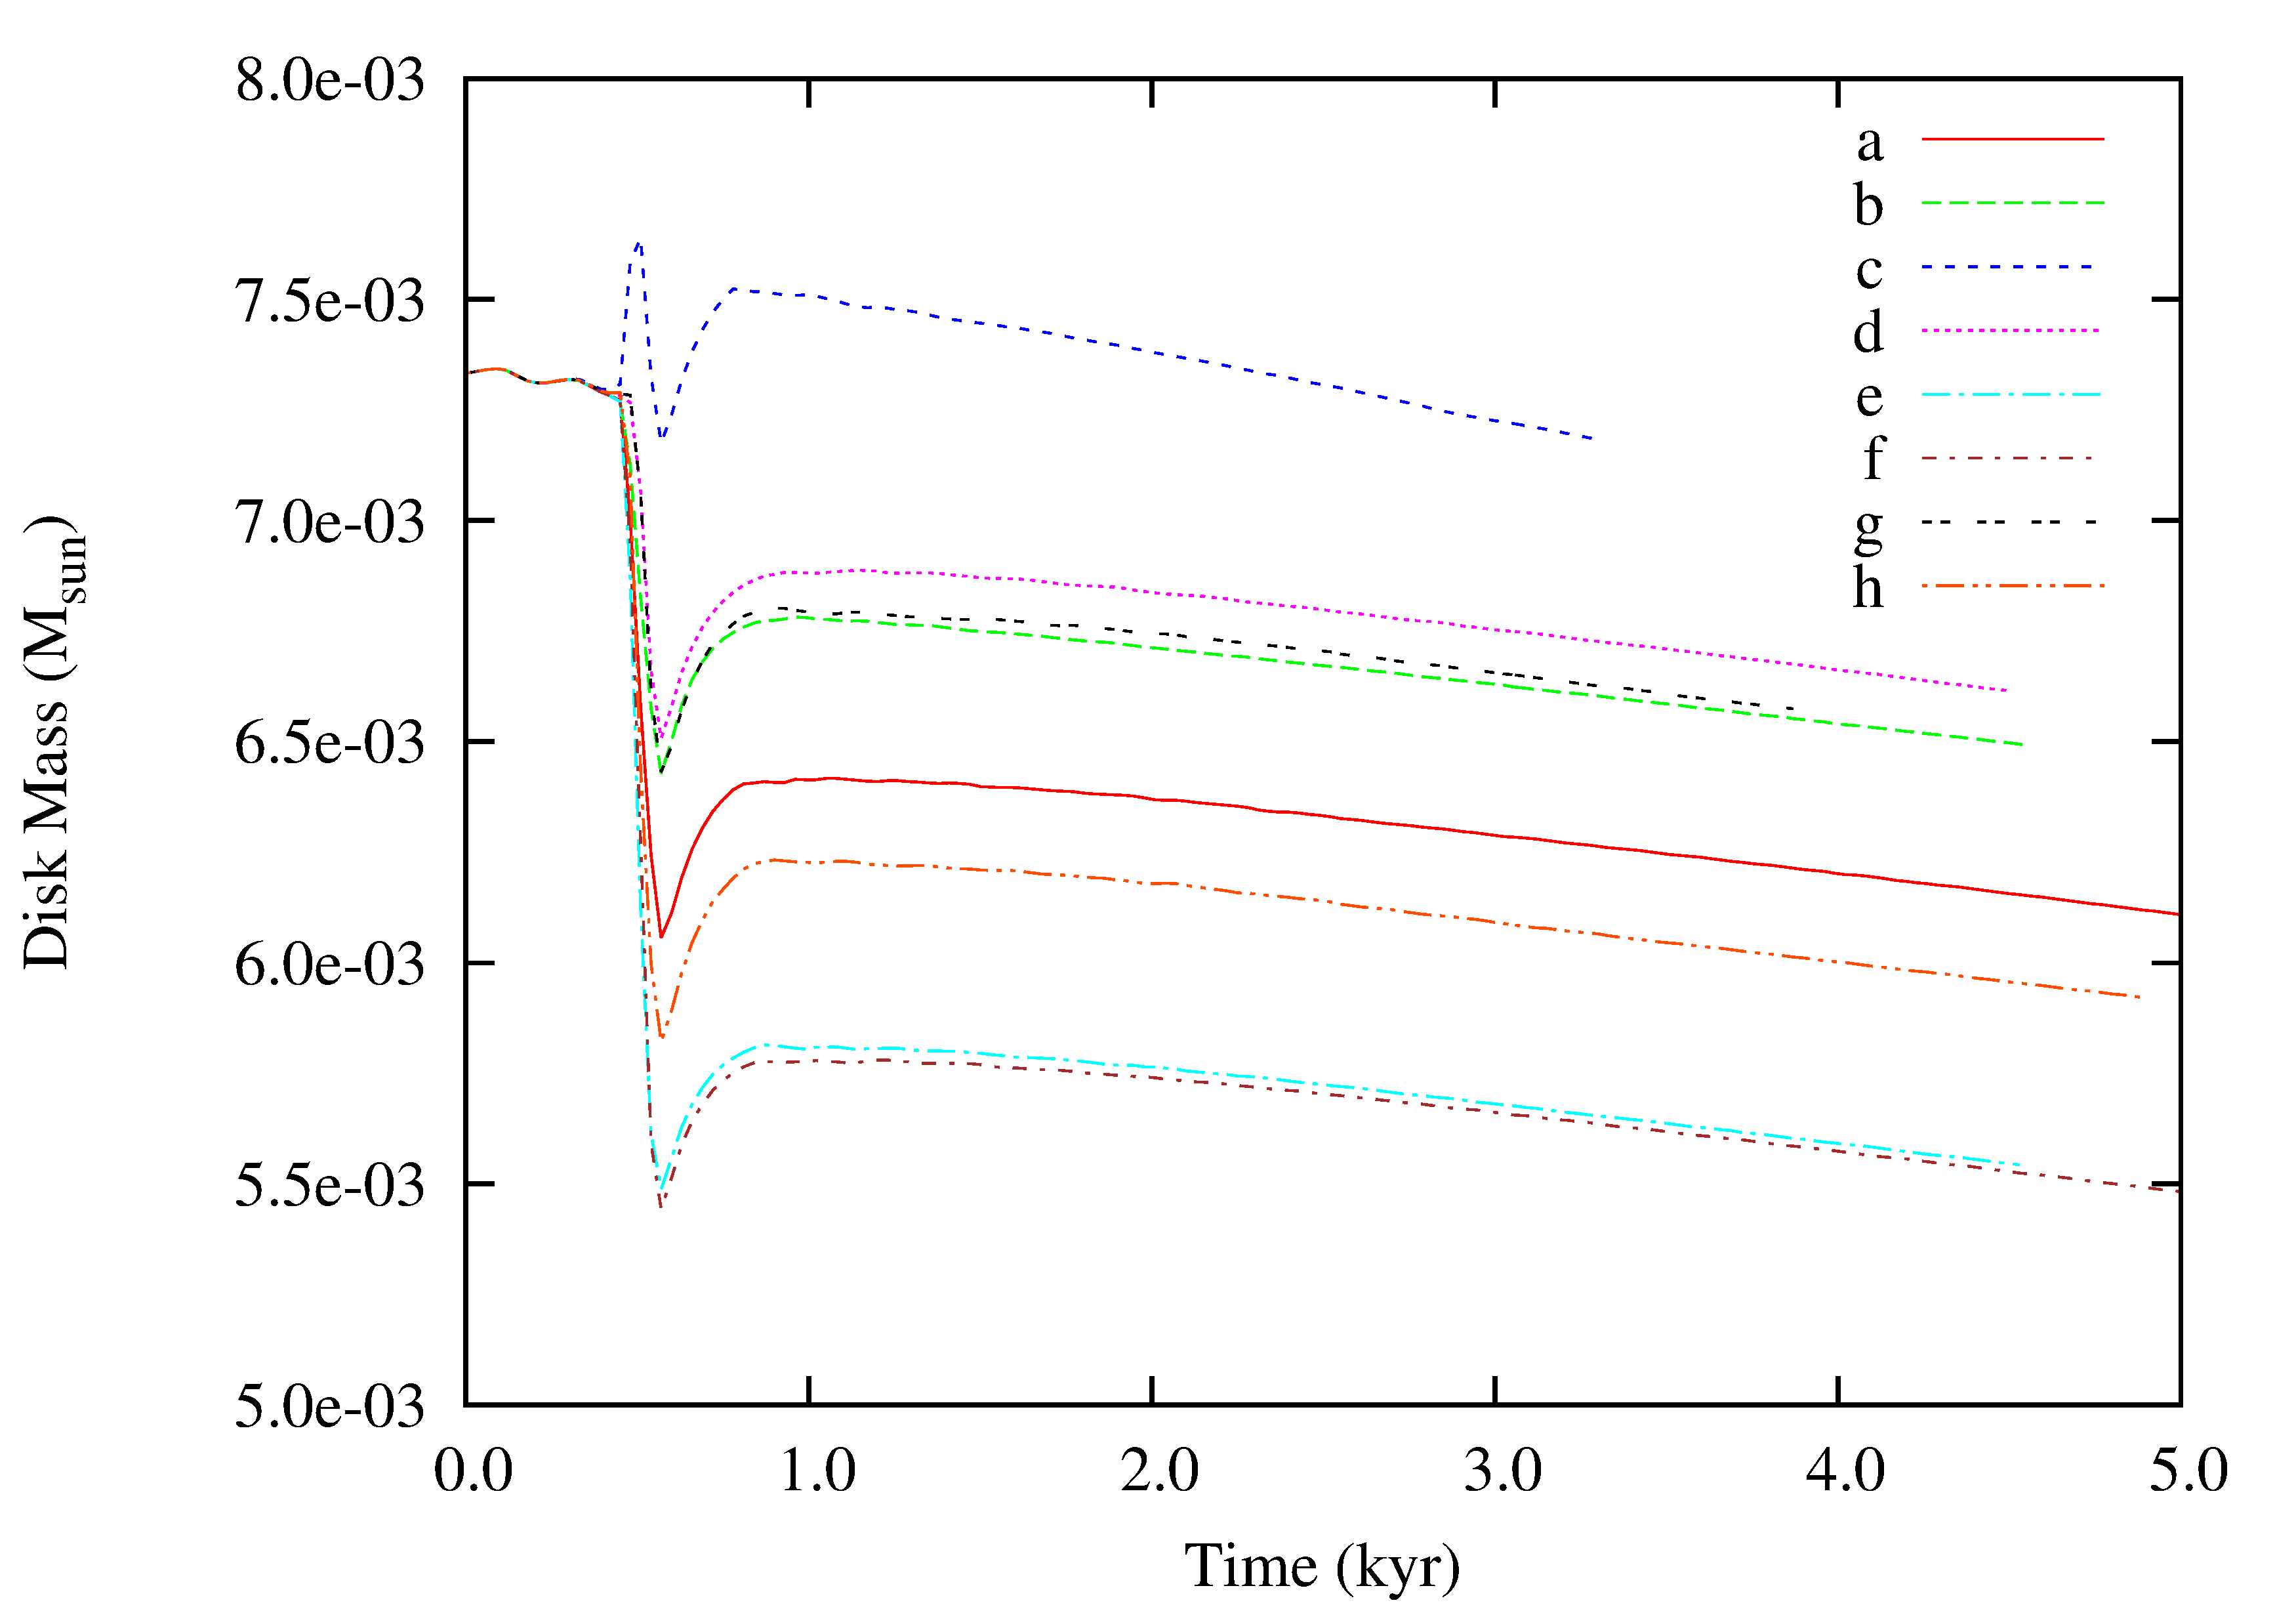
A significant difference between the 2D models of Marzari & Picogna (2013) and the 3D results presented here is the amount of mass lost by the disk with planet during the encounter. In Marzari & Picogna (2013) the primary disk retained about half of its initial mass at the end of the simulation while in the 3D cases here presented the fraction of mass loss, summarized for all models in Tab. 1, is significantly smaller and it strongly depends on the encounter geometry, as shown in Fig.8. This difference may be ascribed to the following reasons.
-
•
In previous 2D models only one disk was included while in the present models we consider 2 disks. The presence of the disk around the secondary star has important consequences for the evolution of the system since a consistent fraction of the mass lost during the encounter by the disk around the primary is replaced by mass stripped from the disk of the secondary. According to Tab. 1 up to of the disk initial mass can be exchanged between the two disks. Explicative in this context is the outcome of model e. In Fig.9 we show the density distribution after the stellar encounter illustrating how, during the stellar flyby, the second star, initially without its own disk, strips material from the primary. The new captured disk has a mass with mass equal to of the initial disk mass of the primary (see Tab. 1). This proves that a large amount of mass can be transferred from one disk to the other, an effect not observed in Marzari & Picogna (2013) because the secondary star was out of the computational grid.
-
•
In 3D the disk evolution, and then the mass loss, depends also on the behaviour along the vertical direction. This leads to a lower mass loss in 3D models respect to 2D ones as illustrated in Fig.7 where we compare the outcome of the 3D model e with a 2D simulation, performed with the SPH code, having the same initial physical parameters and profiles of model e. The mass loss is slightly higher in the 2D model just after the stellar flyby. However, the comparison also suggests that changing the dimensions of the simulations has less impact on the mass loss than the existence of a secondary disk. As a consequence, the mass loss difference between 2D and 3D models is mainly due to the mass exchange between the two circumstellar disks. Note that the apparent increase of the disk mass after it hit the minimum is fictitious and it is due to the difficulty of defining the disk borders during the encounter when the shape of the disk is very elongated and asymmetrical.
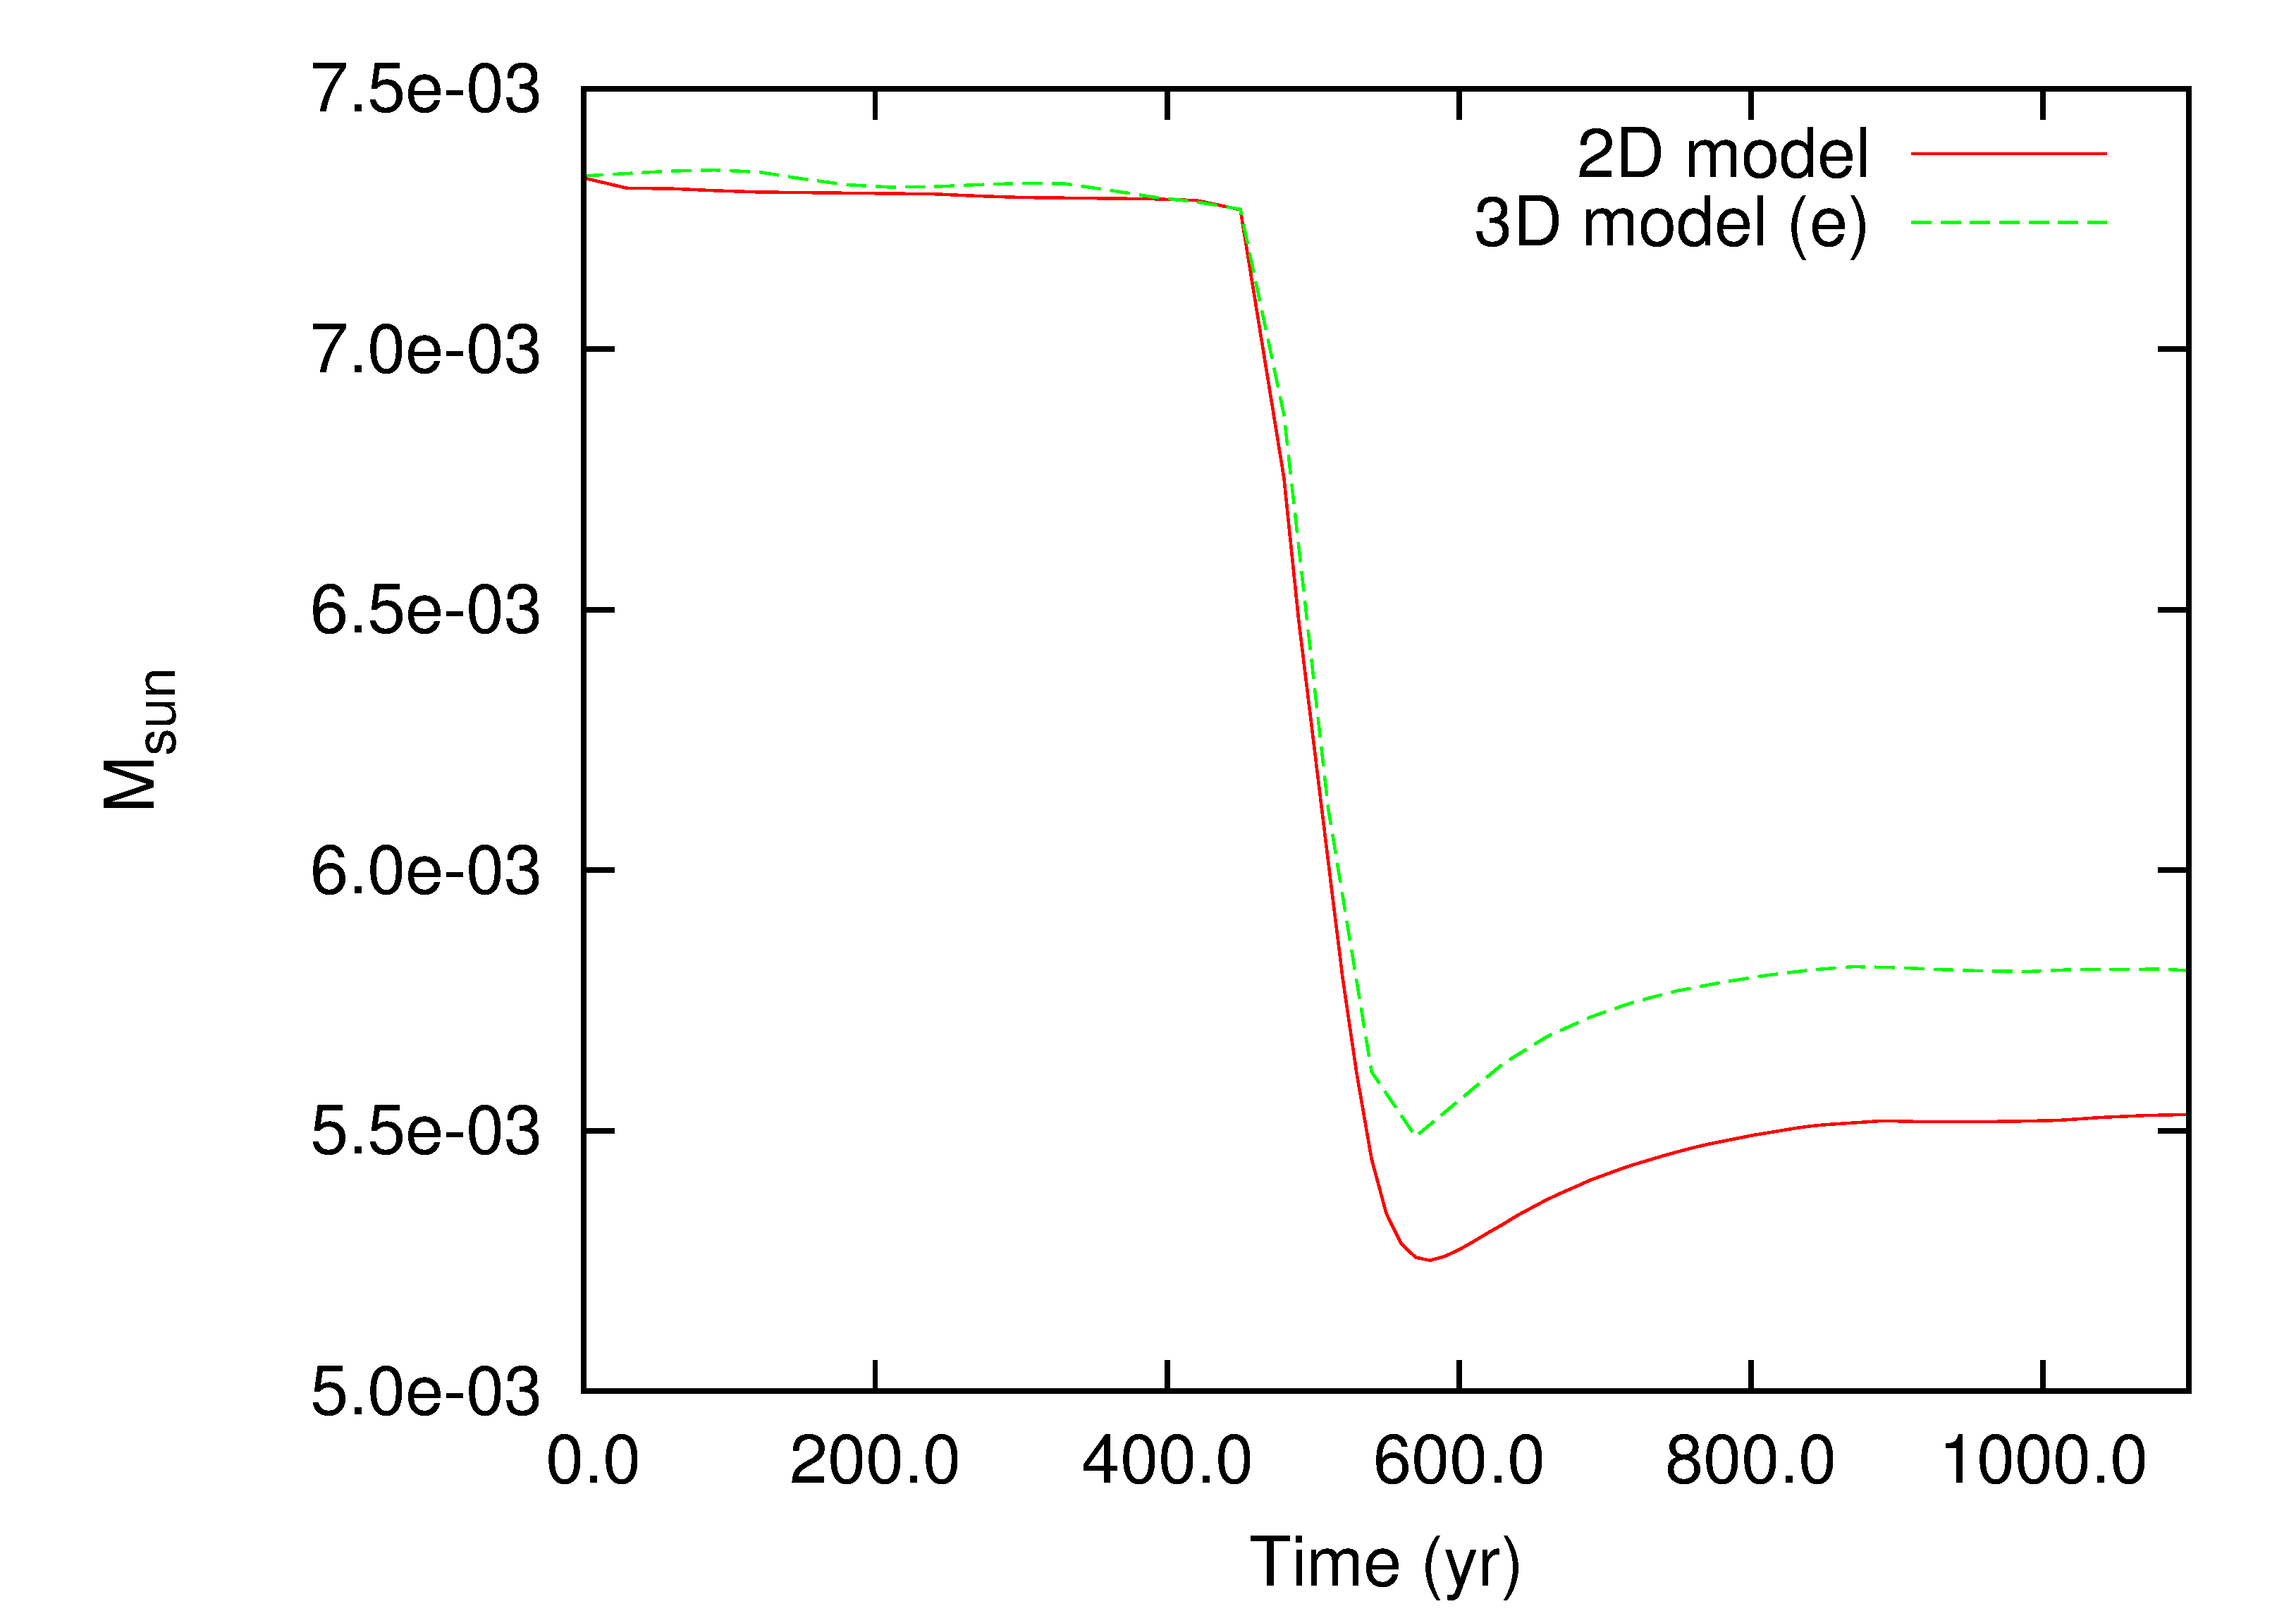
Figure 7: Disk mass evolution in the 3D model e compared to a 2D model with identical initial parameters and integrated with the same SPH code VINE. The mass loss during the encounter is higher in the 2D model. -
•
Previously published 2D simulations were performed with a grid code having a limited spatial domain centered on the primary star. Mass exiting the grid domain was lost by the system. In the models shown here an SPH code is used and there are no boundaries for the disks. As a consequence, gas excited on highly eccentric trajectories during the stellar flyby is allowed to fall back on the disk at later times while in the simulations with the grid code it was lost. This can be noted also in Fig. 8 where the mass of the disk is computed adding up all the mass moving within AU from the star. During the flyby mass is lost but part of it comes back within before the onset of an almost constant mass loss due to viscosity, spiral waves excited by the planet and residual disk instability related to the stellar flyby.
-
•
The 2D models were propagated a bit longer in time and this might explain part of the larger mass loss. In the 3D models the disk is still loosing a small amount of mass when we halt the simulation. This last effect, however, accounts for only a small fraction of the difference in the mass loss between 2D and 3D models.
Since the aim of our calculations is to show that the disk damps the excitation caused by the stellar flyby on the planet orbital elements, we are interested in the mass loss only occurring during the damping. The disk, in this short timescale ( 5 kyr), possibly does not reach a configuration where the mass loss is only due to viscosity and spiral waves excited by the planet but it is still loosing mass because of the binary perturbations. However, this is not relevant for our computations since the damping of the planet orbit has already occurred.
The mass exchange might cause a limited variation in the original metallicity of the disk compared to that of the host star assuming that the two encountering stars have significantly different values of metallicity. However, the amount of pollution is tiny and possibly without significant consequences for planet formation. The reduced mass loss in the more realistic 3D models presented here leads to a longer lifetime of the disk and a stronger damping effects on the eccentricity and inclination of the planet after the flyby.
| id | (AU) | nd | ||||||||||
|---|---|---|---|---|---|---|---|---|---|---|---|---|
| a | ||||||||||||
| b | ||||||||||||
| c | ||||||||||||
| d | ||||||||||||
| e | … | |||||||||||
| f | ||||||||||||
| g | ||||||||||||
| h |
Each simulation is labelled by an alphabet letter in the column indicated with ’id’. is the mutual inclination between the two disks defined by a rotation along the x-axis, is the inclination of the hyperbolic trajectory of the second star computed respect to the initial plane of the primary disk, is the minimum approach distance during the flyby and indicates the number of disks included in the simulation. At the end of each simulation we have computed the amount of mass lost by disk and disk . and are the amount of mass transferred by one disk to the other. , , and are the disk eccentricities and inclinations.
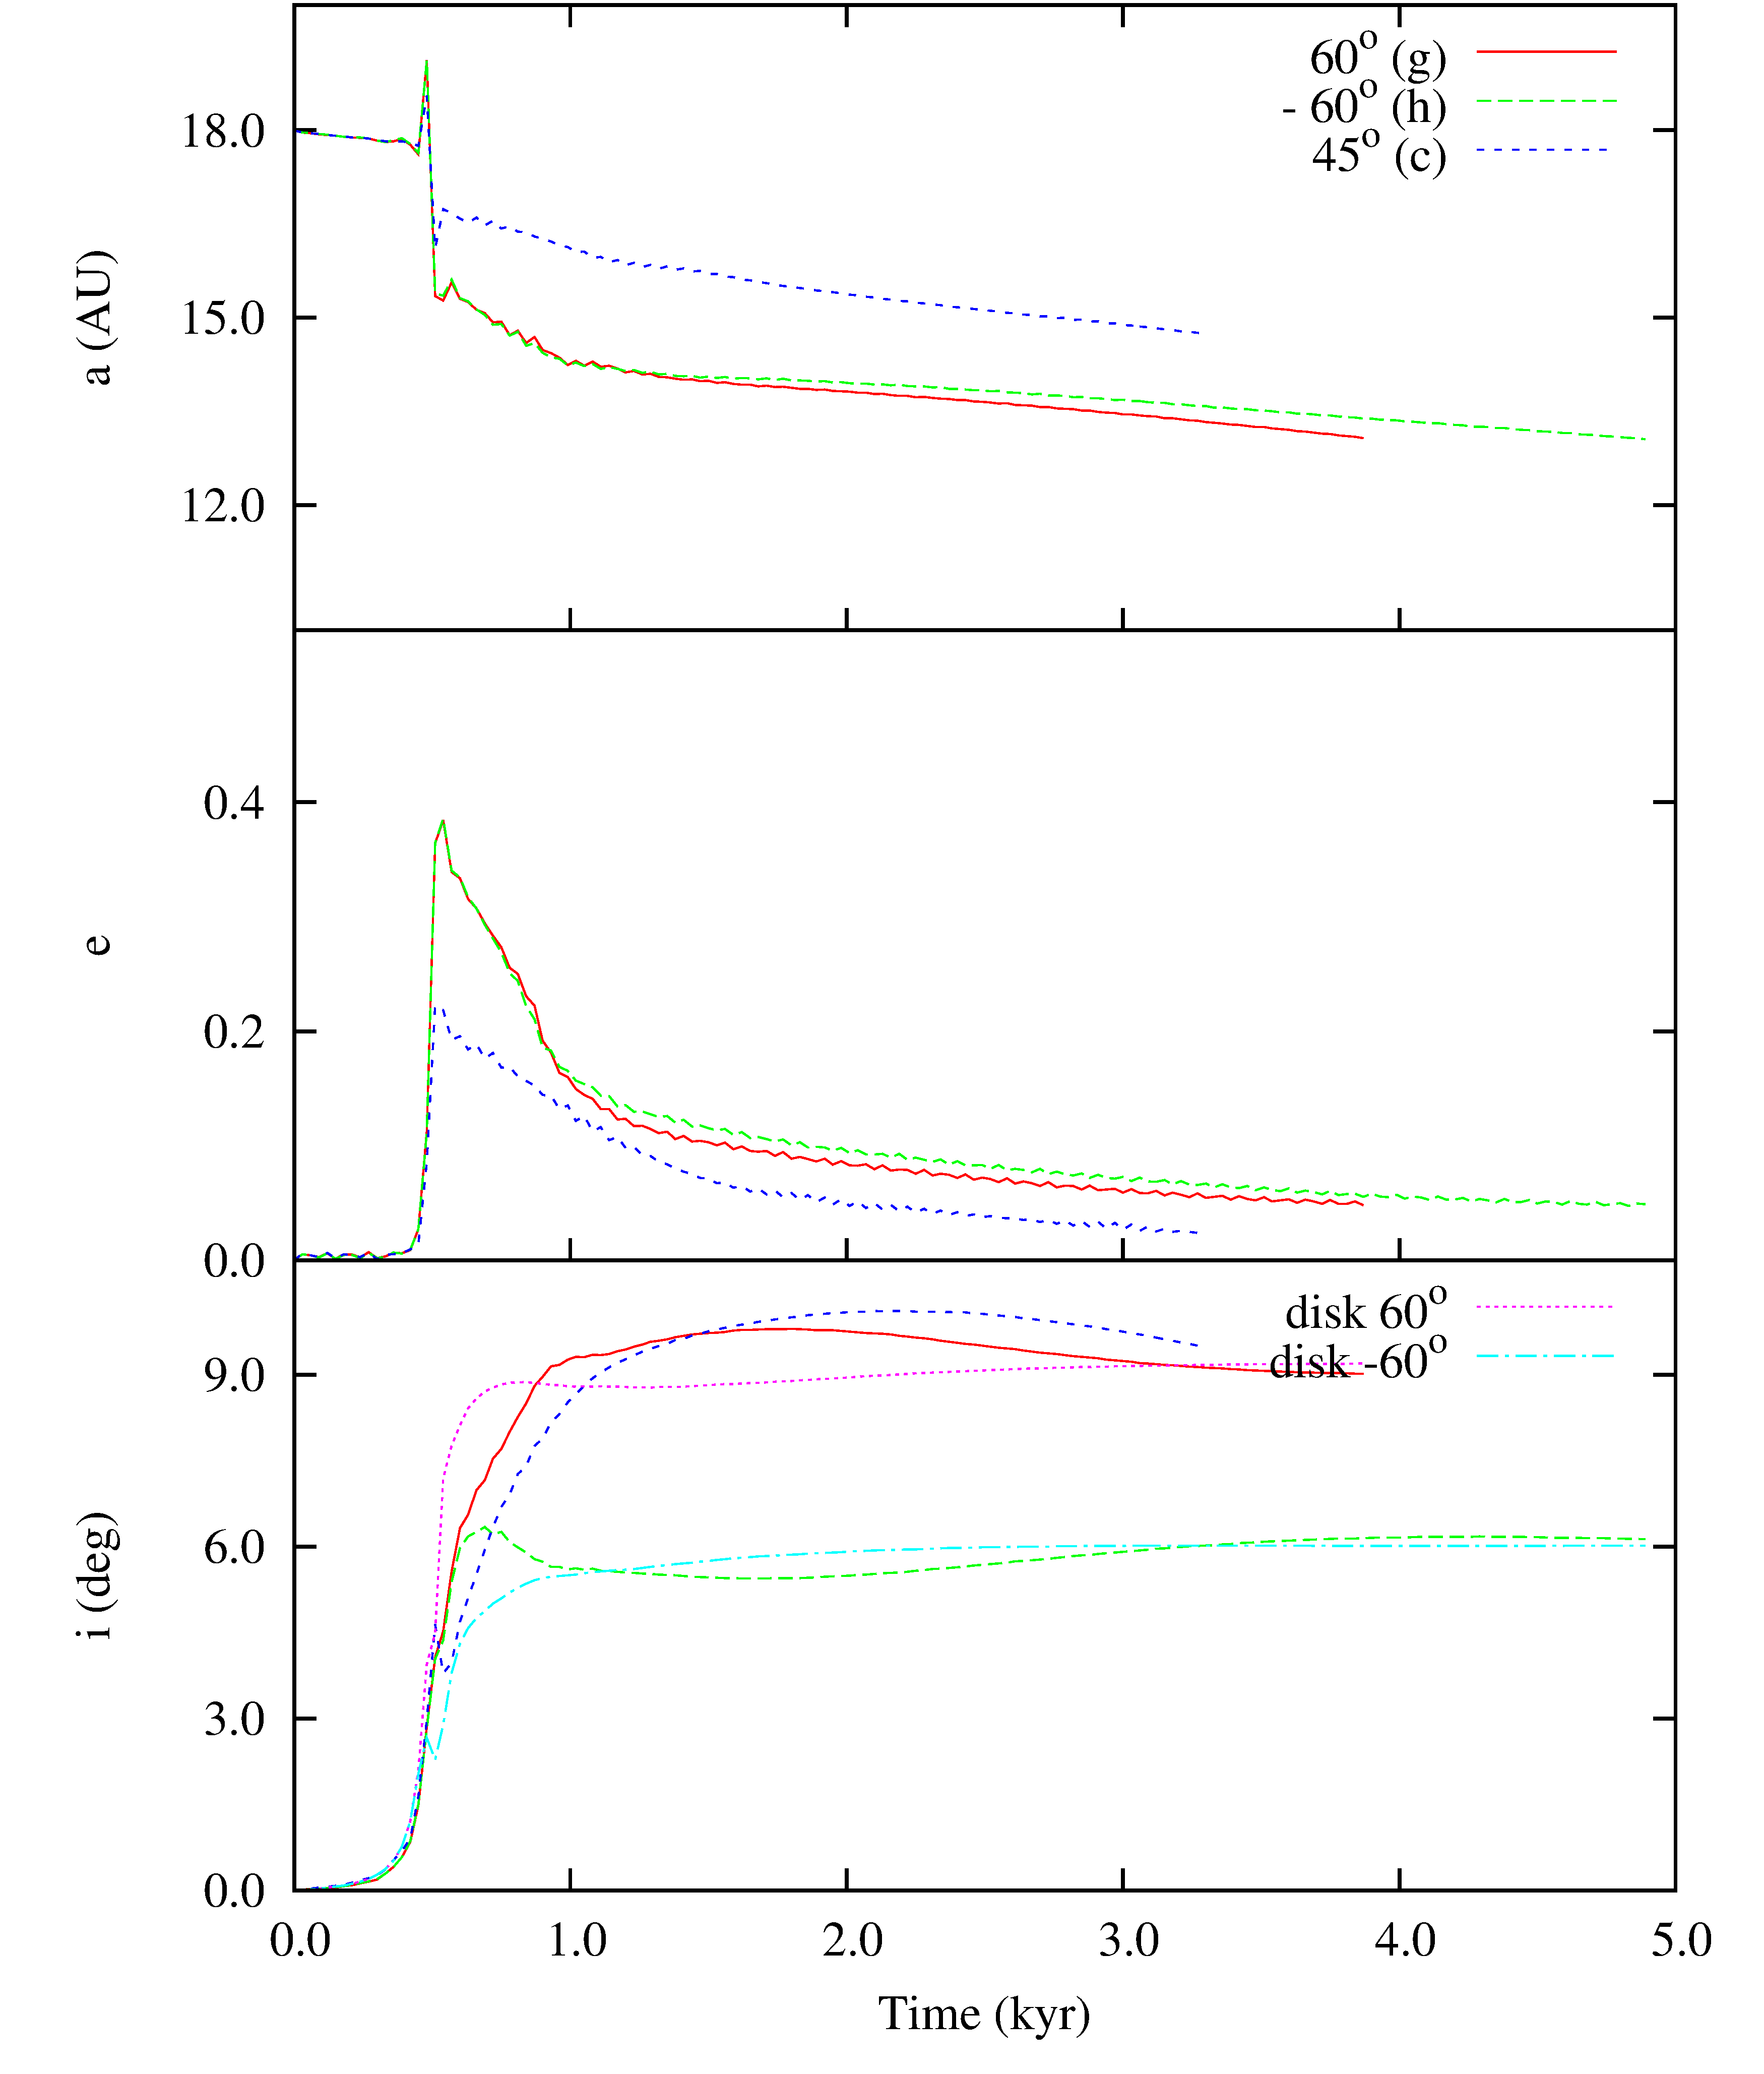
6 Highly misaligned configurations: cases g and h
We finally considered two cases with a large mutual inclination between the disks and an inclined hyperbolic trajectory for the star. In cases g and h and , respectively, while . In Fig. 11 we illustrate the orbital evolution of the planet. The evolution of the semimajor axis and eccentricity is very similar to that of the other cases previously discussed. It is noteworthy that the initial eccentricity step is inversely proportional to , the inclination of the hyperbolic orbit respect to the primary disk plane. When the jump is about , for it is slightly smaller than while it reduces to when . A similar trend was observed also by Forgan & Rice (2009) and it may then be unnecessary to test higher inclined configurations since the would be smaller.
A small difference between cases g and h in terms of eccentricity damping rate can be ascribed to the different mass loss of the two disks. In case g the disk mass is reduced by after about yr while in case h of the mass is lost after the same time interval (Tab. 1).
As in case c, the mutual inclination between the planet and disk is reduced and the planet is quickly pulled back into the disk (Fig. 11 bottom plot). Even in this highly inclined configuration, the maximum inclination of the disk (and planet) around the primary star is excited to a maximum of about (case g) which will be the final misalignment between the equatorial plane of the star and the final planet orbit after the disk dissipation.
7 Conclusions
The 3D simulations of stellar encounters in the presence of circumstellar disks, presented in this paper, confirm that the orbital changes a planet undergoes during a close stellar flyby are quickly damped by the interaction with the disk. The only observable difference after the close approach may be a residual misalignment between the planet–disk orbital plane and the star equatorial plane. In fact, during the encounter, the disk harbouring the planet is warped by the interaction with the passing star and its disk. Gradually, it relaxes on a new plane slightly tilted respect to the original one. The amount of tilting depends on the geometrical configuration of the system prior the encounter and in our models we find a maximum value of about . Subsequently, the planet is pulled back into the disk by the tidal interaction with the gas and its orbit also becomes inclined respect to the star equatorial plane. In case of repeated stellar flybys the final tilting of the planet orbit may be larger than but it appears unlikely that this mechanism may be responsible for the large planet inclinations found in some extrasolar systems (Triaud et al., 2010). The inclination evolution due to a series of stellar flybys would appear as a random walk with jumps that may lead to positive or negative changes of the planet (and disk) inclination. The stepsize of this random walk would also be small, since we consider an extreme case with a very deep flyby. An event like this would be rare in the lifetime of the star within the cluster and its probability would rapidly decrease with time.
We find some significant differences between 2D and 3D simulations.
-
•
The mass lost by the primary disk during the stellar flyby depends on the 3D geometry of the encounter and does not lead to the large mass loss observed in 2D simulations. The difference is mainly due to the inclusion of a disk around the passing star that exchanges mass with the primary disk during the close encounter and the use of an SPH code that allows us to better track the evolution of the gas far away from the stars.
-
•
The planet migrates inward at a slower rate in 3D simulations compared to 2D models. The migration of an eccentric orbit, like that of the planet just after the encounter, appears to be significantly less efficient in 3D models.
-
•
The initial eccentricity excited by the stellar flyby is damped more quickly in 3D models and this is partly due to the reduced amount of mass lost by the disk.
We also observed a slower eccentricity damping efficiency when the orbit of the planet is inclined respect to the disk due to a slightly weaker disk–planet interaction.
Concerning the effects of stellar flybys on planetary systems in stellar cluster, we do not expect any signature of the stellar encounters in the eccentricity of the planets. Some misalignment between the planet orbit and the star equatorial plane may appear but it would be limited. A period of fast type II migration may occur after the stellar encounter since any gap created by the planet before the flyby is destroyed during the strong interaction between the stars and the disks at the pericenter. A new gap is created when the planet is finally pulled back into the disk midplane and its orbit circularized. The rate at which the disks are destroyed in clusters may be slower than expected since when two stars have an encounter, their disks exchange mass rather than loosing it.
Marzari & Picogna (2013) explored the consequences of stellar encounters on systems of 3 planets and a similar exploration would be interesting also in 3D to test the occurrence of a “jumping Jupiter” chaotic phase and derive its final outcome. The parameter space is really huge and many different configurations may be envisaged in light of recent discoveries of extrasolar planetary systems. However, according to our results, it appears reasonable to expect that if the damping works in the extreme conditions we have simulated (low disk density, very deep encounter) it should be effective also in different, potentially more complex, scenarios.
ACKNOWLEDGMENTS
References
- Allen et al. (2007) Allen, L., Megeath, S. T., Gutermuth, R., et al. 2007, Protostars and Planets V, 361
- Ayliffe & Bate (2009) Ayliffe, B. A. & Bate, M. R. 2009, MNRAS, 393, 49
- Bell et al. (2013) Bell, C. P. M., Naylor, T., Mayne, N. J., Jeffries, R. D., & Littlefair, S. P. 2013, MNRAS, 434, 806
- Bitsch & Kley (2011) Bitsch, B. & Kley, W. 2011, A&A, 530, A41
- Chandar et al. (2010) Chandar, R., Fall, S. M., & Whitmore, B. C. 2010, ApJ, 711, 1263
- Cresswell et al. (2007) Cresswell, P., Dirksen, G., Kley, W., & Nelson, R. P. 2007, A&A, 473, 329
- Dukes & Krumholz (2012) Dukes, D. & Krumholz, M. R. 2012, ApJ, 754, 56
- Fall et al. (2009) Fall, S. M., Chandar, R., & Whitmore, B. C. 2009, ApJ, 704, 453
- Forgan & Rice (2009) Forgan, D. & Rice, K. 2009, MNRAS, 400, 2022
- Fragner & Nelson (2009) Fragner, M. M. & Nelson, R. P. 2009, A&A, 505, 873
- Gingold & Monaghan (1977) Gingold, R. A. & Monaghan, J. J. 1977, MNRAS, 181, 375
- Haisch et al. (2001) Haisch, Jr., K. E., Lada, E. A., & Lada, C. J. 2001, ApJ, 553, L153
- Hall et al. (1996) Hall, S. M., Clarke, C. J., & Pringle, J. E. 1996, MNRAS, 278, 303
- Hillenbrand (1997) Hillenbrand, L. A. 1997, AJ, 113, 1733
- Malmberg & Davies (2009) Malmberg, D. & Davies, M. B. 2009, MNRAS, 394, L26
- Malmberg et al. (2011) Malmberg, D., Davies, M. B., & Heggie, D. C. 2011, MNRAS, 411, 859
- Malmberg et al. (2007) Malmberg, D., de Angeli, F., Davies, M. B., et al. 2007, MNRAS, 378, 1207
- Marzari & Nelson (2009) Marzari, F. & Nelson, A. F. 2009, ApJ, 705, 1575
- Marzari & Picogna (2013) Marzari, F. & Picogna, G. 2013, A&A, 550, A64
- Meru & Bate (2012) Meru, F. & Bate, M. R. 2012, MNRAS, 427, 2022
- Monaghan & Gingold (1983) Monaghan, J. J. & Gingold, R. A. 1983, Journal of Computational Physics, 52, 374
- Nelson et al. (2009) Nelson, A. F., Wetzstein, M., & Naab, T. 2009, ApJS, 184, 326
- Palla & Stahler (2000) Palla, F. & Stahler, S. W. 2000, ApJ, 540, 255
- Picogna & Marzari (2013) Picogna, G. & Marzari, F. 2013, A&A, 556, A148
- Price & Monaghan (2004) Price, D. J. & Monaghan, J. J. 2004, MNRAS, 348, 139
- Price & Monaghan (2007) Price, D. J. & Monaghan, J. J. 2007, MNRAS, 374, 1347
- Shakura & Sunyaev (1973) Shakura, N. I. & Sunyaev, R. A. 1973, A&A, 24, 337
- Springel & Hernquist (2002) Springel, V. & Hernquist, L. 2002, MNRAS, 333, 649
- Triaud et al. (2010) Triaud, A. H. M. J., Collier Cameron, A., Queloz, D., et al. 2010, A&A, 524, A25
- Wetzstein et al. (2009) Wetzstein, M., Nelson, A. F., Naab, T., & Burkert, A. 2009, ApJS, 184, 298
- Zakamska & Tremaine (2004) Zakamska, N. L. & Tremaine, S. 2004, AJ, 128, 869