3D simulations of disc-winds extending radially self-similar MHD models
Abstract
Disc-winds originating from the inner parts of accretion discs are considered as the basic component of magnetically collimated outflows. The only available analytical MHD solutions to describe disc-driven jets are those characterized by the symmetry of radial self-similarity. However, radially self-similar MHD jet models, in general, have three geometrical shortcomings, (i) a singularity at the jet axis, (ii) the necessary assumption of axisymmetry, and (iii) the non-existence of an intrinsic radial scale, i.e. the jets formally extend to radial infinity. Hence, numerical simulations are necessary to extend the analytical solutions towards the axis, by solving the full three-dimensional equations of MHD and impose a termination radius at finite radial distance. We focus here on studying the effects of relaxing the (ii) assumption of axisymmetry, i.e. of performing full 3D numerical simulations of a disc-wind crossing all magnetohydrodynamic critical surfaces. We compare the results of these runs with previous axisymmetric 2.5D simulations. The structure of the flow in all simulations shows strong similarities. The 3D runs reach a steady state and stay close to axisymmetry for most of the physical quantities, except for the poloidal magnetic field and the toroidal velocity which slightly deviate from axisymmetry. The latter quantities show signs of instabilities, which, however, are confined to the region inside the fast magnetosonic separatrix surface. The forces present in the flow, both of collimating and accelerating nature, are in good agreement in both the 2.5D and the 3D runs. We conclude that the analytical solution behaves well also after relaxing the basic assumption of axisymmetry.
keywords:
MHD — methods: numerical — ISM: jets and outflows — Stars: pre-main sequence, formation1 Introduction
Astrophysical jets are observed in association with a wide range of objects, from Brown Dwarfs and young stellar objects to supermassive Black Holes in active galactic nuclei; however, there are still open several questions concerning the launching and acceleration mechanisms of jets. In all cases, jets and discs are inter-related, while magnetic fields play a key role in accelerating the outflows. Blandford & Payne (1982) studied the magneto-centrifugal acceleration along magnetic field lines threading an accretion disc. They showed the braking of matter in the azimuthal direction inside the disc and the outflow acceleration above the disc surface guided by the poloidal magnetic field components. Toroidal components of the magnetic field then collimate the outflow. Numerous semi-analytic models extended the work of Blandford & Payne along the guidelines of radially self-similar solutions of the full magnetohydrodynamic (MHD) equations (e.g. Contopoulos & Lovelace 1994; Li 1995, 1996; Ferreira 1997; Vlahakis & Tsinganos 1998). Several numerical studies exist, which have focused on the magnetic launching of disc-winds. In most models a polytropic equilibrium accretion disc has been used as a boundary condition (e.g. Ustyugova et al. 1995; Krasnopolsky et al. 1999, 2003; Ouyed et al. 2003; Nakamura & Meier 2004; Anderson et al. 2005, 2006; Pudritz et al. 2006). The magnetic feedback on the disc structure was therefore not calculated self-consistently. Only in recent years have been carried out the first simulations which include self-consistently the accretion disc in the calculations of jet launching (e.g. Casse & Keppens 2002, 2004; Kato et al. 2004; Zanni et al. 2007; Tzeferacos et al. 2009; Murphy et al. 2010; Sheikhnezami et al. 2012; Tzeferacos et al. 2013; Fendt & Sheikhnezami 2013).
Often analytical solutions and their integrals of motion are used for connecting observed quantities far away from the jet source with properties of the jet-driving accretion disc. The behaviour of integrals of motions has been also tested in numerical simulations. Several 2.5D simulations of disc winds from the disc as a boundary condition (e.g. Romanova et al. 1997; Ouyed & Pudritz 1997; Krasnopolsky et al. 1999; Ustyugova et al. 1999) found super-fast magnetosonic flows with properties which are expected from self-similar theory, although they have not used self-consistent analytical solutions for describing the boundary conditions. Recently, Staff et al. (2010) performed 3D simulations extending the calculations of Ouyed & Pudritz (1997) and found good agreement between both. In addition, Staff et al. (2010) also simulated configurations closer to self-similar solutions (their run BP) and compared synthetic emission maps derived from them with HST observations. A similar comparison is presented in Stute et al. (2010, hereafter paper II) using simulations from Stute et al. (2008, hereafter paper I).
Most self-similar models have three serious limitations, (1) the flow often does not cross all critical points (especially not the fast-magnetosonic limiting characteristic), with the result that the terminal wind solution is not causally disconnected from the disc, (2) singularities exist at the jet axis in radial self-similar models, and (3) for deriving self-similar models the assumption of axisymmetry is necessary.
Vlahakis et al. (2000, V00 hereafter) showed that a terminal wind solution can be constructed that is causally disconnected from the disc and hence any perturbation downstream of the superfast transition cannot affect the upstream structure of the steady outflow. The other two limitations can only be solved using numerical simulations extending the analytical solution of e.g. V00 as done by Gracia et al. (2006) using the MHD code NIRVANA (Ziegler 1998), Matsakos et al. (2008) using the MHD code PLUTO111publicly available at http://plutocode.ph.astro.it/ (Mignone et al. 2007) and again with PLUTO in paper I for comparison with models with finite jet-emitting disc radii. Čemeljić et al. (2008) extended the solution by adding the effects of resistivity. However, all of those models still assumed axisymmetry.
The aim of this paper is to investigate numerically how relaxing the assumption of axisymmetry, i.e. performing full 3D numerical simulations of a disc-wind crossing all magnetohydrodynamic critical surfaces, affects the topology, structure and stability of this particular radial self-similar analytical solution.
2 The numerical setup
The time-dependent, ideal MHD equations to be solved numerically are:
| (1) | |||||
| (2) | |||||
| (3) | |||||
| (4) | |||||
| (5) |
where , , , denote the density, pressure, velocity and magnetic field over , respectively. is the gravitational potential of the central object with mass , represents the rate of the volumetric energy gain/loss terms (, with the rate of the energy gain/loss terms per unit mass), and is the ratio of the specific heats. The spherical radius is denoted by and the cylindrical radius by .
As initial conditions, we use the steady, radially self-similar solution which is described in V00 and crosses all three appropriate critical surfaces, modified near the symmetry axis as described in Gracia et al. (2006) and Matsakos et al. (2008). We note that a polytropic relation between the density and the pressure is assumed, i.e. , with being the effective polytropic index and A the magnetic flux function. Equivalently, the source term in Eq. (3) has the special form
| (6) |
transforming the energy Eq. (3) to
| (7) |
The latter can be interpreted as describing the adiabatic evolution of a gas with ratio of specific heats , whose “effective entropy” is conserved along each streamline. We refer the reader to V00 and paper I for further details on the self-similar solution and the numerical setup. We define the reference length to be unity, while the reference velocity is normalized by setting . Time is given in units of , i.e. one Keplerian orbit period at .

We solve the MHD equations with the PLUTO code, a modular Godunov-type code particularly oriented towards the treatment of astrophysical flows in the presence of discontinuities. For the present case, second order accuracy is achieved using a Runge-Kutta scheme (for temporal integration) and piecewise linear reconstruction (in space). All the computations were carried out with the Harten, Lax, Van Leer approximate Riemann Solver with the contact discontinuity (HLLC).
At the lower boundary, we keep the physical variables fixed to their analytical values, however, making sure that the problem is not over-specified. Outflow conditions are set at the other boundaries, i.e. all gradients across these boundaries are set to zero.
We performed 3D simulations on grids with resolutions between 2563 and 10243 cells and a domain size of [-100,100]x[-100,100]x[10,210] in Cartesian coordinates (,,). For comparison, we also run 2.5D axisymmetric simulations with the setup taken from paper I, but now with a domain size of [0,100]x[10,210] in cylindrical coordinates (,) and grids with resolutions between 128x256 cells and 512x1024 cells, i.e. with the same resolutions as the 3D runs.
3 Results of the simulations
3.1 Basic structure of the flow
The three-dimensional and 2.5-dimensional simulations show a similar structure of the flow. Since the initial conditions are not a steady solution of the system of equations under consideration due to the modifications at the axis, the initial conditions relax toward a new final steady state within about , while after that only changes of a few percent are present. As expected from the high MHD signal velocities, the inner regions of the flow evolve very rapidly. MHD waves communicate changes of the inner flow to the outer regions and are clearly visible as bends moving along the field lines. In all models, a shock representing the fast magnetosonic separatrix surface (FMSS) forms, as already described in the axisymmetric 2.5D models by Gracia et al. (2006), Matsakos et al. (2008) and paper I.
In Fig. 1, we plot logarithmic maps of the final state for the density and velocity components and also the position of the three surfaces where the flow velocity exceeds the slow-magnetosonic, the Alfvén and the fast-magnetosonic speed, respectively. All eight physical quantities (including pressure and magnetic field components) agree well in the axisymmetric 2.5D and the 3D models with the same resolution. Since the central axis is not a symmetry axis anymore in the 3D simulations, some differences in the region are present.
3.2 Deviations from axisymmetry
In order to test for possible deviations from axisymmetry, we use the results of our 2.5D runs as reference. For each grid cell in the finer 3D run, we plot its quantities against its cylindrical radius and compare it with profiles in the 2.5D runs (Fig. 2).


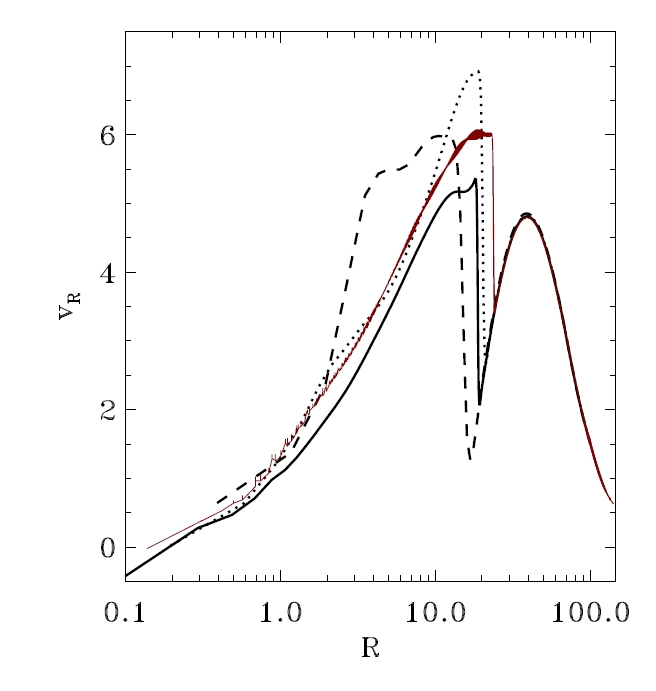
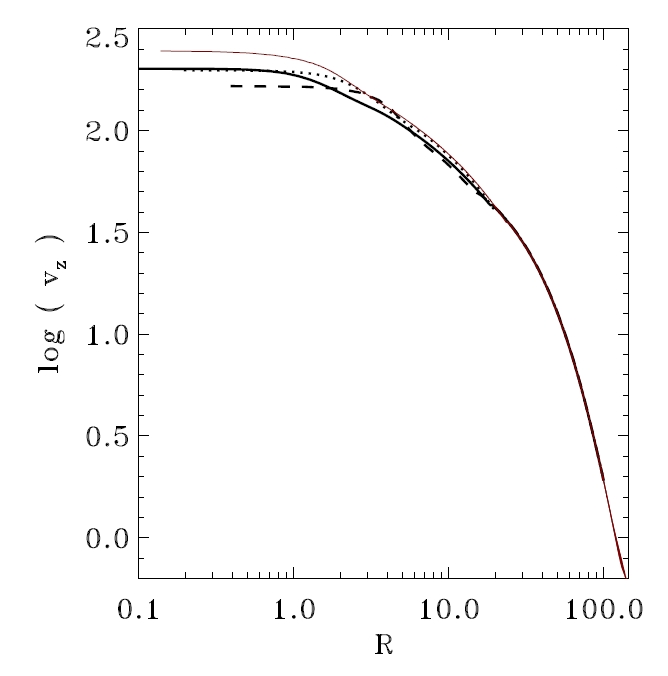
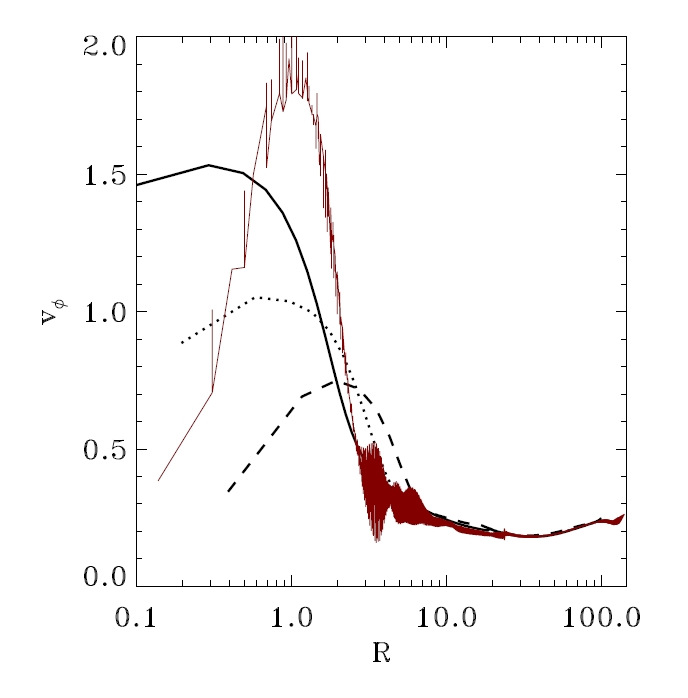
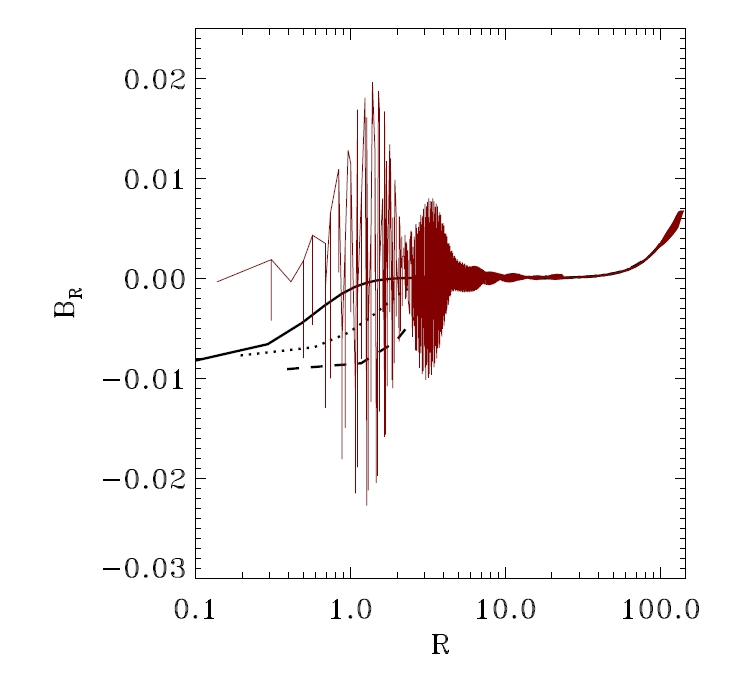
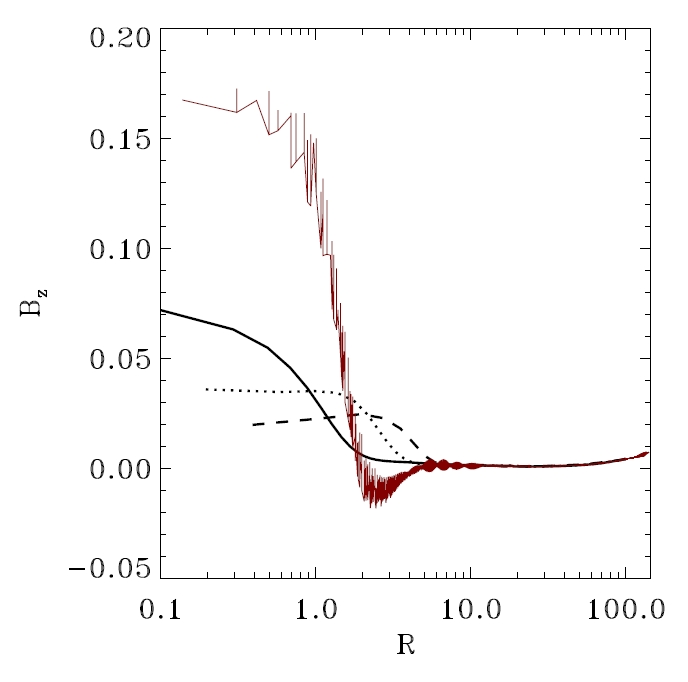
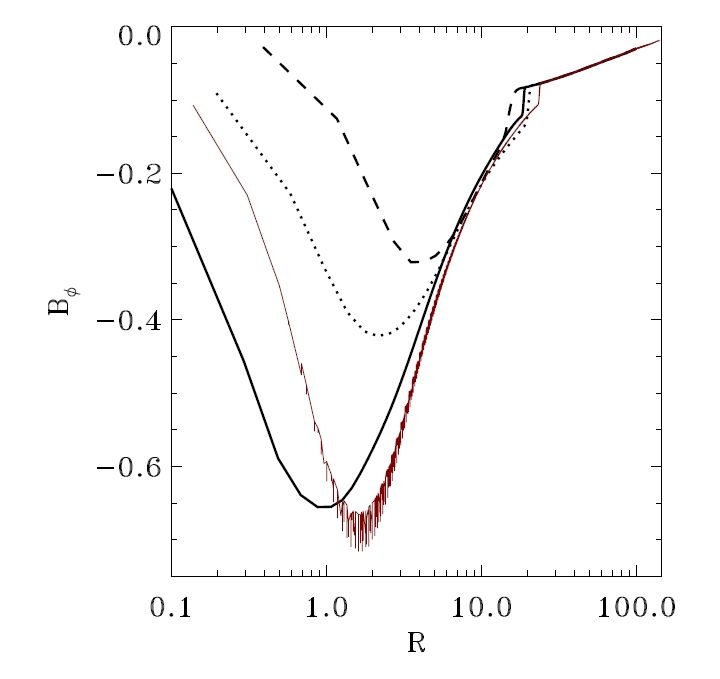
Most of the profiles show a very good agreement between the 3D run and the axisymmetric 2.5D runs and also almost no signs of deviations from axisymmetry. For values of , we have only data points from the 3D run. In this region in the corners of the 3D domain, a small scatter of points around the mean profile is present which is possibly connected to boundary effects.
In the range , the profiles of the 2.5D and 3D simulations are in very good agreement in all quantities. For even smaller values of , already the three 2.5D simulations with different resolutions show slightly different profiles, which result in different positions of the FMSS between –24 depending on the resolution. The position of the FMSS in the finer 3D run is also different to that in all three 2.5D runs.
Inside the FMSS for radii , the profiles show again only small deviations from the axisymmetric mean profiles. In the innermost central spine of the flow, , we see two distinct effects. The first one is the changed behaviour in and , which go to zero on the axis faster than in the 2.5D simulations (in these simulations and also vanish on the axis due to the imposed axisymmetric boundary conditions). The second effect is significantly increased deviations from axisymmetry which are mainly in the toroidal velocity and the poloidal magnetic field components and . These three quantities show patterns of an instability. We note however, that these quantities are not dynamically important, since at the flow is super-fast magnetosonic and the dominant components of the magnetic field and flow speed are and , respectively.
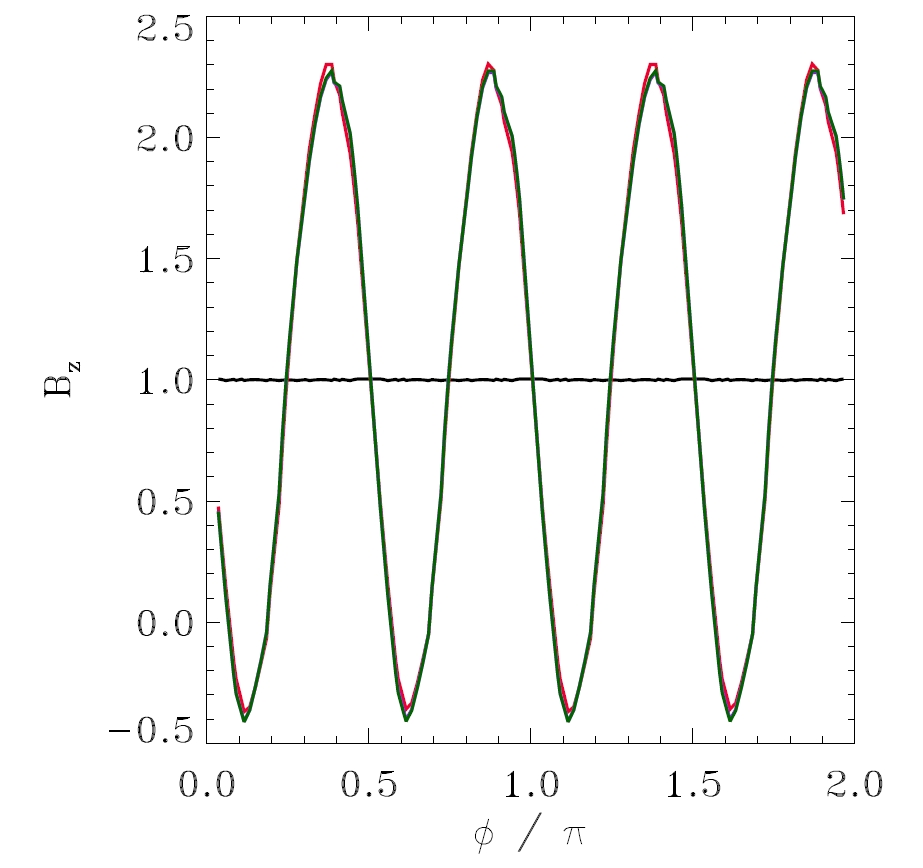
In Fig. 3 (top), we show a horizontal slice of through the computational domain at for the final time step. One can directly see that the instabilities are confined to the interior of the FMSS, i.e.the fast-magnetosonic flow. The FMSS is fully developed after one orbit at 1 and also the instabilities do not grow after this time.
When plotting along a ring of radius (and again at ) as a function of (Fig. 3, middle) we see a sinusoidal behaviour which remains steady at large times. Related to its temporal behaviour we can distinguish between three stages (Fig. 3, bottom). Up to 0.5 , the FMSS is still inside this radius and the variation of as a function of is only several percent. When the FMSS has expanded beyond the radius , the variance of rapidly grows until at 1 the instability is fully established and saturates.
Most likely, this instability is induced by the rotating flow discretized on Cartesian grid cells. Since grid errors are replicated in the four quadrants, this would also explain the formation of four equidistant spiral patterns as seen in Fig. 3.


3.3 Integrals of motion
We investigate the known five integrals of motion (see e.g., paper I for details)
| (8) | |||||
| (9) | |||||
| (10) | |||||
| (11) | |||||
| (12) |
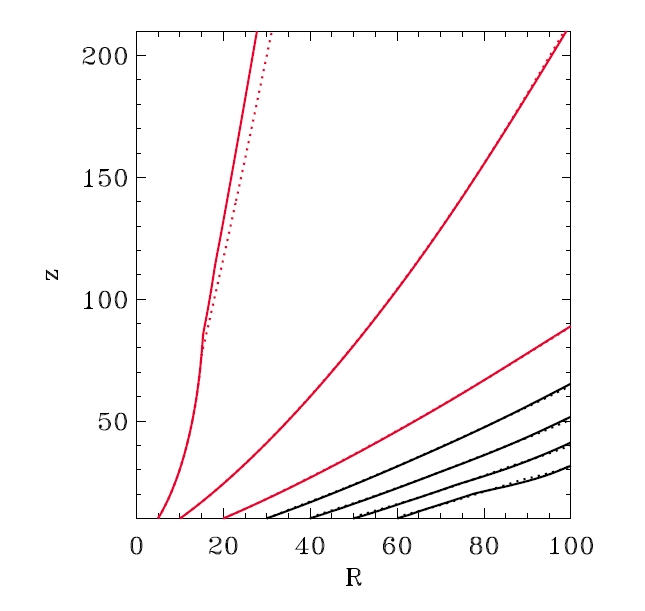
along surfaces with constant energy anchored at the lower boundary at (,)=(10,10) and (5,10) and , i.e. in the plane in the finer 3D run. The values of the integrals are plotted for the 2.5D run with 5121024 grid cells as solid lines and for the 3D run with grid cells as dashed lines in Fig. 4, both for the initial state as well as the final state. They are normalized by their value at the upper boundary. Also plotted are the shapes of these surfaces which agree well in both runs.
The integrals of motion directly show that we reached a steady state in both the 2.5D and 3D runs. Each integral of motion varies on a certain surface only by a few percent. In both runs, we find a very similar behavior of the integrals. Along the surface which is always inside the FMSS, (black lines) and (purple lines) show in the 3D run oscillations around a constant mean value.


3.4 Forces
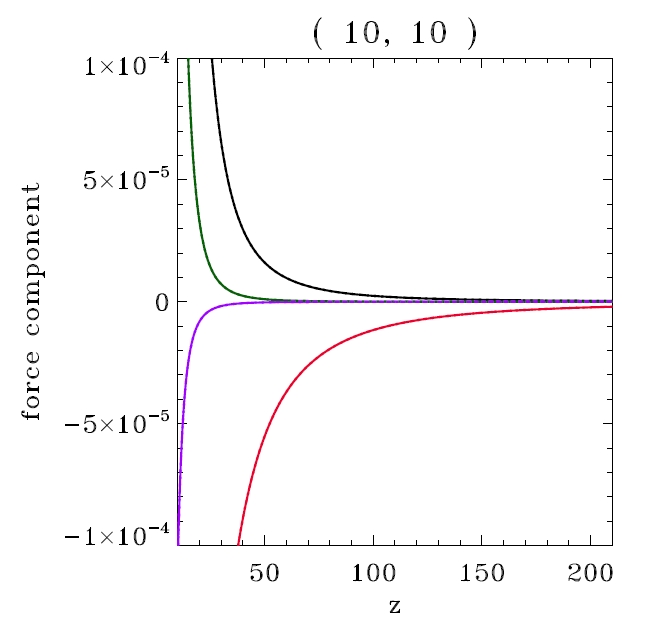
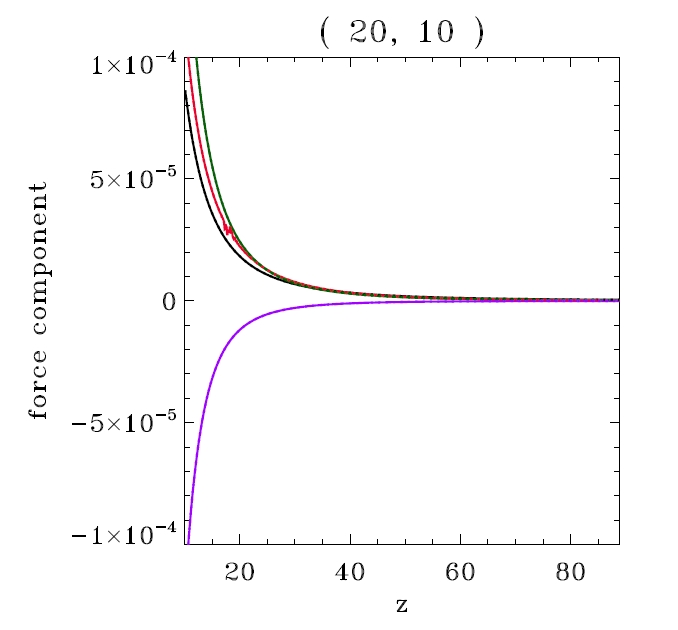
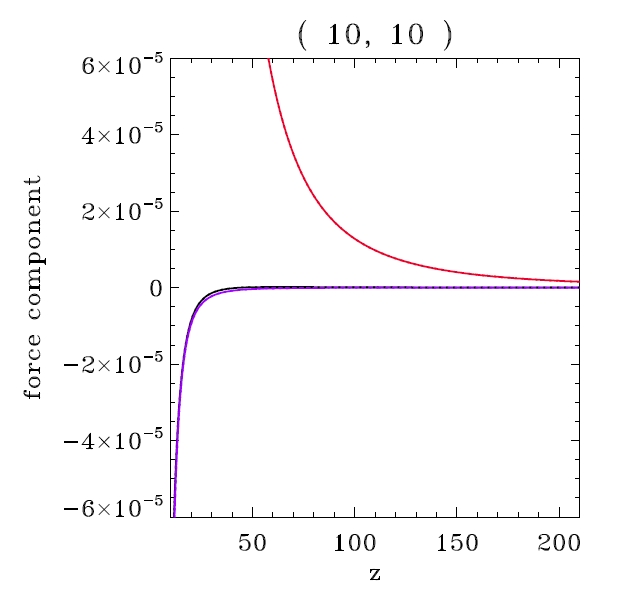
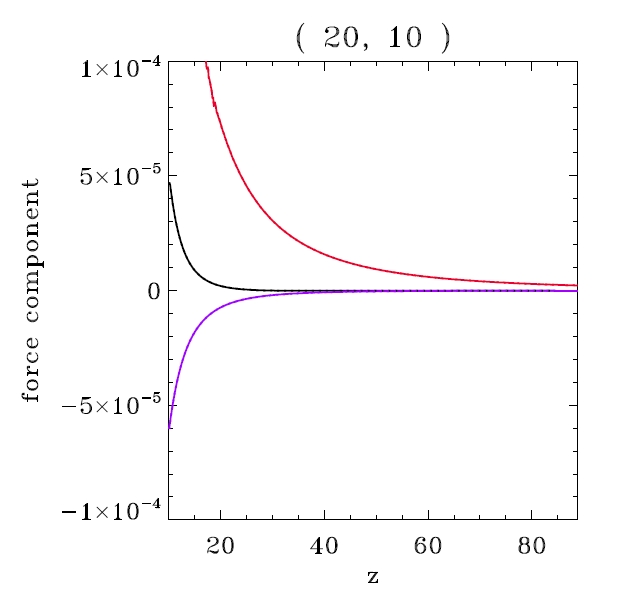
We also investigate the and components of forces along the same surfaces as in the previous section, see Figs. 5–6. The interplay between the components of the pressure gradient, the centrifugal and the Lorentz force is responsible for collimating the flow or triggering its expansion, their sum being related to the curvature of the poloidal surfaces. They also contribute to the flow acceleration, especially on the outer surfaces whose inclinations with respect to the vertical are not small. On these outer surfaces, the three forces are working against gravity. The Lorentz force is larger than the pressure force, however, is smaller than the centrifugal force up to some distance, indicating the magnetocentrifugal initial driving of disk-winds, and becomes larger at larger distances, showing the contribution of the force to the flow acceleration. On the inner surface (which is close to vertical), the Lorentz force always collimates the flow. This is expected, since the component of the Lorentz force equals with and near the axis. On the contrary the “return current” is at larger distances, resulting in negative force, as seen in the outer surface anchored at (,)=(20,10).
For the components of the forces (Fig. 6) it is clear that the Lorentz force always dominates the pressure gradient and gravity, contributing to the flow acceleration.




4 Summary and conclusions
We have shown the results of the first 3D simulation of a disc-wind crossing all magnetohydrodynamic critical surfaces. This result is important in order to assure that the main flow is causally disconnected from its source, which is a prerequisite for a jet with the observed long lifetime. We have compared these results with previous axisymmetric 2.5D simulations.
The structure of the flow in all simulations exhibits strong similarities. In the outer part of the flow, its structure is almost identical in all cases. Near and at the position of the fast magnetosonic separatrix surface (FMSS) which shows as a shock, some minor deviations of the 3D run from the 2.5D runs are present.
The 3D runs reach a steady state and stay close to axisymmetry for most of the variables, except for the poloidal magnetic field and the toroidal velocity which deviate considerably from axisymmetry, but are not dynamically important. The latter quantities show signs of instabilities, which, however, are confined to the region inside the FMSS. It is important to emphasize that the crossing of the FMSS, which represents the “event horizon” for the propagation of MHD waves, does not allow any disturbance at large distances to reach the base of the flow, contributing to its stability.
The forces present in the flow, both of collimating and accelerating nature, are in good agreement in both the 2.5D and the 3D runs.
The main goal of the present paper is to check whether the axisymmetric, radially self-similar MHD solution for a polytropic disc-wind which crosses all appropriate critical surfaces to satisfy causality (Vlahakis et al. 2000), behaves “well” also after (i) removing the axial singularity and (ii) relaxing the assumption of axisymmetry. We have found that this solution is structurally stable to non-axisymmetic perturbations. The next step will be to further configure and improve this solution such as it may describe realistic astrophysical disc-winds. As in paper I, this further extension will involve the truncation of the solution at some arbitrary radii and use of this truncated solution to study the temporal evolution of jets within an MHD model and further comparison with observations. Staff et al. (2010) argue that models exhibiting a slowly varying poloidal field component in the accretion disc (their model OP) match observations better than those resembling self-similar MHD solutions (as their model BP). Note, however, that in paper II we showed that radially truncated self-similar solutions may very well describe real HST observations.
Acknowledgments
We acknowledge the referee, Marina Romanova, for helpful comments and suggestions that improved the paper. The 3D simulations have been performed on the supercomputers BCX at CASPUR, on SP6 at CINECA and on supercomputers in the bwGRiD, the grid of the state Baden Württemberg.
References
- Anderson et al. (2005) Anderson, J. M., Li, Z.-Y., Krasnopolsky, R., Blandford, R. D. 2005, ApJ, 630, 945
- Anderson et al. (2006) Anderson, J. M., Li, Z.-Y., Krasnopolsky, R., Blandford, R. D. 2006, ApJ, 653, L33
- Blandford & Payne (1982) Blandford, R. D., Payne, D. G. 1982, MNRAS, 199, 883
- Casse & Keppens (2002) Casse, F., Keppens, R. 2002, ApJ, 581, 988
- Casse & Keppens (2004) Casse, F., Keppens, R. 2004, ApJ, 601, 90
- Čemeljić et al. (2008) Čemeljić, M., Gracia, J., Vlahakis, N., Tsinganos, K. 2008, MNRAS, 389, 1022
- Contopoulos & Lovelace (1994) Contopoulos, J., Lovelace, R. V. E. 1994, ApJ, 429, 139
- Fendt & Sheikhnezami (2013) Fendt, C., Sheikhnezami, S. 2013, ApJ, 774, 12
- Ferreira (1997) Ferreira, J. 1997 A & A, 319, 340
- Ferreira (2007) Ferreira, J. 2007, in: “Jets from Young Stars: Models and Constraints”, Lecture Notes in Physics, Vol. 723, J. Ferreira, C. Dougados, E. Whelan (Eds.), Springer-Verlag Berlin Heidelberg, astro-ph/0607216
- Gracia et al. (2006) Gracia, J., Vlahakis N., Tsinganos K. 2006, MNRAS, 367, 201
- Kato et al. (2004) Kato, Y., Mineshige, S., Shibata, K. 2004, ApJ, 605, 307
- Krasnopolsky et al. (1999) Krasnopolsky, R., Li, Z.-Y., Blandford, R. D. 1999, ApJ, 526, 631
- Krasnopolsky et al. (2003) Krasnopolsky, R., Li, Z.-Y., Blandford, R. D. 2003, ApJ, 595, 631
- Li (1995) Li, Z.-Y. 1995, ApJ, 444, 848
- Li (1996) Li, Z.-Y. 1996, ApJ, 465, 855
- Matsakos et al. (2008) Matsakos, T., Tsinganos, K., Vlahakis, N., Massaglia, S., Mignone, A., Trussoni, E. 2008, A & A, 477, 521
- Mignone et al. (2007) Mignone, A., Bodo, G., Massaglia, S., et al. 2007, ApJS, 170, 228
- Murphy et al. (2010) Murphy, G. C., Ferreira, J., Zanni, C. 2010, A & A, 512, A82
- Nakamura & Meier (2004) Nakamura, M., Meier, D. L. 2004, ApJ, 617, 123
- Ouyed & Pudritz (1997) Ouyed, R., Pudritz, R. E. 1997, ApJ, 482, 712
- Ouyed et al. (2003) Ouyed, R., Clarke, D. A., Pudritz, R. E. 2003, ApJ, 582, 292
- Pudritz et al. (2006) Pudritz, R. E., Rogers, C. S., Ouyed, R. 2006, MNRAS, 365, 1131
- Romanova et al. (1997) Romanova, M. M., Ustyugova, G. V., Koldoba, A. V., et al. 1997, ApJ, 482, 708
- Sheikhnezami et al. (2012) Sheikhnezami, S., Fendt, C., Porth, O., Vaidya, B., Ghanbari, J. 2012, ApJ, 757, 65
- Staff et al. (2010) Staff, J. E., Niebergal, B. P., Ouyed, Rachid, et al. 2010, ApJ, 722, 1325
- Stute et al. (2008) Stute, M., Tsinganos, K., Vlahakis, N., Matsakos, T., Gracia, J. 2008, A & A, 491, 339, paper I
- Stute et al. (2010) Stute, M., Gracia, J. Tsinganos, K., Vlahakis, N. 2010, A & A, 516, A6, paper II
- Tsinganos (1982) Tsinganos, K. C. 1982, ApJ, 252, 775
- Tzeferacos et al. (2009) Tzeferacos, P., Ferrari, A., Mignone, A., Zanni, C., Bodo, G., Massaglia, S. 2009, MNRAS, 400, 820
- Tzeferacos et al. (2013) Tzeferacos, P., Ferrari, A., Mignone, A., Zanni, C., Bodo, G., Massaglia, S. 2013, MNRAS, 428, 3151
- Ustyugova et al. (1995) Ustyugova, G. V., Koldoba, A. V., Romanova, M. M., Chechetkin, V. M., Lovelace, R. V. E. 1995, ApJ, 439, L39
- Ustyugova et al. (1999) Ustyugova, G. V., Koldoba, A. V., Romanova, M. M., Chechetkin, V. M., Lovelace, R. V. E. 1999, ApJ, 516, 221
- Vlahakis & Tsinganos (1998) Vlahakis, N., Tsinganos, K. 1998, MNRAS, 298, 777
- Vlahakis et al. (2000) Vlahakis, N., Tsinganos, K., Sauty, C., Trussoni, E. 2000, MNRAS, 318, 417, V00
- Zanni et al. (2007) Zanni, C., Ferrari, A., Rosner, R., Bodo, G., Massaglia, S. 2007, A & A, 469, 811
- Ziegler (1998) Ziegler, U. 1998, Comput. Phys. Commun., 109, 111