1 Introduction
More than two thirds of the elements in the periodic table have quadrupolar nuclei. Quadrupolar interactions can be as large as or larger than chemical shift and dipolar interactions. Thus, quadrupolar nuclei typically exhibit broad spectra which lack resolution. To resolve quadrupolar spectra, there exist a number of methods, most notably multiple quantum NMR experiments. Multiple quantum experiments are so named because they take advantage of the multiple spin states that characterize quadrupolar nuclei and the coherences that can be created between spin states. The first multiple quantum experiment was performed in 1995 [3]. This experiment was called multiple quantum magic angle spinning (MQMAS) and utilized symmetric spin state transitions. Another multiple quantum experiment taking advantage of asymmetric spin state transitions, termed the satellite transition magic angle spinning (STMAS) experiment was introduced in 2000 [9]. Although STMAS provides enhanced sensitivity over MQMAS, it has not attracted the same level of interest [6].
STMAS experiments have an advantage over MQMAS of generally having greater efficiency [7]. Hajjar et al. have studied the effects of phase cycling in MQMAS experiments [5]. Though satellite transition experiments have been applied to a variety of spin systems with very good increase in resolution, there have not been any studies in phase cycling effects on the spectrum in these experiments. In this work, I study effects of phase cycling in a satellite transition experiment on a 17O enriched sample of silica.
2 Theory
A perturbation expansion of the quadrupolar Hamiltonian given by Trebosc, et al. [2], written in terms of frequency differences of energy levels is useful for pointing out important features of multiple quantum experiments on quadrupolar nuclei
| (1) | ||||
| (2) |
where and are the z-components for the states of total nuclear spin , is the angle relating the quadrupolar principle axis system (PAS) to the sample rotation frame, is the angle between the static and the sample rotation frame, is the quadrupole characteristic frequency, and is the Larmor frequency of the nucleus. The are the reduced Wigner rotation matrices. Eqs. 1 and 2 hold when the asymmetry parameter is zero. Taking applies to situations where the electric field gradient (EFG) is symmetric about the transverse PAS coordinates. Symmetric crystal structures give values very close to zero [1]. In this work, I look at SiO2 crystals with tetrahedral symmetry which makes this assumption valid.
The expansion above shows a couple of important spectral characteristics. First, for rotation about the magic angle, . These terms drop out for sample spinning. Second, for the first order frequency drops out. For spinning at an appropriate angle, . However no rotation about a single angle will give . Reduction of the term in the second order frequency is the objective of performing quantum coherence experiments.
Depending on the spin system, multiple satellite transitions are available. Figure 1 gives an energy level diagram for a spin nucleus with the various possible single quantum satellite transitions. Populations of the states in a system of spins follows a Boltzmann distribution.
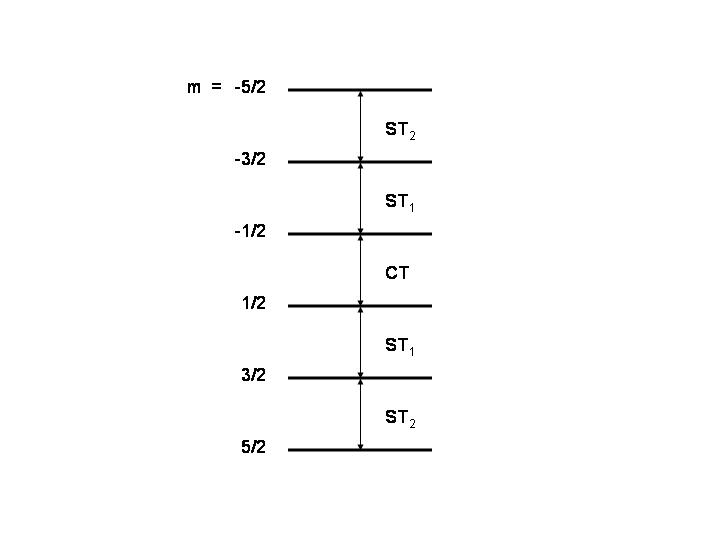
Lowest energy states will have the highest populations and thus the largest magnetization. STMAS experiments take advantage of this, transferring magnetization through coherence between the satellite transitions. Ideally, the largest and smallest population magnetizations are transferred to the central transition (CT).
3 Methods
The pulse sequence and coherence transfer pathway for a single quantum STMAS (1QSTMAS) experiment is shown in Figure 2.
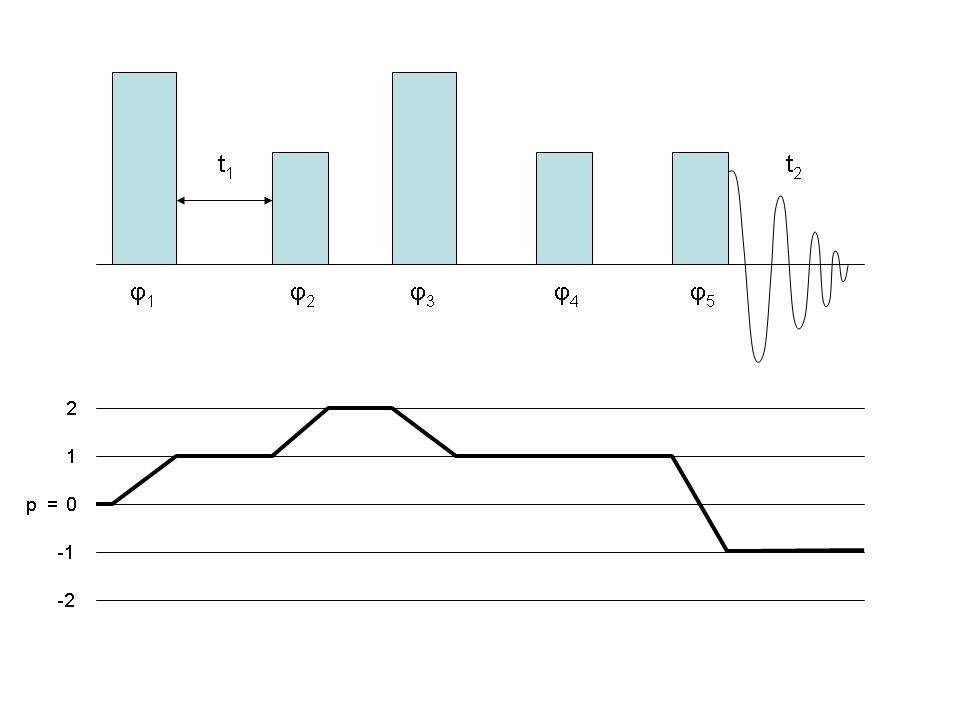
The phases are determined using the Equations 3 and 4.
| (3) |
| (4) |
To ensure the desired coherence order pathway during observation, the phase of the receiver is also cycled according to [4]
| (5) |
For a 1QSTMAS pulse sequence with 4 phases for the first, second, and fifth pulses keeping the third and fourth pulses at a constant phase, to attain one complete signal, the sequence must be performed times.
The observed signal is 2-dimensional
| (6) |
The form of the second order term in Equation 2 involves two terms, assuming magic angle spinning. The first term is a constant. The second term gives the fourth order broadening. It is the second term that multiple quantum experiments seek to remove. As seen in the 2-dimensional signal, appropriate choices of given a will result in only a constant exponential term. This “refocusing” of the signal to remove second order broadening is the means by which multiple quantum experiments attain spectra with improved resolution in the second dimension.
Figure 3 is a schematic representation of possible results from a 1QSTMAS experiment performed on a spin nucleus. Generally, results include contributions from the various transitions. According to Figure 1, these contributions come from the CT, ST1, and ST2 transitions.
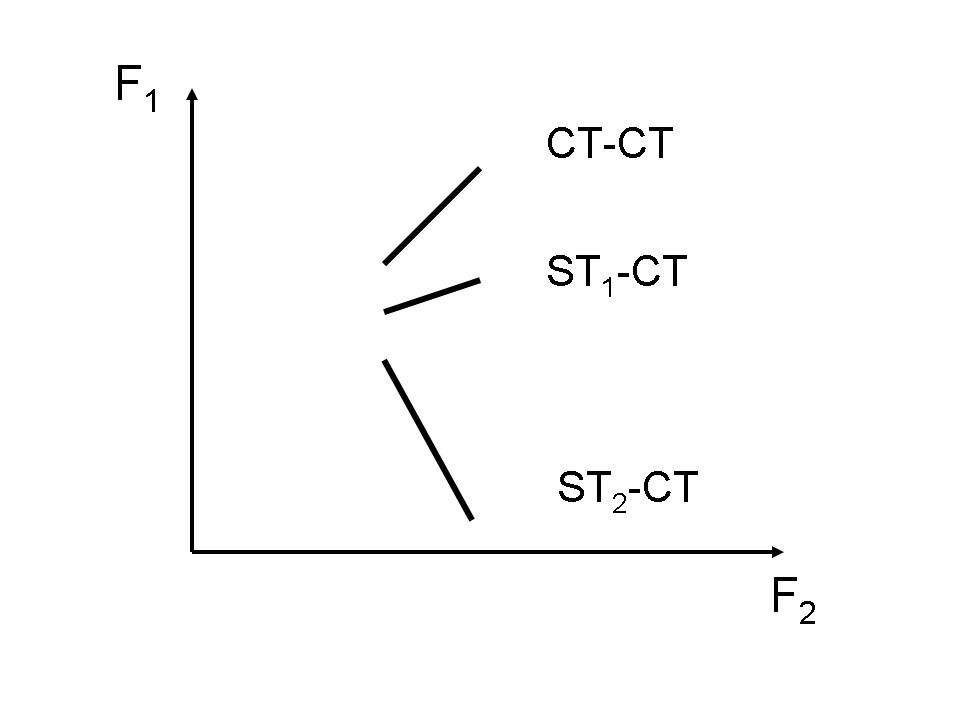
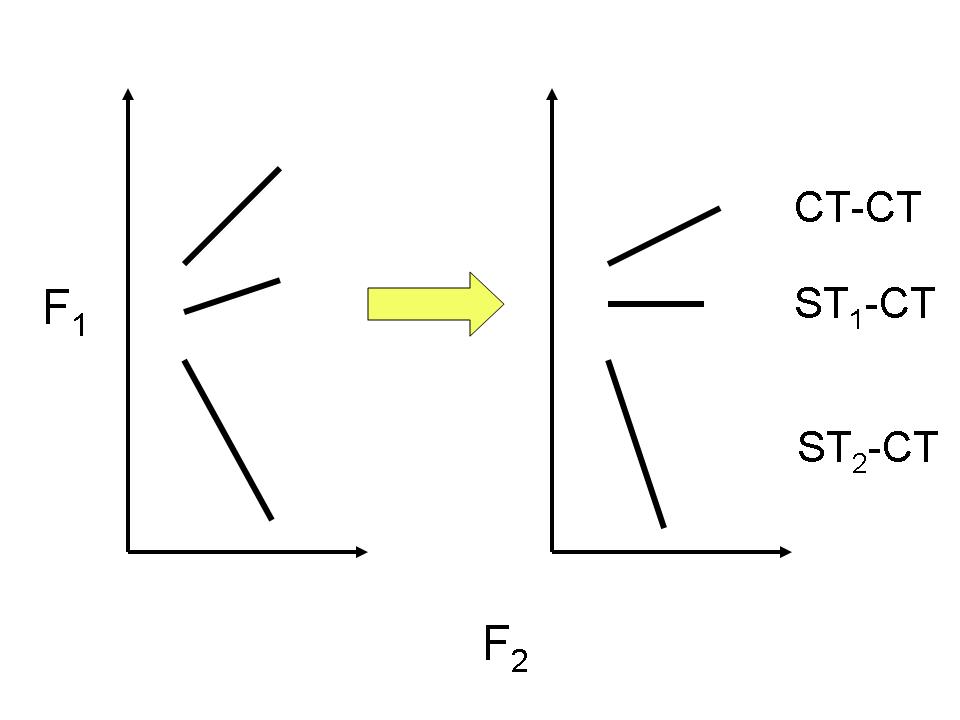
The slopes of the lines in the spectrum are calculated as the ratio, , of second order quadrupolar broadenings of the transitions involved. Thus for CT-CT, for ST1-CT, and for ST2-CT [10, 8]. The spectrum is typically sheared according to the to give the isotropic spectrum in the dimension [7]. Figure 4 shows the effect of shearing for the ST1-CT portion to give an isotropic projection on the F1 axis.
Results of the 1QSTMAS experiment for 17O in silica are presented in the next section.
4 Results
Phase cycling STMAS experiments were performed on enriched to 10% . The sample was graciously provided by Marek Pruski at Iowa State University. All experiments were performed on a 14.09 T magnet with a 3.2 mm probe and 10 kHz sample spinning. Spectra have been referenced to the frequency of 81.312792 MHz. The theory presented in Equation 4 implies that phase cycling of the individual pulses influences the change in coherence orders available in an experiment. Selection of the coherence transfer pathway is determined by Equation 5. The objective is to test whether phase cycling influences coherence orders in the spectrum. A 1QSTMAS experiment was implemented varying the phase of the first, second, and fifth pulses in the pulse sequence shown in Figure 2. In this implementation of the pulse sequence, the third pulse is not phase cycled and the fourth pulse does not give a change in coherence order by Equation 5. All spectra presented have been sheared to give the ST1-CT isotropic along the F1 axis, unless otherwise stated.
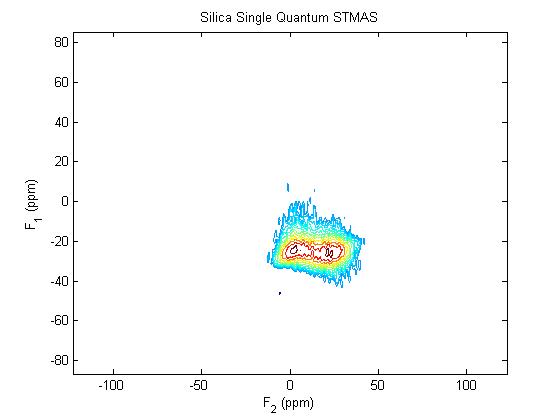
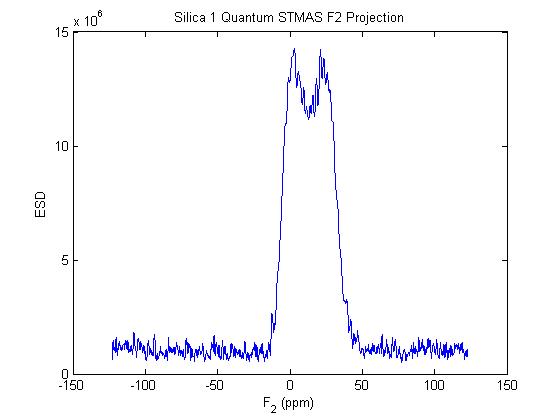
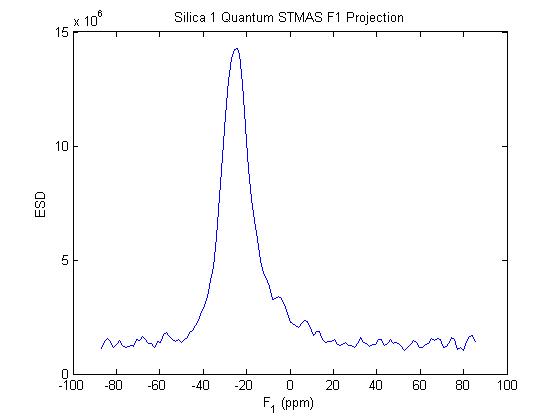
Figure 5 is a contour plot of the result of a 1QSTMAS experiment performed with 4 phases each for the first, second, and fifth pulses. This phase cycling will be considered the standard phase cycling. Figures 6 and 7 give the projections along the and dimensions. The projection is the spectrum obtained with a reduction in first order broadening from sample spinning. Second order broadening is still present, resulting in what appears to be two peaks in the spectrum. The dimension shows a narrowing of the spectrum from reduction of the second order broadening using the ST1-CT coherences.
The phase cycle of was varied by 1, 2, 4, or 8 phases while phases were cycled normally for all other pulses. The spectral width in is 100 kHz while that in is 10 kHz. For each phase, I performed the experiment twice. Once with the number of acquisitions constant across phase changes (the number of complete phase cycles varied across phase changes), and once with the number of complete phase cycles constant across phase changes (the number of acquisitions varied across phase changes). The metrics used for comparison are the total two-dimensional integrated area of the spectrum and the full width at half max (FWHM) of the projection. The results are summarized in Table 1.
| Number of | ||||
|---|---|---|---|---|
| Phases | 32 Complete Phase Cycles | 512 complete acquisitions | ||
| Integral () | FWHM (ppm) | Integral () | FWHM (ppm) | |
| 8 | 11.9 0.00000170 | 14.24 0.018 | 1.47 0.00000447 | 14.92 0.025 |
| 4 | 5.85 0.00000218 | 12.89 0.021 | 1.52 0.00000417 | 13.49 0.023 |
| 2 | 3.01 0.00000310 | 12.89 0.020 | 1.41 0.00000433 | 14.92 0.021 |
| 1 | 1.53 0.00000431 | 13.50 0.024 | 1.52 0.00000421 | 13.49 0.023 |
The integrals in the experiments with 32 complete phase cycles show a trend consistent with the increase in the number of acquistions defined by the phases. For example, the number of acquisitons for a complete phase cycle with is 16 while for is is 32. The number of acquistions for a complete phase cycle is equal to where is the number of phases for the -th pulse. Thus the integral values double as the number of phases double. Variation in the FWHM over acquisitions are repeatable, but the reason is not clear. These results gerenally correspond to those reported in phase cycling in MQMAS experiments [5]. In particular, in STMAS experiments each acquisition adds constructively regardless of phase cycling.
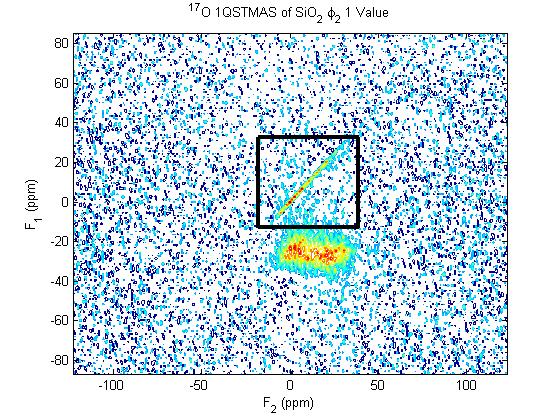
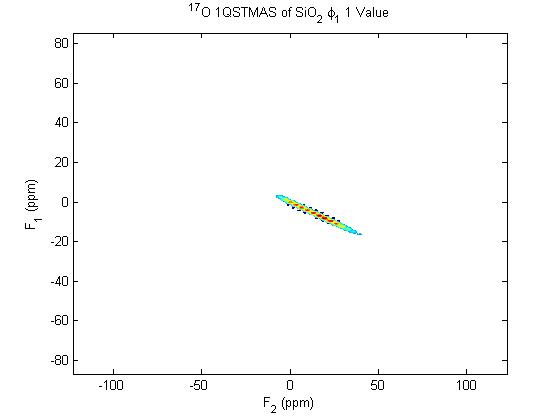
Phase cycling on and produced altogether different results. The phase cycle for each was varied by 1 and 2 phases while all other phases were cycled normally. Data for each experiment consist of 32 complete phase cycles. Results for 1 value of are shown in Figure 8. The spectrum shows the appearance of a CT-CT coherence line which does not show up in the 4 phase cycle spectrum. Likewise, Figure 9 shows a CT-CT line, though with less magnitude.
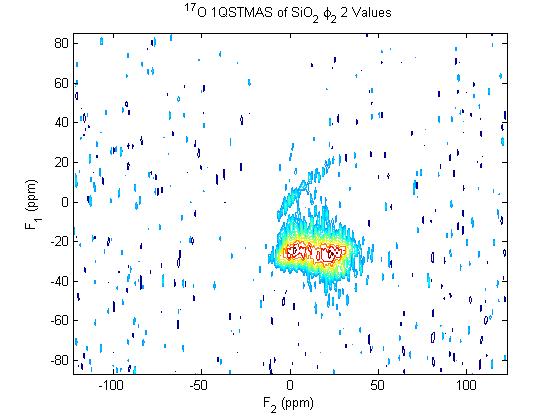
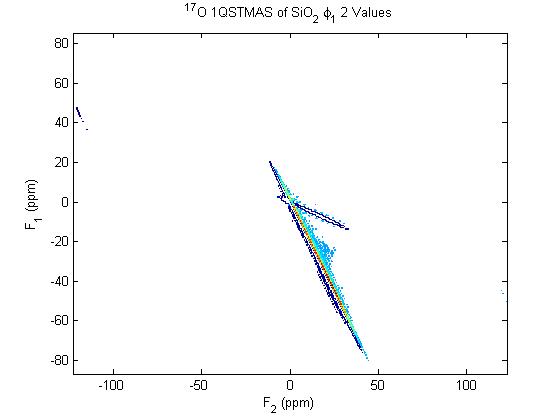
Figures 10 and 11 show results for phase cycling of 1 and 2 values, respectively. These spectra show lines that do not appear to correspond to CT-CT, ST1-CT, or ST2-CT coherences. Furthermore, the spectra appear to be shifted in frequency along the F1 axis compared to the 4 phase cycle spectrum of Figure 6.
5 Conclusion
Results for phase cycling of the first and second pulses in the 1QSTMAS experiment contrast with results obtained by phase cycling in MQMAS experiments performed by Hajjar, et al. [5]. Experiments performed on the 1QSTMAS experiment in this work show that phase cycling may or may not affect the spectrum. In particular, a decrease in FWFM of up to 14% can be achieved. Furthermore, cycling may result in the CT-CT coherence appearing in the spectrum as well as the ST1-CT coherence. Cycling of results in as yet undetermined lines appearing in the spectrum. Although it has been stated that CT-CT transitions cannot be removed from the spectrum [7], clearly this study shows that phase cycling does have an influence over appearance of these transitions. A possible explanation might be that phase cycles of 1 and 2 produce a wider variety of coherence orders than the 4 phase cycle. According to Equation 4, a phase cycle of 1 allows … coherence orders. A phase cycle of 2 allows …-3,-1,1,3,… coherence orders. On the other hand, a 4 phase cycle would only allow …-4,1,5,… coherence orders. Receiver phase cycling defined in Equation 5 my not be able to completely remove the allowed coherence orders for phase cycles of 1 and 2.
References
- [1] Slichter CP. Principles of Magnetic Resonance. Springer-Verlag, 1990.
- [2] Trebosc J, Amoureux JP, and Gan ZH. Comparison of high-resolution solid-state nmr mqmas and stmas methods for half-integer quadrupolar nuclei. Solid State Nuclear Magnetic Resonance, 31:1, 2007.
- [3] Frydman L and Harwood JS. Isotropic spectra of half-integer quadrupolar spins from bidimensional magic angle spinning nmr. J Am Chem Soc, 117:5367, 1995.
- [4] Ernst R, Bodenhausen G, and Wokaun A. Principles of Nuclear Magnetic Resonance in One and Two Dimensions. Oxford University Press, 1994.
- [5] Hajjar R, Millot Y, and Man PP. Phase cycling in mqmas sequences for half-integer quadrupolar spins. Prog NMR Spec, 57:306, 2010.
- [6] Ashbrook SE. Recent advances in solid state nmr of quadrupolar nuclei. Phys Chem Chem Phys, 11:6892, 2009.
- [7] Ashbrook SE and Wimperis S. High resolution nmr in quadrupolar nuclei of solids: the satellite transition magic angle spinning (stmas) experiment. Prog NMR Spec, 45:53, 2004.
- [8] Ashbrook SE and Wimperis S. Satellite transition mas nmr of spin i = 3/2, 5/2, 7/2, 9/2 nuclei. J Mag Res, 156:269, 2004.
- [9] Gan Z. Isotropic nmr spectra of half-integer quadrupolar nuclei using satellite transitions and magic angle spinning. J Am Chem Soc, 122:3242, 2000.
- [10] Gan Z. Satellite transition magic angle spinning nuclear magnetic resonance of half integer quadrupolar nuclei. J Chem Phys, 114:10845, 2001.