The study of time series of monthly averaged values of solar 10.7 cm radio flux from 1950 to 2010
E.A. Bruevich a , V.V. Bruevich b, G.V. Yakunina c
a,b,c Sternberg Astronomical Institute, Moscow State University,
Universitetsky pr., 13, Moscow 119992, Russia
e-mail: ared-field@yandex.ru, bbrouev@sai.msu.ru, cyakunina@sai.msu.ru
Abstract. Prior to 1947, the activity of the Sun was assessed by the relative numbers of sunspots (W). The 10.7 cm radio emission (frequency of 2.8 GHz) for observations of the variability of radiation of chromosphere and the lower corona 10.7 cm radio flux () became used from 1947. For the are available more detailed observational archive data, so this activity index more often than the other indices is used in the prediction and monitoring of the solar activity. We have made the analysis of time series of with the use of different mother wavelets: Daubechies 10, Symlet 8, Meyer, Gauss 8 and Morlet. Wavelet spectrum allows us not only to identify cycles, but analyze their change in time. Each wavelet has its own characteristic features, so sometimes with the help of different wavelets it can be better identify and highlight the different properties of the analyzed signal. We intended to choose the mother wavelet, which is more fully gives information about the analyzed index . We have received, that all these wavelets show similar values to the maximums of the cyclic activity. However, we can see the difference when using different wavelets. There are also a number of periods, which, perhaps, are the harmonics of main period. The mean value of 11-year cycle is about 10.2 years. All the above examples show that the best results we get when using wavelets Morlet, Gauss (real-valued) and multiparameter family of wavelets Morlet and Gauss (complex-valued).
Key words. Solar cycle: observations, solar activity indices, wavelet spectrum.
1. Introduction
The nature of solar activity is very complex. It has become of great practical and societal importance to predict solar activity and space climate. There are some important global indices of solar activity which allow us to monitor the situation on the sun and to build various forecasts. We have studied earlier these indices and their mutual correlation during the solar cycles 21 - 23 in (Bruevich & Yakunina 2011; Borisov et al. 2012). The high degree of correlation of the 10.7 cm flux with all global indices suggests some dependence upon common plasma parameters and that their sources are spatially close. Another strong correspondence is between 10.7 cm flux and full-disc X-ray flux. When activity is high, they are well-correlated; however, when activity is low, the X-rays are too weak to be detected, while some 10.7 cm emission in excess of the ”Quiet Sun Level” is always present (Kruger 1979). Our study of the connection between 10.7 cm flux and full-disc X-ray flux (Bruevich & Yakunina 2011; Bruevich & Bruevich 2013) also confirm the conclusions of Kruger (1979). Thus we have enhanced 10.7 cm radiation when the temperature, density and magnetic fields are enhanced. So is a good measure of general solar activity.
2. 10.7 - cm solar radio flux and other global activity indices
The most popular index - sunspot number SSN (also known as the International sunspot number, relative sunspot number, or Wolf number) is a quantity that measures the number of sunspots and groups of sunspots present on the surface of the sun.
The historical sunspot record was first put by Wolf in 1850s and has been continued later in the 20th century until today. Wolf’s original definition of the relative sunspot number for a given day as Number of Groups + Number of Spots visible on the solar disk has stood the test of time. The factor of 10 has also turned out to be a good choice as historically a group contained on average ten spots. Almost all solar indices and solar wind quantities show a close relationship with the SSN. (Svalgaard et al. 2011; Svalgaard & Cliver 2010). In our paper we use the proper homogeneity calibrations of SSN from (National Geophysical Data Center. Solar Data Service 2013), see Figure 1.
At the present time the 10.7 - cm solar radio flux is measured at the Dominion Radio Astrophysical observatory in Penticton, British Columbia by the Solar Radio Monitoring Programme. is a useful proxy for the combination of chromospheric, transition region, and coronal solar EUV emissions modulated by bright solar active regions whose energies at the Earth are deposited in the thermosphere.(Tobiska et al. 2008) pointed the high EUV - correlation and used this in the Earth’s atmospheric density models.
According to (Tapping & DeTracey 1990) the 10.7 - cm emission from the whole solar disc can be separated on the basis of characteristic time-scales into 3 components: (i) transient events associated with flare and similar activity having duration less than an hour; (ii) slow variation in intensity over hours to years, following the evolution of active regions in cyclic solar activity designated as S-component; (iii) a minimum level below which the intensity never falls - the ”Quiet Sun Level”. The excellent correlation of S-component at 10.7 cm wavelength with full-disc flux in Ca II and MgII was discussed by (Donnelly et al. 1983 ). The 10.7 cm flux resembles the integrated fluxes in UV and EUV well enough to be used as their proxy (Chapman & Neupert 1974; Donnelly et al.1983; Bruevich & Nusinov 1984; Nicolet & Bossy 1985; Lean 1987)
This radio emission comes from high part of the chromosphere and low part of the corona. radio flux has two different sources: thermal bremsstrahlung (due to electrons radiating when changing direction by being deflected by other charged participles - free-free radiation) and gyro-radiation (due to electrons radiating when changing direction by gyrating around magnetic fields lines). The (iii) a minimum level component (when SSN is equal to zero as it was at the minimum of the cycle 24 and local magnetic fields are negligible) is defined by free-free source. When the local magnetic fields become strong enough at the beginning of the rise phase of solar cycle and solar spots appear the gyro-radiation source of radio flux begins to prevail over free-free so (i) and (ii) components begin to grow strongly.
The S-component comprises the integrated emission from all sources on solar disc. It contains contribution from free-free and gyroresonance processes, and perhaps some non-thermal emission (Gaizauscas & Tapping 1998). The relative magnitude of these processes is also a function of observing wavelength. Observations of emission from active regions over the wavelength range 21-2 cm suggest that at 21 cm, free-free emission is dominant, whereas at 6 cm, the contribution from gyroresonance is larger. At a wavelength of 10 cm, the two processes are roughly equal in importance. At a wavelength of 2-3 cm, the emission is again mainly free-free, possible with a non-thermal component (Gaizauscas & Tapping 1998). The spatial distributions of two thermal processes are different; the gyroresonant emission originates chiefly in the vicinity of sunspots, where the magnetic fields are strong enough, while the free-free emission is more widely-distributed over the host region complex (Tapping & DeTracey 1990).

The intensities of the Ca II and Mg II spectral lines are primary functions of chromospheric density and temperature, while the soft X-rays are produced in the corona. The high degree of correlation of the 10.7 cm flux with all these quantities suggests some dependence upon common plasma parameters and that their sources are spatially close. Another strong correspondence is between 10.7 cm flux and full-disc X-ray flux. When activity is high, they are well-correlated; however, when activity is low, the X-rays are too weak to be detected, while some 10.7 cm emission in excess of the ”Quiet Sun Level” is always present (Kruger 1979). Our study of the connection between 10.7 cm flux and full-disc X-ray flux (Bruevich, & Yakunina 2011) also confirm the conclusions of (Kruger 1979).
Thus we have enhanced 10.7 cm radiation when the temperature, density and magnetic fields are enhanced. So is a good measure of general solar activity.
The 280 nm Mg II solar spectrum band contains photospheric continuum and chromospheric line emissions. The Mg II h and k lines at 279.56 and 280.27 nm, respectively, are chromospheric in origin while the weakly varying wings or nearby continuum are photospheric in origin.
Solar irradiance is the total amount of solar energy at a given wavelength received at the top of the earth’s atmosphere per unit time. When integrated over all wavelengths, this quantity is called the total solar irradiance (TSI) previously known as the solar constant. Regular monitoring of TSI has been carried out since 1978. From 1985 the total solar irradiance was observed by Earth Radiation Budget Satellite (EBRS). We use the NGDC TSI data set from combined observational data of several satellites which were collected in NASA archive data (National Geophysical Data Center. Solar Data Service 2013). The importance of UV/EUV influence to TSI variability (Active Sun/Quiet Sun) was pointed by (Krivova & Solanki 2008).
3. The choice of mother wavelet for our study
The history of wavelets is not very old, at most 15 to 20 years. There are lots of successes for the community to share. Fourier techniques were liberated by the appearance of windowed Fourier methods that operate locally on a time-frequency approach. The wavelets bring their own strong benefits to that environment: a local outlook, a multiscaled outlook, cooperation between scales, and a time-scale analysis. They demonstrate that sines and cosines are not the only useful functions and that other bases made of weird functions serve to look at new signals, as strange as most fractals or some transient signals. The choice of wavelet is dictated by the signal or image characteristics and the nature of the signal application. If you understand the properties of the analysis and synthesis wavelet, you can choose a wavelet that is optimized for your application.
We tried to choose the wavelet most useful for the analysis of observational data of different indices of solar activity. In this paper we analyzed the different mother wavelets for the study of data (as a measure of general solar activity).
Modern methods of spectral analysis, in particular wavelet analysis, allow us to successfully carry out the processing of data of observations of the solar activity on different time scales (Morozova et al. 1999).
In this paper we have made the analysis of time series of with the use of different mother wavelets: Daubechies 10, Simlet 8, Meyer, Gauss 8 and Morlet (real and complex). It’s known that Fourier analysis consists of breaking up a signal into sine waves of various frequencies. Similarly, wavelet analysis is the breaking up of a signal into shifted and scaled versions of the original (or mother) wavelet.
The wavelets bring their own strong benefits to that environment: a local outlook, a multiscaled outlook, cooperation between scales, and a time-scale analysis. They demonstrate that sines and cosines are not the only useful functions and that other bases made of weird functions serve to look at new foreign signals, as strange as most fractals or some transient signals. The wavelets are the localized functions constructed with help of one so-called mother wavelet by shift operation on argument (b) :
and scale change (a):
The wavelet time-scale spectrum C(a,b) is the two-arguments function. Note than scale change ”a” is measured in reversed-frequency units and argument ”b” is measured in time units:
Wavelet analysis is successfully applied for the processing of time series of astronomical observations. In (Vityazev 2001) it has been analyzed the possibility of using of various mother wavelets for a set of astronomical applications. The choice of wavelet is dictated by the signal or image characteristics and the nature of the application. If you understand the properties of the analysis and synthesis wavelet, you can choose a wavelet that is optimized for your application. Wavelet families vary in terms of several important properties. Examples include:
- support of the wavelet in time and frequency and rate of decay;
- symmetry or antisymmetry of the wavelet. The accompanying perfect reconstruction filters have linear phase;
- number of vanishing moments. Wavelets with increasing numbers of vanishing moments result in sparse representations for a large class of signals and images;
- regularity of the wavelet. Smoother wavelets provide sharper frequency resolution. Additionally, iterative algorithms for wavelet construction converge faster.
3.1 Morlet wavelet
The Morlet wavelet is suitable for continuous analysis. The Morlet wavelet - is the plane wave, modulated by Gaussian function:
On Figure 2 we see the Morlet wavelet function .
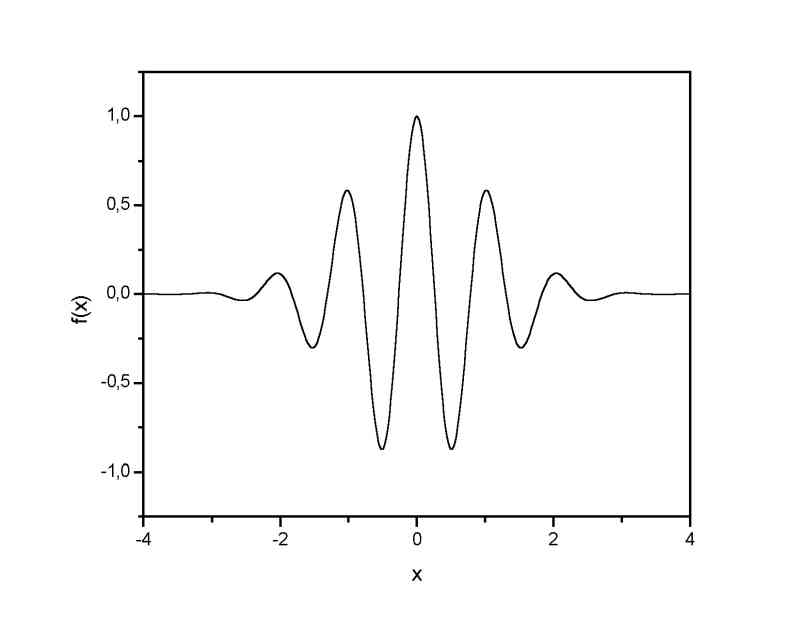
In mathematics, the Morlet wavelet (or Gabor wavelet) is a wavelet composed of a complex exponential (carrier) multiplied by a Gaussian window (envelope). In 1946, physicist Dennis Gabor, applying ideas from quantum physics, introduced the use of Gaussian-windowed sinusoids for time-frequency decomposition, which he referred to as atoms, and which provide the best trade-off between spatial and frequency resolution. These are used in the Gabor transform, a type of short-time Fourier transform. In 1984, Jean Morlet introduced Gabor’s work to the seismology community and, with Goupillaud and Grossmann, modified it to keep the same wavelet shape over equal octave intervals, resulting in the first formalization of the continuous wavelet transform.
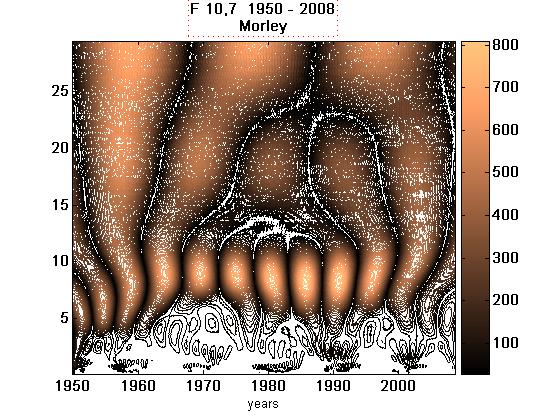
On Figure 3 we see the results of the continuous wavelet transform analysis (with help of Morlet mother vawelet) of time series of monthly averaged . Plane XY corresponds to the time-frequency plane (a, b): a - Y (Cyclicity, years), b - X- (Time, years). The C(a,b) coefficients characterizing the probability amplitude of regular cyclic component localization exactly at the point (a, b), are laid along the Z axis. At Figure 3 we see the projection of C(a,b) to (a, b) or (X, Y) plane. This projection on the plane (a, b) with isolines allows to trace the changes of the coefficients on various scales in time and reveal a picture of local extremum of these surfaces. It is the so-called skeleton of the structure of the analyzed process. In (Vityazev 2001) for processing of time series of astronomical observations the preference is given to the Morlet mother wavelet. The interpretation of Morlet-wavelet images is similar to the interpretation of the results of Fourier analysis of data sets. We can also note that the configuration of Morlet wavelet is very compact in frequency, which allows us the most accurately (compared with other wavelets) to determine the localization of instantaneous frequency of observed signal. We can see the main 11-yr cycle of activity. The most probable value of this cyclicity is about 10 years. We also can see a set of quassi-biennial cycles inside of every 11-yr cycle which duration vary from 3 to 2.5 year.
3.2 Daubechies wavelet
We see the Daubechies 8 wavelet function on Figure 4.
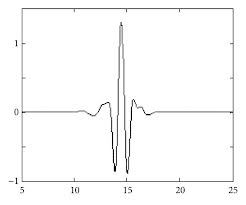
The Daubechies wavelets, based on the work of Ingrid Daubechies, are a family of orthogonal wavelets defining a discrete wavelet transform and characterized by a maximal number of vanishing moments for some given support. With each wavelet type of this class, there is a scaling function (called the father wavelet) which generates an orthogonal multiresolution analysis.
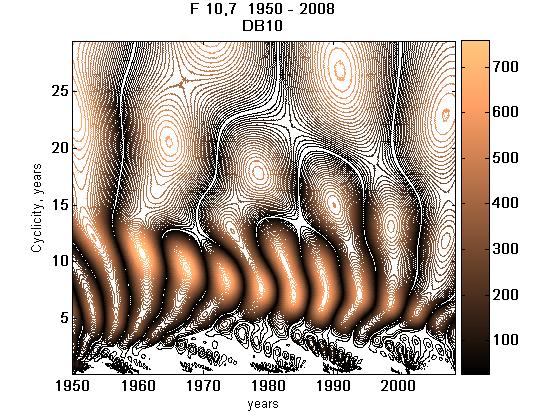
On Figure 5 we demonstrate our analysis of radio emission with the help of Daubechies 8 mother wavelet. This study of time series of shows that the previous cycles affect the subsequent cycles. This is connected with peculiarity of this wavelet, its wider coverage of the sample studied observations. But such a wide filter leads to more blurred values which determine the maximum probability of the determination of duration of the cycle.
3.3 Simlet wavelet
The Simlet N wavelets are also known as Daubechies’ least-asymmetric wavelets. The symlets are more symmetric than the extremal phase wavelets. In Simlet N, N is the number of vanishing moments.
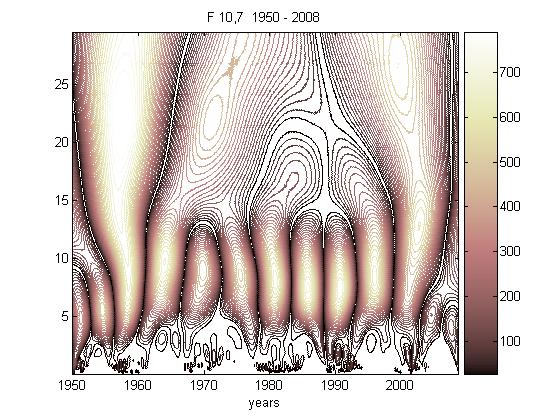
On Figure 6 we demonstrate the analysis of radio emission with the help of Simlet 8 mother wavelet. We can show that time-frequency parameters in this case have much more blurred contours around the maximums. Thus, errors in determining the most probable values of the cycle’s duration are increased compared with the study of a given series of observations using the wavelet Morlet.
3.4 Meyer wavelet
The Meyer’s wavelets are the orthogonal wavelets proposed by Yves Meyer. These mother wavelets are defined in a such a way to avoid the slow decay in the space domain.
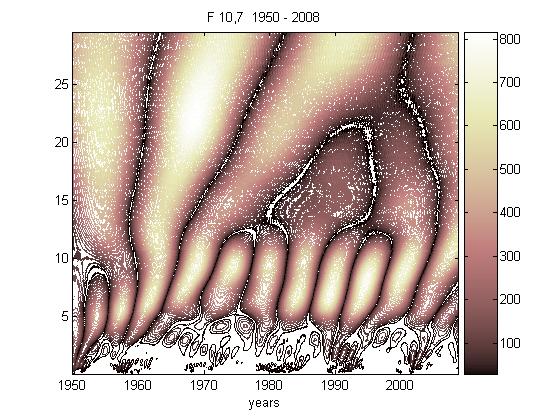
On Figure 7 we demonstrate the analysis of radio emission with the help of Meyer mother wavelet. We also see that time-frequency parameters in this case are not as good as in the case of Morlet wavelet. Thus, errors in cycle’s duration determination are increased compared with the study of a given series of observations using the Morlet wavelet.
3.5 Gaussian wavelet
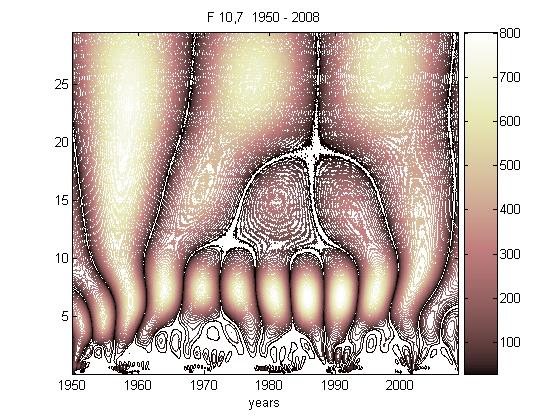
The results of processing observation series using the Gaussian wavelet are very similar to the results of processing with the Morlet wavelet. We also can see along with a basic 11-yr cycle of activity the quassi-biennial cyclicity.
On Figure 8 we demonstrate the analysis of radio emission with the help of Gaussian 8 mother wavelet. We see that time-frequency parameters in this case are practically coinciding with the characteristics obtained with the use of the mother wavelet Morlet. Errors in determination of the most probable values of duration of the cycles are not more than in case when we use the Morlet wavelet. The differences between these wavelet studies we see in small details, more concerning quassi-biennial cycles.
3.6 Complex Morlet wavelet
A complex Morlet wavelet is defined by:
A complex Morlet wavelet is depending on two parameters: is a bandwidth parameter and is a wavelet center frequency.

On Figure 9 we show the analysis of time series of monthly averaged (1974 - 2010 years) with help a complex Morlet wavelet. In this case, there are two additional parameters that can be varied in accordance with the objectives set tasks and, as in the case of Fourier analysis, we get the array of coefficients which give us information not only about the frequency-temporal distribution of the amplitude and about the frequency-temporal distribution of the phase of the signal. The parameters of the mother wavelet Complex-valued Morlet 1-1.0 have the best determination of the 11-year cycle unless of cycles not well pronounced and irregular. It is also seen that the magnitude of the 23-rd cycle of activity for more than 12 years (this value we do not get with use of real-valued wavelet Morlet as a result analysis).
4. Summary and conclusions
Wavelet spectrum allows us not only to identify cycles, but analyze their change in time. Each wavelet has its own characteristic features, so sometimes with the help of different wavelets it can be better identify and highlight the different properties of the analyzed signal. We intended to choose the mother wavelet, which is more fully gives information about the analyzed solar index . These are Morlet and Gauss real-valued and Morlet complex-valued wavelets. With these wavelets we can study the solar cyclicity evolution of the most accurate form in every moment of time. We can see also a number of periods, which, perhaps, are the harmonics of main period. The complex-valued Morlet and Gauss wavelet analysis gives us the additional information about signal phase evolution. Note than the Daubechies 10 wavelet-analysis (more wide filter window) allows us to analyze the influence of the previous cycle to the next. The Mexican hat wavelet inhibits the main cyclicity and allows us to analyze the cyclicity of second- order. The analysis with all mother wavelet shows that the mean value of 11-year cycle is about 10.2 years during the period 1950 - 2000. The complex-valued Morlet wavelet analyzes shows the more long duration of 11-yr cyclicity for the cycle 23 - about 12 yr.
Acknowledgements The authors thank the RFBR grant 11-02-00843ap for support of the work.
References
Alekseev, I.Yu. & Gershberg, R.E. 1996, On spotting of red dwarf stars: direct and inverse problem of the construction of zonal model, Astronomy Report, 73, 589.
Baliunas, S.L., & Donahue, R.A., & Soon, W.H. et al. 1995, Chromospheric variations in main-sequence stars, Astrophysical Journal, 438, 269.
Borisov, A.A. & Bruevich, E.A. & Rozgacheva, I.K. & Yakunina, G.V. 2012, Solar Activity Indices in the Cycles 21-23, The Sun: New Challenges, Astrophysics and Space Science Proceedings, Vol-ume 30. ISBN 978-3-642-29416-7. Spring-er-Verlag Berlin Heidelberg, 221.
Bowman, B.R, & Tobiska, W.K., & Marcos, F.A. et al., 2008, A New Empirical Thermospheric Density Model JB2008 Using Solar and Geomagnetic Indices, AIAA/AAS Astrodynamics Specialist Conference, AIAA 2008-6438.
Bruevich, E.A., & Alekseev I.Yu. 2007, Spotting in stars with a low level of activity, close to solar activity. Astrophysics, 50, No 2, 187.
Bruevich, E.A., & Bruevich, V.V. 2013, Changed relation between solar 10.7 cm radio flux and some activity indices which describe the radiation at different altitudes of atmosphere. ArXiv e-prints, arXiv:1304.4545v1.
Bruevich, E.A., & Kononovich E.V. 2011, Solar and Solar-type Stars Atmosphere’s Activity at 11-year and Quasi-biennial Time Scales. Vestn. Mosk. Univ. Fiz. Astron., N1, 70. ArXiv e-prints, arXiv:1102.3976v1.
Bruevich, E.A., & Nusinov A.A, 1984, Spectrum of short-wave emission for aeronomical calculations for different levels of solar activity, Geomagnetizm i Aeronomiia, 24, 581.
Bruevich, E.A., & Yakunina, G.V., 2011 Solar Activity Indices in the Cycles 21 - 23, arXiv:1102.5502v1
Chapman, R.D., & Neupert, W.M., 1974, Slowly varying component of extreme ultraviolet solar radiation and its relation to solar radio radiation, J. Geophys. Res., 79, 4138.
Donnelly, R.F., & Heath, D.F., & Lean, J. L. & Rottman, G.J., 1983, Differences in the temporal variations of solar UV flux, 10.7-cm solar radio flux, sunspot number, and Ca-K plage data caused by solar rotation and active region evolution, J. Geophys. Res., 88, 9883.
Fligge, M., & Solanki, S.K., & Unruh, Y.C., & Frohlich, C., & Wehrli, C. 1998, A model of solar total and spectral irradiance variations. Astronomy & Astrophys. 335, 709.
Floyd, L., & Newmark, J., & Cook, J., & Herring, L., & McMullin, D. 2005, Solar EUV and UV spectral irradiances and solar indices. Journal of Atmospheric and Solar-Terrestrial Physics, 67, 3.
Gaizauscas, V. & Tapping, K.F., 1988, Compact sites at 2.8 cm wavelength of microwave emission inside solar active regions. Astrophys. J., 325, 912.
Ishkov, V.N. 2009, 1st Workshop on the activity cycles on the Sun and stars, Moscow, 18-10 December, Edited by EAAO, St-Petersburg, 57.
Janardhan, P. & Susanta, K.B. & Gosain, S., 2010 Solar Polar Fields During Cycles 21 - 23: Correlation with Meridional Flows, Solar Physics, 267, 267.
Janardhan, P. & Bisoi, S.K. & Ananthakrishnan, S & Tokumaru, M & Fujiki, K. 2011 Interplanetary scintillation signatures in the inner heliosphere, Geophysical Research Letters, 38, Issue 20, L20108.
Kleczek, J. 1952, Catalogue de l’activite’ des e’ruptions chromosphe’riques. Publ. Inst. Centr. Astron., 22.
Krivova, N.A., & Solanki, S.K., & Fligge, M., & Unruh, Y. C. 2003, Reconstruction of solar total and spectral irradiance variations in cycle 23: is solar surface magnetism the cause?, Astron. Astrophys. 339, L1.
Krivova, N. A., & Solanki, S. K. 2008, Models of solar irradiance variations: current status. Journal of Astrophysics and Astronomy, 29, 151.
Kruger, A. 1979, Introduction to Solar Radio Astronomy and Radio physics, D. Reidel Publ. Co., Dordrecht, Holland.
Lean, J. L., 1990, A comparison of models of the Sun’s extreme ultraviolet irradiance variations, J. Geophys. Res., 95, 11933.
Livingston, W., & Penn, M. J., & Svalgaard L., 2012, Decreasing Sunspot Magnetic Fields Explain Unique 10.7 cm Radio Flux, Astrophys. J., 757, N1, L8.
Lukyanova, R., & Mursula, K. 2011, Changed relation between sunspot numbers, solar UV/EUV radiation and TSI during the declining phase of solar cycle 23. Journal of Atmospheric and Solar-Terrestrial Physics 73, 235.
Nagovitsyn, Y.A., & Pevtsov, A.A., & Livingston W.C. 2012, On a possible explanation of the long-term decrease in sunspot field strength, Astrophysical Journal Letters, 758, L20.
National Geophysical Data Center. Solar-Geophysical Data Reports. 54 Years of Space Weather Data. 2009, http://www.ngdc.noaa.gov/stp/solar/sgd.html.
National Geophysical Data Center. Solar Data Service. Sun, solar activity and upper atmosphere data. 2013, http://www.ngdc.noaa.gov/stp/solar/solardataservices.html.
Nicolet, M., & Bossy, L., 1985, Solar Radio Fluxes as indices of solar activity, Planetary Space Sci., 33, 507.
Penn, M.J., & Livingston, W.C. 2006, Temporal Changes in Sunspot Umbral Magnetic Fields and Temperatures, Astrophysical Journal Letters, 649, L45.
Pevtsov A. A., & Nagovitsyn, Y. A., & Tlatov, A. G., & Rybak, A. L. 2011 Long-term Trends in Sunspot Magnetic Fields, Astrophysical Journal Letters, 742, L36.
Skupin, J., & Noyel, S.,& Wuttke, M.W., & Gottwald, M., & Bovensmann, H., & Weber, M., & Burrows, J. P. 2005, SCIAMACHY solar irradiance observation in the spectral range from 240 to 2380 nm, Advance Space Res., 35, 370.
Svalgaard, L., & Lockwood M., & Beer J. 2011, Long-term reconstruction of Solar and Solar Wind Parameters, http://www.leif.org/research/Svalgaard_ISSI_Proposal_Base.pdf.
Svalgaard, L. & Cliver E.W. 2010, Heliospheric magnetic field 1835-2009, J. Geophys. Res., 115, A09111.
Tapping, K.F., & DeTracey, B., 1990, The origin of the 10.7 cm flux, Solar Physics, 127, 321.
Tobiska, W.K., & Bouwer S.D., & Bowman, B.R., The development of new solar indices for use in thermospheric density modeling, 2008, J. Atmospheric & Solar-Terrestrial Phys.,70, 803.
Viereck, R., & Puga, L., & McMullin, D., & Judge, D., & Weber, M. & Tobiska, K. 2001, The MgII index: a proxy for solar EUV. Journal of Geophysical Research , 73, No 7, 1343.
Viereck, R.A., Floyd, L.E., Crane, P.C., Woods, T.N., Knapp, B.G., Rottman, G., Weber, M., Puga, L.C. and Deland, M.T. 2004, A composite MgII index spanning from 1978 to 2003. Space Weather, 2, No. 10, doi:10.1029/2004SW000084.
Vitinsky, Yu.,& Kopezky, M., & Kuklin G., 1986. The sunspot solar activity statistik, Moscow, Nauka.