∎
22email: rhopwood@imperial.ac.uk 33institutetext: T. Fulton 44institutetext: Blue Sky Spectroscopy, Lethbridge, AB, T1J0N9, Canada
University of Lethbridge, Lethbridge, AB T1K3M4, Canada 55institutetext: E. T. Polehampton 66institutetext: University of Lethbridge, Lethbridge, Alberta T1K3M4, Canada
Rutherford Appleton Laboratory, Chilton, Oxfordshire OX11 0QX, UK 77institutetext: I. Valtchanov 88institutetext: ESAC, P.O. Box 78, 28691 Villanueva de la Cañada, Madrid, Spain 99institutetext: D. Benielli 1010institutetext: Aix Marseille Université, CNRS, LAM (Laboratoire d’Astrophysique de Marseille) UMR 7326, 13388, Marseille, France 1111institutetext: P. Imhof 1212institutetext: Blue Sky Spectroscopy, Lethbridge, AB, T1J0N9, Canada
University of Lethbridge, Lethbridge, AB T1K3M4, Canada 1313institutetext: T. Lim 1414institutetext: Rutherford Appleton Laboratory, Chilton, Oxfordshire OX11 0QX, UK 1515institutetext: N. Lu 1616institutetext: NHSC/IPAC, 100-22 Caltech, Pasadena, CA 91125, USA 1717institutetext: N. Marchili 1818institutetext: Universitá di Padova, I-35131 Padova, Italy 1919institutetext: C. P. Pearson 2020institutetext: Rutherford Appleton Laboratory, Chilton, Oxfordshire OX11 0QX, UK
The Open University, Milton Keynes MK7 6AA, UK 2121institutetext: B. M. Swinyard 2222institutetext: Rutherford Appleton Laboratory, Chilton, Oxfordshire OX11 0QX, UK
University College London, Gower St, London, WC1E 6BT, UK
Herschel SPIRE FTS telescope model correction††thanks: Herschel is an ESA space observatory with science instruments provided by European-led Principal Investigator consortia and with important participation from NASA.
Abstract
Emission from the Herschel telescope is the dominant source of radiation for the majority of SPIRE Fourier transform spectrometer (FTS) observations, despite the exceptionally low emissivity of the primary and secondary mirrors. Accurate modelling and removal of the telescope contribution is, therefore, an important and challenging aspect of FTS calibration and data reduction pipeline. A dust-contaminated telescope model with time invariant mirror emissivity was adopted before the Herschel launch. However, measured FTS spectra show a clear evolution of the telescope contribution over the mission and strong need for a correction to the standard telescope model in order to reduce residual background (of up to 7 Jy) in the final data products. Systematic changes in observations of dark sky, taken over the course of the mission, provide a measure of the evolution between observed telescope emission and the telescope model. These dark sky observations have been used to derive a time dependent correction to the telescope emissivity that reduces the systematic error in the continuum of the final FTS spectra to 0.35 Jy.
Keywords:
SPIRE FTS Calibration Spectroscopy Herschel Observatory1 Introduction
The Spectral and Photometric Imaging REceiver (SPIRE: Griffin et al, 2010) is one of three focal plane instruments aboard the ESA Herschel Space Observatory (Pilbratt et al, 2010). SPIRE consists of an imaging photometric camera and an imaging Fourier transform spectrometer (FTS). The FTS provides simultaneous wide frequency coverage in the sub-millimetre with two bolometer arrays: SLW (447-990 GHz) and SSW (958-1546 GHz). As described by Griffin et al (2010), the SPIRE instrument optical bench is cooled to roughly 4.5 K, with the bolometric detectors at 0.3 K. In contrast, the operational temperature of the Herschel primary mirror is 80-90 K (Pilbratt et al, 2010) and so emission from the telescope dominates nearly all FTS data. Accurate removal of the telescope contribution is, therefore, an important stage of FTS data processing for all observations and crucial for observations of faint astronomical targets. Over the course of the mission, FTS spectra show an increase in background residual, after subtraction of the standard telescope model, with observations from later operational days (ODs) presenting continuum levels of as many as tens of Jy away from those predicted. Such significant residuals indicate the standard model fails to describe the telescope contribution sufficiently, over a long period of time. This paper reports an investigation into the Herschel telescope emission using FTS observations of a region of sub-millimetre dark sky in order to derive a time dependent correction to the telescope model. Section 2 describes the standard telescope emission model. The data set used to derive the correction is discussed in Sect. 3 and the derivation and application of the correction described in Sect. 4. Results and conclusions are presented in Sect. 5 and Sect. 6.
2 Herschel telescope model

We assume the Herschel telescope mirrors are black body emitters, with emissivity () determined from ground based tests by Fischer et al (2004). The emissivity of both clean and dust-contaminated mirror samples were measured (see Fig. 1). The model of the telescope () is constructed using the dust-contaminated Fischer et al (2004) emissivity best fit and two black body emitters for the primary (M1) and secondary (M2) mirrors as
| (1) |
where and are the temperatures of the primary and secondary mirrors, is in GHz, and are defined following Fischer et al (2004) as
| (2) |
and represents the Planck function
| (3) |
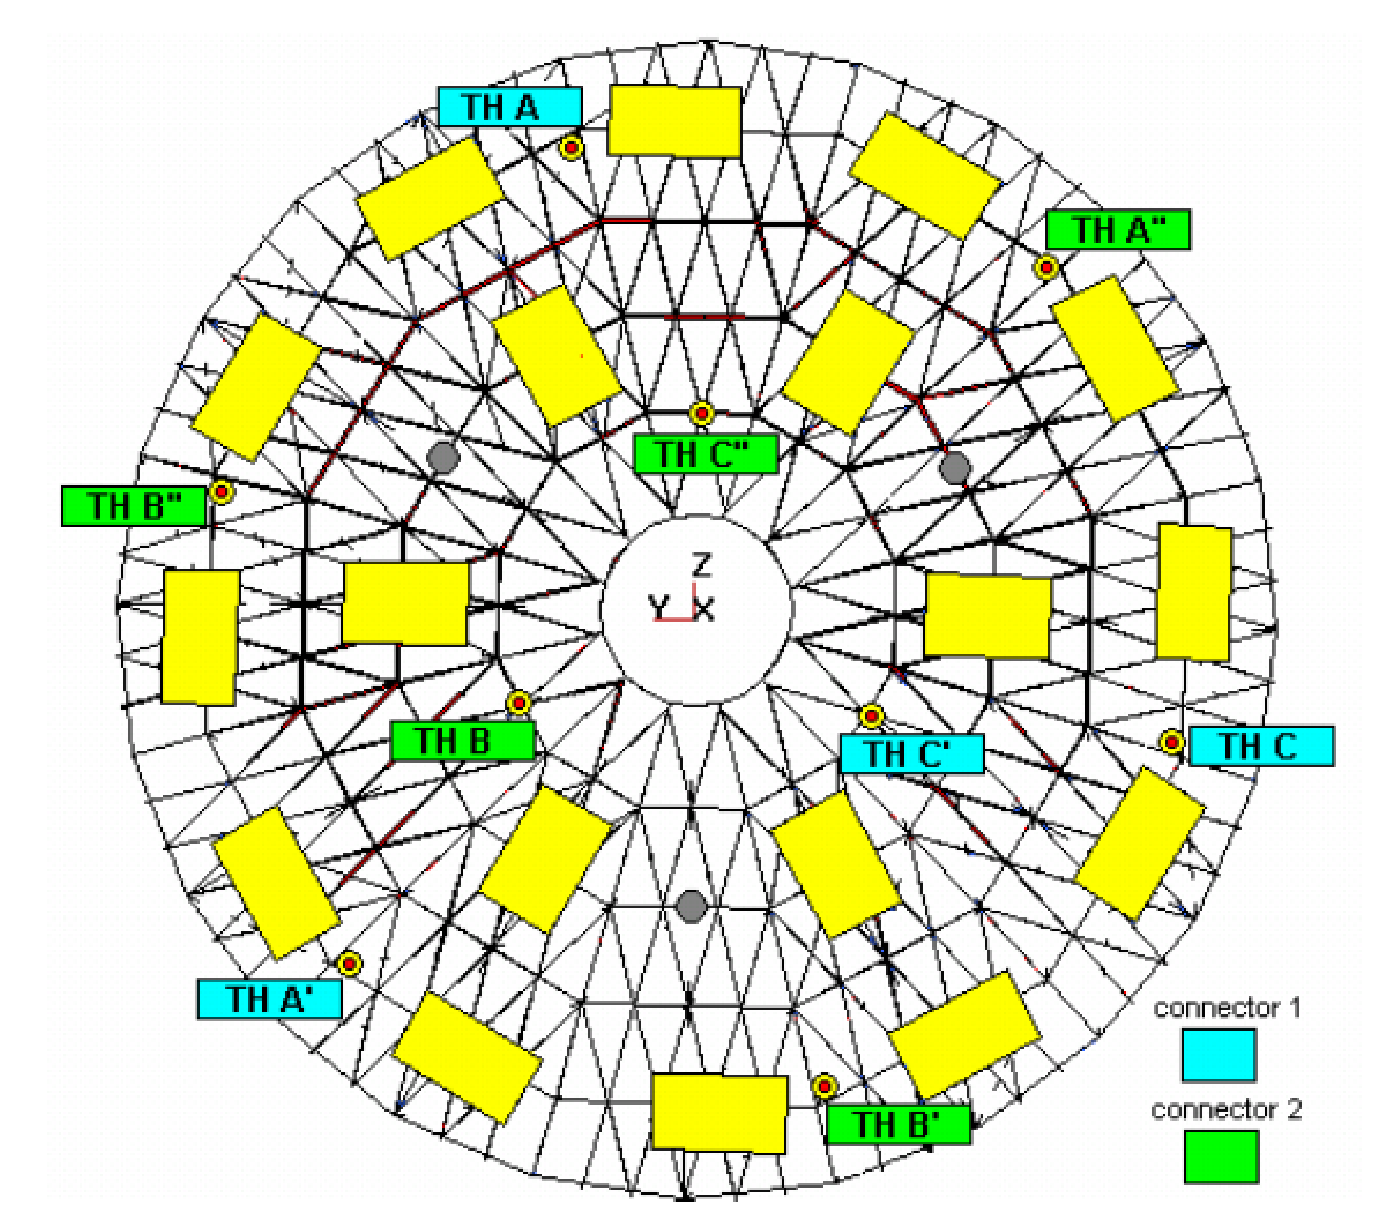
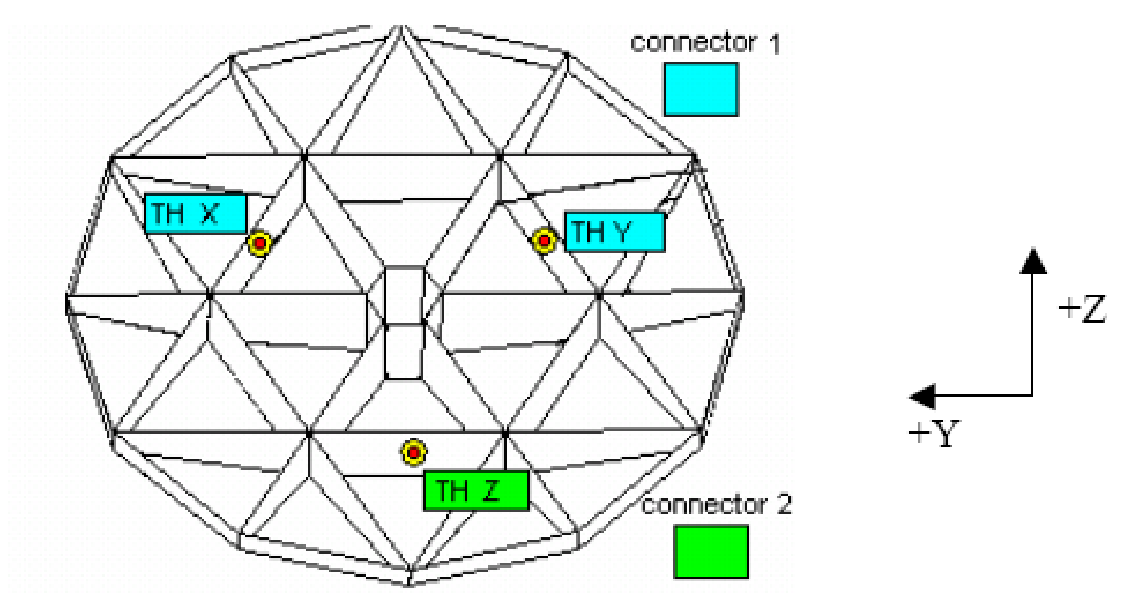
The temperatures of the Herschel telescope mirrors are measured by thermistors positioned on the back of each mirror, the locations of which are shown in Fig. 2. The thermistors are read out every 512 seconds and the resulting temperatures included in the satellite telemetry for each FTS observation.
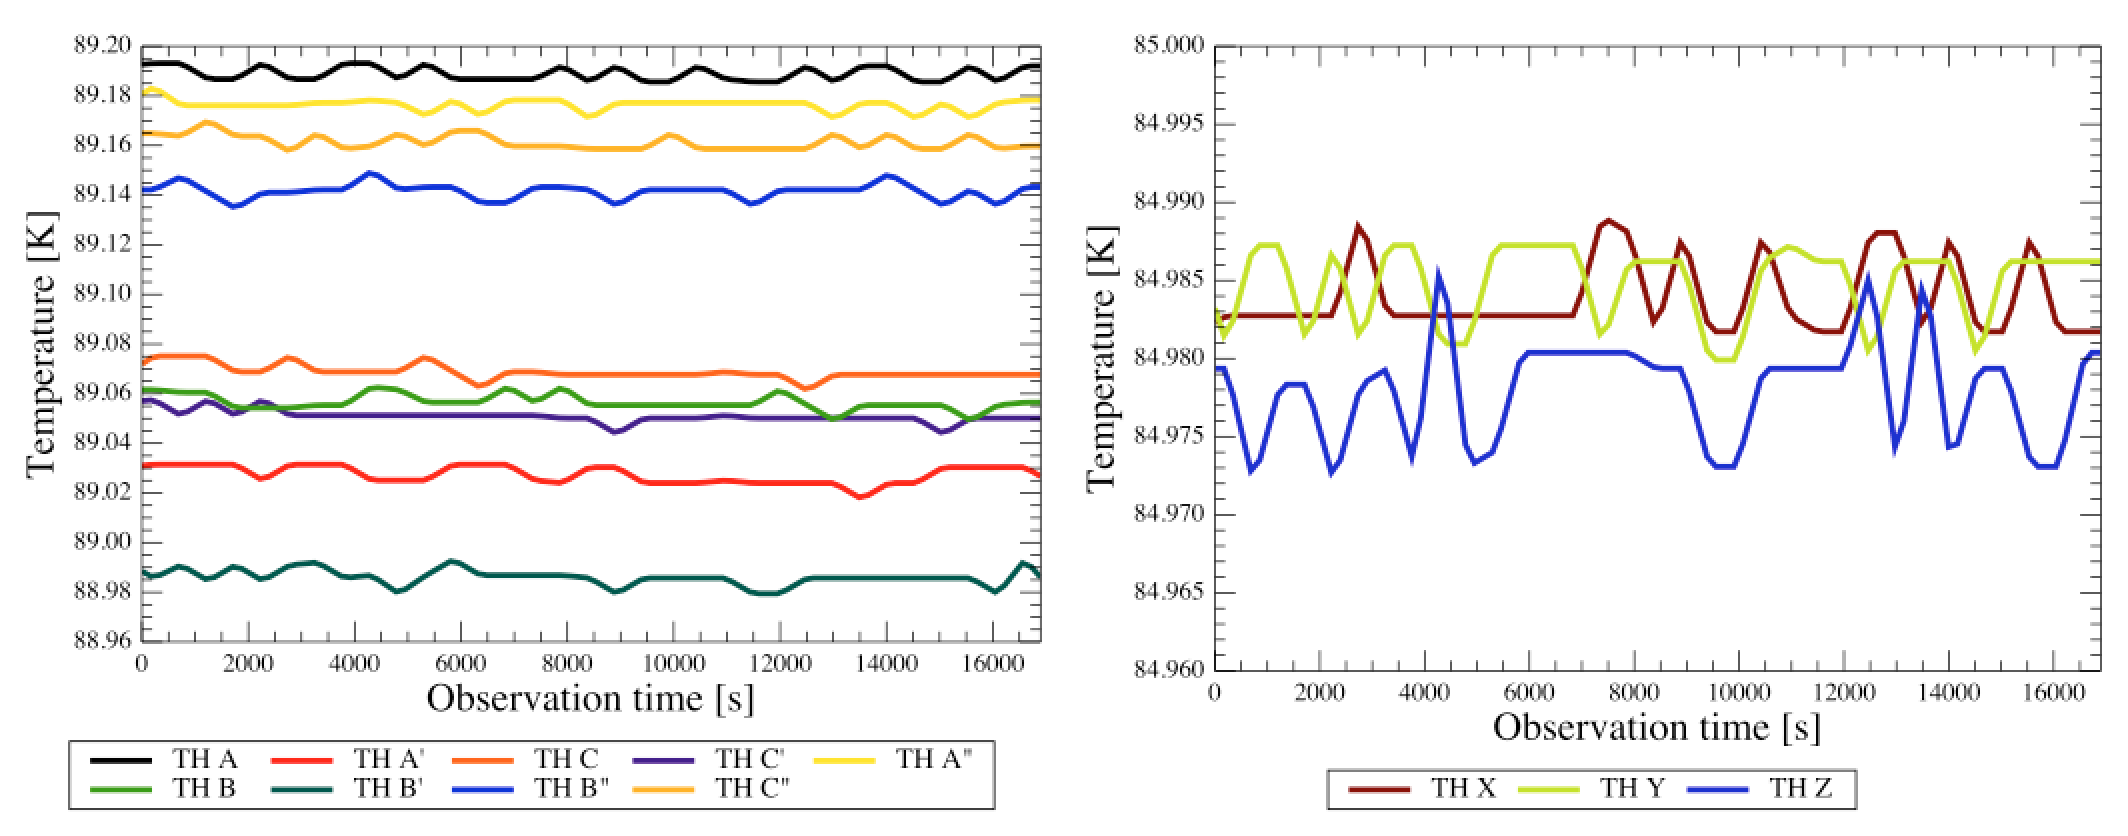
There are differences between thermometers in the overall temperature levels recorded, as shown in Fig. 3. As these levels are assumed to be stable over the time scale of an observation and each SPIRE detector views the whole telescope mirror, for any given observation the mean temperature is taken for each set of mirror thermometer timelines and time averaged when constructing .
3 Observations
Observations of the nominated SPIRE dark sky field act as a useful diagnostic for FTS calibration. These dark sky observations were regularly taken over the duration of the mission, with pointing coordinates of RA:17h40m12s and Dec:+69d00m00s (J2000). High resolution dark sky observations are available for most SPIRE FTS ODs and after OD 557 (22nd June 2010), a dark sky at least as long as the longest science observation was taken per pair of FTS ODs. All sparse, nominal mode observations of dark sky are listed on the Herschel public TWiki111http://herschel.esac.esa.int/twiki/bin/view/Public/SpireDailyDarkObservations. Assuming a perfect instrument and telescope subtraction and no contribution from real astronomical signal, a dark sky spectrum should purely consist of random noise distributed about zero. Any longterm trend away from this expected null signal, indicates a systematic divergence from the standard telescope model. Such trends, however, can be used to derive a time dependent empirical correction. The first indication of a change in observing conditions with time can be seen in Fig. 4, which compares primary and secondary mirror temperatures for all long ( repetitions) dark sky observations. There is a clear periodic trend that cycles over the scale of a year and is similar for both sets of temperatures, but the primary mirror temperature also exhibits an overall increase with time, whereas the secondary mirror temperature presents no such trend. The overall increase in implies a gradual change in observing conditions for the primary mirror during Herschel operations (e.g. due to a buildup of dust), which is not reflected in the telescope model by the time invariant emissivity term.


4 Correcting the telescope model
When reducing FTS data (see Fulton et al 2013a for details on the standard FTS pipeline), the telescope model is used in two places: firstly, for deriving the telescope relative spectral response function (; Swinyard et al 2013, Fulton et al 2013b) and secondly, to subtract the emission of the telescope from the extended calibrated spectrum. The measured voltage density spectrum (in units of V GHz-1) of an FTS observation can be expressed as the linear combination of contributions from the astronomical source (), the telescope () and the SPIRE instrument (). For a dark sky observation , the measured voltage density spectrum () contains only and giving
| (4) |
where = .
After accounting for the instrument emission, Eq. 4 reduces to
| (5) |
and at this stage, any dark sky observation can be used to calculate a daily telescope RSRF by dividing by the respective . A ratio of daily to generic telescope RSRF () can then be taken, where is derived from many dark sky observations (see Fulton et al. 2013 for full details of the derivation) and taken from the SPIRE FTS calibration tree. is compared to for many dark sky observations to derive a correction factor to the standard telescope model. The comparison is performed by taking ratios r, found per observation , as
| (6) |
The median of is taken to give a single value , per observation.
To optimise the correction to the telescope model for any given detector the following steps are taken:
-
•
A set of suitable observations is defined on a detector by detector basis. Primarily observations of the SPIRE dark sky field are used, however observations of extremely faint targets are included for some detectors to extend temporal coverage. In addition, observations of point sources can be included for off-axis detectors, however only after careful inspection for nearby source or extended background contamination.
- •
-
•
is calculated with a multiplicative correction factor applied to the M1 emissivity of . This correction factor is then adjusted by an arbitrary step size to provide an closer to 1.0. This process is repeated until is within 10-4 of 1.0. The optimised correction factors for SLWC3 are plotted in Fig. 6 as black and grey filled circles.
-
•
A fit, weighted by the associated uncertainties, is performed to the resulting optimised correction factors with a high order polynomial, and a separate linear function.
-
•
The final model correction (see Fig. 6) is constructed as a function of OD by combining:
-
–
the fitted polynomial at OD189, fixed over the performance verification phase of the mission (ODs 0-189);
-
–
the fitted polynomial between ODs 189-1280 for SSW and ODs 189-1308 for SLW;
-
–
and, due to limited OD coverage, the best linear fit for days above the polynomial OD limit (OD1280 for SSW and OD1308 for SLW), after normalising to the final polynomial value used.
-
–
-
•
There are several noisy detectors that are not reliably fitted due to high scatter in the associated values. A mean correction is used for these detectors (see Fig. 7).


From Fig. 4, we assume only the telescope’s primary mirror emissivity () has seen significant change over the Herschel mission and, therefore, a time dependent correction () is derived for and applied as a multiplicative factor to in . Including this correction factor in Eq. 1 gives
| (7) |
where is a constant that depends on the OD of a given observation.
The dashed blue lines in Figure 1 show that the change seen in emissivity due to is 1%. There is a linear correlation between the long term rise in M1 temperature (see Fig. 4) and , as shown in Fig. 8.

5 Results
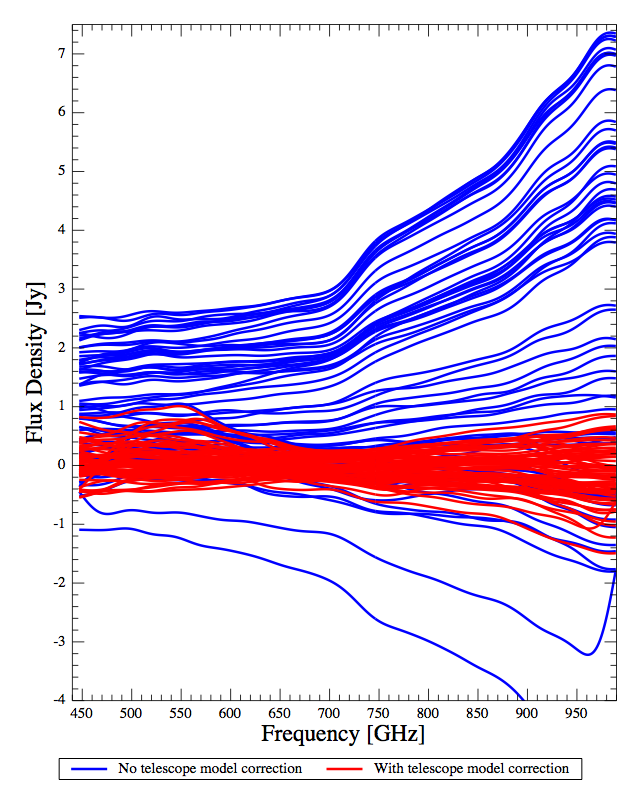
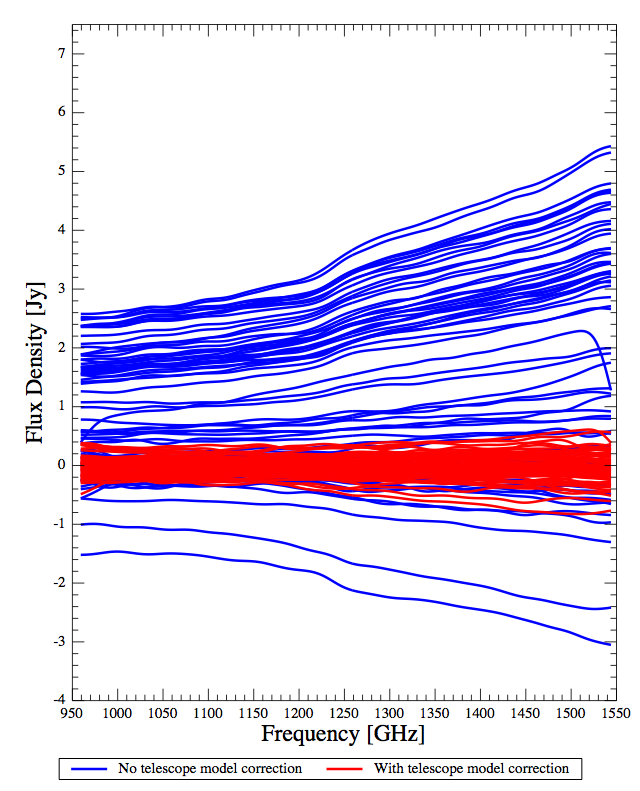
In Fig. 9, the telescope model correction is applied to the centre detectors for point source calibrated (standard pipeline level-2 products; see Fulton et al (2013a)) long ( 20 repetitions) dark sky observations and compared to the uncorrected results. A significant reduction in spread is seen for the corrected level-2 data, due to the improved telescope subtraction. For SLWC3 the telescope residual is reduced by up to 7 Jy and up to 5.5 Jy for SSWD4. The average spread for all unvignetted detectors, across the long dark sky observation set, is shown in Fig. 10, and illustrates the improvement seen for all detectors due to the telescope model correction.

6 Conclusions
An empirical correction to the telescope emissivity has been derived to compensate for changing conditions of the Herschel telescope over the course of the mission. Although this correction only adjusts the emissivity by 1%, it is essential for FTS data to avoid significant background residual in reduced spectra. Applying the correction to data across the mission gives an improvement on the continuum of up to 7 Jy for the centre detectors, with a mean error on the continuum of 0.4 Jy for SLWC3 and 0.3 Jy for SSWD4. A significantly improved background subtraction is seen for all detectors, reducing the average continuum offset error by at least 1 Jy.
Acknowledgements.
Herschel is an ESA space observatory with science instruments provided by European-led Principal Investigator consortia and with important participation from NASA. SPIRE has been developed by a consortium of institutes led by Cardiff University (UK) and including Univ. Lethbridge (Canada); NAOC (China); CEA, LAM (France); IFSI, Univ. Padua (Italy); IAC (Spain); Stockholm Observatory (Sweden); Imperial College London, RAL, UCL-MSSL, UKATC, Univ. Sussex (UK); and Caltech, JPL, NHSC, Univ. Colorado (USA). This development has been supported by national funding agencies: CSA (Canada); NAOC (China); CEA, CNES, CNRS (France); ASI (Italy); MCINN (Spain); SNSB (Sweden); STFC (UK); and NASA (USA).References
- Fischer et al (2004) Fischer J, Klaassen T, Hovenier N, et al (2004) Cryogenic Far Infrared Laser Absorptivity Measurements of the Herschel Space Observatory Telescope Mirror Coatings. Appl. Opt. 43:3765–3771
- Fulton et al (2013a) Fulton T, Hopwood R, Benielli D, et al (2013a) Herschel SPIRE FTS pipeline. Astron. Astrophys. In preparation
- Fulton et al (2013b) Fulton T, Hopwood R, Benielli D, et al (2013b) Herschel SPIRE FTS Relative Spectral Response Calibration. Exp Astron. In this issue
- Griffin et al (2010) Griffin MJ, Abergel A, Abreu A, et al (2010) The Herschel SPIRE instrument and its in-flight performance. Astron. Astrophys. 518:L3, 1005.5123
- Pilbratt et al (2010) Pilbratt GL, Riedinger JR, Passvogel T, et al (2010) Herschel Space Observatory. An ESA facility for far-infrared and submillimetre astronomy. Astron. Astrophys. 518:L1, 1005.5331
- Swinyard et al (2013) Swinyard BM, Polehampton E, Hopwood R, et al (2013) Calibration of the Herschel SPIRE Fourier Transform Spectrometer. MNRAS Submitted