.svgpdf.pdfinkscape –export-pdf=tmp ’#1’ ; gs -sDEVICE=pdfwrite -dCompatibilityLevel=1.4 -dPDFSETTINGS=/printer -dNOPAUSE -dQUIET -dBATCH -dUseCIEColor ’-sOutputFile=\OutputFile’ tmp \epstopdfDeclareGraphicsRule.svgpng.pnginkscape -d 200 ’–export-png=\OutputFile’ ’#1’ \PrependGraphicsExtensions.jpeg \PrependGraphicsExtensions.svg
High redshift supermassive blackholes: accretion through cold flows
Abstract
We use zoom-in techniques to re-simulate three high-redshift () halos which host solar mass blackholes from the Gpc volume, MassiveBlack cosmological hydrodynamic simulation. We examine a number of factors potentially affecting supermassive blackhole growth at high redshift in cosmological simulations. These include numerical resolution, feedback prescriptions and formulation of smoothed particle hydrodynamics. We find that varying the size of the region over which feedback energy is deposited directly, either for fixed number of neighbours or fixed volume makes very little difference to the accretion history of blackholes. Changing mass resolution by factors of up to 64 also does not change the blackhole growth history significantly. We find that switching from the density-entropy formulation to the pressure-entropy formulation of smoothed particle hydrodynamics slightly increases the accretion rate onto blackholes. In general numerical details appear to have small effects on the main fueling mechanism for blackholes at these high redshifts. We examine the fashion by which this occurs, finding that the insensitivity to simulation technique seems to be a hallmark of the cold flow feeding picture of these high- supermassive blackholes. We show that the gas that participates in critical accretion phases, in these massive objects at is in all cases colder, denser, and forms more coherent streams than the average gas in the halo. This is also mostly the case when the blackhole accretion is feedback regulated (), however the distinction is less prominent. For our resimulated halos, cold flows appear to be a viable mechanism for forming the most massive blackholes in the early universe, occurring naturally in CDM models of structure formation. Not requiring fine tuning of numerical parameters, they seem to be physically inevitable in these objects.
keywords:
supermassive blackholes – numerical scheme – cosmological simulation1 Introduction
Deep sky surveys have revealed populations of distant quasars at redshifts , (Fan et al., 2001, 2003, 2004, 2006; Jiang et al., 2009; Abazajian et al., 2009; Mortlock et al., 2011; Morganson et al., 2012; Willott, Omont & Bergeron, 2013). The mass of the central blackholes in high redshift quasars are estimated to be ; the feasibility of growing such blackholes on a timescale of less than 1 billion years poses tight constraints on astrophysical mechanisms for doing this. Two aspects of growing such super-massive blackholes are seeding and the subsequent accretion of mass. On the seeding side, seed masses of from at redshifts have been proposed by various authors. On the lower end, they could form from the remnants of PopIII stars, (Bromm, Coppi & Larson, 1999; Abel, Bryan & Norman, 2000; Nakamura & Umemura, 2001; Yoshida et al., 2003; Gao et al., 2005), or for the most massive seeds from direct gravitational collapse (Koushiappas, Bullock & Dekel, 2004; Begelman, Volonteri & Rees, 2006; Mayer et al., 2010; Bellovary et al., 2011; Choi, Shlosman & Begelman, 2013).
Given a seed, the blackholes must endure a sustained period of Eddington limited growth (Volonteri & Rees, 2005; Lodato & Natarajan, 2006; Pelupessy, Di Matteo & Ciardi, 2007) to grow to masses of . An important factor in studying the growth of these objects is understanding whether sufficiently strong gas inflows are present in high redshift halos and how self-regulation and feedback from supermassive blakcholes may affect them (Di Matteo, Springel & Hernquist, 2005; Cattaneo & Teyssier, 2007; Johansson, Naab & Burkert, 2008; Booth & Schaye, 2009; Mayer et al., 2010; Debuhr, Quataert & Ma, 2011; Hobbs et al., 2012; Dubois et al., 2012).
Numerical simulation of the growth of supermassive blackholes in a cosmological volume is a challenging problem. This is especially the case for the first quasars. Constraints from the quasar luminosity function (e.g. Fan et al., 2001) imply that such quasars are rare objects, with a density of . As a consequence, to simulate the first quasars, a large volume on the order of with sufficient mass resolution to resolve their host galaxies and the gas inflow within them is required.
To work around this difficulty, many authors have adopted a method of “resimulation”, where high resolution, “zoomed-in” initial conditions are generated selecting high redshift massive halos selected from large volume, lower resolution simulations (see, e.g., Dubois et al., 2013; Anglés-Alcázar et al., 2013; Bellovary et al., 2013; Costa et al., 2013; Romano-Diaz et al., 2011; Bournaud et al., 2011; Hopkins & Quataert, 2010; Sijacki, Springel & Haehnelt, 2009; Li et al., 2007). In this commonly adopted method however the growth of the most massive black holes is then typically assumed to be associated with the most dark matter halos. This may not be the case at all redshifts: it is still controversial whether halo mass is a good indicator of the blackhole properties of the rare first quasars (see, e.g., Fanidakis et al., 2013; Husband et al., 2013; Kim et al., 2009).
Another approach is to directly run a large volume simulation with hydrodynamics and a model for supermassive blackhole formation and growth (see, e.g., Booth & Schaye, 2013; Wurster & Thacker, 2013; Booth & Schaye, 2010, 2009; Bonoli et al., 2009; Schaye & Dalla Vecchia, 2008; Di Matteo et al., 2008; Priddey, Ivison & Isaak, 2008). The largest simulation in this approach is the MassiveBlack (hereafter MB) simulation by Di Matteo et al. (2012), designed to study the first quasars. With a box side length and particles, the Smoothed Particle Hydrodynamics (hereafter SPH) simulation runs from uniform cosmological initial conditions produced around ten supermassive blackholes with at . The growth of these blackholes was found to be mainly due to cold flows. Gas in the vicinity of the blackholes was shown to originate from cold dense filaments that survive well within the virial radius of the halo (see also Bournaud et al., 2011; Dekel et al., 2009). Even though the mass resolution of MB is sufficient to resolve the host halos of the first quasars, the spatial resolution was not sufficient to follow gas inflows below sub-Kpc scales. Another drawback with large uniform simulations such as MB is that it becomes prohibitively expensive to experiment with the numerical schemes for hydrodynamics and feedback.
In this work we apply the resimulation method to a sample of three halos hosting blackholes in the hydrodynamical MB simulation. Our main goal is to study the growth of these extreme objects at higher resolution. We will examine the effect of different numerical schemes on the accretion history of blackholes, then proceed to investigate how gas arrives to and participates in the growth of supermassive blackholes.
The paper is organized as follows: in Section 2 we discuss the selection and construction of the initial conditions; in Section 3, we study how method of feedback energy deposition, resolution and SPH formulation affect the accretion history of the supermassive blackholes; in Section 4 we investigate in detail the picture of cold flow feeding.
2 Initial Conditions
2.1 Selection of Halos
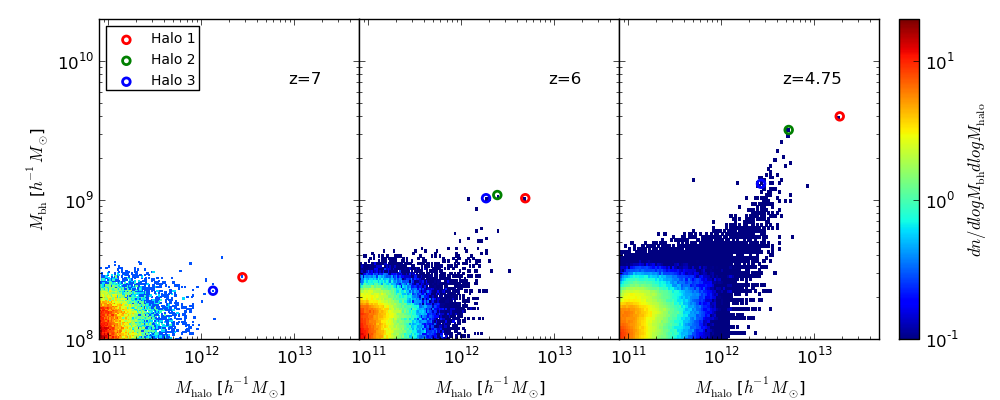
The MB simulation can be used to examine the relationship between blackhole mass and halo mass for the entire population of hosting halos, and this is shown in Figure 1 at three redshifts , , and .
We can see that for the same host mass of a few times , the blackhole mass can vary significantly (by greater than an order of magnitude). Similar scatter is also reported by Fanidakis et al. (2013) from semi-analytic modelling of blackhole growth in dark matter simulation. The scatter shows that picking target halos from a hydrodynamic simulation is necessary to ensure that we are sampling the distribution of supermassive blackholes that we want.
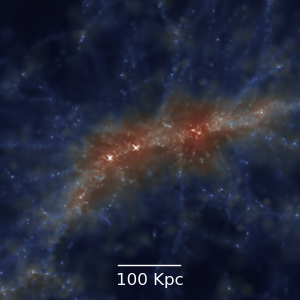
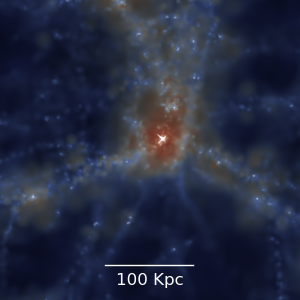
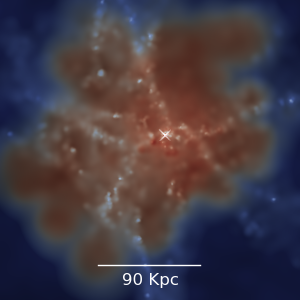
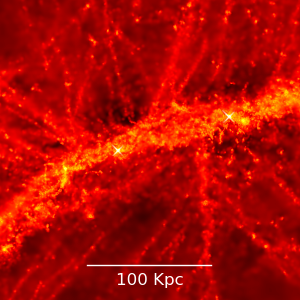
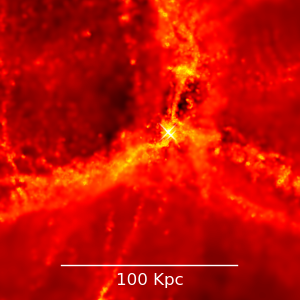
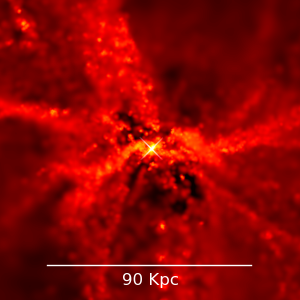
We select three halos from the MB simulation based on their blackhole mass at . We pick 3 of the most massive blackholes (shown as circles in Figure 1). Their large scale gas envrionment is shown in figure 2. The three halos evolve differently even though they have a similar mass of at . The ranking of halos by blackhole mass can change significantly between redshifts. For example, at the blackhole mass in halo 2 does not even show up in Figure 1 (), but at it becomes one of the most massive blackholes ().
We now describe the environment and blackholes in each halo in turn (see also Figure 4):
-
Halo 1
lies along the most prominent filament in the MB simulation (first panel in Figure 2. The halo eventually amalgamates with nearby halos into one “super halo” that is several times more massive than any other halos in the simulation. The most massive progenitor blackhole grew rapidly at high redshift via a continuous supply of cold gas flows through the filament. At low redshift the blackhole mass increased due to a major merger event. Two nearby blackholes are also approaching the most massive blackhole, though they have not merged at (end of simulation).
-
Halo 2
is located at the confluence of 3 filaments (second panel in Figure 2). From a general visualization of the MB simulation (Feng et al., 2011) we can infer that this is one of the typical configurations for massive halo growth by accretion from filaments. The blackhole went though a rapid growth phase between and , likely due to an incoming gas rich merger.
-
Halo 3
is hosted by a quiescent environment. The growth of the blackhole has been quenched at by feedback which has reduced the cold gas supply. As we can see from the third panel in Figure 2, the halo is surrounded by a large region of hot gas.
2.2 Generating the Initial Conditions
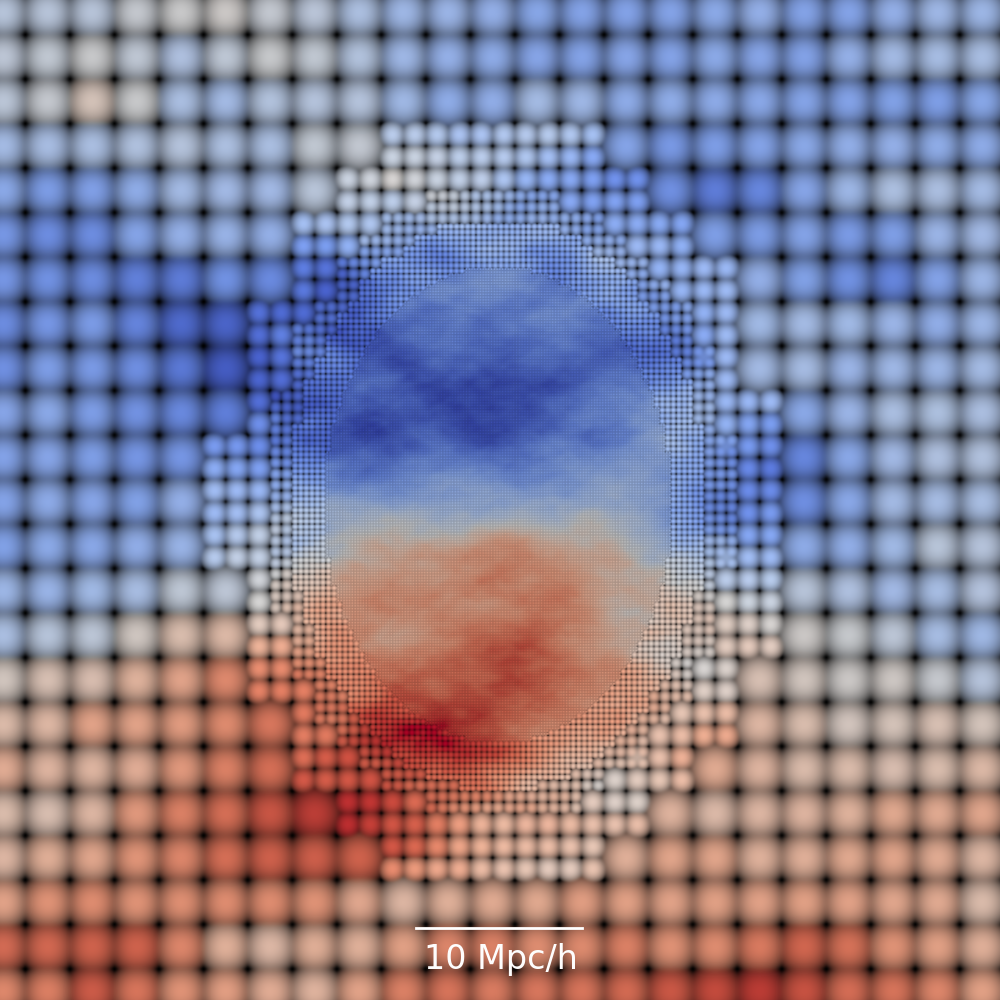
The cosmological parameters used for the initial conditions are identical to that used in MB (listed in Table 1).
| 0.72 | 0.044 | 0.74 | 0.26 | 0.8 | 159.0 | 4.75 |
Our algorithm for generating the initial conditions uses as a base the code from the initial condition generator that was used for the MB simulation (N-GenIC, author Volker Springel). This is in order to preserve the same randomly sampled large scale Fourier modes used in MB. We modified N-GenIC to produce multiple levels of displacement at a selected region, and implemented a post-processing algorithm that assembles the particles and their displacement at different resolution levels while conserving the total mass and the center of mass of particles.
To define the high resolution zoom region we first find the dark matter particles in the friends-of-friends (FOF, see Davis et al., 1985) group corresponding to the selected halo at redshift . We then find the initial positions of these particles, and put down a bounding sphere. We enlarge the bounding sphere by a factor of 1.5, and the region inside this sphere is our highest resolution zoom region. We populate this region with high resolution gas and dark matter particles whose initial perturbation is the sum of the interpolated (4th order spline) large scale mode perturbations in the original MB initial conditions and additional small scale mode perturbations (with random Fourier phases) drawn from smaller boxes. Outside the spherical high resolution region, a series of spherical shells are populated with lower resolution matter particles (collisionless), each shell radius being a factor of 1.14 larger than that interior to it, until we have reached a spatial resolution 8 times worse than that of MB. The rest of the cubical volume is populated with particles of this mass. The setup is illustrated with a 2d-projection of the velocity field in Figure 3.
During the simulation, we measure the minimal distance from the nearest low resolution particle to the central blackhole. The closest distance is in co-moving units, which is greater than the virial radius of the halo. This provides enough evidence that particles from the low resolution regions do not contaminate the blackhole accretion and halo growth.
3 Simulations
Our fiducial SPH simulation code is the same as that used to run the original MB model (Di Matteo et al., 2012), P-GADGET3 (see Springel, 2005, for details of the hydrodynamics and gravity computation). The formulation of SPH used in MB is density-entropy SPH (Springel & Hernquist, 2002; Lucy, 1977; Gingold & Monaghan, 1977), with a cubic spline kernel, the blackhole accretion model from Di Matteo, Springel & Hernquist (2005) and the multiphase star-formation model from Springel & Hernquist (2003). In order to assess the effects of choices for the numerical schemes, we incorporate additional features into the code:
-
•
a fixed feedback deposition volume in the blackhole accretion model;
- •
- •
In this work we present 18 simulation with various combinations of these models and the resolutions. The matrix of the simulations and their abbreviated names are listed in Table LABEL:tab:simulations. We note that our LDCA simulations use the same model and resolution as MassiveBlack; and the HDCV simulations are the simulations with the highest resolution (64 times finer mass resolution and 4 times finer spatial resolution than MB).
| Symbol | Halo | SPH | Kernel | Feedback | ||
|---|---|---|---|---|---|---|
| 1HDCV | 1 | 1.5 | DE | Cubic | Volume | |
| 1MDCV | 1 | 3.0 | DE | Cubic | Volume | |
| 1MDCA | 1 | 3.0 | DE | Cubic | Adaptive | |
| 1MDQV | 1 | 3.0 | DE | Quintic | Volume | |
| 1MPQV | 1 | 3.0 | PE | Quintic | Volume | |
| 1LDCA† | 1 | 5.5 | DE | Cubic | Adaptive | |
| 2HDCV | 2 | 1.5 | DE | Cubic | Volume | |
| 2MDCV | 2 | 3.0 | DE | Cubic | Volume | |
| 2MDCA | 2 | 3.0 | DE | Cubic | Adaptive | |
| 2MDQV | 2 | 3.0 | DE | Quintic | Volume | |
| 2MPQV | 2 | 3.0 | PE | Quintic | Volume | |
| 2LDCA† | 2 | 5.5 | DE | Cubic | Adaptive | |
| 3HDCV | 3 | 1.5 | DE | Cubic | Volume | |
| 3MDCV | 3 | 3.0 | DE | Cubic | Volume | |
| 3MDCA | 3 | 3.0 | DE | Cubic | Adaptive | |
| 3MDQV | 3 | 3.0 | DE | Quintic | Volume | |
| 3MPQV | 3 | 3.0 | PE | Quintic | Volume | |
| 3LDCA† | 3 | 5.5 | DE | Cubic | Adaptive |
3.1 Blackhole Accretion Model
The blackhole accretion model was introduced by Springel, Di Matteo & Hernquist (2005) and Di Matteo, Springel & Hernquist (2005). Here we summarize some relevant features. The blackholes are seeded in the simulations on-the-fly in newly formed FOF halos with . The seed mass is . The accretion rate of a blackhole is calculated from
where the local gas density and local effective sound speed are evaluated from the nearest neighbour SPH estimate at the blackhole position . is the Thompson cross section, the gravitational constant and the proton mass. We have absorbed other constants in and . The light to mass ratio is taken as . We also assume that of the light emitted becomes thermal feedback energy.
Two blackholes are merged when two nearby (within the SPH resolution) blackholes satisfy the condition , where is their pairwise relative velocity and is the sound speed of the surrounding gas.
3.2 Merger and accretion history
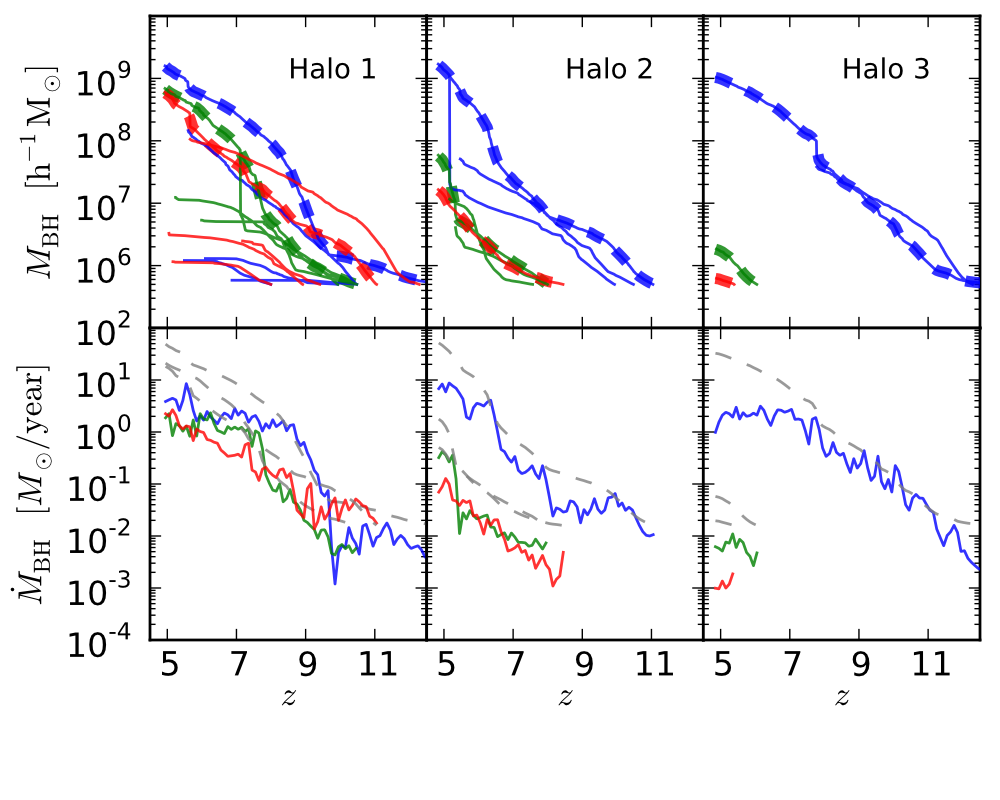
When examining the accretion history of blackholes in each zoom region in Sections 3.3 onward we will restrict ourselves to the most-massive progenitor of the most-massive blackhole at . We find that halo 2 and halo 3 contain one central blackhole each at the end of the simulation, while halo 1 contains three major blackholes of similar mass. This can be seen in Figure 4 where we show the mass evolution of the 3 most massive (final redshift) blackholes and their progenitors in each halo. The difference in the environments of the blackholes seen in Figure 2 shows up strikingly here too, with for example halo 3 hosting only one early merger events between blackholes at close to .
We note that where there are differences in the precise ranking of blackholes for different versions of a simulation we define as the central blackhole the most massive blackhole in the highest resolution simulation.
In the following subsections we explore the effect of varying the accretion and feedback models on the growth of the central blackhole.
3.3 Deposition of AGN feedback energy
The blackholes deposit feedback energy into nearby gas environment. In our simulations, we model this process by depositing thermal feedback energy to the neighbouring gas particles, weighted by their mass. The exact details of the physical mechanism by which this occurs in real galaxies is likely dictated by radiative transfer through the medium surrounding the blackhole (Alvarez, Wise & Abel, 2009; Ciotti & Ostriker, 2007; Hayes et al., 2006; Jeon et al., 2012; Novak, Ostriker & Ciotti, 2012; Milosavljević, Couch & Bromm, 2009; Park & Ricotti, 2011, 2012). As the length and mass scales over which this occurs are not certain, it is important to test how our sub-grid prescription for depositing this feedback energy affects growth of the blackholes.
In the original MB simulation the energy deposition was done using the SPH smoothing kernel of the blackhole particle to distribute energy to the 64 nearest neighbors. We refer to the MB feedback method “adaptive”, as the size of the feedback region is directly proportional to the mean separation of SPH particles close to the blackhole (a ratio of ). In order to preserved the ratio, we use 224 neighbours in the quintic spline kernel simulations.
An alternative to the “adaptive” model is to fix the proper volume of the gas receiving the feedback energy. For the fixed-volume model, we use a region corresponding to a spline smoothing kernel with proper radius . The total mass of gas receiving the feedback energy is therefore proportional to the gas density around the blackhole. Note that we do not use the fixed-volume model at low resolution as the feedback region is smaller than the gravitational smoothing when even at very high redshift ().
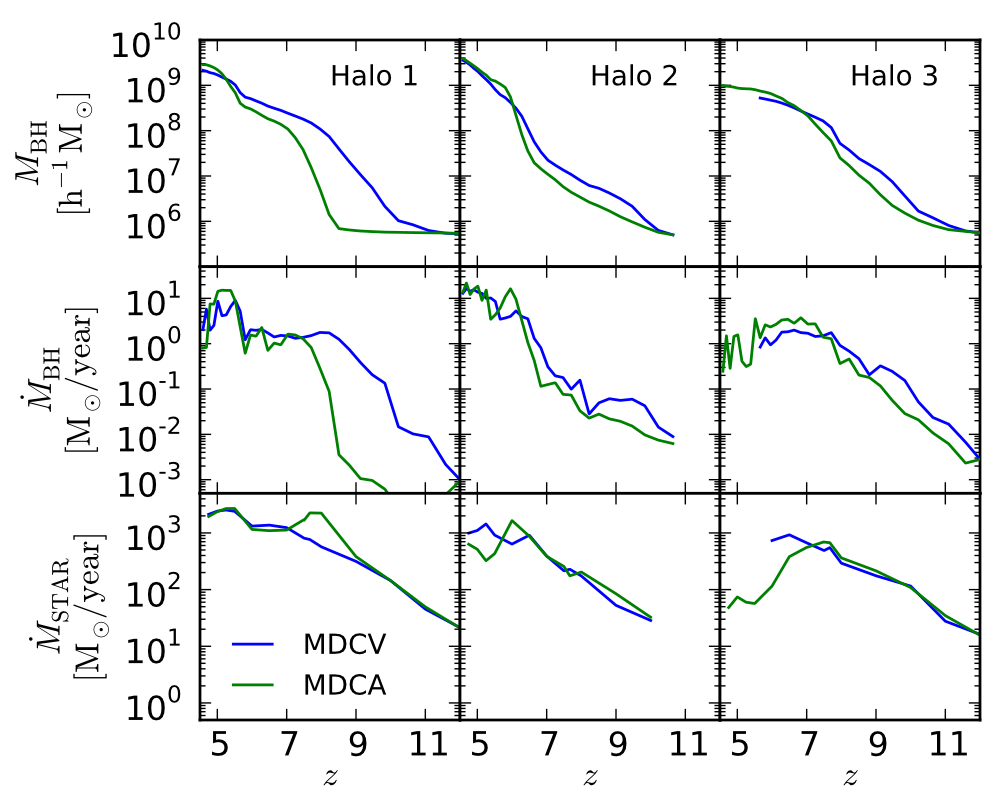
In Figure 5, we compare the results of simulations with the adaptive model for distributing feedback energy and those with the fixed-volume model at the medium resolution (MDCA and MDCV simulations in Table LABEL:tab:simulations). We can see that the blackhole mass, accretion and the halo star formation in all three halos are very similar for both feedback models (within the same order of magnitude). The only exception is in halo 1, where there is some difference in the early growth: the accretion rate in the adaptive model remains 2 orders of magnitude lower than the fixed-volume model until redshift . The difference in accretion rate disappears after , and eventually the blackhole mass between two models become very similar. The star formation in the halo also experiences a burst during the same period, indicating an accumulation of cold dense gas in the halo before the blackhole accretion kicks in. After the accretion is started, the blackhole mass quickly picks up. We therefore regard the similarity in the late time blackhole masses and accretion rates as more definitive. The choice of feedback region therefore does not appear to significantly alter the accretion history.
3.4 Resolution
The MB simulation has a gravitational force softening length of . The re-simulations are conducted with three different gravitational force softening lengths (in comoving coordinates): (low resolution), (med resolution), and (high resolution). Our highest resolution simulation therefore has a proper resolution of pc at .
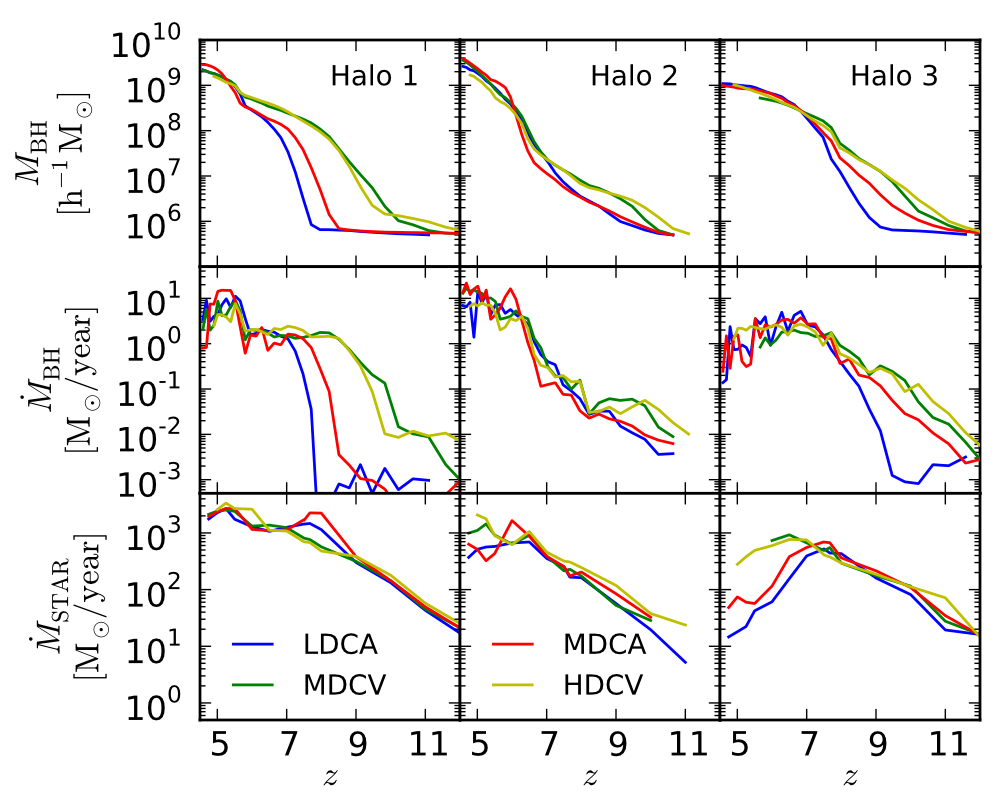
We plot the accretion history for the 3 different blackholes at different resolutions in Figure 6, showing blackhole mass and accretion rate and the star formation rate in the halo. We find that the resolution does not appear to be affecting the blackhole growth and the star formation in the halo. The accretion history and star formation appear to have reached convergence with the medium resolution simulations(MDCV and MDCA), which shows no significant difference with the high resolution simulations (HDCV) that has 8 times better mass resolution.
The major difference again lies in the adaptive feedback model. We see that the initial growth () of the adaptive model shows stronger resolution dependence than the fixed-volume model in both halo 1 and halo 3: the lower resolution simulation (LDCA) produces slower initial growth at than the higher resolution (MDCA). The difference in halo 3 is less drastic than the difference in halo 1 and is not associated with a burst in star formation rate. We believe this is because the halo is in a relatively isolated region, and the cold gas supply is lower than halo 1.
We point out that eventually () the lower resolution simulation (LDCA) does also reach the same final blackhole mass as the medium resolution simulation (MDCA), with the dependence on resolution disappearing. This is because at the blackhole is sufficiently massive that the accretion becomes regulated by feedback, regardless of how the feedback is implemented.
3.5 SPH formulation: Pressure-Entropy
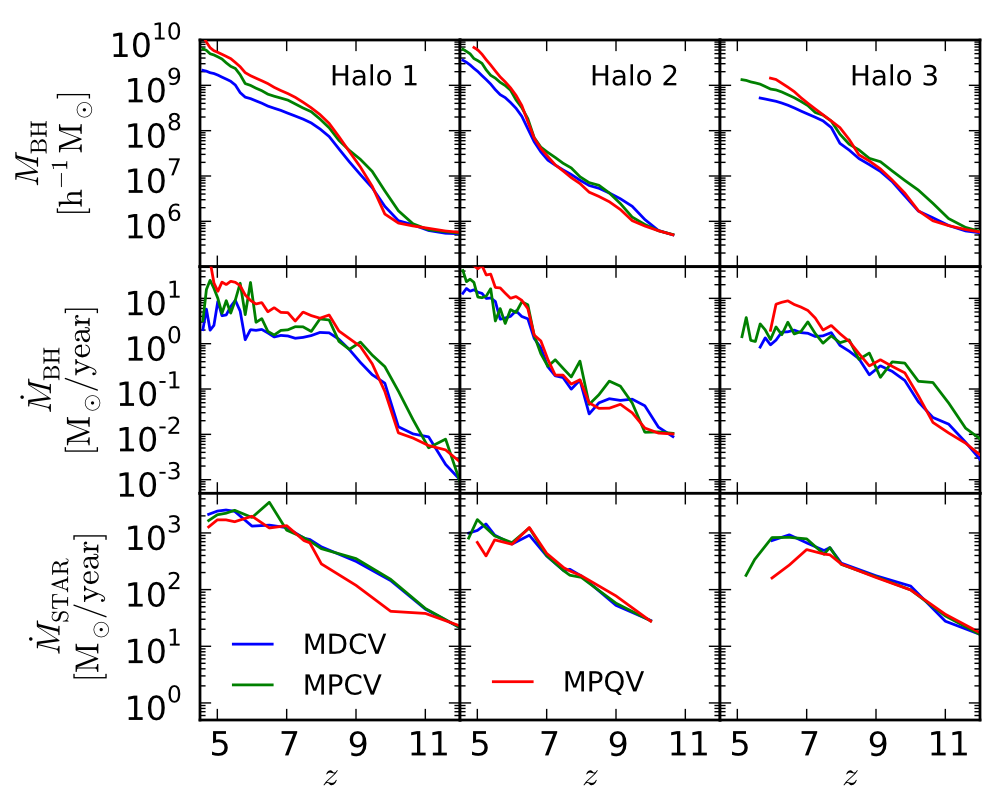
Recent developments in SPH include the introduction of the so-called pressure-entropy formulation (Hopkins, 2013; Read, Hayfield & Agertz, 2010), and the quintic smoothing kernel (Price, 2008). These new developments aimed to address several difficulties noticed in prior formulations of SPH, namely: an unphysical surface tension across surface boundaries that forbids particle exchange at a density discontinuity, the fluctuation in density estimation due to a small number of nearest neighbours (32), and nearby particles bonding into pairs causing a loss of resolution in high density regions (see e.g. Agertz et al., 2007; Morris, 1996; Schuessler & Schmitt, 1981; Monaghan, 2000; Wadsley, Veeravalli & Couchman, 2008).
We have run our zoomed simulations with pressure-entropy SPH and the traditional density-entropy SPH formulation. The blackhole accretion histories and the halo star formation rates are shown in Figure 7. We can see that going from density-entropy to pressure-entropy formulations appears to consistently result in faster blackhole accretion, while the star formation is not affected. Comparing the results for quintic spline and cubic kernels (both are plotted) we can see that some of the contribution is due to the switch to a quintic spline kernel. The quintic spline kernel samples more particles (112) and reduces the noise in the quantities used the blackhole accretion model. The blackholes are up to a factor of 5 times more massive at the final time in the pressure-entropy case compared to density entropy case. We note that there is a free parameter in the blackhole model, namely the feedback efficiency (set to 10 here). This parameter was set (Di Matteo, Springel & Hernquist, 2005) to reproduce blackhole masses observed in the local Universe and so with pressure-entropy SPH a recalibration of this parameter could be employed.
4 Feeding Blackholes via Cold Flows
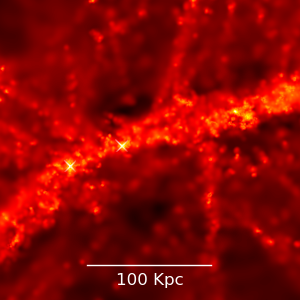
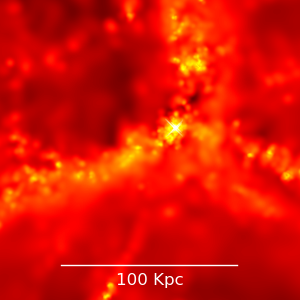
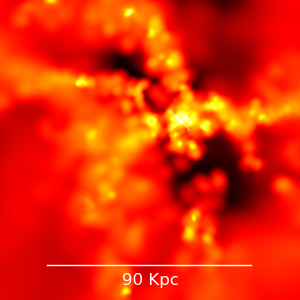
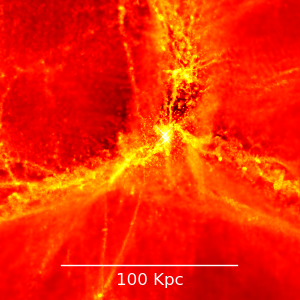
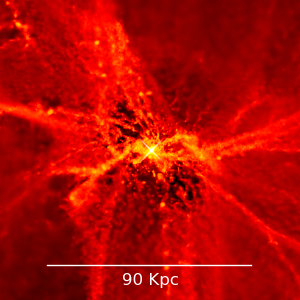
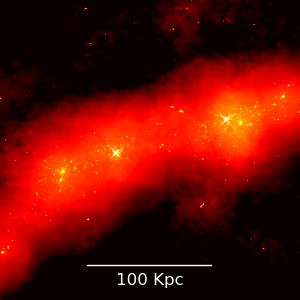
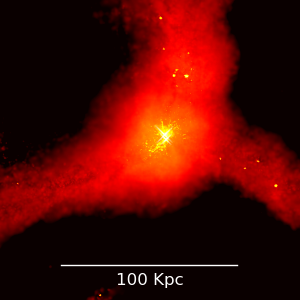
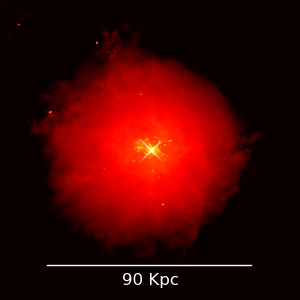
We now investigate the fuel supply onto blackholes and study the thermal history of high redshift gas that participates in blackhole accretion. We focus on the question of whether the gas that fuels the black hole is different from the typical gas in the halo. We want to further test the indication that at these high redshifts () fast black hole growth can be achieved via cold flows (Di Matteo et al., 2012). Further we aim to investigate how black hole feedback may play a role in disrupting the cold streams close to the black hole.
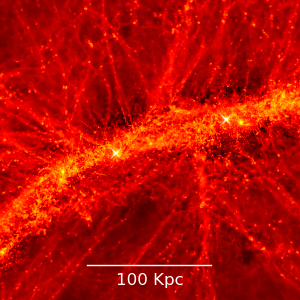
The virial temperature of the hosting halo of is close to , while in the simulation the cold IGM temperature is close to . We set the split between hot and cold gas at . In Figure 8, we compare the morphology of the cold gas () and that of the hot gas () around the blackholes in the three halos. We first notice that the cold gas forms dense compact filaments that are unlikely due to resolution effects: as we increase resolution, the cold gas filaments are identical in morphology except have increased sharpness. Secondly, we notice that the hot gas is distributed in a diffuse manner, forming thicker structures containing large blobs that extend to the entire halo.
The striking morphological difference between hot and cold gas motivates us to consider two species of gas particles:
-
1.
the first gas species we call “HALO” particles111Not to be confused with the dark matter particles in the halo. and are randomly selected gas particles from the halo, weighted by volume; because hot gas particles occupy most of the volume of the halo, HALO particles are most likely the hot environment gas in the halo shown in the bottom panel of Figure 8.
-
2.
the second gas species are the “BH” particles222Not to be confused with particles that represents the blackholes in the simulation., and are the nearest neighbour particles contributing to the evaluation of gas properties at the blackhole. The BH particles are the gas particles that are actively participating in accretion onto the blackhole.
After a gas particle (if it has not been converted to a star particle) enters the halo, depending on its cooling efficiency, the particle will either be heated to the virial temperature of the halo, losing its initial inflow motion, or remain cold, arriving to the center of the halo to participate in star formation and blackhole accretion. In this picture, the history of a gas particle can be quantified by two characteristic times:
-
1.
the entering time , the time since the Big Bang at which a gas particle first enters the virial radius;
-
2.
the heating time , the time since the Big Bang at which a gas particle is first heated above the virial temperature of the gas.
We also calculate the correlation coefficient (CC) of the two characteristic times
where and represent and , and the standard-deviation and the mean of the data, and the mean operator.
CC measures the correlation between the time a gas particle enters the halo and the time a particle is heated to the virial temperature of the halo. If a particle is heated by the virial heating from the halo, we expect CC to be large, for particles entering the halo early shall be heated early, while those entering late shall be heated late. On the other hand, if a particle is heated by the central blackhole, we expected CC to be small, for these particles are heated only after they arrive to the blackhole, no matter when they enter the halo. As we will show later, these expectations agree with our simulations.
| Halo | 1 | 2 | 3 | |||
|---|---|---|---|---|---|---|
| Species | BH | HALO | BH | HALO | BH | HALO |
| EA (high redshift) | 0.069 | 0.574 | -0.075 | 0.778 | 0.131 | 0.337 |
| RA () | 0.389 | 0.893 | 0.356 | 0.745 | 0.557 | 0.827 |
We calculate , , and CC for BH and HALO particles at two epochs from the high resolution simulations (HDCV): (1) the first epoch is when the blackhole is undergoing Eddington accretion (EA phase, for each halo respectively), and (2) the second epoch is when the blackhole accretion has been regulated (RA phase, for all three halos).
The results are shown in Figure 9 and Table 3. We first look in the EA phase. During the EA phase, the correlation coefficient (CC) between the heating time and entering time of the BH particles is much smaller than that of the HALO particles as seen in the first row in Table 3. The difference can also be seen in Figure 9, where the BH particles are clustering around the same that corresponds to the time the particle becomes the nearest neighbour of the blackhole, while the HALO particles follows a line with a positive slope. The lower CC in BH particles is consistent with heating by blackhole feedback: the BH particles remain cold after they enter the halo, and are then heated up shortly after they arrive at the blackhole. The larger CC with HALO particles in EA phase is consistent with the virial heating picture: the hot gas halo is formed by virial heating from the halo (which may indirectly contain the feedback energy from the central blackhole and the feedback energy from satellites); if a HALO particle enters the halo early, it is also heated early.
This difference suggests that the gas that participates the blackhole accretion in an Eddington accretion phase is unlikely to be from the hot halo environment. The gas must have come directly from outside of the halo; and its thermal history is consistent with that of the cold flows.
We then move on to the RA phase, during which blackhole accretion has been regulated. We notice that the CC of the BH particles have significantly increased. In the lower panels of Figure 9, we find this increase is due to a larger population of the BH particles that behaves similarly to the HALO particles. The existence of a HALO-like population within the BH particles shows that the cold flows (though they still exist) are being somewhat disrupted. Because the HALO-like particles are heated before they arrive to the blackhole, the temperature around the blackhole rises, and the blackhole accretion is regulated.


We investigate further the motion of BH particles and HALO particles in the RA phase with Figure 10 and Figure 11. In Figure 10, we plot the history of properties of BH and HALO particles in simulation 1MDCV, where we saved one snapshot every of simulation time. In this case we have traced 32 particles of each population originating from three snapshots close to (three columns are three snapshots; two rows are BH and HALO from top to bottom, note that the time increases from right to left). The considered properties are:
- :
-
the temperature of the particle; we compare the temperature with the virial temperature of the halo.
- :
-
the distance between the particle and the blackhole (proper); we compare the distance with the virial radius of the halo.
- :
-
the radial velocity of the particle; negative value () is infalling and positive () is out-flowing.
- :
-
the density of the particle.
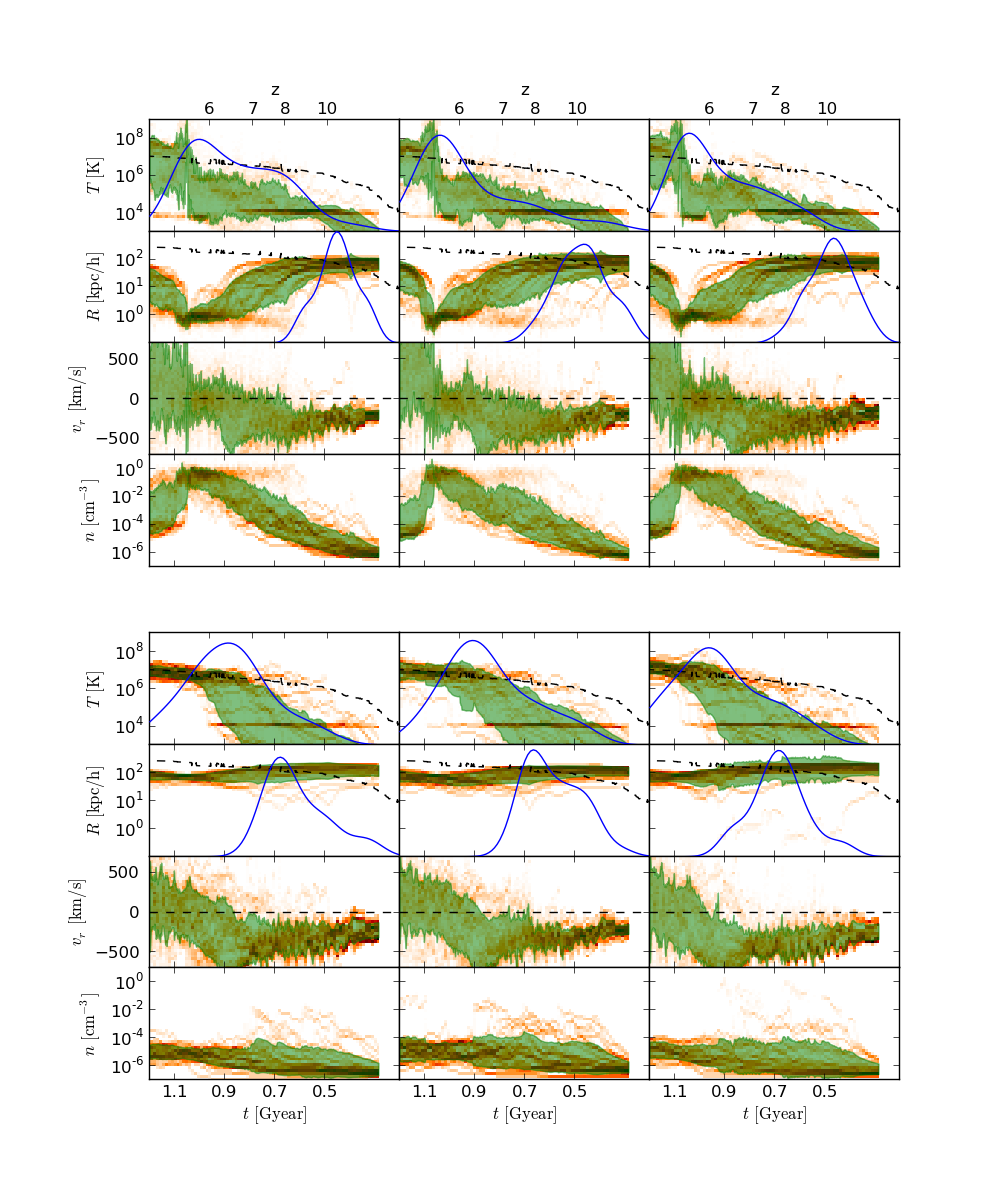
We visualize the history of each property with a 2-d histogram binned by the quantity and time in Figure 10. The histogram demonstrates the behavior of the entire population as a function of time: the particles with similar property at a given time will contribute to the same bin, resulting a darker pixel. For example, the dark horizontal line at in the top panel plots of Figure 10 indicates a large fraction of gas remains cold for a very long time. We also mark the probability distribution of and in the figure. We are more interested in the behavior of the gas between and .
In the three top panels for BH particles, we see that most of the BH particles have significantly increased their density while remaining cold for as long as after they enter the halo, as suggested by the dark lines in , and . We do notice that for some of the particles, the infalling motion starts to become disrupted much sooner ( after entering), while their temperature rise to the virial temperature. As we will see after analyzing the HALO particles, this early heating population within BH gas are very similar to the HALO particles: they correspond to the HALO-like population we identified in the lower panels of Figure 9, which are responsible for the increased correlation between and . The population indicates that the cold flows in a regulated growth phase are being disrupted, and can no longer provide the Eddington accretion of blackholes. All of the BH particles are heated after they get close to the blackhole (), but the temperature reaches up to , much higher than the virial temperature of the halo () at this redshift. We also note that some of the heated particles can receive an out-flowing velocity up to , and can reach a substantial distance away from the blackhole.
In the three low panels for HALO particles, we see that the heating happens much sooner (within ) after they enter the halo. The infalling motion is disrupted as the particles are heated, and most of the particles remains at a low density of . After being heated, the temperature of HALO particles tightly tracks the virial temperature of the halo, as the halo grows.
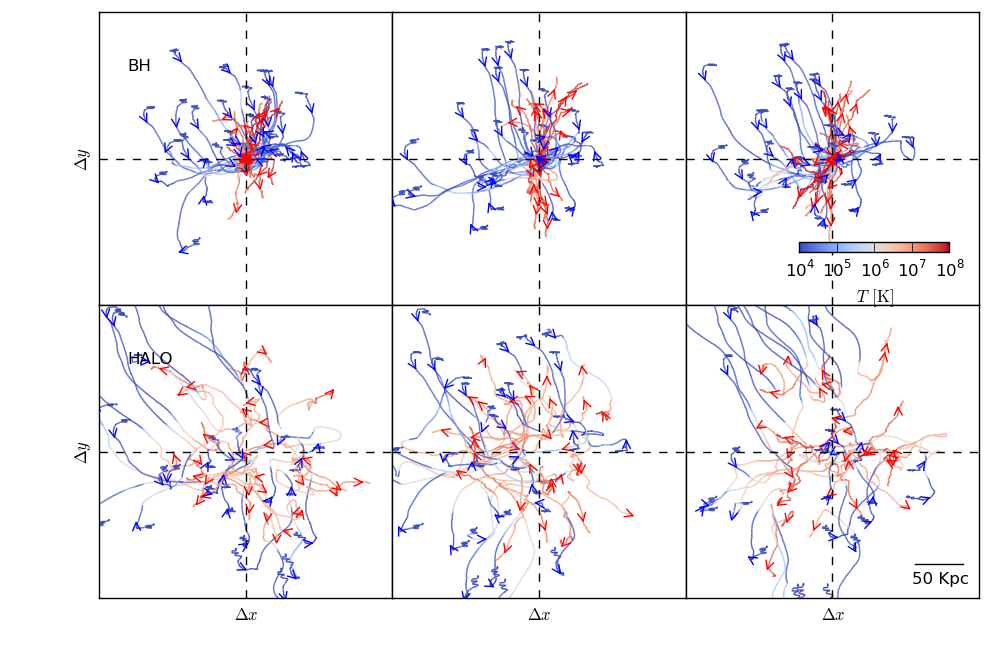
We proceed to visualize the motion of the in-flowing gas with Figure 11 for the particles selected from the three snapshots near . In Figure 11, we show the trajectories of the BH and HALO particles projected in the plane, colored by their temperature. The BH particles, being initially cold (), flow into the blackhole (located at the center of the plots), apparently following several preferred directions. The majority of the BH particles remain cold until they arrive to the blackhole. However, we can also see some of the particles are heated to before arriving the the blackhole; these particles correspond to the HALO-like particles. Afterwards, the particles are ejected towards directions that are unaligned to the directions they come in from. The ejected gas can reach more than away from the blackhole. The HALO particles show a very different pattern. Although the HALO particles are also initially cold (), the gas is quickly heated to the virial temperature of the halo (). Afterwards, the motion of particles visually resembles a random-walk within the virial radius of the halo (close to ).
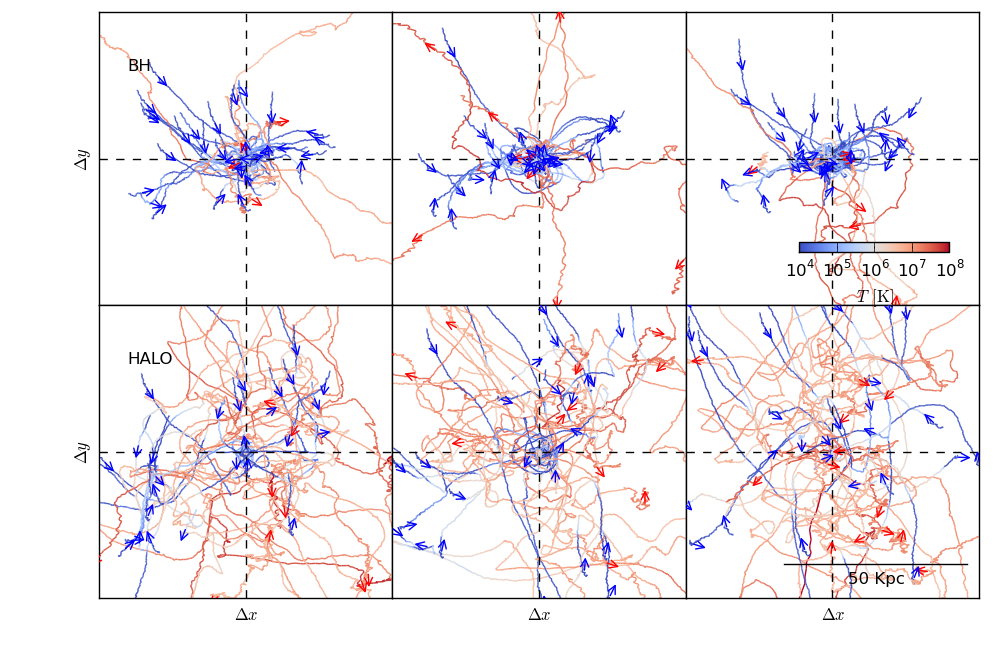
The fate of BH particles in the EA phase is drastically different. As shown in the top panels of Figure 12, we see that instead of being ejected away, most of the BH particles remain cold after arriving at the blackhole and they are eventually consumed by blackhole accretion and star formation at the very center of the halo. The fate of HALO particles in the EA phase is rather similar to that in the RA phase: particles are heated to the virial tempearture as they fall into the halo.
5 Conclusion
We have studied the fueling and gas supply onto high-redshift supermassive blackholes in high resolution re-simulations of halos selected from the MassiveBlack hydrodynamic cosmological simulation (covering a volume close to 1 Gpc3). Using MassiveBlack, Di Matteo et al. (2012) showed that steady high density cold gas flows were able to produce the high gas densities that can lead to sustained critical (Eddington) accretion rates and hence rapid growth commensurate with the existence of blackholes as early as . We have tested this scenario further for a subsample of three of the halos hosting solar mass blackholes at in MassiveBlack. We have used zoom-in techniques to investigate the nature of the gas inflows at scales that could not be resolved from the large volume MassiveBlack simulation.
We have shown that for the three re-simulated halos the growth history of their central super massive blackholes is consistent with a sustained Eddington limited fueling provided by cold streams of gas that penetrate all the way to the innermost region of the galaxies undisrupted (i.e. consistent with our earlier picture). Our conclusions remain unchanged even though the numerical scheme we use is varied in several significant aspects:
-
•
a change in resolution does not change the fuelling history;
-
•
AGN feedback energy is spread over different size regions of constant mass or volume,
-
•
an improved formulation of SPH (pressure-entropy and quintic kernel) is used (in this case, the growth of the blackholes is systematically faster).
Our results are consistent with the recent work by Costa et al. (2013) that shows that out of 18 halos selected in the Millennium simulation (dark matter only) only six halos found in large scale over dense regions are able to experience critical growth commensurate with by . Recently, Bellovary et al. (2013) also studied the growth history of black holes in high redshift halos. Their zoomed regions were extracted from an initial cosmological box of only per side, unlikely to contain high enough overdense regions. The final blackhole masses in their work are two orders magnitude smaller, consistent with what is expected from more moderately over-dense regions, as studied by Costa et al. (2013).
We have investigated the nature of the gas fueling the central blackholes by computing the correlation between the time required for gas particles (in the halo) to reach the virial temperature and the time since they first enter the halo. We also investigated the correlation of gas participating in accretion and the correlation of the hot gas in the halo environment. We have found that while gas that fuels the blackhole preserves its low temperature until heated by the feedback from the blackhole (low correlation), the gas ending up in the halo environment typically heats quickly upon entering the halo (high correlation). With this method, we have shown that during the Eddington growth phase, the accretion gas appears to have directly arrived to the blackhole through cold flows without disruption from the hot environment; while during the regulated growth phases () a larger population of the accretion gas behave very similar to the hot environment, indicating that the cold flows are becoming disrupted by the feedback.
After being heated by the blackhole the gas particles are ejected with a high velocity up to from the blackhole. Note also that several authors (see, e.g. Dubois et al., 2013; McCarthy et al., 2011) reported that the strong outflows during the regulated phase at high redshift can reduce the baryon fraction in the halo up to 30%, increasing the entropy of halos at lower redshift. In our halos, the disruption appears to be not as strong, as most of the gas surrounding the blackhole is cold even after the accretion is regulated. We do note that in our smallest halo (halo 3) have the largest HALO-like population, indicating that the feedback from super massive blackholes may be capable of blowing the cold flows away in less massive halos such as those studied by these authors.
Acknowledgements
The resimulations used in this work and the MassiveBlack simulation were run on the Cray XT5 supercomputer Kraken at the National Institute for Computational Sciences. We acknowledge support from Moore foundation which enabled us to perform the data analysis at the McWilliams Center of Cosmology at Carnegie Mellon University. This research has been funded by the National Science Foundation (NSF) PetaApps programme, OCI-0749212 and by NSF AST-1009781. The visualizations were produced using GAEPSI (Feng et al. 2011).
References
- Abazajian et al. (2009) Abazajian K. N. et al., 2009, ApJS, 182, 543
- Abel, Bryan & Norman (2000) Abel T., Bryan G. L., Norman M. L., 2000, ApJ, 540, 39
- Agertz et al. (2007) Agertz O. et al., 2007, MNRAS, 380, 963
- Alvarez, Wise & Abel (2009) Alvarez M. A., Wise J. H., Abel T., 2009, ApJ, 701, L133
- Anglés-Alcázar et al. (2013) Anglés-Alcázar D., Davé R., Özel F., Oppenheimer B. D., 2013, ArXiv e-prints
- Begelman, Volonteri & Rees (2006) Begelman M. C., Volonteri M., Rees M. J., 2006, MNRAS, 370, 289
- Bellovary et al. (2013) Bellovary J., Brooks A., Volonteri M., Governato F., Quinn T., Wadsley J., 2013, ArXiv e-prints
- Bellovary et al. (2011) Bellovary J., Volonteri M., Governato F., Shen S., Quinn T., Wadsley J., 2011, ApJ, 742, 13
- Bonoli et al. (2009) Bonoli S., Marulli F., Springel V., White S. D. M., Branchini E., Moscardini L., 2009, MNRAS, 396, 423
- Booth & Schaye (2009) Booth C. M., Schaye J., 2009, MNRAS, 398, 53
- Booth & Schaye (2010) Booth C. M., Schaye J., 2010, MNRAS, 405, L1
- Booth & Schaye (2013) Booth C. M., Schaye J., 2013, Scientific Reports
- Bournaud et al. (2011) Bournaud F., Dekel A., Teyssier R., Cacciato M., Daddi E., Juneau S., Shankar F., 2011, ApJ, 741, L33
- Bromm, Coppi & Larson (1999) Bromm V., Coppi P. S., Larson R. B., 1999, ApJ, 527, L5
- Cattaneo & Teyssier (2007) Cattaneo A., Teyssier R., 2007, MNRAS, 376, 1547
- Choi, Shlosman & Begelman (2013) Choi J.-H., Shlosman I., Begelman M. C., 2013, ApJ, 774, 149
- Ciotti & Ostriker (2007) Ciotti L., Ostriker J. P., 2007, ApJ, 665, 1038
- Costa et al. (2013) Costa T., Sijacki D., Trenti M., Haehnelt M., 2013, ArXiv e-prints
- Davis et al. (1985) Davis M., Efstathiou G., Frenk C. S., White S. D. M., 1985, ApJ, 292, 371
- Debuhr, Quataert & Ma (2011) Debuhr J., Quataert E., Ma C.-P., 2011, MNRAS, 412, 1341
- Dehnen & Aly (2012) Dehnen W., Aly H., 2012, MNRAS, 425, 1068
- Dekel et al. (2009) Dekel A. et al., 2009, Nature, 457, 451
- Di Matteo et al. (2008) Di Matteo T., Colberg J., Springel V., Hernquist L., Sijacki D., 2008, ApJ, 676, 33
- Di Matteo et al. (2012) Di Matteo T., Khandai N., DeGraf C., Feng Y., Croft R. A. C., Lopez J., Springel V., 2012, ApJ, 745, L29
- Di Matteo, Springel & Hernquist (2005) Di Matteo T., Springel V., Hernquist L., 2005, Nature, 433, 604
- Dubois et al. (2012) Dubois Y., Devriendt J., Slyz A., Teyssier R., 2012, MNRAS, 420, 2662
- Dubois et al. (2013) Dubois Y., Pichon C., Devriendt J., Silk J., Haehnelt M., Kimm T., Slyz A., 2013, MNRAS, 428, 2885
- Fan et al. (2004) Fan X. et al., 2004, AJ, 128, 515
- Fan et al. (2001) Fan X. et al., 2001, AJ, 122, 2833
- Fan et al. (2006) Fan X. et al., 2006, AJ, 131, 1203
- Fan et al. (2003) Fan X. et al., 2003, AJ, 125, 1649
- Fanidakis et al. (2013) Fanidakis N., Macciò A. V., Baugh C. M., Lacey C. G., Frenk C. S., 2013, MNRAS, 436, 315
- Feng et al. (2011) Feng Y. et al., 2011, ApJS, 197, 18
- Gao et al. (2005) Gao L., White S. D. M., Jenkins A., Frenk C. S., Springel V., 2005, MNRAS, 363, 379
- Gingold & Monaghan (1977) Gingold R. A., Monaghan J. J., 1977, MNRAS, 181, 375
- Hayes et al. (2006) Hayes J. C., Norman M. L., Fiedler R. A., Bordner J. O., Li P. S., Clark S. E., ud-Doula A., Mac Low M.-M., 2006, ApJS, 165, 188
- Hobbs et al. (2012) Hobbs A., Power C., Nayakshin S., King A. R., 2012, MNRAS, 421, 3443
- Hopkins (2013) Hopkins P. F., 2013, MNRAS, 428, 2840
- Hopkins & Quataert (2010) Hopkins P. F., Quataert E., 2010, MNRAS, 407, 1529
- Husband et al. (2013) Husband K., Bremer M. N., Stanway E. R., Davies L. J. M., Lehnert M. D., Douglas L. S., 2013, MNRAS, 432, 2869
- Jeon et al. (2012) Jeon M., Pawlik A. H., Greif T. H., Glover S. C. O., Bromm V., Milosavljević M., Klessen R. S., 2012, ApJ, 754, 34
- Jiang et al. (2009) Jiang L. et al., 2009, AJ, 138, 305
- Johansson, Naab & Burkert (2008) Johansson P. H., Naab T., Burkert A., 2008, Astronomische Nachrichten, 329, 956
- Kim et al. (2009) Kim S. et al., 2009, ApJ, 695, 809
- Koushiappas, Bullock & Dekel (2004) Koushiappas S. M., Bullock J. S., Dekel A., 2004, MNRAS, 354, 292
- Li et al. (2007) Li Y. et al., 2007, ApJ, 665, 187
- Lodato & Natarajan (2006) Lodato G., Natarajan P., 2006, MNRAS, 371, 1813
- Lucy (1977) Lucy L. B., 1977, AJ, 82, 1013
- Mayer et al. (2010) Mayer L., Kazantzidis S., Escala A., Callegari S., 2010, Nature, 466, 1082
- McCarthy et al. (2011) McCarthy I. G., Schaye J., Bower R. G., Ponman T. J., Booth C. M., Dalla Vecchia C., Springel V., 2011, MNRAS, 412, 1965
- Milosavljević, Couch & Bromm (2009) Milosavljević M., Couch S. M., Bromm V., 2009, ApJ, 696, L146
- Monaghan (2000) Monaghan J. J., 2000, Journal of Computational Physics, 159, 290
- Morganson et al. (2012) Morganson E. et al., 2012, AJ, 143, 142
- Morris (1996) Morris J. P., 1996, PASA, 13, 97
- Mortlock et al. (2011) Mortlock D. J. et al., 2011, Nature, 474, 616
- Nakamura & Umemura (2001) Nakamura F., Umemura M., 2001, ApJ, 548, 19
- Novak, Ostriker & Ciotti (2012) Novak G. S., Ostriker J. P., Ciotti L., 2012, MNRAS, 427, 2734
- Park & Ricotti (2011) Park K., Ricotti M., 2011, ApJ, 739, 2
- Park & Ricotti (2012) Park K., Ricotti M., 2012, ApJ, 747, 9
- Pelupessy, Di Matteo & Ciardi (2007) Pelupessy F. I., Di Matteo T., Ciardi B., 2007, ApJ, 665, 107
- Price (2008) Price D. J., 2008, Journal of Computational Physics, 227, 10040
- Price (2012) Price D. J., 2012, Journal of Computational Physics, 231, 759
- Priddey, Ivison & Isaak (2008) Priddey R. S., Ivison R. J., Isaak K. G., 2008, MNRAS, 383, 289
- Read, Hayfield & Agertz (2010) Read J. I., Hayfield T., Agertz O., 2010, MNRAS, 405, 1513
- Romano-Diaz et al. (2011) Romano-Diaz E., Shlosman I., Trenti M., Hoffman Y., 2011, ApJ, 736, 66
- Schaye & Dalla Vecchia (2008) Schaye J., Dalla Vecchia C., 2008, MNRAS, 383, 1210
- Schuessler & Schmitt (1981) Schuessler I., Schmitt D., 1981, A&A, 97, 373
- Sijacki, Springel & Haehnelt (2009) Sijacki D., Springel V., Haehnelt M. G., 2009, MNRAS, 400, 100
- Springel (2005) Springel V., 2005, MNRAS, 364, 1105
- Springel, Di Matteo & Hernquist (2005) Springel V., Di Matteo T., Hernquist L., 2005, MNRAS, 361, 776
- Springel & Hernquist (2002) Springel V., Hernquist L., 2002, MNRAS, 333, 649
- Springel & Hernquist (2003) Springel V., Hernquist L., 2003, MNRAS, 339, 289
- Volonteri & Rees (2005) Volonteri M., Rees M. J., 2005, ApJ, 633, 624
- Wadsley, Veeravalli & Couchman (2008) Wadsley J. W., Veeravalli G., Couchman H. M. P., 2008, MNRAS, 387, 427
- Willott, Omont & Bergeron (2013) Willott C. J., Omont A., Bergeron J., 2013, ApJ, 770, 13
- Wurster & Thacker (2013) Wurster J., Thacker R. J., 2013, MNRAS, 431, 2513
- Yoshida et al. (2003) Yoshida N., Sokasian A., Hernquist L., Springel V., 2003, ApJ, 598, 73