How dielectric screening in two-dimensional crystals affects the convergence of excited-state calculations: Monolayer MoS2
Abstract
We present first-principles many-body calculations of the dielectric constant, quasiparticle band structure, and optical absorption spectrum of monolayer MoS2 using a supercell approach. As the separation between the periodically repeated layers is increased, the dielectric function of the layer develops a strong dependence around . This implies that denser -point grids are required to converge the band gap and exciton binding energies when large supercells are used. In the limit of infinite layer separation, here obtained using a truncated Coulomb interaction, a -point grid is needed to converge the G0W0 band gap and exciton energy to within . We provide an extensive comparison with previous studies and explain agreement and variations in the results. It is demonstrated that too coarse -point sampling and the interactions between the repeated layers have opposite effects on the band gap and exciton energy, leading to a fortuitous error cancellation in the previously published results.
pacs:
71.20.Nr, 71.35.-y, 73.22.-f, 78.20.Bh, 78.60.LcI Introduction
Atomically thin two-dimensional (2D) materials such as graphene, hexagonal boron nitride, and transition metal dichalcogenides (TMDC) possess unique electronic and optical properties including high intrinsic carrier mobilities, Novoselov et al. (2005); Radisavljevic et al. (2011); Kaasbjerg et al. (2012) tunable band gaps,Shi et al. (2013); Yan et al. (2012) and strong light-matter interactions.Britnell et al. (2013); Mak et al. (2010); Splendiani et al. (2010); Bernardi et al. (to be published) These features, combined with the possibility of engineering their electronic properties further via strain, alloying or stacking, make the 2D materials ideal as building blocks for new opto-electronic structures and devices with minimal sizes and performances surpassing present technologies.
After the intense focus on graphene, the TMDCs are now attracting increasing interest.Wang et al. (2012) This stems mainly from the greater variation in their electronic properties including both semiconducting and metallic behavior. So far, the most intensively studied single-layer TMDC is the semiconductor MoS2. Nanostructured forms of MoS2 have previously been explored as potential catalysts for desulferization of crude oil and more recently for (photo)-electrochemical hydrogen evolution. Bollinger et al. (2001); Jaramillo et al. (2007); Zong et al. (2008) Bulk MoS2 is composed of two-dimensional sheets held together by weak van der Waals forces and individual sheets can be isolated by exfoliation techniques similar to those used to produce graphene. Novoselov et al. (2005) Single layers of MoS2 therefore comprise highly interesting two-dimensional systems with a finite band gap and have recently been proposed for nano-electronics applications. Radisavljevic et al. (2011)
The optical properties of MoS2 have been thoroughly studied experimentally.Frindt and Yoffe (1963); Evans and Young (1965); Wilson and Yoffe (1969); Neville and Evans (1976); Frey et al. (1998); Newcomer and Samara (1997) The absorption spectrum shows two distinct low energy peaks at and , which are denoted by A and B, respectively,Coehoorn et al. (1987) and derive from direct transitions between a split valence band and the conduction band at the K point of the Brillouin zone. Their Rydberg satellites, Zeeman splitting, and dependence on crystal thickness have been investigated in detail.Neville and Evans (1976) Recently, the quantum yield of luminescence from MoS2 was shown to increase dramatically when the sample thickness was changed from a few layers to a monolayerMak et al. (2010); Splendiani et al. (2010) indicating a transition to a direct band gap in the single layer.
In the past couple of years a number of theoretical studies of the electronic band structure and optical excitations in monolayer MoS2 have been published.Shi et al. (2013); Cheiwchanchamnangij and Lambrecht (2012); Komsa and Krasheninnikov (2012); Ataca and Ciraci (2011); Ramasubramaniam (2012); Molina-Sánchez et al. (2013); Conley et al. (2013) These studies are based on many-body perturbation theory in the GW approximation (mainly the non-selfconsistent G0W0 approach) for the band structure and the Bethe-Salpeter equation (BSE) with a statically screened electron-hole interaction for the optical excitations. As is standard practice, the calculations have been performed on a supercell geometry where the MoS2 layers have been separated by vacuum and the Brillouin Zone (BZ) sampled on grids ranging from to . With these parameters G0W0 band gaps in the range , and G0W0-BSE exciton binding energies of , have been reported. Moreover, both directAtaca and Ciraci (2011); Cheiwchanchamnangij and Lambrecht (2012); Komsa and Krasheninnikov (2012); Ramasubramaniam (2012); Molina-Sánchez et al. (2013) and indirectShi et al. (2013) band gaps have been found at the G0W0 level, while only direct gaps have been obtained with self-consistent GWCheiwchanchamnangij and Lambrecht (2012) and GW0. Shi et al. (2013); Conley et al. (2013) When comparing these values, it should be kept in mind that both size and nature of the band gap of MoS2 depends sensitively on the in-plane lattice parameter, .Shi et al. (2013)
One of the most fundamental quantities describing the electronic structure of a material is the dielectric function. The dielectric properties of atomically thin 2D materials are quite different from their 3D counterparts.Keldysh (1979) For example plasmons in 2D metals have acoustic dispersion relations ( as ), and screening is generally much weaker leading to strong exciton binding energies in 2D semiconductors. Reported static dielectric constants for monolayer MoS2 obtained using the supercell approach lie in the range (for in-plane polarization). Cheiwchanchamnangij and Lambrecht (2012); Ramasubramaniam (2012); Molina-Sanchez and Wirtz (2011) These values have been used to rationalize the exciton binding energy in MoS2 using the simple Mott-Wannier model.
In this paper, we present an in-depth study of the dielectric function, quasiparticle band structure and excitonic states in monolayer MoS2. We focus on separating the spurious interlayer screening from the intrinsic intralayer screening in supercell geometries, and the consequences that the physics of screening in 2D has for the convergence of many-body excited state calculations. The 3D macroscopic dielectric constant, as used for solids, converges to 1 for all vectors in the limit of infinite separation of the layers and is thus meaningless for a 2D material. We use an alternative approach to calculate the dielectric constant by averaging the total field over the material rather than the supercell. This 2D dielectric constant shows strong -dependence for small wave vectors and becomes exactly 1 for . This property has important consequences for the -point convergence of many-body calculations.
In general, the use of a truncated Coulomb interaction is essential to avoid interlayer screening which decays slowly with the layer separation, . The interlayer screening yields too large dielectric constant for wave vectors . As a consequence, the G0W0 band gaps and exciton energies are too low on average for layer separations of around . For larger layer separations, the strong -dependence of the dielectric constant for small implies that a -point grid of at least is required to converge band gaps and exciton energies to . For -point grids below the band gap is at least too large in the limit . Thus the effect of interlayer screening and too coarse -point grids partially cancel out leading to reasonable values for the band gap and exction binding energy with underconverged parameters as applied in previous studies.
The paper is organized as follows. In Sec. II we present G0W0 band structures and study the convergence of the gap with respect to interlayer separation and -point sampling. In Sec. III we show calculations for the 2D dielectric constant and explain the origin of the slow -point convergence of the band gap. In Sec. IV we present many-body calculations of the lowest excitons and analyse their convergence with layer separation and -point sampling. Our conclusions are given in Sec. V.
II Quasiparticle band structure
In this section we demonstrate that GW band structures for monolayer MoS2 converge extremely slow with respect to the interlayer separation. In order to obtain well converged results (within ), the use of a truncated Coulomb interaction is inevitable, along with a -point grid of around . Previously reported calculations with the full Coulomb interaction have employed only separation between and and used from to points. The resulting band structures are, however, somewhat saved by a fortunate error cancellation between the two effects.
II.1 Computational details
All our calculations have been performed with the projector augmented wave method code GPAW.Enkovaara et al. (2010)111The gpaw code is available as a part of the CAMPOS software: www.camd.dtu.dk/Software The Kohn-Sham wave functions and energies of monolayer MoS2 were calculated in the local density approximation (LDA) using a plane wave basis with cut-off energy . The and semicore electrons of Mo were explicitly included in all calculations. Unless otherwise stated the calculations have been performed for the experimental lattice constant of . One-shot G0W0 calculations were performed using the LDA wave functions and eigenvalues to obtain the G0W0@LDA quasiparticle energies. A plane wave cut off of and 200 bands were used for the dielectric function, screened interaction and GW self-energy. Convergence with respect to these parameters has been checked very carefully. With these values band gaps were found to be converged within around . The plasmon pole approximation for the dielectric function was found to yield QP energies within of those obtained from full frequency dependence and was consequently used in all calculations. To avoid interaction between the periodically repeated MoS2 sheets, we have applied a truncated Coulomb interaction of the form , following Refs. Rozzi et al., 2006 and Ismail-Beigi, 2006. For details on the implementation of the GW method in the GPAW code we refer to Ref. Hüser et al., 2013. We note that we have used a numerical averaging of the head of the screened potential for all wavevectors in the Brillouin zone (similar to Eq. 9 in Sec. III.3). This was found to be crucial in all calculations with the full Coulomb interaction.
II.2 Results
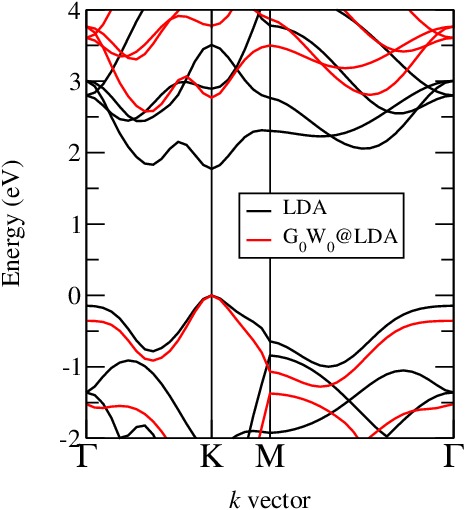
The band structure calculated using points and the truncated Coulomb interaction is shown in Fig. 1. At the LDA level, we find a direct band gap at the K point of while the smallest indirect gap of occurs from to a point along the -K direction. In contrast, G0W0 predicts an indirect gap of and at direct gap at K of .
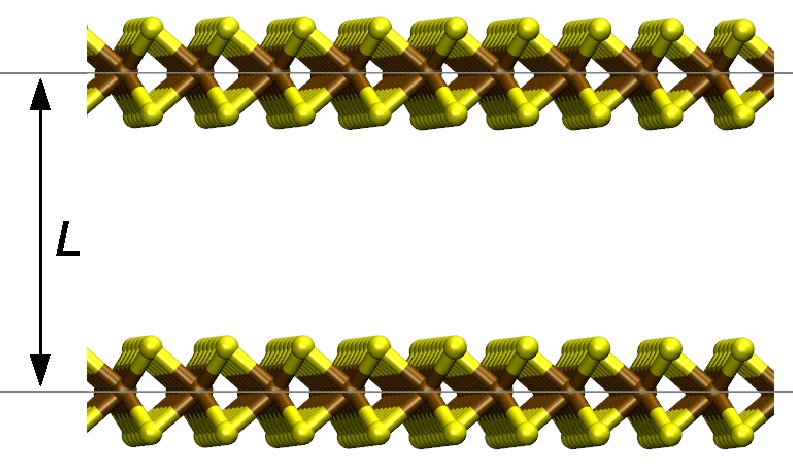
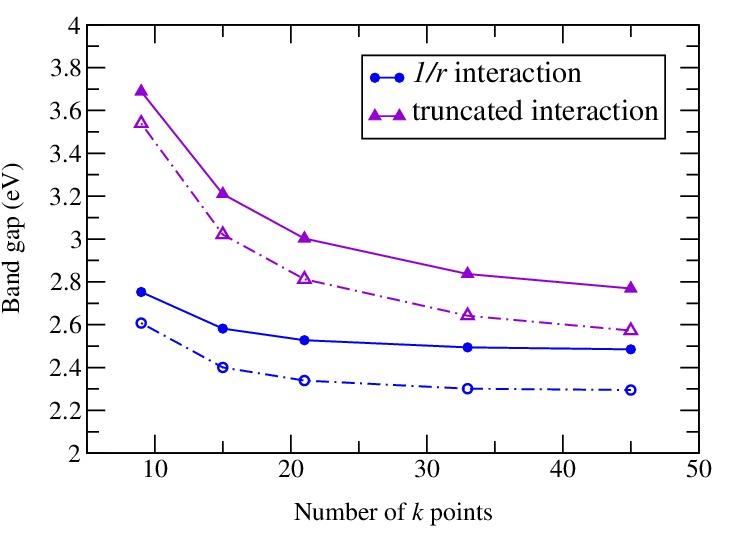
In Fig. 3 we show the convergence of both the direct and the indirect band gap with respect to the -point grid for a fixed interlayer separation of (see Fig. 2 for the definition of ). It is clear that a very dense -point grid is needed in order to obtain well-converged results with the truncated Coulomb interaction. For points, band gaps are converged within less than , while this is already the case for points with the bare Coulomb interaction. However, the calculated values are too low. The slow convergence with respect to points when the truncation is used will be discussed in detail in Sec. III.3.
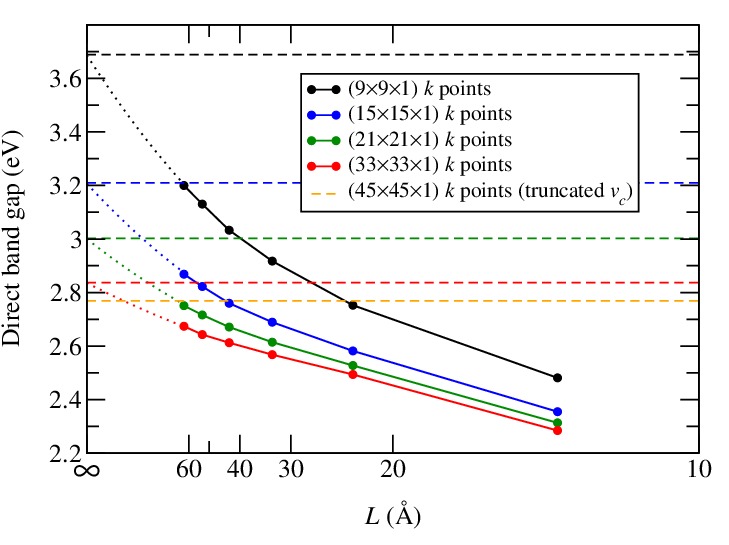
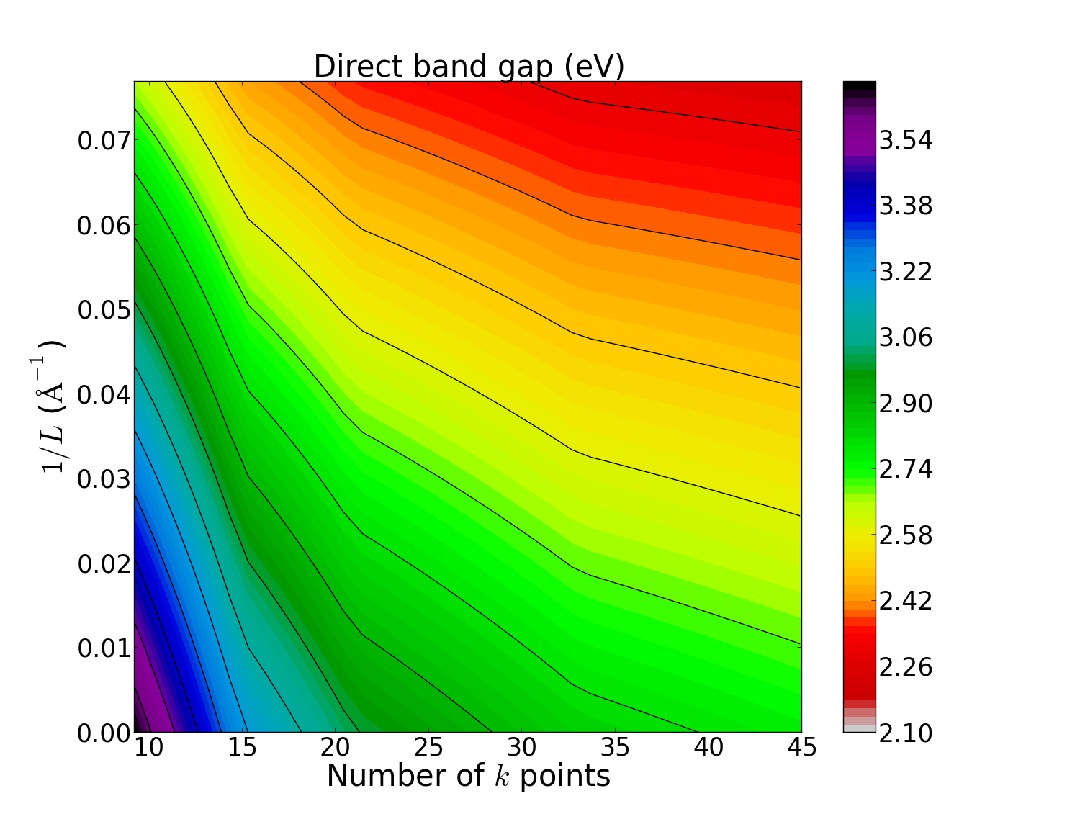
We see that results do not converge independently with respect to the number of points and the interlayer separation. In Fig. 4, we plot the -dependence of the direct band gap for different -point samplings with the bare interaction. The -point dependence becomes much stronger for large . For , the values are expected to converge to the results calculated with the truncation (indicated by dotted lines). They seem to exhibit a linear behaviour only for or very dense -point samplings. Fig. 5 shows all results and interpolated values in a contourplot as a function of and number of points. The effects of using more points and increasing are of different sign and partially cancel each other. This is the reason, why different choices of the two parameters yield the same results. Especially, the band gaps calculated with points and and points and are the same as with points and infinite . This seems, however, conincidental and we do not expect it to be the case for other systems.
We note that all calculations have been performed with a single point in the direction perpendicular to the layer. This is, however, insufficient for small interlayer distances. For , we find an increase of the band gap of around - when at least 3 points are used, for example. For or use of the truncation, this effect is negligible.
II.3 Comparison with previous work
In table 1 we show our converged results obtained with the truncated Coulomb interaction and points together with previous G0W0 results from the literature. For each reference we show the values used for the lattice constant, the interlayer separation and the -point sampling. It can be seen that all the previous calculations have used small layer separations and no truncation method. As pointed out in the preceding discussion, this gives a fast -point convergence. A properly converged calculation, however, requires larger separations and thereby more points. But as a consequence of a cancellation of errors, a calculation with layer separation and points yields almost the same band gaps as our converged result (within ). We are thus led to conclude that the reasonable agreement between our results and previous ones are to a large extent fortuitous.
Furthermore, the effect of strain can have a large impact on the MoS2 band gap. As demonstrated in Ref. Shi et al., 2013, using points and layer separation, the G0W0 band gap for the experimental lattice constant of is indirect. With a lattice constant of , corresponding to strain, the gap changes to direct. The lowering of the direct band gap becomes even more pronounced for larger lattice constants. As can be seen from the table our converged results predict the same trend, in particular the decrease of the direct gap as function of strain, with our values for the direct gap being generally larger. We note that for , the smallest indirect transition occurs from the point at the valence band to the K point at the conduction band. This is also in agreement with Ref. Shi et al., 2013. In the partially self-consistent GW0 calculations of Ref. Conley et al., 2013, the opposite trend was found, namely a transition from a direct to indirect band gap for % strain. However, a layer separation of only and less than 9 points in the in-plane directions were used.
| (eV) \bigstrut | ||||||
|---|---|---|---|---|---|---|
| Ref. | starting point | (Å) | number of -points | layer separation (Å) | direct | indirect \bigstrut |
| This work | LDA | 3.16 | 23 (truncated ) | 2.77 | 2.58 | |
| This work | LDA | 3.19 | 23 (truncated ) | 2.65 | 2.57 | |
| This work | LDA | 3.255 | 23 (truncated ) | 2.41 | 2.51 | |
| Ref. Molina-Sánchez et al.,2013 | LDA | 3.15 | 24 | 2.41 | ||
| Ref. Shi et al.,2013 | PBE | 3.16 | 19 | 2.60 | 2.49 | |
| Ref. Shi et al.,2013 | PBE | 3.19 | 19 | 2.50 | 2.55 | |
| Ref. Shi et al.,2013 | PBE | 3.255 | 19 | 2.19 | 2.19 | |
| Ref. Cheiwchanchamnangij and Lambrecht,2012 | LDA | 3.16 | 19 | 2.96 | – | |
| Ref. Komsa and Krasheninnikov,2012 | PBE | 3.18 | 20+ extrapolation | 2.97 | 3.26 | |
| Ref. Komsa and Krasheninnikov,2012 | PBE | 3.18 | 20 | 2.60 | 2.85 | |
| Ref. Ataca and Ciraci,2011 | LDA | 3.11 | 13 | 2.57 | – | |
| Ref. Ramasubramaniam,2012 | HSE | 3.18 | 15 | 2.82 | 3.00 | |
| Ref. Y. et al.,2011 | PBE | 3.19 | 15 | 2.66 | – | |
In Ref. Komsa and Krasheninnikov, 2012, the band gap was determined by extrapolating from to infinite layer separation, under the assumption that the gap scales linearly with the inverse distance between the layers. The obtained values for the direct and indirect band gaps are and , respectively. This is consistent with our findings using the truncated Coulomb interaction, the same lattice constant of and the same (under-converged) -point grid of as in Ref. Komsa and Krasheninnikov, 2012.
From our studies, we conclude that the G0W0@LDA band gap of monolayer MoS2 is indirect with a value of while the direct gap is , when the experimental lattice constant of is used. The question of how well the one-shot G0W0@LDA approximation describes the true electronic structure of this system remains open. Partially self-consistent GW0Shi et al. (2013) and fully self-consistent GWCheiwchanchamnangij and Lambrecht (2012) calculations have been shown to consistently yield direct band gaps of .
III Static screening
In this section we present a detailed investigation of the (static) dielectric properties of monolayer MoS2. This serves a dual purpose. First, it illustrates the origin of the slow convergence of the GW results presented in the previous section (and the BSE results presented in the next section). Secondly, it shows that the usual definition of the macroscopic dielectric constant of a periodic solid is not meaningful when applied to a 2D system represented in a periodic supercell. We discuss the difference between screening in 2D and 3D which becomes particularly pronounced in the limit with large consequences for the calculation of optical excitations with static screening of the electron-hole interaction (see next section).
III.1 3D macroscopic dielectric constant
The microscopic dielectric function determines the relation between a weak external potential and the total potential in the material,
| (1) |
For a periodic system the dielectric function can be conveniently expressed in plane waves
| (2) |
where is a reciprocal lattice vector, belongs to the 1. BZ. Within the random phase approximation (RPA) we have
| (3) |
where is the non-interacting density response function. Here, can be the Fourier representation of either the full or the truncated Coulomb interaction. For the calculations in this section we have used a cut-off for the reciprocal lattice vectors to account for local field effects. The non-interacting response function, , was constructed from local density approximation (LDA) wave functions and energies including states up to above the Fermi level. All calculations were performed with the projector augmented wave method code GPAW. Details on the implementation of the dielectric function in the GPAW code can be found in Ref. Yan et al., 2011.
It follows from Eq. (2) that the total potential resulting from a plane wave external potential has the form
| (4) |
where is a lattice periodic function. We thus define the macroscopic dielectric constant as
| (5) |
where denotes a spatial average over a unit cell. Note that in general because of local field effects.ADLER (1962); Wiser (1963)
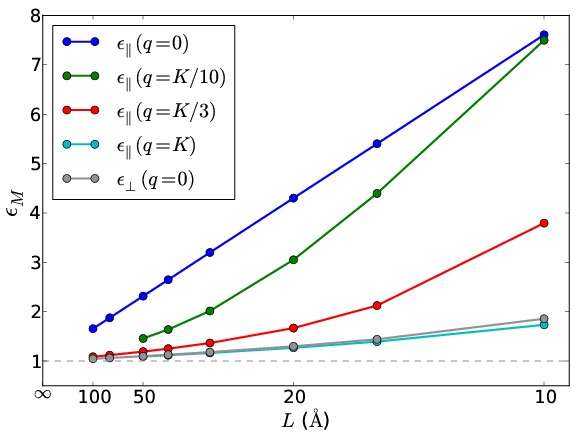
To explicitly demonstrate that Eq. (5) does not apply to low-dimensional materials, we have calculated the macroscopic dielectric constant as a function of the layer separation, . The results are shown in Fig. 6 for different values of the in-plane momentum transfer . We also show the dielectric constant corresponding to polarization orthogonal to the layer. Clearly the macroscopic dielectric constant approaches unity for all -vectors in the limit of large interlayer separation. This occurs because the total field is averaged over an increasingly larger vacuum region.
Previously reported values for the macroscopic dielectric constant of monolayer MoS2 lie in the range . Cheiwchanchamnangij and Lambrecht (2012); Ramasubramaniam (2012); Molina-Sanchez and Wirtz (2011) In these calculations the MoS2 layers were separated by vacuum. As can be seen from in Fig. 6 this is consistent with our results. However, it should also be clear that numbers depend on the distance between layers and in fact are not meaningful.
III.2 2D macroscopic dielectric constant
For a 2D material, the average of the total potential in the definition of the macroscopic dielectric constant must be confined to the region of the material. Since Eq. (4) still holds for a 2D material when is confined to the plane of the material, we average the in-plane coordinates () over the unit cell area and the out-of-plane coordinate () from to where denotes the center of the material and its width. The 2D macroscopic dielectric constant then becomes
| (6) |
where the sum is over all with . In this work we have taken corresponding to the interlayer separation in bulk MoS2. We shall return to the problem of chosing below.
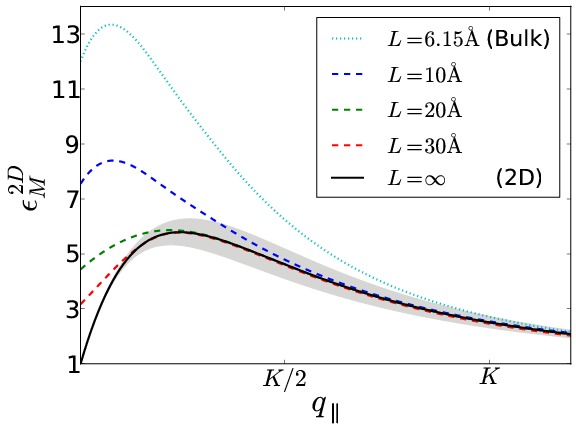
The results for the static dielectric constant evaluated from Eq. (III.2) using the bare Coulomb interaction is shown in Fig. 7 for four different layer separations. The result for coincides with the 3D dielectric constant of bulk MoS2 given by Eq. (5). The result obtained with the truncated Coulomb interaction is shown in black; it represents the case of infinite layer separation. Before discussing the results, it is instructive to consider the potential arising from a 2D charge density fluctuation of the form,
| (7) |
The corresponding potential follows from Poisson’s equation222This is most easily seen by performing a 3D Fourier transformation of , then multiplying by and Fourier transforming back to real space.
| (8) |
It follows that the potential perpendicular to the layer falls off exponentially over a characteristic distance of . This explains why in general coincides with the isolated layer result for .
The variation of when the parameter is changed by is indicated by the shaded region in Fig. 7. To the left of the maximum, is insensitive to since the induced potential is more or less constant over the averaging region. To the right of the maximum, the variation in follows the variation in . This is because for these wave vectors the induced potential has essentially vanished at the borders of the averaging region. In general, increasing (decreasing) will decrease (increase) in the large wave vector region.
Another characteristic feature of the potential in Eq. (8) is the scaling which should be compared with the form of the Coulomb potential from a 3D charge oscillation. Since the non-interacting response function, , scales as for for both 2D and 3D systems, it follows from Eq. (3) that , while this is in general not the case in 3D. In our calculations, the effect of interlayer interactions is eliminated by using a truncated Coulomb interaction of the form . For and in the limit of small , the Fourier representation of the truncated Coulomb interaction becomes , i.e. it scales as as the potential from the 2D charge density wave ensuring the correct limit .
Finally, we note that previous studiesCudazzo et al. (2011); Berkelbach et al. (2013) have employed a strict 2D model for the dielectric function in the small limit of the form . This form is convenient as it leads to an analytical expression for the screened interaction in 2D.Keldysh (1979) Our definition differs by being a 3D (or quasi 2D) quantity valid for general .
III.3 Screened interaction
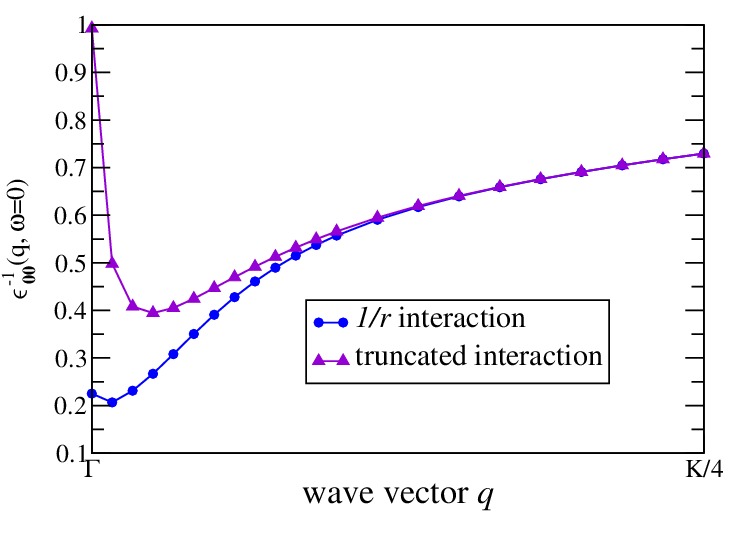
In Fig. 8 we show as a function of evaluated with and without the truncated Coulomb interaction. For small , the two curves differ significantly due to the long range nature of the induced potential (8). At large (), the induced potential decays within the cutoff range for the truncated Coulomb interaction and therefore no difference can be seen between the two methods. We emphasize that neither of the dielectric constants shown in the figure can be interpreted as a dielectric constant of monolayer MoS2, since they give the average potential over the supercell and not over the MoS2 layer. In particular their value will be highly dependent on the size of the unit cell (in the limit of infinite layer separation both will equal 1 for all ). Nevertheless, this quantity is a crucial ingredient of both the GW self-energy and the BSE kernel as it provides the screening of the divergent term of the Coulomb interaction.
For the Coulomb kernel diverges and we approximate by the integral
| (9) |
where is the Brillouin zone volume and is a small volume containing . In isotropic systems is usually constant in the vicinity of and the approximation works well. However, when is evaluated with the truncated Coulomb interaction, acquires much more structure for small as can be seen from Fig. 8. Thus, for coarse -point samplings we will underestimate the -point screening since we simply use .
The linear behavior of the screened interaction for small suggests that a better approximation for would be
| (10) |
Since the dielectric matrix in RPA is , we can derive an analytic expression for the first order Taylor expansion in , and its inverse. These quantities can be evaluated with vanishing additional cost, but we will leave the assessment of this approximation to future work.
IV Optical absorption spectrum
In this section we present many-body calculations of the optical absorption spectrum of monolayer MoS2 by solving the Bethe-Salpeter Equation (BSE) under the standard assumption of static screening of the electron-hole interaction. As for the GW band gap, we find that the use of a truncated Coulomb interaction is essential to avoid interlayer screening and obtain well converged exciton binding energies. Furthermore, the very strong q-dependence of the 2D static dielectric function around , leads to very slow -point convergence for the exciton binding energy.
In order to obtain an accurate absorption spectrum including excitonic effects we calculate the response function from the Bethe-Salpeter Equation (BSE). Using the standard assumption of a static dielectric screening of the electron-hole (e-h) interaction, the BSESalpeter and Bethe (1951) can be recast as an effective two-particle Hamiltonian,Strinati (1984) which is diagonalized on a basis of electron-hole pairs. In this way the excitonic eigenstates can be expressed as a linear combination of single-particle transitions
| (11) |
where , , and denote valence band, conduction band and Brillouin zone wave vector, respectively. The absorption spectrum is proportional to the imaginary part of the macroscopic dielectric function, which in the Tamm-Dancoff approximation can be written
| (12) |
where are the eigenvalues associated with .
In all calculations we have included a single valence band and a single conduction band in the BSE Hamiltonian. We have tested that the first excitonic peak is completely unaffected if we instead include 6 valence bands and 4 conduction bands. This is also expected since the highest (lowest) valence (conduction) band is well isolated from the remaining bands at K where the exciton is centered, see Fig. 1. For the screening we have included 65 bands in the evaluation of the response function, which is sufficient for converged results. Increasing the number of bands to 300 affects the position of the first exciton by less than . The plane wave cutoff for the response function (local field effects) was set to and we checked that the excitonic binding energy changed by less than when increasing the cutoff to . The dependence on -point sampling and interlayer separation will be examined below. Details on the implementation of the BSE method in the GPAW code can be found in Ref. Yan et al., 2012.
IV.1 Convergence tests
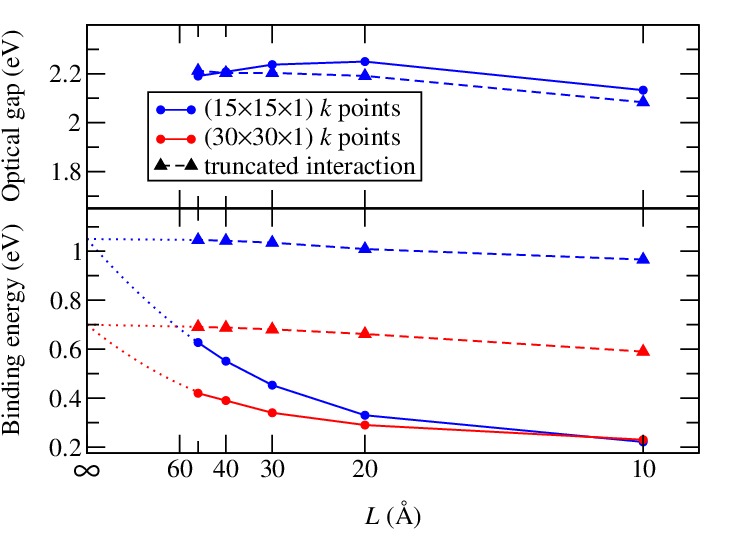
In the lower panel of Fig. 9, we show the exciton binding energy as a function of interlayer separation calculated for different -point samplings using the bare Coulomb interaction and the truncated Coulomb interaction. With the bare Coulomb interaction, the obtained results are far from convergence, even for . The dependencies on the layer separation and number of points is very similar as for the quasiparticle gap discussed in Sec. II.2, even on a quantitative level. Therefore, the optical gap, which is given by the difference of the QP gap and the exciton binding energy, is almost indenpedent of and whether or not the truncation method is used, as shown in the upper panel. This is consistent with the observations in Ref. Komsa and Krasheninnikov, 2012.
The convergence of the binding energy with respect to the -point sampling is plotted in Fig. 10 for an interlayer separation of . The truncated Coulomb kernel gives a much slower convergence with respect to the number of -points than the bare Coulomb interaction. However, it should be clear from Fig. 9 that the binding energy obtained with the bare Coulomb interaction converges to a value which is highly dependent on the interlayer separation. In Ref. Molina-Sánchez et al., 2013, convergence was found with points, but for a layer separation of only . The obtained exciton binding energy was around . According to our results, this is much too weak due to interlayer screening.
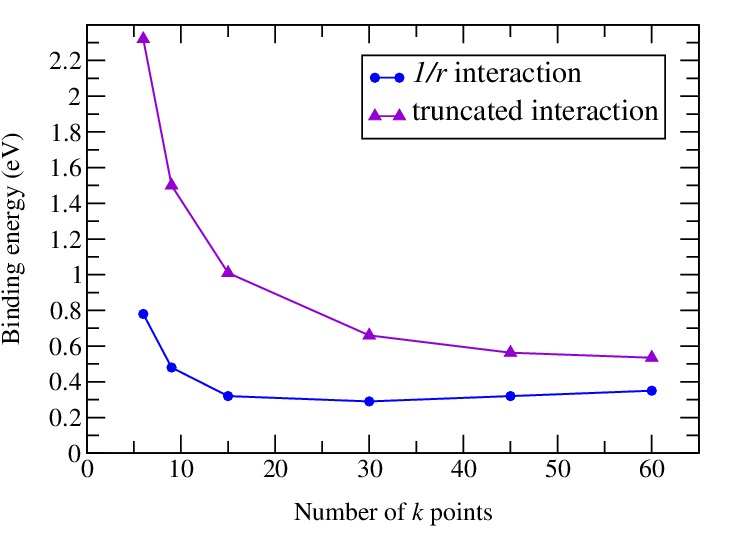
The slow -point convergence observed when using the truncated Coulomb interaction is related to the -dependence of the screening in two-dimensional systems. As demonstrated by Eq. (9) and Fig. 8 (blue curve), a too low -point sampling leads to an underestimation of the screening in the vicinity of and thus an overestimation of the exciton binding energy.
IV.2 Results
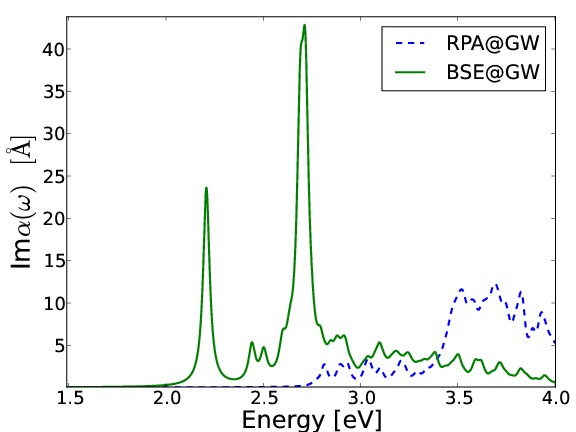
From the convergence tests described above we conclude that the BSE calculations are (nearly) converged if we use a truncated Coulomb interaction and a -point sampling. With these setting we have calculated the BSE spectrum on top of a G0W0 quasiparticle band structure obtained with the same parameters. The resulting absorption spectrum is shown in Fig. 11. We also show an RPA calculation, i.e. neglecting electron-hole interactions in the BSE, performed on top of the same G0W0 band structure for comparison. With electron-hole interaction included, we obtain an exciton binding energy of , whereas RPA does not show an exciton peak and simply gives an absorption edge at the band gap.
Experimentally, the absorption spectrum of single layer MoS2 exhibits a spin-orbit split peak around .Mak et al. (2010) Since we have not included spin-orbit coupling in our calculations, the spectrum Fig. 11 only shows a single peak at low energies. However, it has previously been shownRamasubramaniam (2012); Shi et al. (2013) that the spin-orbit coupling does not have a large effect on the exciton binding energy and only results in a split excitonic peak. The main peak in the BSE@G0W0 spectrum is situated at which is higher than the experimental value. At present we cannot say if this is due to an insufficient description of the quasiparticle gap within G0W0 or underestimation of the exciton binding energy in BSE with a static electron-hole interaction.
From the above discussion it should be clear that it is extremely challenging to converge the exciton binding energy with respect to interlayer separation and points. In general, the optical gap is much easier to converge with respect to interlayer separation than either the quasiparticle gap or the exciton binding energy.Wirtz et al. (2006); Komsa and Krasheninnikov (2012) Nevertheless, for many physical applications it is of importance to obtain accurate values for both the quasiparticle gap and the exciton binding energy separately. In Ref. Komsa and Krasheninnikov, 2012 the exciton binding energy was obtained by extrapolation of the quasiparticle gap calculated in a range of interlayer separations between and and assuming the same dependence for the exciton binding energy. Our results indicate that one should be cautious with such extrapolations. This is because the screening at different -points has a very different dependence on interlayer separation, which results in different convergence behavior at different -point samplings (see Fig. 9 full lines). The extrapolation procedure may therefore not give reliable results, since higher -point samplings are required at larger interlayer separation. We are aware that the convergence issues may depend a lot on the implementation of the BSE method. However, we have previously performed the same calculations with YAMBOMarini et al. (2009) code, which produced very similar convergence behavior for quasiparticle gap and exciton binding energy (also using truncated Coulomb cutoff and -point sampling).
V Conclusions
We have presented a careful investigation of the dielectric properties, band gap and excitonic states in a two-dimensional semiconductor exemplified by monolayer MoS2. We have demonstrated that the ”standard” macroscopic dielectric constant used for solids is not applicable (meaningless) to supercells describing the 2D material as an infinite array of parallel sheets, and therefore replaced it by a 2D version in which the induced field is averaged over the extent of the material rather than over the entire supercell. We showed that the effect of interlayer screening leads to underestimation of the band gap and exciton binding energy by up to more than for layer separations . The reason for this is that interlayer screening affects for where is the distance between layers in the supercell. Since it is the small limit of that is most important for the screened interaction , the effect cannot be neglected. Here we have circumvented the problem by using a truncated Coulomb interaction that explicitly cuts off the interaction between neighboring layers.
The properly defined 2D dielectric function has a very sharp wave vector dependence for small and satisfies in general. This has the consequence that quasiparticle- and optical excitations obtained from the GW and Bethe-Salpeter Equation, respectively, require much denser -point grids than experience from 3D systems would suggest. For MoS2 we find that a precision of requires -point grids of at least . Interestingly, the effect of interlayer screening and too small -point grids have opposite effects on the band gap and exciton energies leading to fortuitous error cancellation. Our calculations applying the truncated Coulomb interaction and points give G0W0@LDA gaps of (direct) and (indirect) and binding energy of the lowest exciton of . This places the lowest exciton at which is higher than the experimental result. This difference may be due to the G0W0@LDA approximation or the use of static screening in the BSE.
VI Acknowledgement
KST acknowledges support from the Danish Council for Independent Research’s Sapere Aude Program through grant no. 11-1051390. The Center for Nanostructured Graphene (CNG) is sponsored by the Danish National Research Foundation, Project DNRF58.
References
- Novoselov et al. (2005) K. S. Novoselov, D. Jiang, F. Schedin, T. J. Booth, V. V. Khotkevich, S. V. Morozov, and A. K. Geim, Proc. Natl. Acad. Sci. U.S.A. 102, 10451 (2005).
- Radisavljevic et al. (2011) B. Radisavljevic, A. Radenovic, J. Brivio, V. Giacometti, and A. Kis, Nature Nanotechnology 6, 147 (2011).
- Kaasbjerg et al. (2012) K. Kaasbjerg, K. S. Thygesen, and K. W. Jacobsen, PHYSICAL REVIEW B 85, 115317 (2012).
- Shi et al. (2013) H. Shi, H. Pan, Y.-W. Zhang, and B. I. Yakobsen, Phys. Rev. B 87, 155304 (2013).
- Yan et al. (2012) J. Yan, K. W. Jacobsen, and K. S. Thygesen, PHYSICAL REVIEW B 86, 045208 (2012).
- Britnell et al. (2013) L. Britnell, R. M. Ribeiro, A. Eckmann, R. Jalil, B. D. Belle, A. Mishchenko, Y. J. Kim, R. V. Gorbachev, T. Georgiou, S. V. Morozov, et al., SCIENCE 340, 1311 (2013).
- Mak et al. (2010) K. F. Mak, C. Lee, J. Hone, J. Shan, and T. F. Heinz, Phys. Rev. Lett. 105, 136805 (2010).
- Splendiani et al. (2010) A. Splendiani, L. Sun, Y. Zhang, T. Li, J. Kim, C.-Y. Chim, G. Galli, and F. Wang, Nano Lett. 10, 1271 (2010).
- Bernardi et al. (to be published) M. Bernardi, M. Palummo, and J. C. Grossman, Nano Lett. (to be published).
- Wang et al. (2012) Q. H. Wang, K. Kalantar-Zadeh, A. Kis, J. N. Coleman, and M. S. Strano, Nature Nanotechnology 7, 699 (2012).
- Bollinger et al. (2001) M. V. Bollinger, J. Lauritsen, K. W. Jacobsen, J. K. Nørskov, S. Helveg, and F. Besenbacher, Phys. Rev. Lett. 87, 196803 (2001).
- Jaramillo et al. (2007) T. F. Jaramillo, K. P. Jørgensen, J. Bonde, J. H. Nielsen, S. Horch, and I. Chorkendorff, Science 317, 100 (2007).
- Zong et al. (2008) X. Zong, H. Yan, G. Wu, G. Ma, F. Wen, L. Wang, and C. Li, J. Am. Chem. Soc. 130, 7176 (2008).
- Frindt and Yoffe (1963) R. F. Frindt and A. D. Yoffe, Proc. R. Soc. Lond. A 273, 69 (1963).
- Evans and Young (1965) B. L. Evans and P. A. Young, Proc. R. Soc. Lond. A 284, 402 (1965).
- Wilson and Yoffe (1969) J. A. Wilson and A. D. Yoffe, Adv. Phys. 18, 193 (1969).
- Neville and Evans (1976) R. A. Neville and B. L. Evans, Phys. Stat. Sol. B 73, 597 (1976).
- Frey et al. (1998) G. L. Frey, S. Elani, M. Homyonfer, Y. Feldman, and R. Tenne, Phys. Rev. B 57, 6666 (1998).
- Newcomer and Samara (1997) J. P. W. Newcomer and G. A. Samara, J. Appl. Phys. 81, 7934 (1997).
- Coehoorn et al. (1987) R. Coehoorn, C. Haas, and R. A. de Groot, Phys. Rev. B 35, 6203 (1987).
- Cheiwchanchamnangij and Lambrecht (2012) T. Cheiwchanchamnangij and W. R. L. Lambrecht, Phys. Rev. B 85, 205302 (2012).
- Komsa and Krasheninnikov (2012) H.-P. Komsa and A. V. Krasheninnikov, Phys. Rev. B 86, 241201 (2012).
- Ataca and Ciraci (2011) C. Ataca and S. Ciraci, The Journal of Physical Chemistry C 115, 13303 (2011), eprint http://pubs.acs.org/doi/pdf/10.1021/jp2000442, URL http://pubs.acs.org/doi/abs/10.1021/jp2000442.
- Ramasubramaniam (2012) A. Ramasubramaniam, Phys. Rev. B 86, 115409 (2012).
- Molina-Sánchez et al. (2013) A. Molina-Sánchez, D. Sangalli, K. Hummer, A. Marini, and L. Wirtz, Phys. Rev. B 88, 045412 (2013), URL http://link.aps.org/doi/10.1103/PhysRevB.88.045412.
- Conley et al. (2013) H. J. Conley, B. Wang, J. I. Ziegler, R. F. Haglund, S. T. Pantelides, and K. I. Bolotin, Nano Lett. 13, 3626 (2013).
- Keldysh (1979) L. V. Keldysh, JETP Lett. 29, 658 (1979).
- Molina-Sanchez and Wirtz (2011) A. Molina-Sanchez and L. Wirtz, Phys. Rev. B 84, 155413 (2011).
- Enkovaara et al. (2010) J. Enkovaara, C. Rostgaard, J. J. Mortensen, J. Chen, M. Dułak, L. Ferrighi, J. Gavnholt, C. Glinsvad, V. Haikola, H. A. Hansen, et al., Journal of Physics: Condensed Matter 22, 253202 (2010), URL http://stacks.iop.org/0953-8984/22/i=25/a=253202.
- Rozzi et al. (2006) C. A. Rozzi, D. Varsano, A. Marini, E. K. U. Gross, and A. Rubio, Phys. Rev. B 73, 205119 (2006).
- Ismail-Beigi (2006) S. Ismail-Beigi, Phys. Rev. B 73, 233103 (2006).
- Hüser et al. (2013) F. Hüser, T. Olsen, and K. S. Thygesen, Phys. Rev. B 87, 235132 (2013), URL http://link.aps.org/doi/10.1103/PhysRevB.87.235132.
- Y. et al. (2011) D. Y., Y. Wang, J. Ni, L. Shi, S. Shi, and W. Tang, Physica B 406, 2254 (2011).
- Yan et al. (2011) J. Yan, J. J. Mortensen, K. W. Jacobsen, and K. S. Thygesen, Phys. Rev. B 83, 245122 (2011), URL http://link.aps.org/doi/10.1103/PhysRevB.83.245122.
- ADLER (1962) S. ADLER, PHYSICAL REVIEW 126, 413+ (1962), ISSN 0031-899X.
- Wiser (1963) N. Wiser, Phys. Rev. 129, 62 (1963), URL http://link.aps.org/doi/10.1103/PhysRev.129.62.
- Cudazzo et al. (2011) P. Cudazzo, I. V. Tokatly, and A. Rubio, Phys. Rev. B 84, 085406 (2011), URL http://link.aps.org/doi/10.1103/PhysRevB.84.085406.
- Berkelbach et al. (2013) T. C. Berkelbach, M. S. Hybertsen, and D. R. Reichman, Phys. Rev. B 88, 045318 (2013), URL http://link.aps.org/doi/10.1103/PhysRevB.88.045318.
- Salpeter and Bethe (1951) E. E. Salpeter and H. A. Bethe, Phys. Rev. 84, 1232 (1951).
- Strinati (1984) G. Strinati, Phys. Rev. B 29, 5718 (1984).
- Wirtz et al. (2006) L. Wirtz, A. Marini, and A. Rubio, Phys. Rev. Lett. 96, 126104 (2006).
- Marini et al. (2009) A. Marini, C. Hogan, M. Grüning, and D. Varsano, Comp. Phys. Comm. 180, 1392 (2009).