Rheology of Cubic Blue Phases
Oliver Henrich ∗a,b, Kevin Stratford a, Peter V. Coveney b, Michael E. Cates c, Davide Marenduzzo c
DOI: 10.1039/c3sm50228g
We study the behaviour of cubic blue phases under shear flow via lattice Boltzmann simulations. We focus on the two experimentally observed phases, Blue Phase I (BPI) and Blue Phase II (BPII). The disclination network of Blue Phase II continuously breaks and reforms under steady shear, leading to an oscillatory stress response in time. For larger shear rates, the structure breaks up into a Grandjean texture with a cholesteric helix lying along the flow gradient direction. Blue Phase I leads to a very different response. Here, oscillations are only possible for intermediate shear rates – very slow flow causes a transition of the initially ordered structure into an amorphous network with an apparent yield stress. Larger shear rates lead to another amorphous state with different structure of the defect network. For even larger flow rates the same break-up into a Grandjean texture as for Blue Phase II is observed. At the highest imposed flow rates both cubic blue phases adopt a flow-aligned nematic state. Our results provide the first theoretical investigation of sheared blue phases in large systems, and are relevant to understanding the bulk rheology of these materials.
JCMB Kings Buildings, Mayfield Road, Edinburgh EH9 3JZ, UK; E-mail: ohenrich@epcc.ed.ac.uk††footnotetext: b Centre for Computational Science, University College London,
20 Gordon Street, London WC1H 0AJ, UK††footnotetext: c SUPA, School of Physics and Astronomy, University of Edinburgh,
JCMB Kings Buildings, Mayfield Road, Edinburgh EH9 3JZ, UK
1 Introduction
Cholesterics are liquid crystals in which the local nematic director field shows spontaneous twist in thermodynamic equilibrium 1. The simplest manifestation is the standard cholesteric phase where the director precesses around a single helical axis of fixed orientation. For highly chiral systems, however, the preferred configuration close to the isotropic boundary features twist around two perpendicular axes, as opposed to just one axis in the regular cholesteric state, and the corresponding deformation is denoted a “double-twist cylinder”. As it is topologically impossible to cover continuously 3D space with double-twist cylinders, defects arise. The resulting disclination lines (at which the nematic director is undefined) organise into a variety of regular periodic lattices, giving rise to the so-called cubic blue phases (BPs) 2, 3. There are two experimentally observed cubic blue phases, BPI and BPII (a third, BPIII, is thought to be amorphous 4).
BPs were long considered as purely of academic interest due to their very narrow range of stability. This view has changed since the creation of polymer-stabilised and other thermally stabilised BPs 5, 6, which has opened up the possibility of novel applications. During the last few years considerable progress has been achieved regarding the behaviour of BPs in confined geometries 7, 8, 9, under external fields 10, 11, 12, 13, 14, and in the presence of colloidal particles 15. The kinetics of BP domain growth have been recently addressed 16. However, our understanding of their dynamical behaviour under flow remains very limited. The aim of this work is to address this issue by studying, for the first time, the response of large BP samples to a shear flow.
Flow response in cholesterics is both strongly non-Newtonian and highly anisotropic. For example, if a standard cholesteric phase is subjected to a Poiseuille flow along its helical axis, small pressure differences drive flow mainly through “permeation”, as first investigated by Helfrich 17. In the permeation mode the liquid crystal flows while leaving the director field virtually unchanged, which leads to high dissipation and large viscosities. Early experiments with cholesteric liquid crystals showed that flow can also give rise to conformational transitions. 18. Marenduzzo et al. 19, 20 simulated shear and Poiseuille flow in cholesteric liquid crystals in the permeation mode, and showed the importance of the boundary conditions in determining the apparent viscosity of the fluid. They also found that a strong secondary flow appears. Rey 21, 22 theoretically studied shear in cholesterics oriented with the helix along the vorticity axis and found that, at low Ericksen number, travelling twist waves appear which lead to the rotation of the cholesteric helix. At higher forcing, the helix uncoils, creating a flow-induced nematic phase. However, this result was derived under the assumption that the molecules rotate only in flow-gradient plane whilst the orientation of the cholesteric helix remained unchanged. Rey also studied cholesterics subjected to both steady flow and low frequency small amplitude oscillatory shear for different helix orientations 23, 24. He found that splay/bend/twist deformations were excited when the helix was aligned along the flow direction; splay/bend deformation occurred when the helix was aligned along the velocity gradient; but only twist deformations appeared when the helix was aligned along the vorticity axis.
Dupuis et al. 25 performed the first numerical investigation of BP rheology in Poiseuille flow, starting from equilibrium structures of BPI and BPII and a periodic array of doubly twisted cylinders. Under small forcing, the network opposed the flow, giving rise to a significant increase in apparent viscosity. Upon increasing the forcing they found clear evidence of shear thinning. In the crossover region they predicted a novel oscillatory regime where the network continuously breaks and reforms as portions of the disclinations in the centre of the channel move to neighbouring cells and relink with the parts of the network left behind by the flow. The viscosity still decreases with forcing (the system shear thins) but much less than for cholesterics in the permeation mode, which is in agreement with experiments 26, 27.
Our work differs from these earlier efforts as it addresses homogeneous shear flows, and focuses on flow-induced reconstruction and nonequilibrium transition between different blue phase networks, which appear at intermediate or high shear. Our simulations employ Lees-Edwards boundary conditions, which are naturally suited to address these regimes, and bulk as opposed to boundary-dominated flow. Our simulations are large scale and parallel, so that we can study significantly larger systems than previously possible, and our results can in principle be compared with bulk rheology experiments.
Our paper is organised as follows. In Section II, we describe the method we use and review the hydrodynamic equations of motion which we aim to solve. In Section III, we report our numerical results, separating them into subsections referring to Blue Phase I and Blue Phase II, and corresponding to low, intermediate, and high shear. Finally, we draw our conclusions in Section IV.
2 Model and Methods
Our approach is based on the well-established Beris-Edwards model for hydrodynamics of cholesteric liquid crystals 28, which describes the ordered state in terms of a traceless, symmetric tensor order parameter . In the uniaxial approximation, the order parameter is given by with the director field and the amplitude of nematic order. More generally, the largest eigenvalue of , characterises the local degree of orientational order. The thermodynamic properties of the liquid crystal are determined by a free energy , whose density consists of a bulk contribution and a gradient part , as follows,
| (1) |
The first term contains a bulk-free energy constant and the temperature-related parameter which controls the magnitude of order. The second part quantifies the cost of elastic distortions, which is proportional to the elastic constant ; we work for simplicity in the one-elastic constant approximation 1. The wavevector is equal to , where is the cholesteric pitch. The actual periodicity of the BP structure, , does not need to be equal to . Indeed, the “redshift” is adjusted during the equilibration phase of the simulation, to optimise the free energy density before shearing begins – this is done by following the procedure previously described in 29.
A thermodynamic state is specified by two dimensionless quantities: the reduced temperature
| (2) |
which vanishes at the spinodal point of a nematic (), and the reduced chirality
| (3) |
which measures the ratio of gradient to bulk free energy.
The dynamical evolution of the order parameter is given by the equation
| (4) |
The first term on the left hand side of Eq.4 is a material derivative, which describes the rate of change of a quantity advected by the flow. The second term accounts for the rate of change due to local velocity gradients , and is explicitly given by 28
| (5) | |||||
where denotes the tensorial trace, while and are the symmetric and antisymmetric part of the velocity gradient, respectively. is a constant depending on the molecular details of the liquid crystal. Flow alignment occurs if has a real solution for , the so-called Leslie angle: we select this case by setting in our simulations. is the molecular field, which is a functional derivative of that respects the tracelessness of :
| (6) |
The rotational diffusion constant in Eq. 4 is proportional to the inverse of the rotational viscosity 1.
The time evolution of the fluid density and velocity are respectively governed by the continuity equation , and the following Navier-Stokes equation:
| (7) |
This emerges from the Chapman-Enskog expansion of the lattice Boltzmann (LB) equations that we solve numerically. A further term that formally appears in this expansion is negligible under the slow flows considered here for which the fluid motion is almost incompressible 30. is an isotropic background viscosity which is set to in LB units (these are discussed below, see 4, 16). The thermodynamic stress tensor reads explicitly
and is responsible for strong non-Newtonian flow effects. In the isotropic state and Eq.LABEL:Pi reduces to the scalar pressure as would appear in Eq. 7 for a Newtonian fluid.
We next define a dimensionless number that describes the deformation of the director field under flow. This so-called Ericksen number is given by
| (9) |
with and defined previously, and and a typical velocity and length scale. In the present work was used as this is the approximate size of the BP unit cell. Likewise, was taken to be the velocity difference across one unit cell, i.e. . The elastic constants were (BPII) and (BPI), respectively.
The system of coupled partial differential equations 4 and 7 is solved by means of a hybrid method 31 which uses a combination of lattice Boltzmann and finite difference schemes. (This is in contrast with some earlier methods using solely LB 30, 32.) The Navier-Stokes equation is solved via the lattice Boltzmann approach, using a standard three-dimensional model with 19 discrete velocities (D3Q19). A regular lattice with spacing is used and the time step is in lattice units. Coupling to the thermodynamic sector is via a local body force computed as the divergence of the thermodynamic stress Eq. LABEL:Pi; the resulting velocity field is used in the computation of the time evolution of via a standard finite difference method using the same grid and the same time step as the LB. The system is periodic in all three coordinate directions. Sliding boundary conditions, or Lees-Edwards planes 33, are explicitly implemented in both hydrodynamic and thermodynamic sectors to impose shear on the system. The same method with Lees-Edwards planes has been used successfully to study binary mixtures, particle suspensions 34, 35, emulsions 36 and smectic liquid crystals 37. A more detailed discussion of our use of Lees-Edwards boundary conditions can be found in the Appendix.
In the following we report results of simulations of the bulk flow behaviour of the cubic Blue Phases BPI and BPII. Typical runtimes for system size on 512 processes were in the region of 18 to 24 hours. The timestep and lattice spacing in lattice Boltzmann units (LBU) can be mapped approximately to and in SI units, respectively. The LB unit of stress is equal to about Pa. Further details about the conversion from LBU to SI units can be found elsewhere 4, 16. In what follows, , and denote respectively the velocity, velocity gradient and vorticity direction; is therefore the shear stress.
3 Results and Discussion
For typical simulations reported in this work, we chose as initial conditions thermodynamic states that are well inside the equilibrium region of the individual blue phase, and far away from the cholesteric-isotropic transition. Thus, temperature and chirality were in case of BPI and for BPII, respectively. For these parameters the total free energy density remained always negative at all flow rates simulated. Since by Eq. 1 for an isotropic phase with , this means that our system, which is never far from equilibrium locally even under flow, always remains in a liquid crystalline state. We also performed selected simulations on metastable states at higher and lower temperatures, and at different chiralities, but did not find any significant differences in the general flow behaviour from that described below. The only quantitative difference we found was that, for thermodynamic states that are closer to the phase boundary than the one we focused on (and describe below), the critical shear rate at which the disclination network broke up into chiral nematic states was lower. This is expected as these states have on average higher free energy densities and smaller order parameters than those we focus on in what follows, and cannot therefore withstand the same external forces before breaking down.
As usual in BP simulation studies 4, 16, we initialised our runs with analytical solutions that minimise the free energy functional Eq.1 in the high-chirality limit and equilibrated these configuration for 5000 LB timesteps before we started the shear flow. During the equilibration sequence the optimal redshift was calculated and applied at every timestep. After equilibration the redshift was kept constant throughout the rest of the simulation with shear flow (as it is no longer justified to optimise the free energy in a nonequilibrium scenario). We chose a pitch length of 32 LBU for BPII and 64 LBU in case of BPI, and we considered in both cases 4 unit cells along each coordinate direction, for a total of 64 unit cells in our simulation box. Runs with higher resolution confirmed that this choice was adequate to track all kinematic details of the blue phase networks in shear flow. This includes reconstruction of the unit cell not accessible in simulation with only few cells 25.
Simple shear flow was imposed by means of the Lees-Edwards boundary conditions with the top (bottom) part of the system flowing in the positive (negative) -direction and the velocity gradient along the -direction. The shear rates were varied over more than three orders of magnitude from about to LBU. For clarity we classify various flow regimes, namely three in the case of Blue Phase II and five in the case of Blue Phase I. These regimes comprise those with periodically recurring conformations and oscillatory stress response (PRC), amorphous networks (AN), as well as those featuring a Grandjean texture (GJ) which may be partly frustrated (FGJ) and a flow-aligned nematic state (FN). GJ and FN occur in both blue phases as steady states regardless of the initial state.
These regimes are characterised by the following approximate flow rates:
| Name | ||
|---|---|---|
| BPI-1 (AN) | ||
| BPI-2 (PRC) | ||
| BPI-3 (AN) | ||
| BPI-4 (GJ, FGJ) | ||
| BPI-5 (FN) | ||
| BPII-1 (PRC) | ||
| BPII-2 (GJ) | ||
| BPII-3 (FN) |
As is standard 16, 38 disclination lines are represented by plotting an isosurface of the scalar order parameter . Typical choices are for BPI and for BPII. (Note that is small but non-zero at the disclination core. The director is undefined there because the largest and second largest eigenvalues of coincide.)
3.1 Blue Phase II
We start our discussion with BPII as its flow behaviour is somewhat simpler than that of BPI. BPII has simple cubic symmetry and the disclination lines intersect and form a characteristic network of nodes. Ahead of the more detailed discussion we provide first a general overview of the flow behaviour at all applied shear rates.


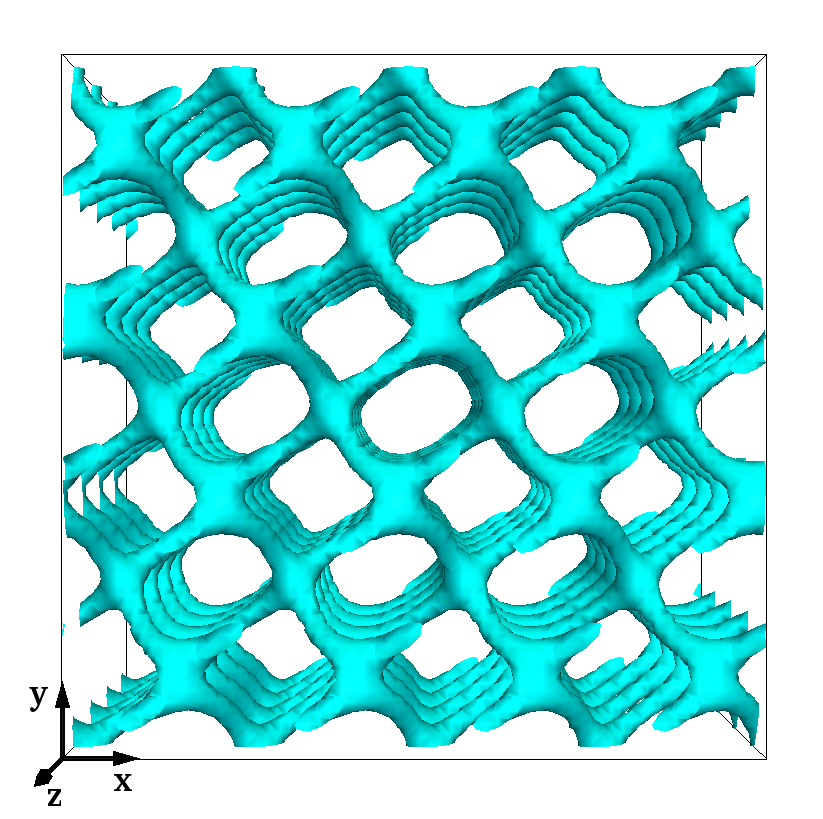
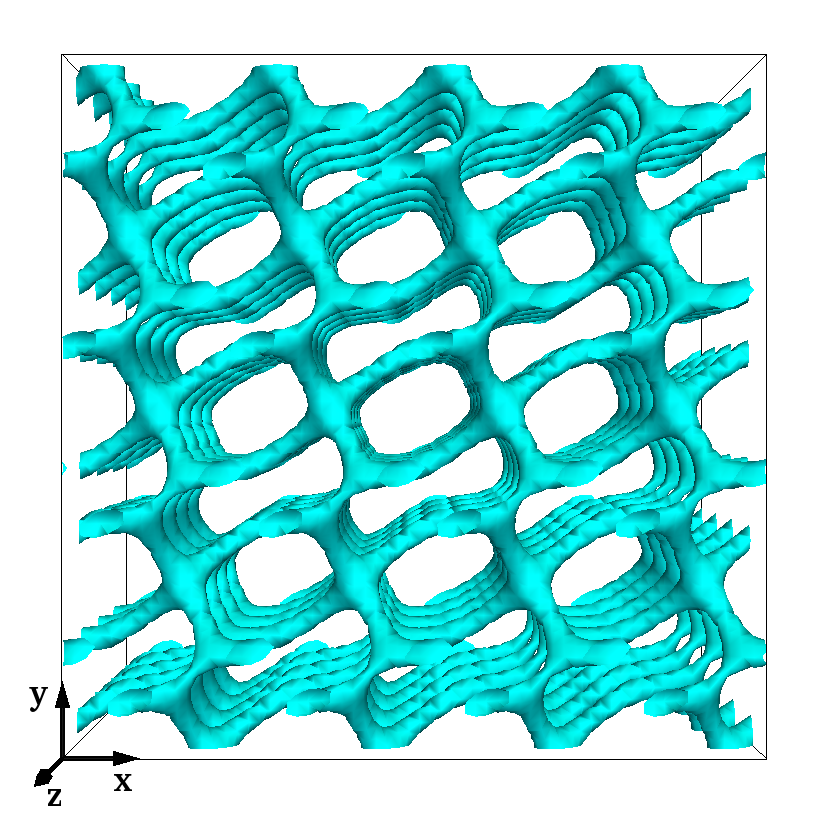
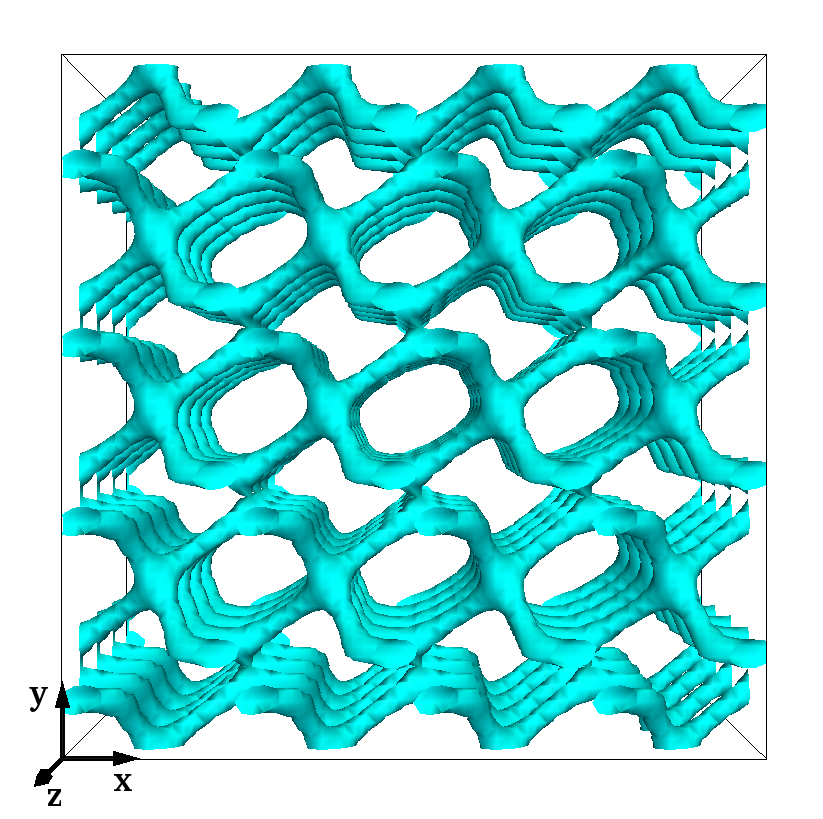
Fig. 1 shows a flow curve, defined as time averages of the shear stress as a function of shear rate . Time averages were taken as average over one stress cycle in the steady state. Where no oscillations occurred we used the final value at the end of the run. For the lowest up to intermediate shear rates, the regime we refer to as BPII-1, a power law fit with describes the data to a very good approximation. This holds true even in regime BPII-2, where the network breaks up and the liquid crystal adopts a Grandjean structure with the helical axis oriented along the flow gradient direction (). The coefficients of the power law fit are here and . Hence, for the range of shear rates which we have explored here, the degree of shear-thinning is remarkably small in BPII.
Fig. 2 shows the ratio between the apparent viscosity, defined as , and the background viscosity over total strain. A numerical value of corresponds to a fully Newtonian flow, without any additional stress contribution from the liquid crystal. The top picture shows data for regime BPII-1, where the periodic break-up and reconnecting of the network in shear flow causes sinusoidal oscillations in . As noted in the Appendix, the absence of a permeation mode at very low shear rates may be due to our choice of boundary conditions. We refer the reader to the Appendix for a detailed discussion.
We observe another configuration, lying between those with periodically recurring conformations and the flow-aligned nematic state at shear rates (). In this interval the network breaks up completely into a simple cholesteric liquid crystal, and oscillations in the stress signal are absent. The helical axis lies along the flow gradient direction (the so-called Grandjean texture 1) and the liquid crystal is flowing in “nematic planes” with the director predominantly oriented in flow-vorticity plane and having only a small angle with the flow direction. The picture at the bottom of Fig. 2 shows data for this regime, to which we refer as BPII-2. The curves for the two largest flow rates are for BPII-3, the flow-aligned nematic state. We will address these regimes in section 3.3, as they are common to both cubic blue phases BPI and BPII.
The travelling helical wave which was identified in 21, 22 when shearing a cholesteric helix along the vorticity axis turns out to be a metastable flow state as it features larger free energies, higher stresses and dissipation due to the tumbling motion of the director field, which are completely absent in the Grandjean texture. For even higher shear rates the system undergoes a transition to a flow-aligned nematic state.
In the next sections we investigate the BPII-1 flow regime in more detail by looking at the kinetics of the disclination network.
3.1.1 Regime BPII-1: low and intermediate shear rates
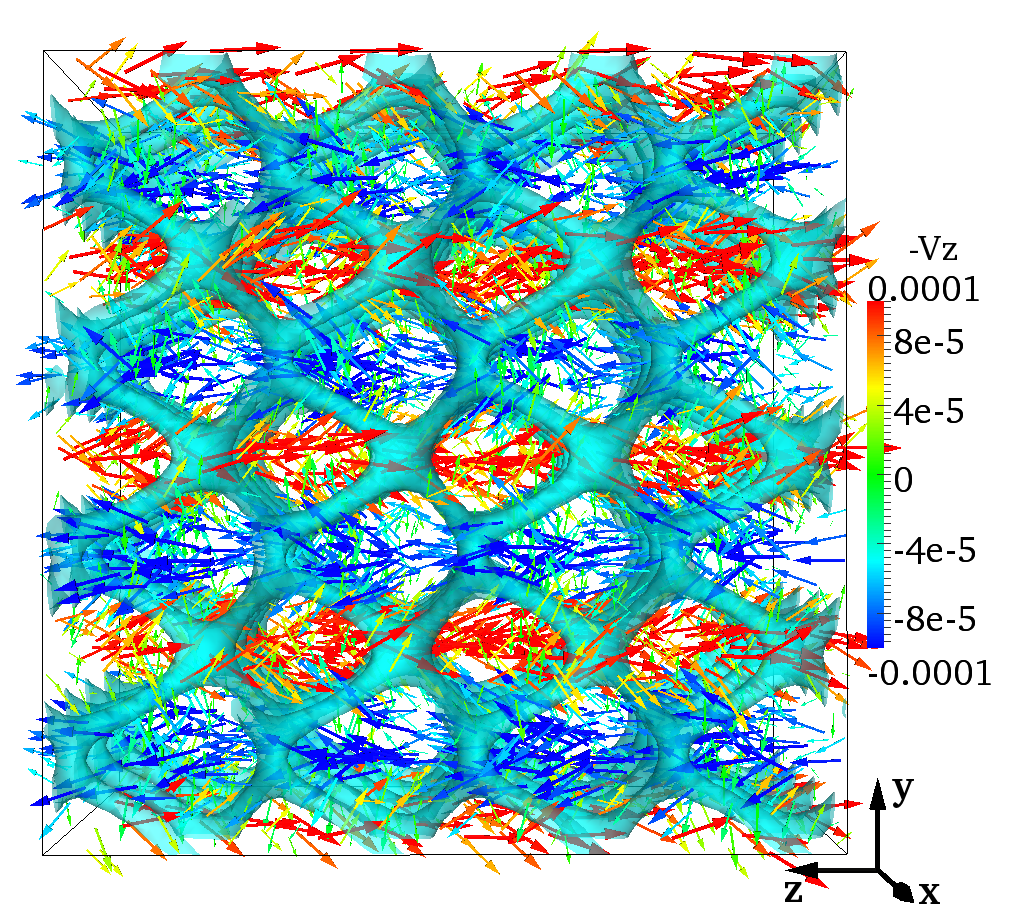
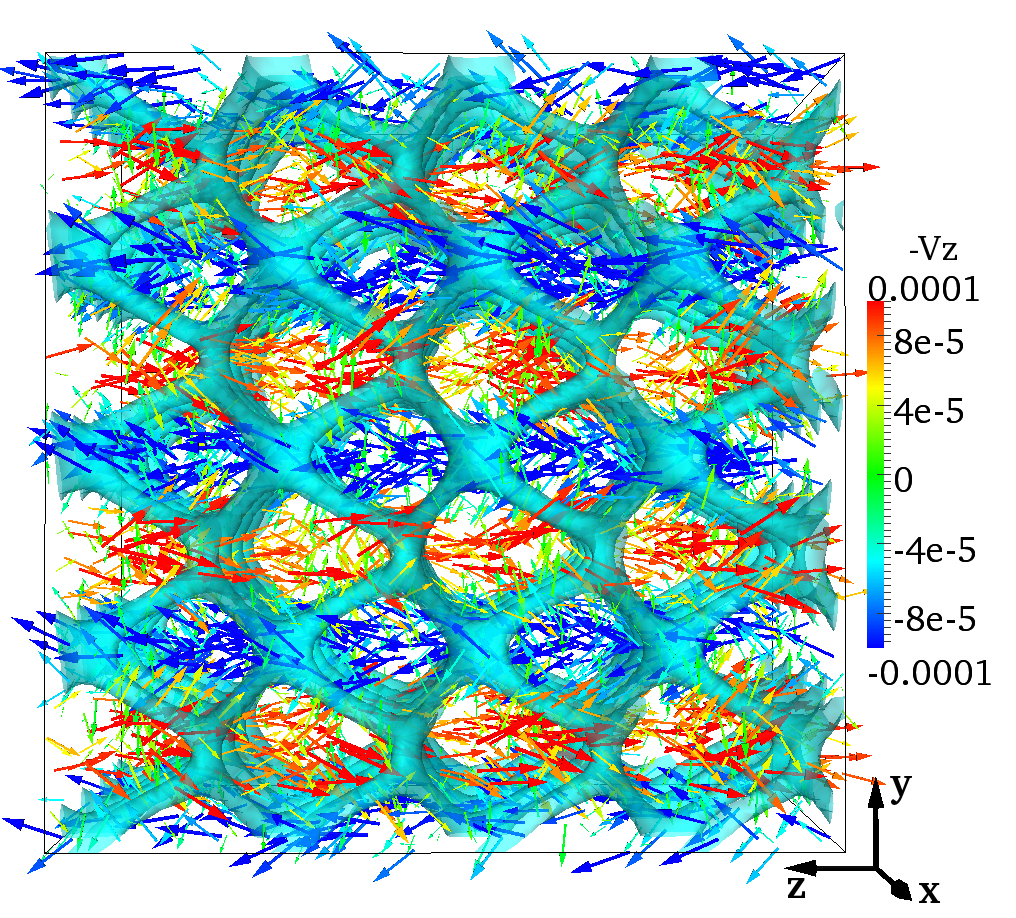
Fig. 3 shows the disclination network in shear flow as it undergoes homogeneous shearing in the BPII-1 flow regime. The disclination lines break up and reconnect further downstream, forming a periodically recurring pattern. The period needed for a pattern to break up and reform along the flow direction is .
The general appearance of the flowing network is, apart from the homogeneous distortion, very close to that of the quiescent blue phase at equilibrium. This holds for all shear rates in the BPII-1 regime.
Interestingly, while being displaced with the flow the entire network moves along the vorticity direction () as well. A similar behaviour has been recently observed for blue phases in shear flow in confined geometries 38. In contrast to the stick-slip motion that has been reported there, in this case the movement is steady. The vorticity motion occurs in such a way that the positions of breakup and reconnection point in the network, visible in Fig. 3, are slightly offset and allow the network to travel along the -direction. The periodicity of the motion along the vorticity direction is , i.e. it takes a displacement of six unit cells along (the flow direction) for the network to move one unit cell along (the vorticity direction).
Fig. 4 shows the disclination network in the middle of a breakup-reconnection cycle, with superimposed velocity vectors. The plot shows the secondary velocity components, obtained by projecting the velocity onto a plane perpendicular to the flow direction. This gets rid of the dominating velocity component along the flow, , and allows to visualise the patterns in the two much smaller components and . The magnitude of the secondary components is typically in the range of a few percent of the primary flow component, for the shear rates and system sizes simulated here.
Characteristic bands are visible in Fig. 4, which are oriented along the vorticity direction. The direction of the flow in each of the bands depends on the helicity of the underlying cholesteric liquid crystal (i.e. on the sign of in Eq. 1), and the velocity patterns for left-handed and right-handed BPs are one the mirror image of the other. Further quantitative evidence for a direct link between the sense of motion and the helicity can be gained by time-averaging over individual cycles.
Table 1 in the Appendix gives minima, maxima, averages and standard deviations of the velocity components. All values for the two runs with inverted helicity are identical apart from a change of sign in the -components. There is only a slight imbalance in magnitude between the maximum and minimum velocities along the -direction. Therefore the averaged flow along the vorticity direction is very small, and much smaller than the local flow velocity. This suggests that the flow of the network along the vorticity direction is permeative. This claim is further supported by the characteristic velocity bands in the secondary flow, visible in Fig. 4. The secondary flow in vorticity direction takes clearly place in positive and negative z-direction, whereas the movement of the network as a whole is only in one direction.
3.2 Blue Phase I
BPI has body-centred cubic symmetry and, unlike BPII, the disclination lines characterising its equilibrium structure are well separated and do not intersect. (The quiescent state resembles the first frame in Fig. 9 below.) We believe that this topological difference is responsible for most of the differences between BPI and BPII regarding their rheological response. We present again key aspects in an overview before we address specific features in more detail.
Fig. 5 shows the flow curve of BPI for the same range of shear rates as in Fig. 1 and Fig. 6 depicts the apparent viscosity ratio as a function of total strain.

For intermediate (but not too low) shear rates (), we once more find regular oscillations in the network morphology and in the stress response versus time. We label this regime BPI-2. The centre picture of Fig. 6 shows the corresponding data for the apparent viscosity ratio versus strain.
The BPI-2 regime now does not persist to arbitrarily low shear: there the oscillations become irregular and seemingly chaotic, and after a few cycles the disclination pattern becomes amorphous. For these low shear rates () the flow curve in Fig. 5 develops a horizontal yield stress branch. We refer to this flow regime as BPI-1.
The BPI-2 regime is also unstable if the shear is increased above a critical value, which is in the region of Ericksen numbers . This is a regime () we labelled BPI-3. It is characterised by the balance between viscous and elastic forces. This has an influence on the stability of the disclination network as it seems to become increasingly sensitive to small perturbations in the flow field which couple back to the order parameter dynamics and vice versa. This phenomenon forms a possible route towards an instance of “rheochaos” 39, 40.
Finally, for shear rates such that () and before the break-up into a flow-aligned nematic occurs (BPI-5, ) we observe the same cholesteric Grandjean configuration with the helical axis along the gradient direction as for BPII-2. For clarity we refer to this regime as BPI-4. It will be discussed in a separate section 3.3.


3.2.1 Regime BPI-1: low shear rates

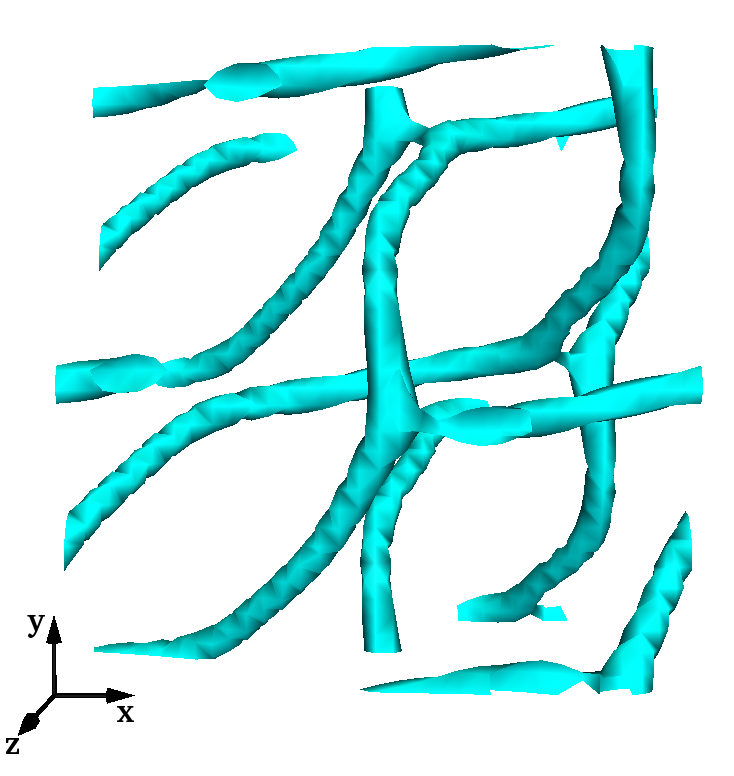
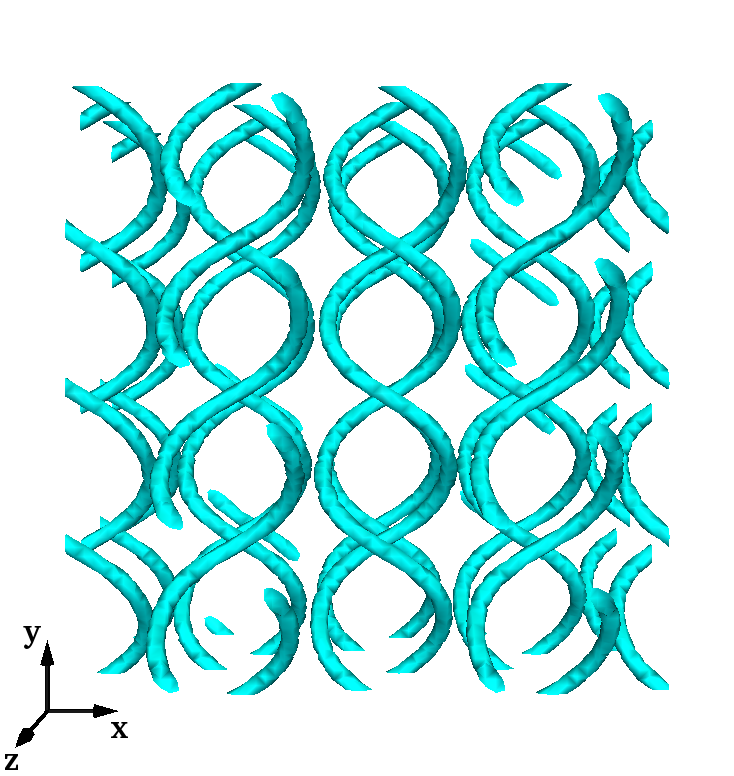
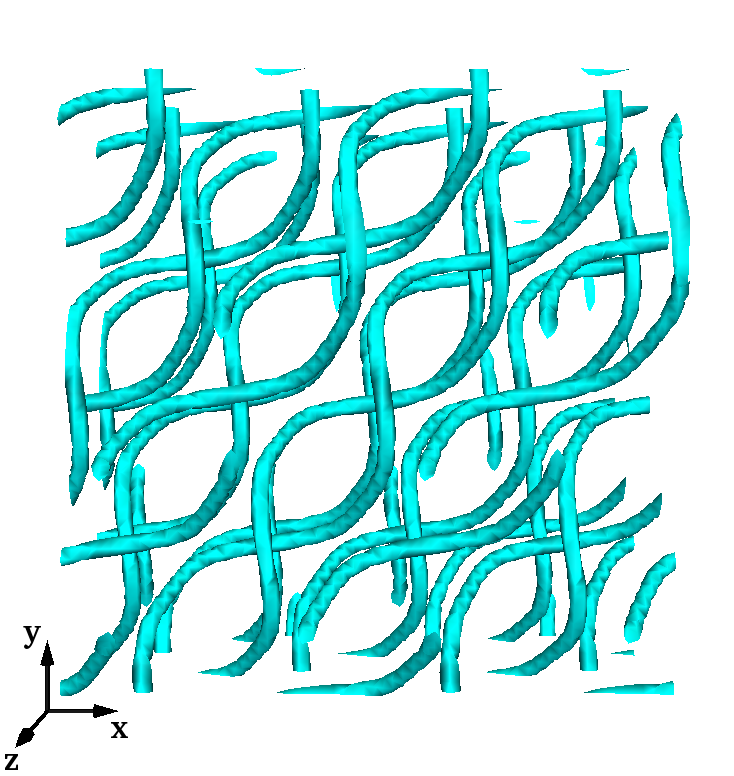
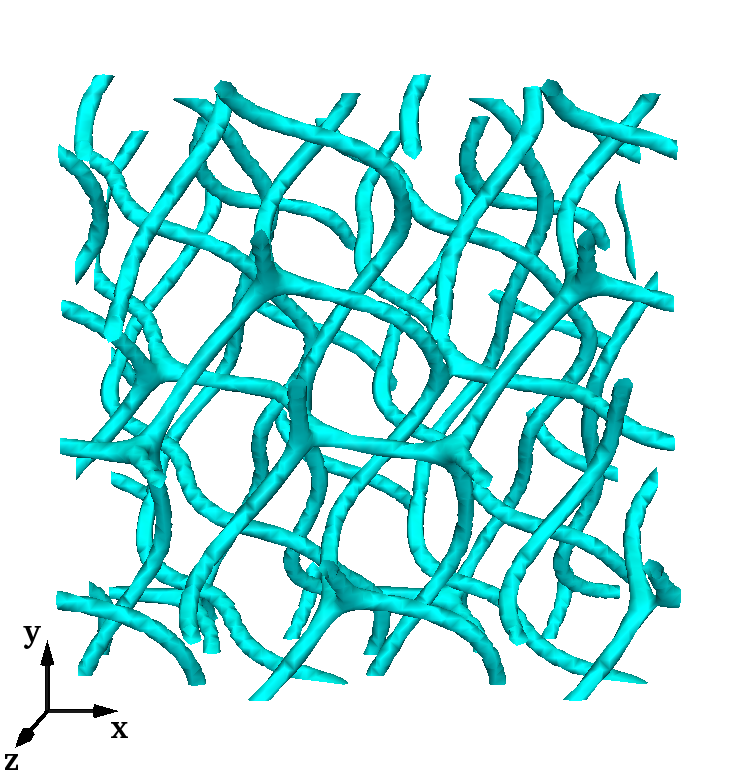
The rheological response of BPI at low shear rate, (), is strikingly different from that of BPII and appears to show a yield stress. An explanation for this behaviour can be found by looking more closely at the average shear stress (where the background viscosity contribution has been subtracted) and free energy density as a function of time, as shown in Fig. 7. When the quiescent and equilibrated BPI network begins to flow the shear stress increases steeply and goes through a maximum. Shortly after it goes negative to become positive again later on, forming a complete cycle. The amplitude of the excursions in these stress oscillations, and the presence of a part of the period where the thermodynamic contribution to the stress is negative, suggest that the BPI network is subject to large forces. Seemingly, these eventually cause the flow-induced collapse to an amorphous network state with an apparent yield stress. We should underscore that this low shear regime might depend on our choice of boundary conditions. In practice they are equivalent to having infinitely distant walls to which the network is anchored. See Appendix for a full discussion of our boundary conditions.

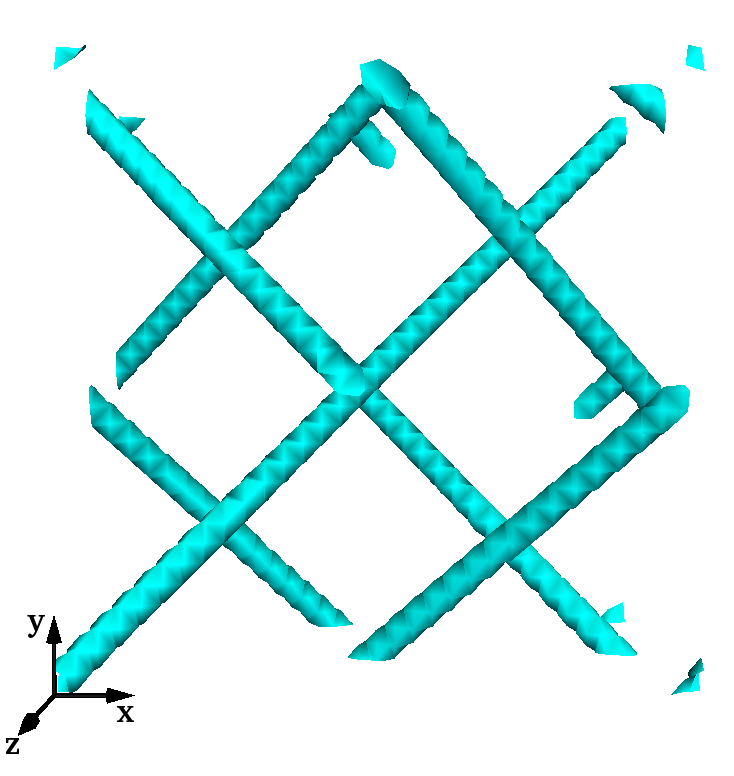
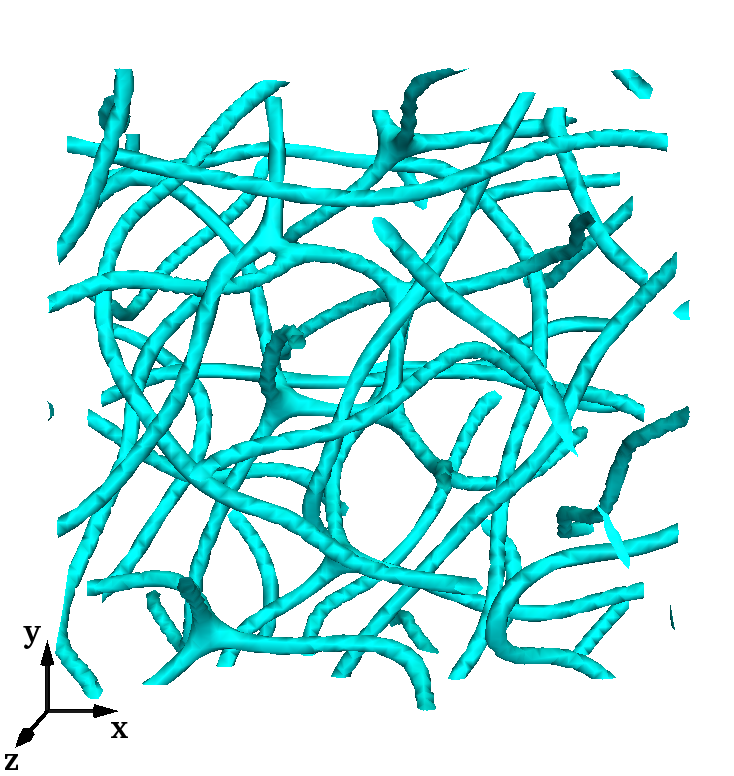
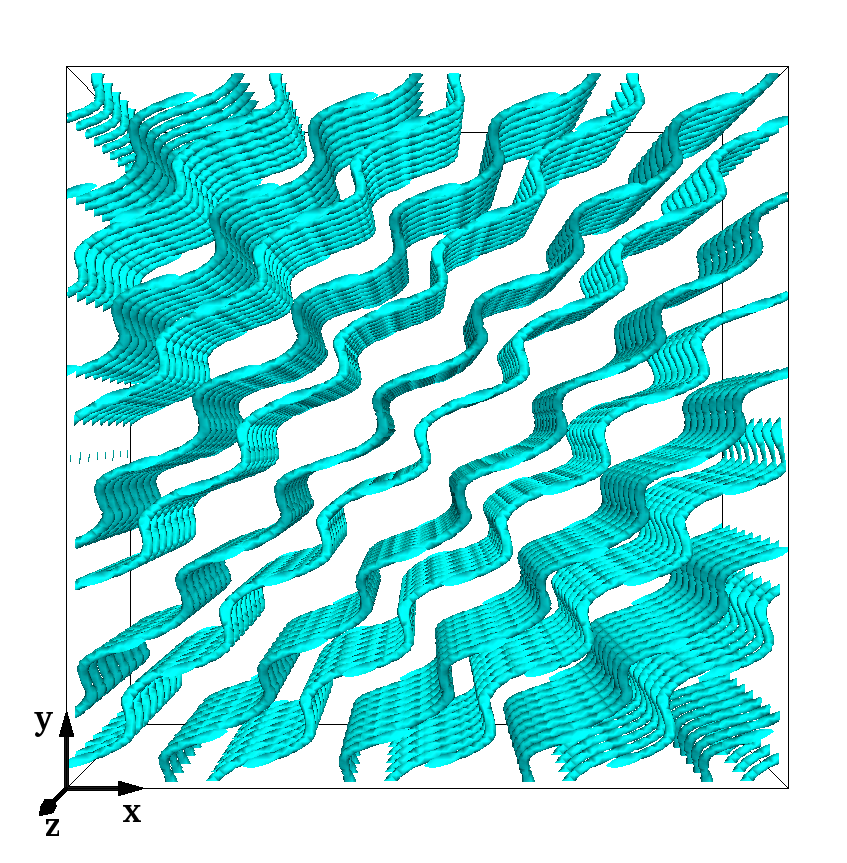
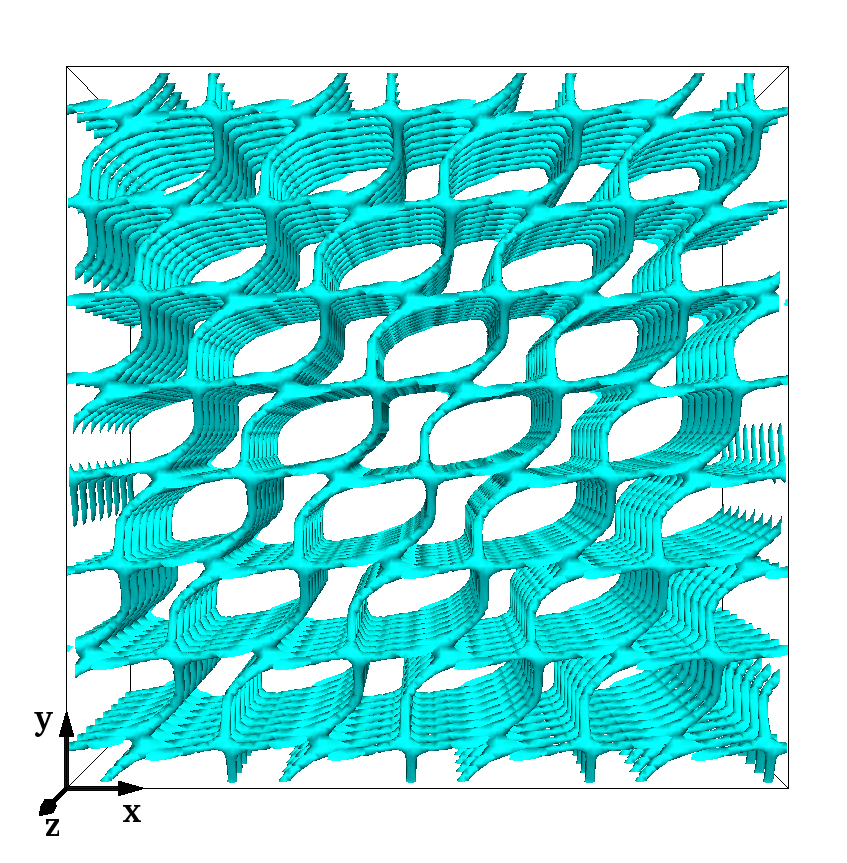
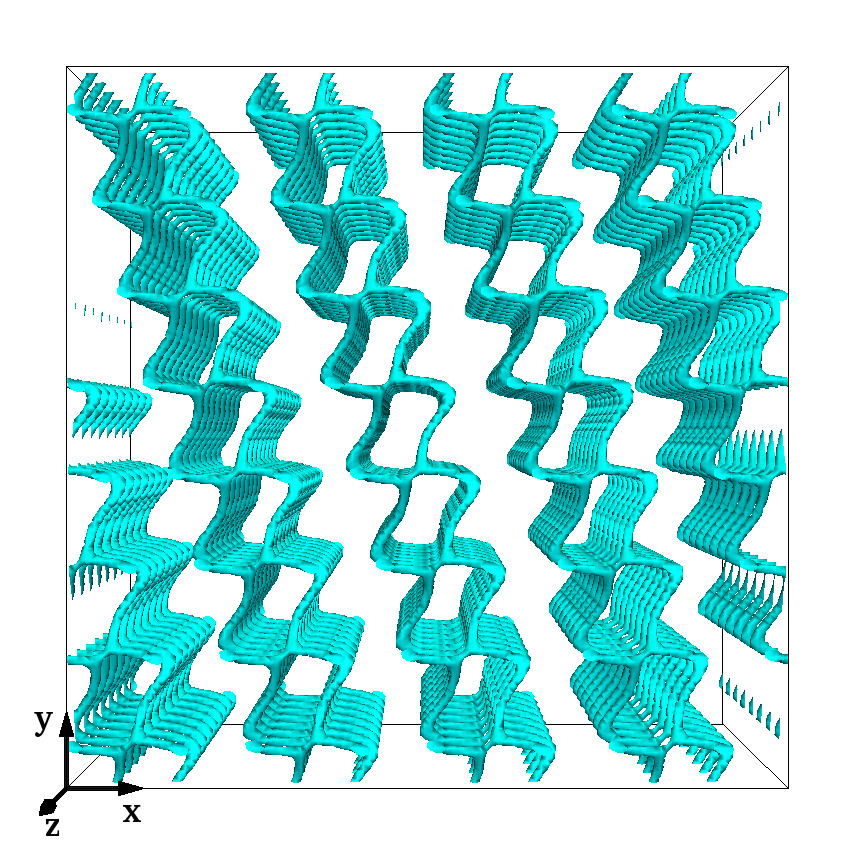
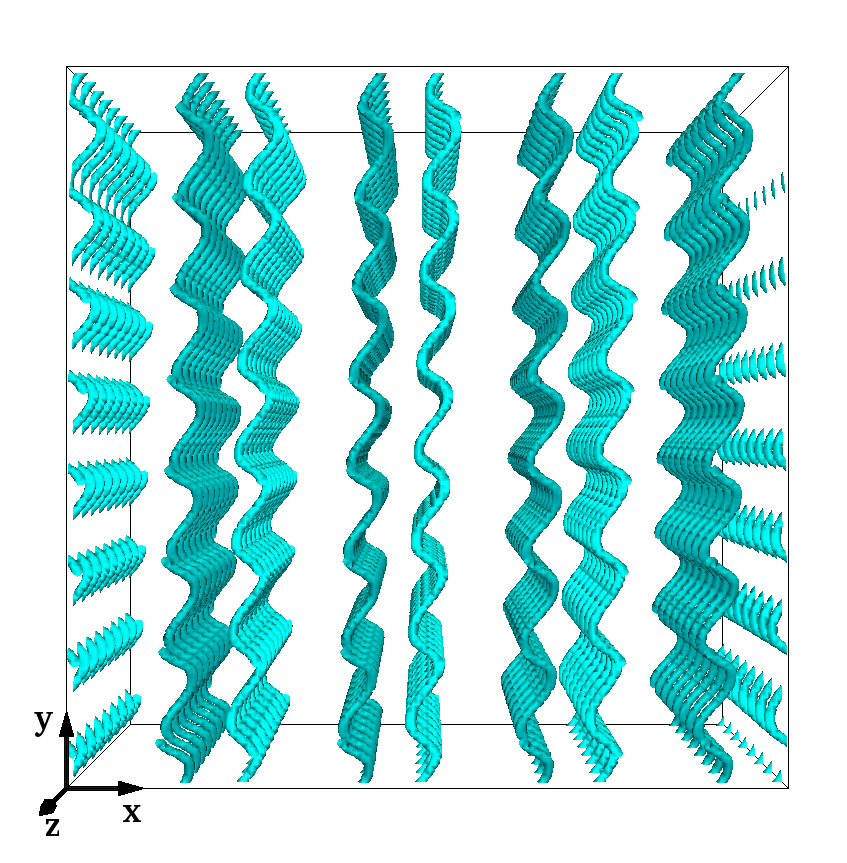
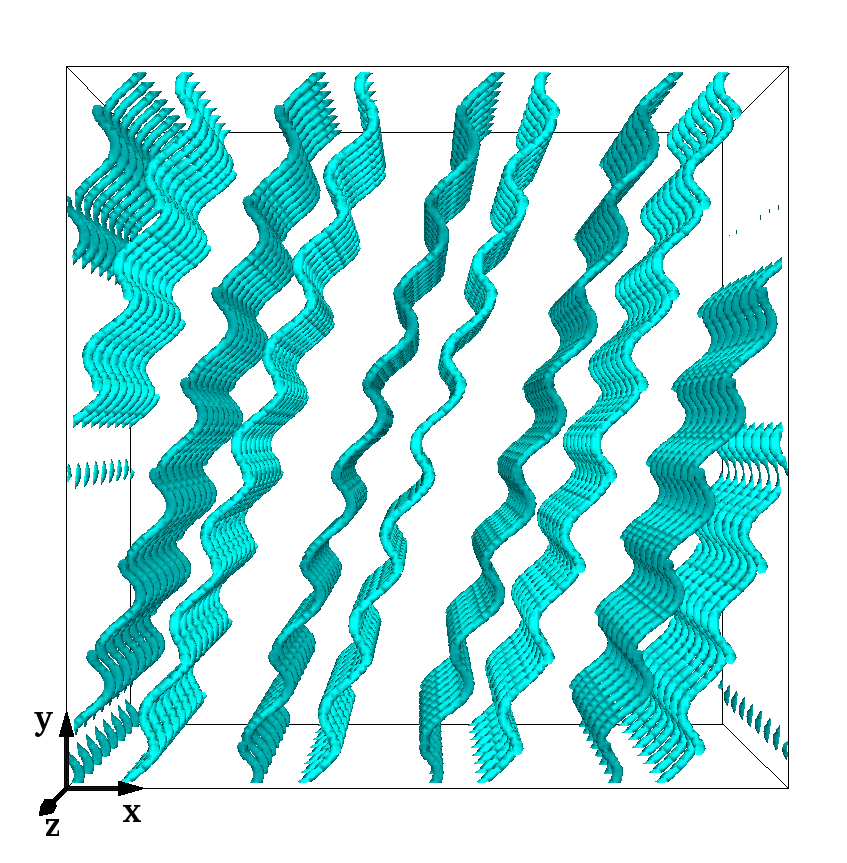
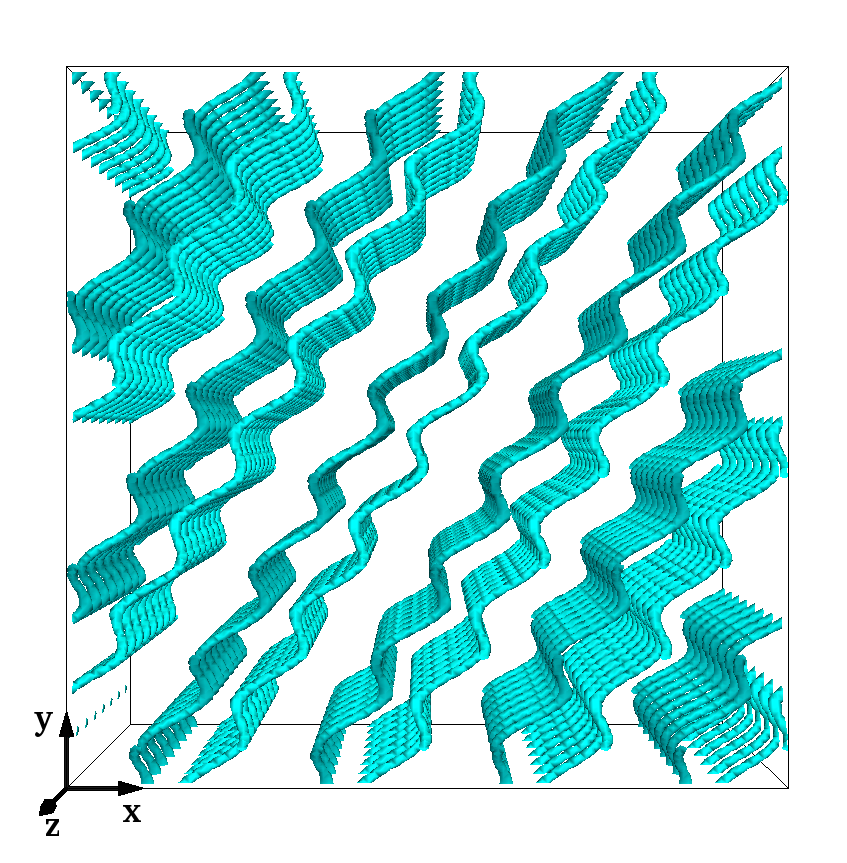
To gain further insight into the flow-induced deformation, and eventual breakdown, of BPI, it is instructive to follow the dynamics of the network under a slow flow – this is depicted in Fig. 9. Three different stages can be distinguished. Just after the onset of the shear flow, the disclination lines in BPI get more and more squeezed together, and this is incompatible with the defect topology in this phase. Consequently, the network adopts a flow-induced conformation which consists of intertwined helices that stretch during the shear transformation. This helical conformation that emerges already at strains is shown in Fig. 9 (top row). At this point the original BPI has already been significantly deformed. Shortly afterwards regular oscillations set up temporarily, where the disclinations form double helices which tilt and realign under the shear.
This mode of flow proves unstable, as after a few cycles distortions appear which lead to further destabilisation – presumably in view of the large stress fluctuations discussed above. Finally, the system loses order and transforms into an amorphous network state with almost constant stress in the region of LBU. If the shear is stopped, this flow-induced amorphous state remains arrested and metastable, and cannot find its way back to the original BPI structure.
3.2.2 Regime BPI-2: intermediate shear rates
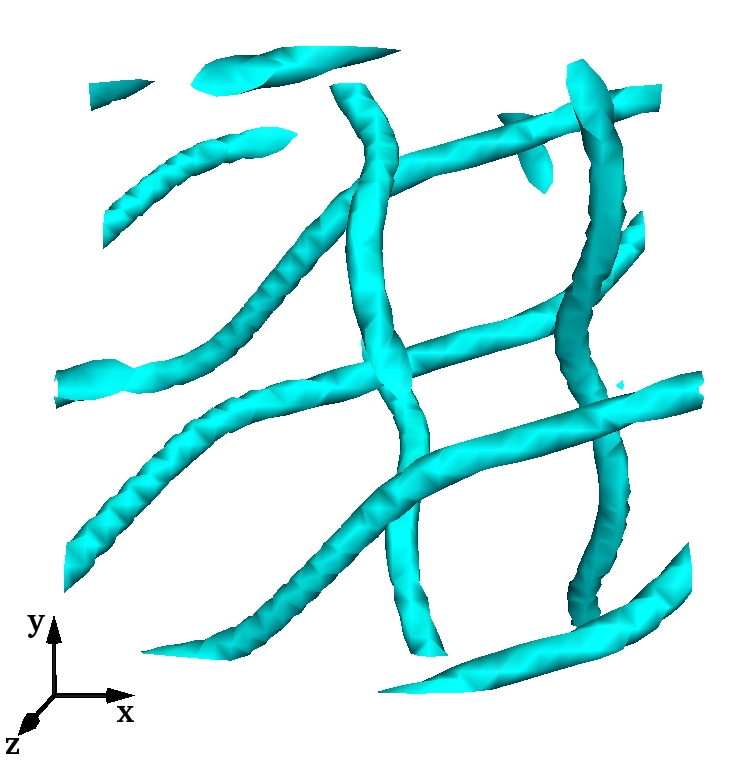
Adjacent to regime BPI-1 (; ) but at slightly larger shear rates (; ) lies another region where the network flows with periodically recurring conformations (Fig. 10). We refer to this region as BPI-2. The transition between BPI-1 and BPI-2 is clear when looking at Fig. 8 which shows the shear stress versus total strain. A qualitative difference between these two is the absence in BPI-2 of the large stress fluctuations that occur during the early cycles in regime BPI-1. (Recall that for even lower the thermodynamic shear stress becomes temporarily negative (Fig. 7), which caused destabilisation of the periodic network and led to the amorphous configuration in the steady state of BPI-1.) Hence, an explanation for the existence of the regular BPI-2 oscillations could be that compared to the large oscillations found transiently in the BPI-1 regime these oscillations are now fast enough to bypass or suppress large stress fluctuations, which leads to different topological reconnections and order structure and eventually to a stabilisation of the flow.
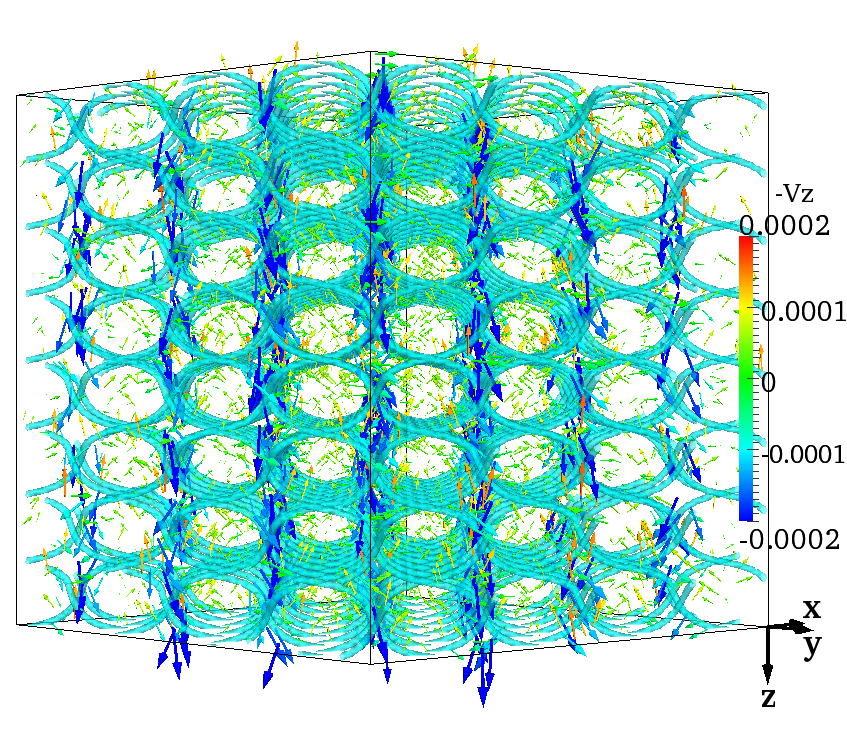
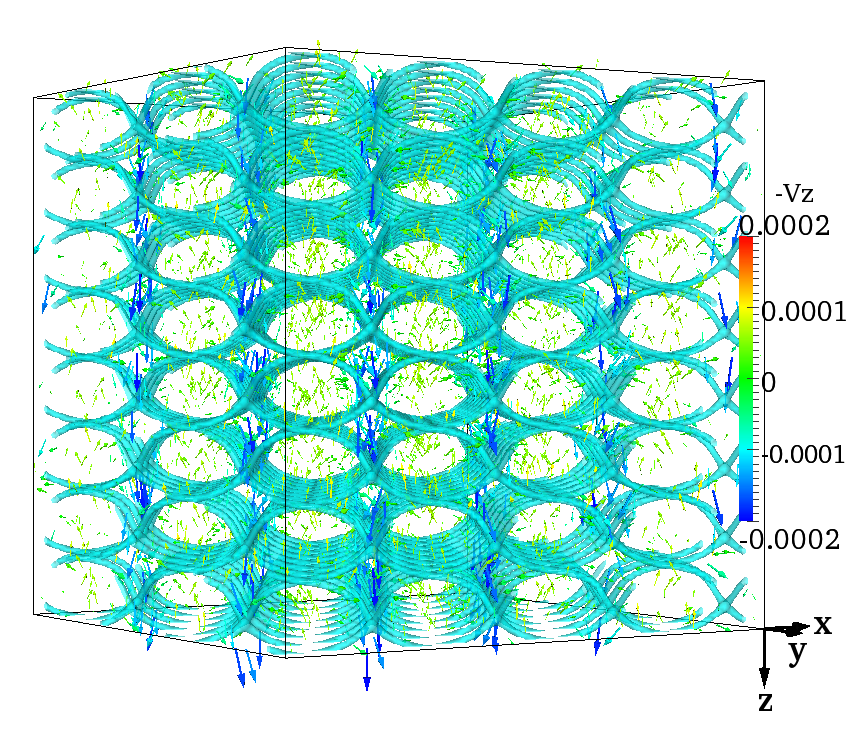
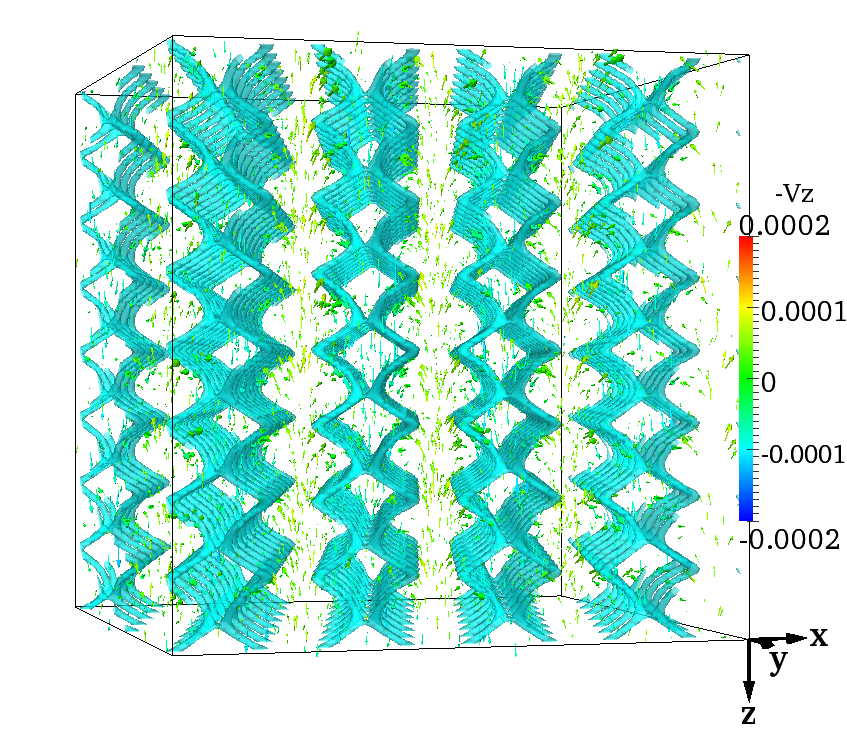
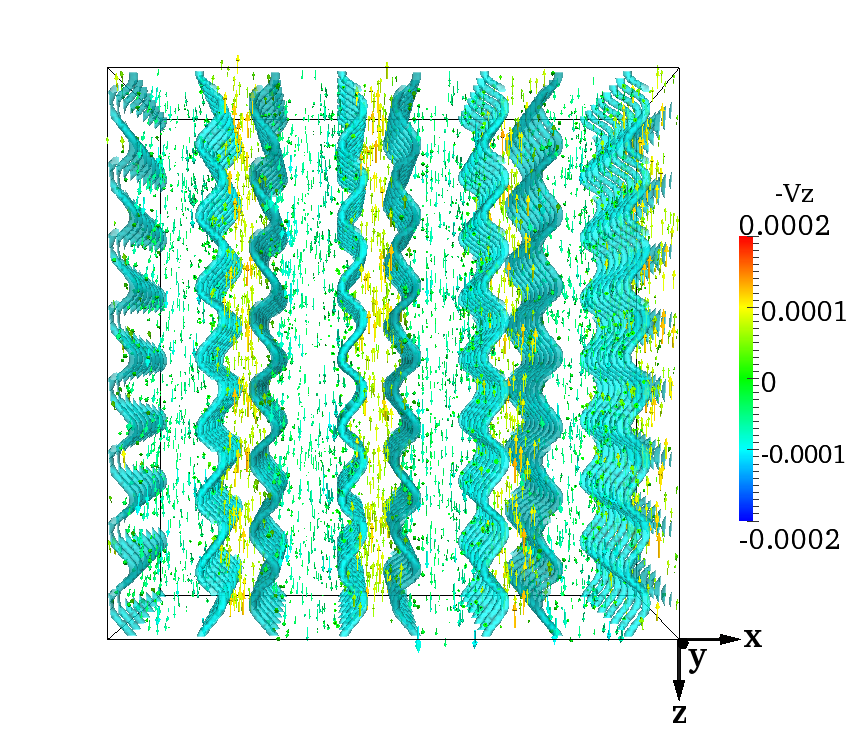
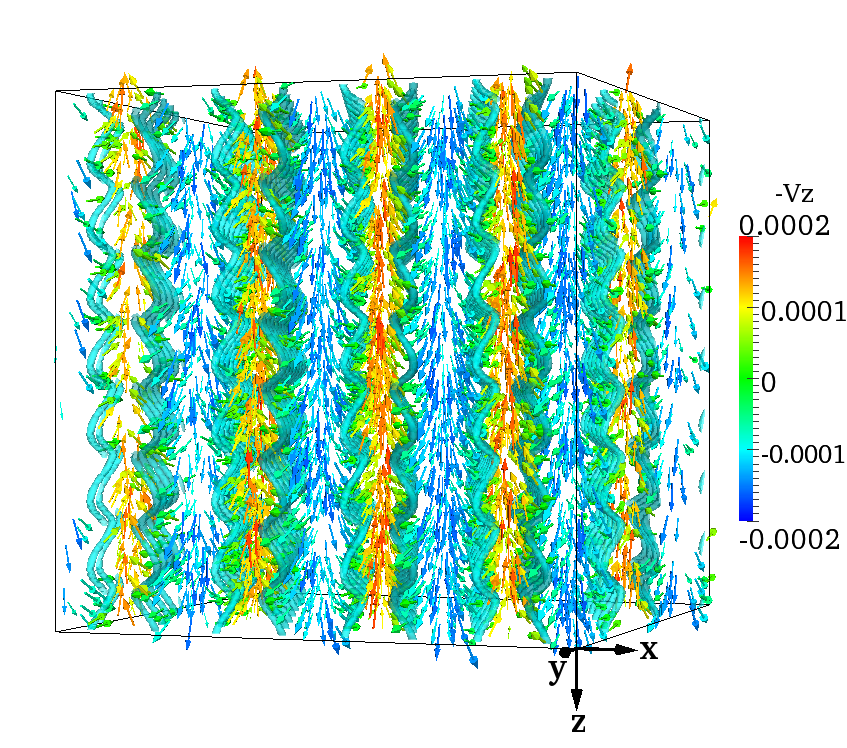
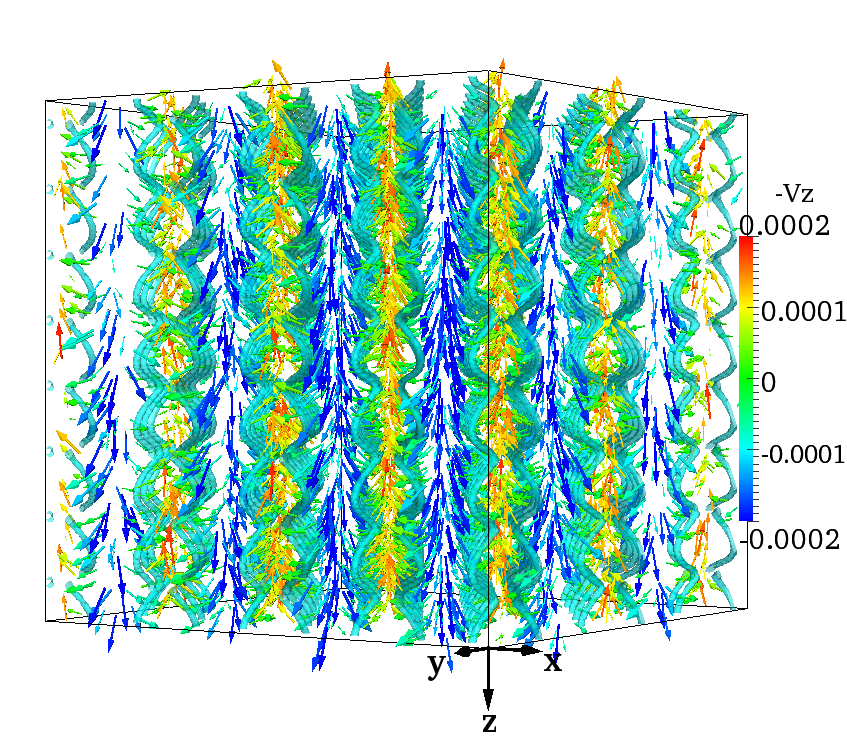
Fig. 10 shows snapshots of the periodically recurring BPI in steady shear flow. Contrary to BPII-1 at these shear rates, BPI-2 does not resemble so much the equilibrium configuration undergoing a homogeneous topology-conserving transformation. It features intricate, flow-induced conformations consisting of well-separated undulating disclination lines similar to those intertwined helices in Fig. 9 at early times.
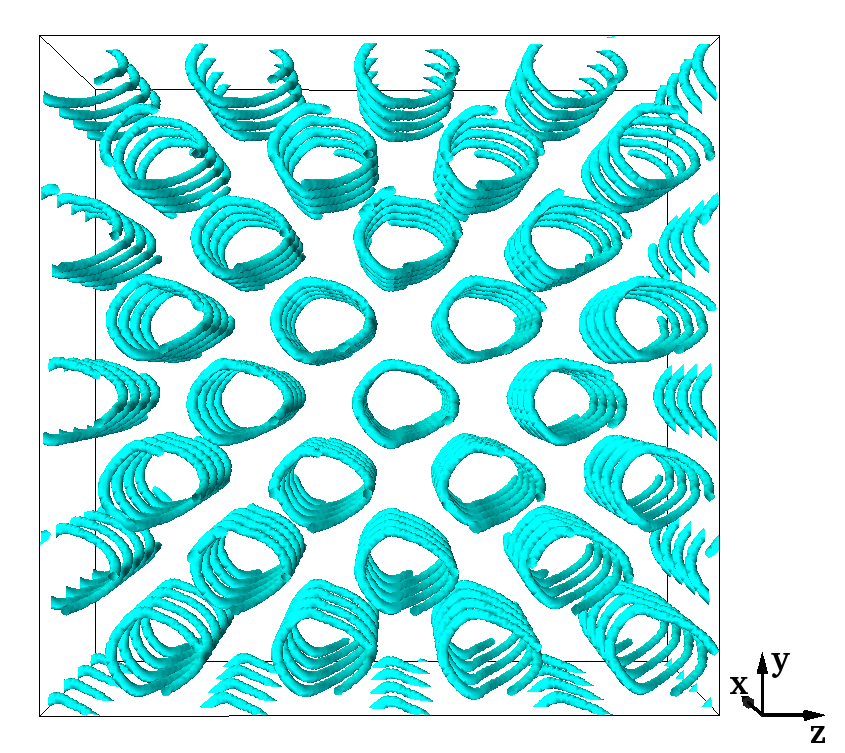
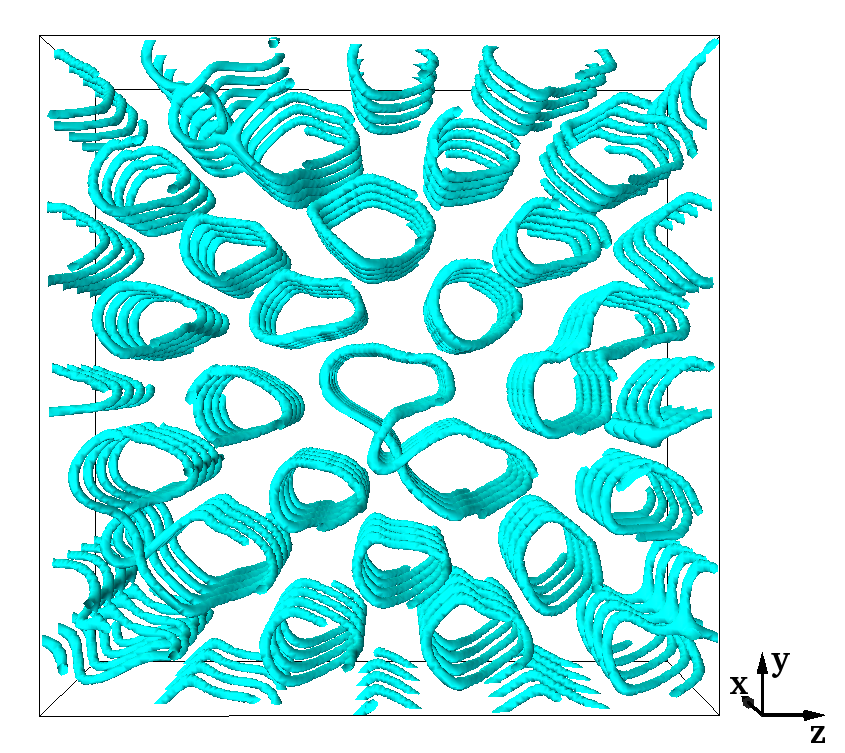
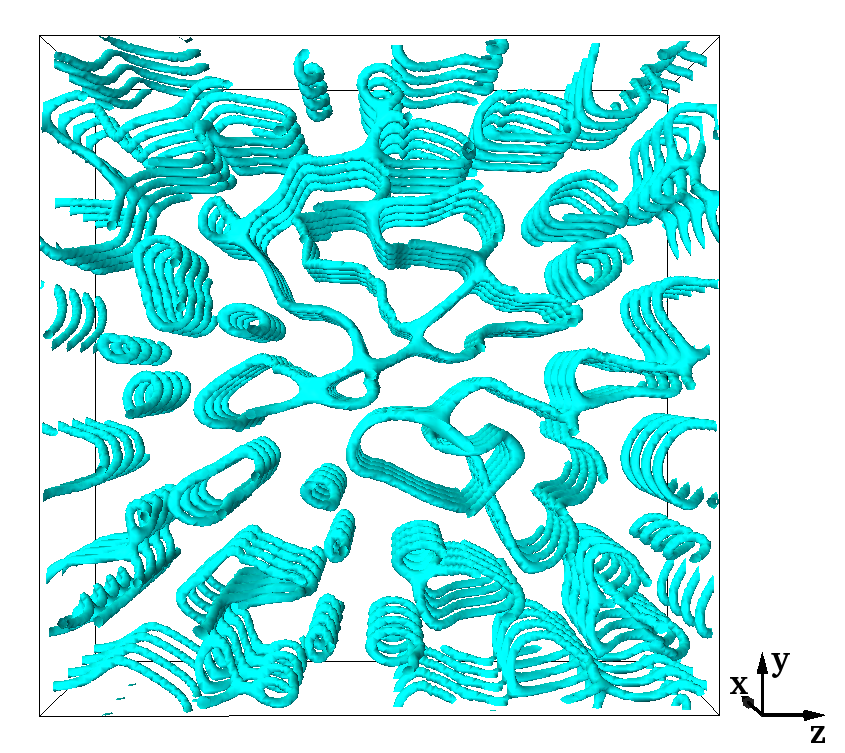
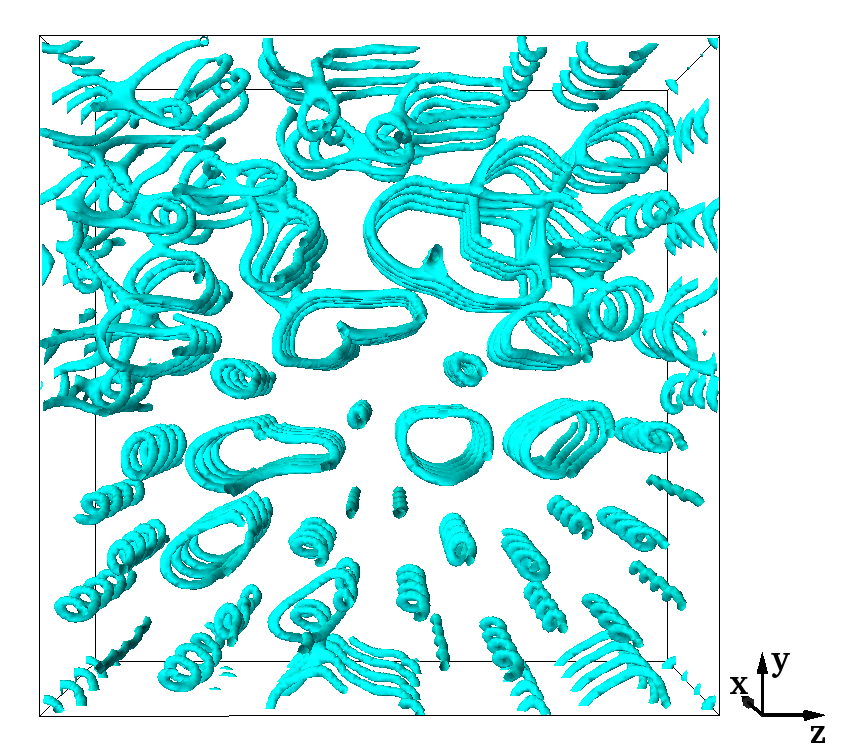
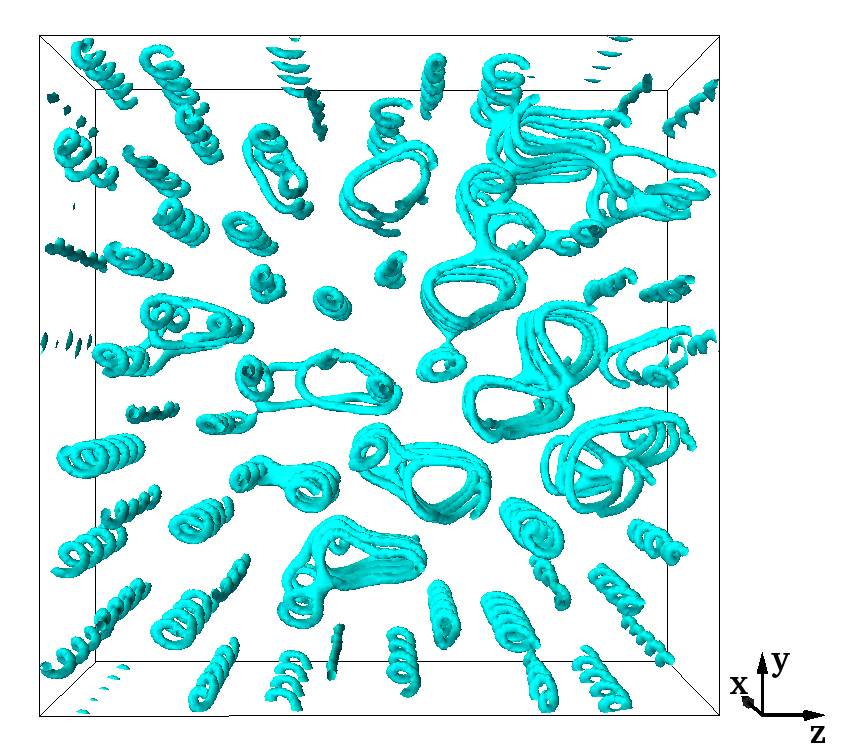
If the shearing is switched off in regime BPI-2 at some point during an oscillation, the flow-induced configuration cannot revert to a quiescent BPI. Instead the network is trapped in a metastable state with helicoidal intertwined disclinations similar to those in the bottom left picture of Fig. 9 or those in the top left picture of Fig. 12. However, the orientation of the helical axis in now always along the vorticity () direction.
Fig. 11 depicts a snapshot of the secondary velocity components and of BPI at the same time steps as in Fig. 10. The emerging pattern is similar to that of BPII shown in Fig. 4. There is also separation into fluctuating bands which are oriented along the vorticity direction. The secondary velocity component changes sign upon changing from positive to negative helicity and vice versa. The recurrence period is different from the one we observe in BPII. If we refer again to as the time interval between two consecutive reconnecting events of the network in flow direction, then . A full reconnection in vorticity direction takes place after the time . We believe the reason for these differences is also directly linked to the different topology of the defect network. The details of this mechanism will be addressed in future work.
3.2.3 Regime BPI-3: high shear rates
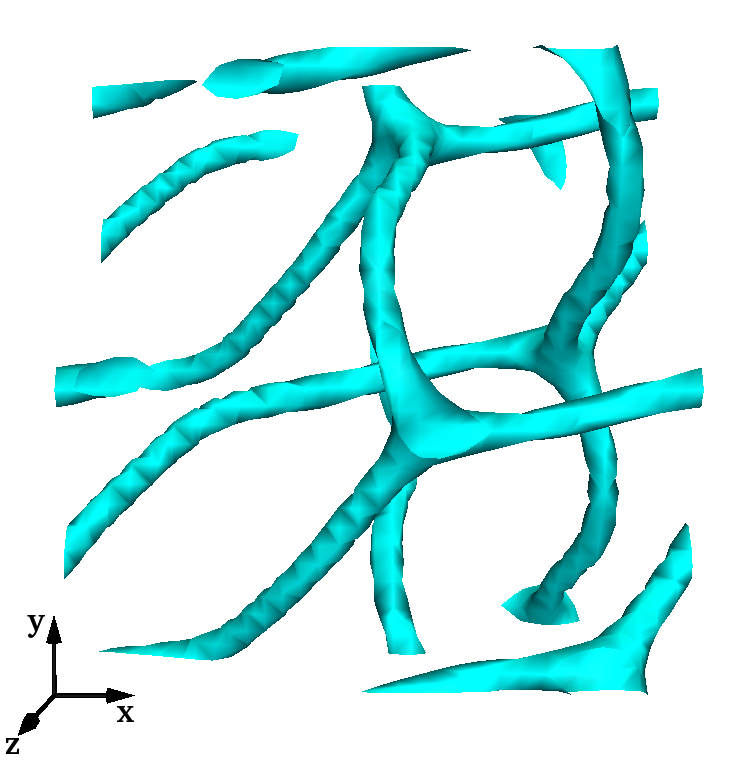
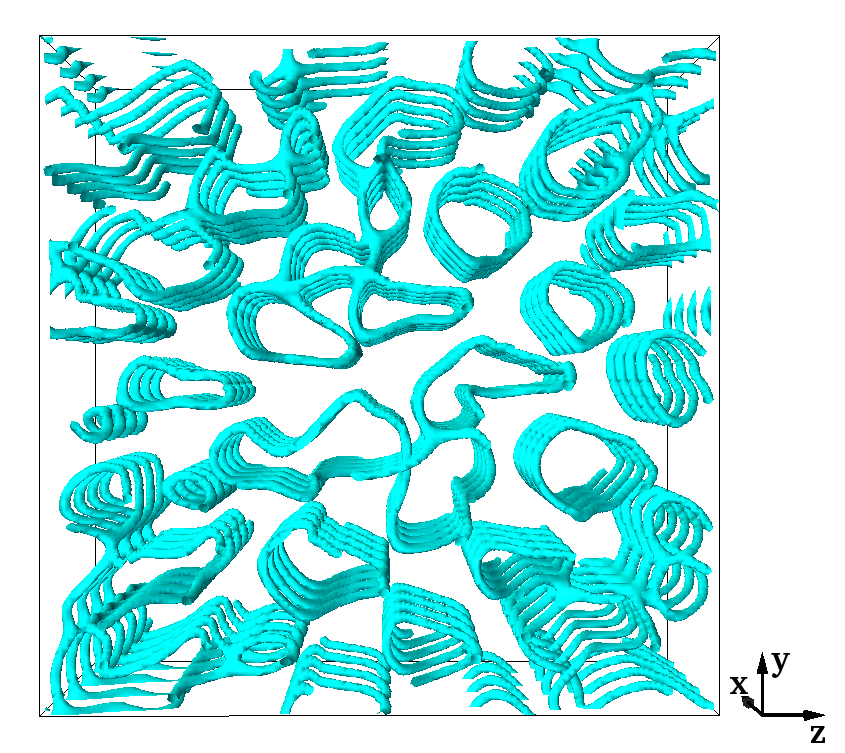
At higher flow rates, () we observe a break-up of the periodically recurring disclination network in regime BPI-2 and the formation of another amorphous network. A sequence of snapshots of this is shown in Fig. 12. At first the disclination lines take the form of a regular, staggered array of helices with the helical axis lying along the flow direction. However, this mode of flow proves equally unstable as the regular formations dissolve into an irregular state with helicoidal disclination lines of varying appearance. The morphology is different from the amorphous network of regime BPI-1 (cf. Fig. 9) where the disclination lines are well separated but do not have a clear orientation with respect to the flow.
Interestingly, the critical Ericksen number for this observed break-up is in the range of . This is a regime where viscous forces have a similar magnitude to elastic forces and where the nonlinear coupling between order and flow can cause small deviations to grow quickly over time. This suggests that the BPI-3 regime constitutes an instance of ”rheochaos” 39, 40 as mentioned previously.
3.3 Transition to cholesteric helix and flow-aligned nematic state
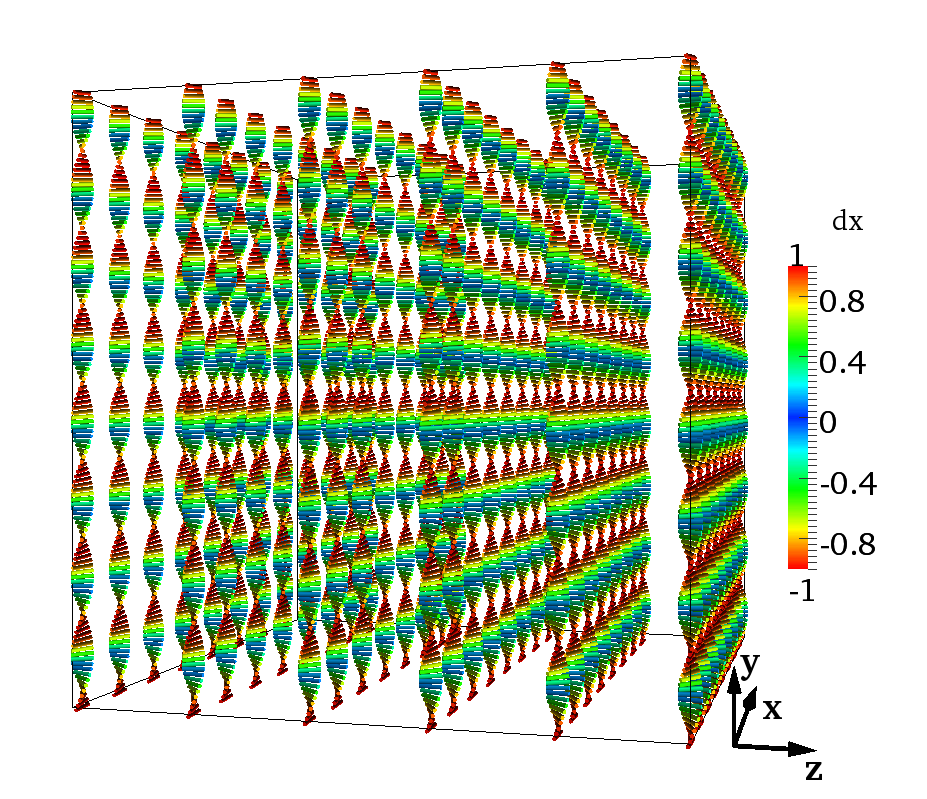
At shear rates beyond the regimes BPI-3 and BPII-2, but below the transition to a flow-aligned nematic state at still higher shear rates, we found another regime where both blue phases adopt the same configuration in steady shear flow, independent of their initial state. The director field of this configuration, also known as Grandjean texture, is shown in Fig. 13. It consists of a simple cholesteric helix with the helical axis oriented along the gradient direction (). While the liquid crystal is flowing the director field is stationary and retains its relative orientation so that the depicted state is translational invariant in flow-vorticity plane and quasi-one-dimensional. There is a small Leslie-type angle with respect to the flow-vorticity plane. Contrary to the other metastable flow states there is no tumbling motion of the director. This leads to lower shear stress and lower dissipation compared to other states like the travelling helical wave 21, 22.
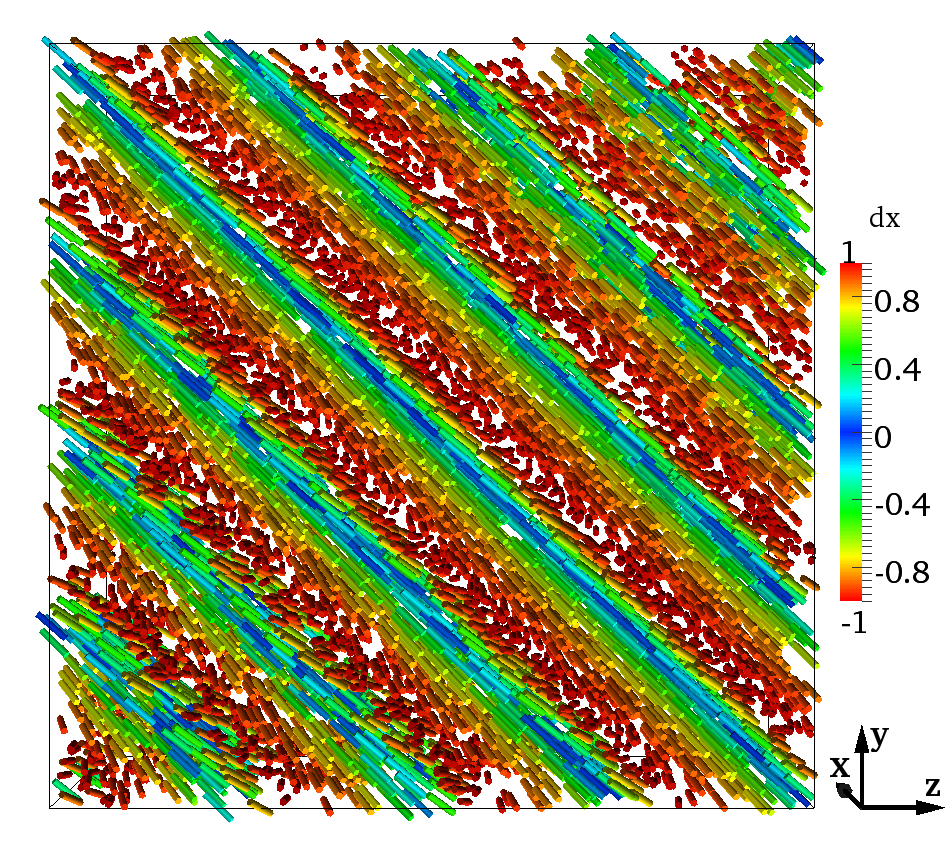
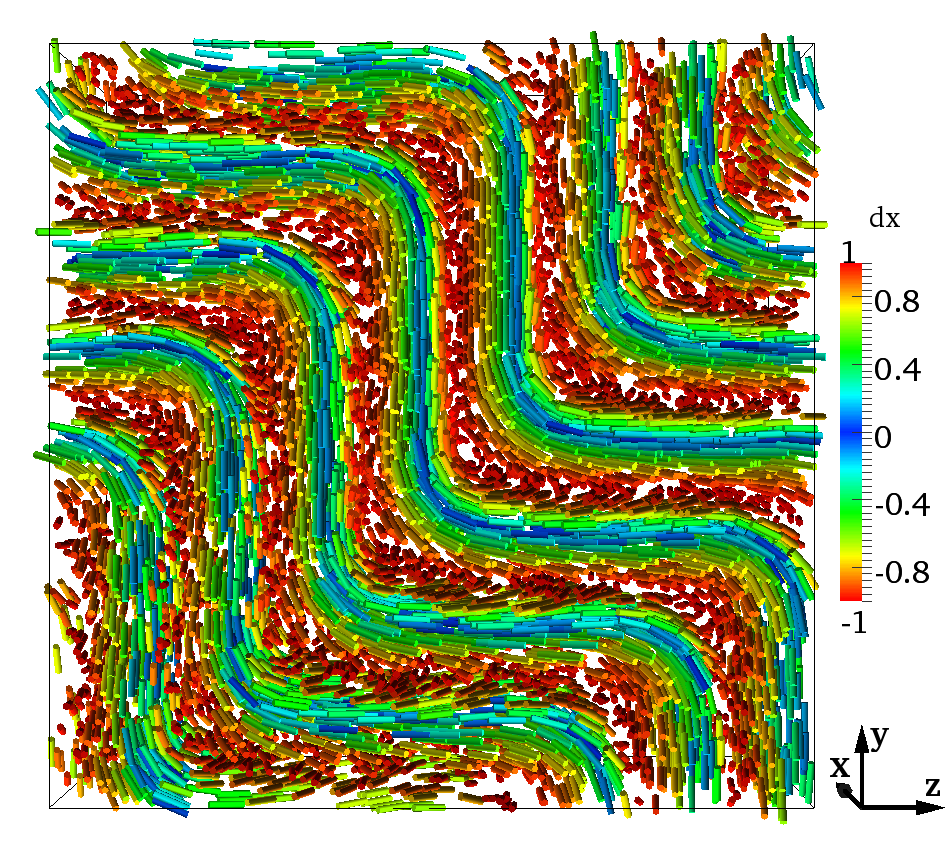
The Grandjean configuration does not always emerge perfectly. Fig. 14 shows a time sequence of a frustrated state that undergoes a buckling transition. Initially the layers happen to be along a diagonal direction rather than along the gradient direction. Because the diagonal state does not have the equilibrium layer spacing the conformation buckles which reduces its free energy. Due to the periodic boundary conditions and their interlocking effect on the configuration this state cannot transform into a perfect Grandjean texture. However, the tilt angle of the layers with respect to the flow-vorticity () plane decreases significantly if the strain rate is increased. This explains as well why the frustration is more frequent for low shear rates in regime BPI-4, as shown in Fig. 5.
4 Conclusions
In summary, our work constitutes the first large scale simulation of bulk flow behaviour of cubic BPs in simple shear flow.
We were able to characterise the rheology of cubic BPs, and identified three different flow regimes for BPII and five different ones for BPI. These include some steady states that BPI and BPII have in common like the Grandjean texture and the flow-aligned nematic state at high shear rates. Below an Ericksen number of , BPII exhibits weak shear-thinning and obeys a power-law flow curve with exponent close to unity. The BPII disclination network breaks up and reconnects in the flow, which leads to a periodically recurring dependence of the shear stress. The flow-induced conformation looks generally very similar to the quiescent network at equilibrium. While being homogeneously transformed due to the shear flow the disclination network moves steadily in the vorticity direction apparently by a permeation mechanism. The sense of motion is directly linked to the helicity of the underlying cholesteric phase.
At larger Ericksen numbers, , the flowing BPII network breaks up into a simple cholesteric helix with the helical axis along the gradient direction, also referred to as Grandjean texture. The travelling helical wave, predicted theoretically in Ref. 21, 22 under the assumption that the director is restricted to the flow-gradient plane, turns out to be a metastable state of flow with a higher free energy. It may also transforms into the Grandjean texture, the steady state with the lowest shear stress in this range of shear rates. Still larger flow rates break this residual cholesteric order and leave a standard flow-aligned nematic state, at the highest shear rate studied.
Interestingly, BPI shows a flow behaviour that is very different to that of BPII. This is a direct consequence of the topological differences between their disclination networks. Below an Ericksen number of , the BPI network cannot both flow and retain a regular appearance. It eventually reorganises into an amorphous network that features yield-stress behaviour. The apparent reason is that shortly after the onset of the shearing very large stress fluctuations occur. At the lowest shear rates the thermodynamic contribution to the shear stress becomes temporarily negative during each cycle. These fluctuations seem to destabilise the network and eventually trigger the transition into an amorphous state with a residual yield stress.
At slightly larger Ericksen numbers , BPI kinematically bypasses the large stress fluctuations and flows with periodically recurring flow-induced conformations. These conformations entail regularly arranged helical disclinations which rotate due to the shear. Despite their complex appearance, the flow-induced conformations are topologically connected to the quiescent BPI and after switching off the shear flow a defect-free blue phase reforms.
At even larger Ericksen numbers the behaviour of BPI is again different. At first, it exhibits regular helicoidal disclination lines oriented along the flow direction. After a short time these become irregular and an amorphous network emerges, which has a different appearance than that observed at the lowest flow rates. We believe that at these flow rates, where neither viscous nor elastic forces clearly dominate, the coupling between order and flow makes any ordered conformation very sensitive towards irregular disturbances caused by small fluctuations. It is tempting to interpret the unsteady oscillations seen in this regime as an instance of deterministic rheological chaos 41, 40.
Just as in the case of BPII, the BPI network breaks up at larger Ericksen numbers. First, at , it forms a cholesteric helix along the flow gradient direction, the Grandjean texture. Finally, at (BPI) and (BPII) the configuration is a flow-aligned nematic state. Although experimental evidence to support our results is currently not available, we hope this work will inspire such experiments, and believe it can shed some light on the flow properties of complex liquid-crystalline phases.
Acknowledgments
This work was granted access to the HPC resource of CSC, Finland, made available within DECI by the PRACE-2IP, funded by the European Community’s 7th Framework Program under grand agreement No. RI-283493. We also acknowledge support by EPSRC grant nos. EP/E045316 and EP/E030173 and the MAPPER EU-FP7 project (grant no. RI-261507). We thank Peter J. Collings and Tom C. Lubensky for stimulating discussions. MEC holds a Royal Society Research Professorship.
Appendix
Table 1 lists the parameters chosen for our runs (values of the reduced temperature and reduced chirality are given in the caption), together with the minima, maxima, and standard deviations of the velocity field in the three directions (discussed further in the main text). The first column also describes what flow regime each simulation leads to in steady state.
In all our runs we used Lees-Edwards boundary conditions (LEBCs) 33. This is the sheared equivalent of periodic boundary conditions, for both the velocity and the order parameter field. On crossing a Lees-Edwards boundary a Galilean transformation is applied with a velocity increment which is fixed in time (and limited in size by the low Mach number constraint of LB). An appropriate transformation of LB distributions which propagate across a boundary must be applied at each time step, and appropriate adjustment to the tensor of velocity gradients is required to compute cross-plane gradients of the velocity field used in the update to . In both cases interpolation of the relevant quantities is required to cope with the relative displacement of neighbouring lattice sites separated by a sliding plane (the displacement may be a fraction of a lattice unit at any given time step) 37. It is worth mentioning that apart from the Galilean transformation LEBCs do not impose any further constraint. This means that order parameter field is free to follow its own kinetic pathway at the Lees-Edwards plane. The use of multiple sliding planes equally spaced in a single system allows the overall shear rate to be maintained indefinitely as the system becomes larger in the velocity gradient direction (in contrast with the use of solid walls to impose shear). While extremely useful to simulate bulk flow, we note that these boundary conditions impose macroscopic distortion of the network. They do not allow for a free-standing network sustained stationary by permeation along the flow direction. Such a state is however forbidden for large system sizes since the local permeation rate would have to increase indefinitely with sample thickness. The boundary condition is equivalent to infinitely distant walls along the plane where the liquid crystal is anchored, not unlike the situation found in a rheometer with no-slip boundary conditions at the walls. In practice, permeation flows are only restricted to very low flow rates, and are unstable for intermediate and fast flows 25, where the response of the network depends less on the details of the boundary conditions used at the wall. With free boundary conditions that do not impose a macroscopic distortion and for very low flow velocity, permeative flows might instead allow for some slip of the BPI network, as in cholesterics sheared along their axis 19, 20. However, as mentioned above, a triply periodic structure cannot be maintained stationary in a large system without infinite permeation rate.
| BPI | ||||||||||||
| BPI-1 (AN) | 0.24 | 0.02 | 0.1388 | -17.7 | 16.7 | 3.7 | -3.6 | 3.6 | 3.5 | -3.9 | 3.1 | 2.8 |
| BPI-1 (AN) | 0.49 | 0.04 | 0.1388 | -33.4 | 32.0 | 4.3 | -3.0 | 3.1 | 3.2 | -3.7 | 2.5 | 3.1 |
| BPI-1 (AN) | 0.98 | 0.08 | 0.1388 | -64.4 | 63.6 | 4.7 | -3.6 | 3.4 | 4.8 | -5.3 | -4.2 | 4.4 |
| BPI-1 (AN) | 1.95 | 0.17 | 0.1388 | -126.2 | 127.0 | 6.8 | -3.8 | 4.8 | 6.7 | -5.2 | 5.1 | 6.2 |
| BPI-2 (PRC) | 3.91 | 0.33 | 0.1388 | -248.6 | 248.3 | 2.8 | -5.4 | 5.6 | 5.1 | -3.8 | 4.6 | 3.9 |
| BPI-2 (PRC) | 7.81 | 0.67 | 0.1388 | -497.5 | 496.4 | 5.2 | -8.5 | 8.0 | 8.4 | -5.9 | 7.8 | 6.8 |
| BPI-2 (PRC) | 15.63 | 1.33 | 0.1388 | -995.0 | 993.0 | 8.7 | -13.1 | 13.8 | 13.2 | -13.0 | 15.6 | 11.2 |
| BPI-2 (PRC) | 15.63 | 1.33 | -0.1388 | -995.0 | 993.0 | 8.7 | -13.1 | 13.8 | 13.2 | -15.6 | 13.0 | 11.2 |
| BPI-2 (PRC) | 23.44 | 2.00 | 0.1388 | -1492.2 | 1485.5 | 9.6 | -4.8 | 3.7 | 12.3 | -5.7 | 4.6 | 14.8 |
| BPI-3 (AN) | 31.25 | 2.67 | 0.1388 | -1990.6 | 1983.2 | 17.6 | -4.5 | 6.3 | 13.3 | -8.3 | 10.0 | 15.9 |
| BPI-3 (AN) | 46.87 | 4.00 | 0.1388 | -2988.2 | 2985.5 | 42.4 | -10.5 | 12.3 | 28.4 | -15.5 | 15.2 | 26.8 |
| BPI-4 (GJ) | 54.69 | 4.67 | 0.1388 | -3475.1 | 3473.4 | - | - | - | - | -8.9 | 8.8 | - |
| BPI-4 (FGJ) | 62.50 | 5.33 | 0.1388 | -4101.7 | 4122.7 | - | - | - | - | -29.6 | 20.0 | - |
| BPI-4 (FGJ) | 78.13 | 6.01 | 0.1388 | -5140.0 | 5092.3 | - | - | - | - | -35.8 | 24.6 | - |
| BPI-4 (GJ) | 93.75 | 8.00 | 0.1388 | -5955.4 | 5946.1 | - | - | - | - | -15.5 | 15.1 | - |
| BPI-4 (GJ) | 125.0 | 10.67 | 0.1388 | -7935.0 | 7933.7 | - | - | - | - | -21.3 | 20.1 | - |
| BPI-4 (GJ) | 187.5 | 16.00 | 0.1388 | -11901.7 | 11901.7 | - | - | - | - | -32.8 | 29.1 | - |
| BPI-5 (FN) | 250.0 | 21.33 | 0.1388 | -15875.0 | 15875.0 | - | - | - | - | -0.2 | -0.1 | - |
| BPI-5 (FN) | 375.0 | 32.00 | 0.1388 | -23812.5 | 23812.5 | - | - | - | - | -0.3 | 0.1 | - |
| BPII | ||||||||||||
| BPII-1 (PRC) | 0.24 | 0.02 | 0.1963 | -7.8 | 7.7 | 0.1 | -0.2 | 0.2 | 0.1 | -0.3 | 0.3 | 0.2 |
| BPII-1 (PRC) | 0.49 | 0.04 | 0.1963 | -15.5 | 15.4 | 0.2 | -0.3 | 0.4 | 0.2 | -0.5 | 0.4 | 0.2 |
| BPII-1 (PRC) | 0.98 | 0.08 | 0.1963 | -31.0 | 30.8 | 0.3 | -0.6 | 0.6 | 0.4 | -0.9 | 0.8 | 0.4 |
| BPII-1 (PRC) | 1.95 | 0.17 | 0.1963 | -62.0 | 61.6 | 0.6 | -1.2 | 1.2 | 0.8 | -1.8 | 1.6 | 0.8 |
| BPII-1 (PRC) | 3.91 | 0.33 | 0.1963 | -123.9 | 123.3 | 1.2 | -2.1 | 2.1 | 1.6 | -3.4 | 3.0 | 1.5 |
| BPII-1 (PRC) | 7.81 | 0.67 | 0.1963 | -247.5 | 246.8 | 2.0 | -3.8 | 3.8 | 3.0 | -6.5 | 5.5 | 2.6 |
| BPII-1 (PRC) | 15.63 | 1.33 | 0.1963 | -494.3 | 493.7 | 2.5 | -5.5 | -5.5 | 4.0 | -10.9 | 8.7 | 3.9 |
| BPII-1 (PRC) | 15.63 | 1.33 | -0.1963 | -494.3 | 493.7 | 2.5 | -5.5 | 5.5 | 4.0 | -8.7 | 10.9 | 3.9 |
| BPII-1 (PRC) | 31.25 | 2.67 | 0.1963 | -987.5 | 987.1 | 3.5 | -6.9 | 6.9 | 5.1 | -17.7 | 13.1 | 5.0 |
| BPII-1 (PRC) | 39.06 | 3.33 | 0.1963 | 1233.9 | 1233.6 | 3.7 | -6.9 | 6.9 | 5.1 | -20.0 | 14.5 | 5.2 |
| BPII-2 (GJ) | 46.87 | 4.00 | 0.1963 | -1479.8 | 1477.0 | - | - | - | - | -10.0 | 9.6 | - |
| BPII-2 (GJ) | 54.69 | 4.67 | 0.1963 | -1720.5 | 1720.8 | - | - | - | - | -11.5 | 11.2 | - |
| BPII-2 (GJ) | 62.5 | 5.33 | 0.1963 | -1966.7 | 1966.2 | - | - | - | - | -13.3 | 12.7 | - |
| BPII-2 (GJ) | 78.13 | 6.01 | 0.1963 | -2458.3 | 2457.8 | - | - | - | - | -16.9 | 15.7 | - |
| BPII-2 (GJ) | 93.75 | 8.00 | 0.1963 | -2949.7 | 2949.7 | - | - | - | - | -20.3 | 18.4 | - |
| BPII-2 (GJ) | 125.0 | 10.67 | 0.1963 | -3932.8 | 3932.8 | - | - | - | - | -26.6 | 22.4 | - |
| BPII-3 (FN) | 187.5 | 16.00 | 0.1963 | -5906.2 | 5906.2 | - | - | - | - | -0.6 | 0.4 | - |
| BPII-3 (FN) | 250.0 | 21.33 | 0.1963 | -7874.9 | 7874.9 | - | - | - | - | -0.5 | 0.3 | - |
References
- de Gennes and Prost 1993 P. G. de Gennes and J. Prost, The Physics of Liquid Crystals (2nd Edition), Clarendon Press, Oxford, 1993.
- H. Grebel 1984 S. S. H. Grebel, R M Hornreich, Phys. Rev. A, 1984, 30, 3264.
- Wright and Mermin 1989 D. C. Wright and N. D. Mermin, Rev. Mod. Phys., 1989, 61, 385.
- Henrich et al. 2011 O. Henrich, K. Stratford, D. Marenduzzo and M. E. Cates, Phys. Rev. Lett., 2011, 106, 107801.
- Kikuchi et al. 2002 H. Kikuchi, M. Yokota, Y. Hisakado, H. Yang and T. Kajiyama, Nat. Mater., 2002, 1, 64–68.
- Coles and Pivnenko 2005 H. J. Coles and M. N. Pivnenko, Nature, 2005, 436, 997–1000.
- Fukuda and Zumer 2010 J. Fukuda and S. Zumer, Phys. Rev. Lett., 2010, 104, 017801.
- Fukuda and Zumer 2010 J. Fukuda and S. Zumer, Liq. Cryst., 2010, 37, 875–885.
- Ravnik et al. 2011 M. Ravnik, G. Alexander, J. Yeomans and S. Zumer, Soft Matter, 2011, 7, 10144–10150.
- Alexander and Marenduzzo 2008 G. P. Alexander and D. Marenduzzo, EPL, 2008, 81, 66004.
- Fukuda et al. 2009 J. Fukuda, M. Yoneya and H. Yokoyama, Phys. Rev. E, 2009, 80, 031706.
- Henrich et al. 2010 O. Henrich, D. Marenduzzo, K. Stratford and M. E. Cates, Phys. Rev. E, 2010, 81, 031706.
- Castles et al. 2010 F. Castles, S. M. Morris, E. M. Terentjev and H. J. Coles, Phys. Rev. Lett., 2010, 104, 157801.
- Tiribocchi et al. 2011 A. Tiribocchi, G. Gonnella, D. Marenduzzo and E. Orlandini, Soft Matter, 2011, 7, 3295.
- Ravnik et al. 2011 M. Ravnik, G. Alexander, J. Yeomans and S. Zumer, Proc. Natl. Acad. Sci. USA, 2011, 108, 5188–5192.
- Henrich et al. 2010 O. Henrich, K. Stratford, D. Marenduzzo and M. E. Cates, Proc. Natl. Acad. Sci. USA, 2010, 107, 13212–13215.
- Helfrich 1969 W. Helfrich, Phys. Rev. Lett., 1969, 23, 372.
- Press and Arrot 1978 M. J. Press and A. S. Arrot, J. Phys. France, 1978, 39, 750–759.
- Marenduzzo et al. 2004 D. Marenduzzo, E. Orlandini and J. M. Yeomans, Phys. Rev. Lett., 2004, 92, 188301.
- Marenduzzo et al. 2006 D. Marenduzzo, E. Orlandini and J. M. Yeomans, J. Chem. Phys., 2006, 124, 204906.
- Rey 1996 A. D. Rey, Phys. Rev. E, 1996, 53, 4198–4201.
- Rey 1996 A. D. Rey, J. Non-Newtonian Fluid Mech., 1996, 64, 207–227.
- Rey 2000 A. D. Rey, J. Rheol., 2000, 44, 855.
- Rey 2002 A. D. Rey, J. Rheol., 2002, 46, 225.
- Dupuis et al. 2005 A. Dupuis, D. Marenduzzo, E. Orlandini and J. M. Yeomans, Phys. Rev. Lett., 2005, 95, 097801.
- Zapotocky et al. 1999 M. Zapotocky, L. Ramos, T. Lubensky and D. Weitz, Science, 1999, 283, 209.
- Ramos et al. 2002 L. Ramos, M. Zapotocky, T. C. Lubensky and D. A. Weitz, Phys. Rev. E, 2002, 66, 031711.
- Beris and Edwards 1994 A. N. Beris and B. J. Edwards, Thermodynamics of Flowing Systems, Oxford University Press, 1994.
- Alexander and Yeomans 2006 G. P. Alexander and J. M. Yeomans, Phys. Rev. E, 2006, 74, 061706.
- Denniston et al. 2001 C. Denniston, E. Orlandini and J. M. Yeomans, Phys. Rev. E, 2001, 63, 056702.
- Marenduzzo et al. 2007 D. Marenduzzo, E. Orlandini, M. E. Cates and J. M. Yeomans, Phys. Rev. E, 2007, 76, 031921.
- Denniston et al. 2004 C. Denniston, D. Marenduzzo, E. Orlandini and J. M. Yeomans, Philos. Trans. R. Soc. London, Ser. A, 2004, 362, 1745.
- Wagner and Pagonabarraga 2002 A. J. Wagner and I. Pagonabarraga, J. Stat. Phys., 2002, 107, 521–537.
- MacMeccan et al. 2009 R. M. MacMeccan, J. R. Clausen, G. P. Neitzel and C. K. Aidun, J. Fluid Mech., 2009, 618, 13–39.
- Aidun and Clausen 2010 C. K. Aidun and J. R. Clausen, Ann. Rev. Fluid Mech., 2010, 42, 439–472.
- Frijters et al. 2012 S. Frijters, F. Gunther and J. Harting, Soft Matter, 2012, 8, 6542–6556.
- Henrich et al. 2012 O. Henrich, K. Stratford, D. Marenduzzo, P. V. Coveney and M. E. Cates, Soft Matter, 2012, 8, 3817–3831.
- Henrich et al. 2012 O. Henrich, K. Stratford, D. Marenduzzo, P. V. Coveney and M. E. Cates, J. Phys. Condens. Matter, 2012, 24, 284127.
- Chakrabarti et al. 2004 B. Chakrabarti, M. Das, C. Dasgupta, S. Ramaswamy and A. K. Sood, Phys. Rev. Lett., 2004, 92, 055501.
- Cates et al. 2002 M. E. Cates, D. A. Head and A. Ajdari, Phys. Rev. E, 2002, 66, 025202.
- Fielding and Olmsted 2004 S. M. Fielding and P. D. Olmsted, Phys. Rev. Lett., 2004, 92, 084502.