Charge States of Ions, and Mechanisms of Charge-Ordering Transitions
Abstract
To gain insight into the mechanism of charge-ordering transitions, which conventionally are pictured as a disproportionation of an ion M as 2Mn+ M(n+1)+ + M(n-1)+, we (1) review and reconsider the charge state (or oxidation number) picture itself, (2) introduce new results for the putative charge ordering compound AgNiO2 and the dual charge state insulator AgO, and (3) analyze cationic occupations of actual (not formal) charge, and work to reconcile the conundrums that arise. We establish that several of the clearest cases of charge ordering transitions involve no disproportion (no charge transfer between the cations, hence no charge transfer), and that the experimental data used to support charge ordering can be accounted for within density functional based calculations that contain no charge transfer between cations. We propose that the charge state picture retains meaning and importance, at least inn many cases, if one focuses on Wannier functions rather than atomic orbitals. The challenge of modeling charge ordering transitions with model Hamiltonians is discussed.
1 Introduction to the Issues
As the momentous transition between conducting and insulating states by making a simple change (temperature, pressure, electron concentration, disorder), the metal-insulator transition (MIT) has assumed extraordinary importance in condensed matter physics research and plays a role in actual and anticipated applications. Established mechanisms include (1) interelectronic repulsion of electrons at low density (Wigner transition), (2) intraatomic repulsion and resulting correlation (Mott transition), (3) disorder leading to incoherence and localization (Anderson transition), (4) coupling to lattice, thereby opening new band gaps (Peierls transition), and (5) interatomic repulsion leading to charge ordering (“Verwey transition?”). The latter mechanism is distinguished by a breaking of symmetry on a sublattice of cations having partially filled, correlated (viz. ) electronic shells.
The mechanism for the Verwey MIT in magnetite Fe3O4 from the time of its discovery[1] was speculated to involve ordering to two charge states Fe3+ and Fe2+ on one Fe sublattice, making it the earliest example of a charge order transition, one that evidently would explain the MIT. A related charge order mechanism arises from disproportionation occurring at, and driving, the transition, which might also be envisioned as the mechanism in magnetite: 2Fe2.5+ Fe2+ + Fe3+. The former is a disorder-order (charge disorder - charge order) transition in which the “symmetric” metallic phase contains two space- and time-fluctuating charge states, the second is a disproportionation-driven transition in which every site in the metallic phase is equivalent even on a short time scale[2] (rather than only in time-averaged diffraction).
In this paper we extend our earlier work[3] on analyzing the connection between putative charge order driven MITs and the cation charge states that are involved. This study brings the concept, and the specification, of charge state or (formal) oxidation state or formal valence to the fore. We noted that the physical cation charge – the occupation – can be identified from electronic structure calculations, by giving up the usual approach of integrating the density over some volume and instead simply looking at the cation charge density in the vicinity of the peak in the radial density where only density resides. Differences in occupation, which are our current interest, are particularly easy to identify and quantify. Several examples of differing charge states were shown to contain equal occupations; actual charge is effectively divorced from “charge state” in some of those examples.
In Sec. II the original chemist’s concept of “oxidation number” [or (formal) oxidation state] is discussed briefly, noting that it metamorphosed into a more physical picture of “charge state” for materials physicists. A brief poor man’s description of what is used to specify the charge state of an ion is provided in Sec. III. Some theoretical aspects, relating both to charge order transitions and to oxidation states, are discussed in Sec. IV. In Sec. V we begin by recounting one illustrative example of competing charge states in a compound, and proceed to review and extend slightly our previous examples of charge ordering materials where it was established that no occupation difference between differing charge states exists. We proceed to an unconventional case – metallic with second order transition – “charge ordering” compound AgNiO2 in Sec. VI, and in Sec. VII look into the charge states of Ag in stable, untransforming, insulating AgO. Our discussion in Sec. VIII pulls together some of our thoughts on understanding and modeling structural and electronic transitions in the types of systems we have discussed.
2 Oxidation Number
Chemists introduced the oxidation number (sometimes, oxidation state) of an atom in a molecule almost entirely on the basis of structure and electronegativity. With its high electronegativity, oxygen has oxidation number -2 except in very unusual geometries, and halides are -1, in both cases filling a shell. Electropositive ions (alkalis, alkaline earths, rare earths) in oxides and halides donate the electrons in their outer and shells, giving obvious positive oxidation numbers denoted early on and occasionally still by Roman numerals: viz. LiI, CaII, LaIII. Most of the complications arise when, after nature has completed its bonding, an open shell remains. For example, vanadium oxides may have VII, VIII, VIV, and VV, and combinations thereof.
The chemistry literature[4, 5, 6, 7] contains numerous disclaimers that these oxidation states “have nothing to do with actual charge” and some strive to maintain distinctions between the different terms in covalent molecules and molecular complexes. In the current materials physics literature there is no discernible distinction. Oxidation states are assigned from the structure (coordination and distance of neighbors of known valence), becoming formalized[8] in the valence bond sum that derives a formal valence (or ‘bond order’) directly from bondlengths. Sometimes the magnetic moment is involved, giving different ionic radii for high spin versus low spin ion. Nevertheless oxidation numbers (formal valences) have come to be connected with the number of actively-occupied local orbitals; through size – higher oxidation state means fewer electrons and a smaller ion; through symmetry – a Jahn-Teller (JT) distorted coordination shell reflects specific orbital occupations; through magnetic moment, which requires specific unpaired spin-orbitals.
These oxidation numbers smelled a lot like charges to later scientists (especially material physicists), and they necessarily sum to zero like real charges. Already in 1939, fourteen years after the naissance of quantum mechanics, Verwey was discussing the metal-to-insulator (MIT) transition in magnetite (Fe3O4) – the Verwey transition at 120 K – in terms of charge ordering of Fe2+ and Fe3+ ions on one of the iron sublattices. Note that the notation had already begun to shift Fe(II) Fe2+ etc. The meaning was clearly physical charges as opposed to puerile oxidation states: to account for the transition from itinerant conductor to charge-localized insulator, actual charges were ordering, getting stuck to ions, becoming localized, and so forth – that seemed to be the problem to solve.
3 Assigning Charge States of Ions
Ionic radii and high/low spin designations differ with coordination,[9] due in large part to the difference in crystal field. Unless noted, we use language applying to octahedral coordination for our comments.
Size. The ionic radius characterization of charge states has organized a great deal of structural information. The organization of all the structural data culminated in the table of Shannon ionic radii compiled by Shannon and Prewitt that have provided the standard for more than four decades.[9] For ions in 6-fold coordination, the average cation-oxygen distance together with the O2- radius of 1.40-1.42Å specifies the ionic radius, the Shannon values being the best fit for a given presumed charge state to a large set of compounds. Note that the ionic radius contains no input from the actual size of the electronic cloud of the ion. Also, ionic radii differ for different coordinations, whereas the charge density is virtually invariant. The charge density is not used, as it is never measured with sufficient precision to be useful in this context (and the chemists insist it is irrelevant anyway).
Symmetry. Distortions from symmetric coordination – Jahn-Teller distortions – are assigned to occupation of specific, directional orbitals. Such assignments have been borne out by electronic structure calculations in a great number of cases. The La2VCuO6 example will be discussed in Sec. V, where it will be seen that spin-orbital occupations can be confusing.
Magnetic moment. A Curie-Weiss moment, or ordered moment, reflects “unpaired” occupation, i.e. distinct orbitals are occupied by one spin only. Cations of a given charge state can sometimes occur in both high spin and low spin (often zero) configurations. Interestingly, the two spin states that arise in several ions have been assigned to different ionic radii, with the high spin configuration typically 0.04 Å larger than low spin of a given charge state.[9] Spin polarization actually changes the occupation and the radial density (real ionic size) by a negligible amount. Spin polarization does however create a spin splitting so that up and down spin electrons hybridize differently with the O ions, and there is an interorbital Hund’s rule energy.
4 Theoretical Notions
4.1 Modeling of charge order transitions
Tight binding modeling of charge ordering transitions typically invokes, beyond the hopping term , direct intersite repulsion between charges on neighboring cations in addition to intrasite repulsion:
| (1) |
where is the Hubbard on-site repulsion and is an intersite repulsive energy, where indicates neighboring sites and are spin indices. The second term alone, which is pictured as the driving force, would minimize the energy by forcing as much charge as possible onto as few distant sites as possible. The Hubbard term provides the necessary, and physical, energy that opposes excessive inhomogeneity. Pietig et al.[10] and Hellberg[11] have shown, for example, that this Hamiltonian alone, on a two-dimensional cluster with periodic boundary conditions, shows a range of re-entrant (with temperature) charge order transitions in a certain range of (with set equal to the bandwidth), similar to the popular interpretation of behavior observed in some manganites.
Other Hamiltonian terms are included in more general models than the single-band case just mentioned: very often Jahn-Teller distortion energies for multiorbital systems, and sometimes magnetic Hund’s rule energy (on-site spin-spin) as well as distance dependent kinetic hopping . This type of extension (without Hund’s rule) has been applied by Mishra et al.[12] to model behavior observed in manganites. In a two band model for electrons in perovskite nickelates (which we discuss below), Lee and coworkers[13] applied a Hamiltonian (notably without ) and obtained charge order-like phases driven by Fermi surface nesting. These nickelates do not show JT distortions as anticipated of an system, prompting Mazin et al.[14] to suggest avoidance of JT distortion can be accomplished in certain regimes by charge ordering instead. They suggested the form of Hamiltonian mentioned above, minus the term, should provide the relevant energies. Interestingly also, when performing a thorough mean field study of ordered states in NiO2 ( = Na, Li, Ag, the latter of which we address in Sec. VI), Uchigaito et al. also chose not to use the intersite repulsion term, although several other interactions were included. Amongst the many possible phases uncovered for a selection of independent interaction strengths in the Hamiltonian were phases of charge ordered type.[15]
4.2 Identification of charge states / oxidation states
It is commonly stated and generally accepted that dividing the crystalline density into atomic contributions is so subjective as to be useless for specifying a charge state. This statement contains a lot of truth but is not entirely correct. Creating disjoint volumes associated with ions is indeed subjective and ambiguous. However, the general question is more subtle than dividing up space, so it is worthwhile to digress briefly.
4.2.1 From pseudoatoms to the enatom
Almost four decades ago Ball demonstrated,[16] using small displacements of nuclei, how the charge density of a collection of atoms can be decomposed uniquely into contributions from each atom (“pseudoatoms”). In the process he also identified a charge backflow field associated with each atom when it is displaced slightly. Subsequently he qualified[17] this result, which does indeed apply to any finite system and to non-polar solids where the pseudoatoms are necessarily neutral. Polar solids, however, provide additional challenges closely related to the difficulties of treating polarization in such solids, where much progress has been made in the past two decades.[18, 19] The fact that the Born effective charge for a charged ion is a tensor provides insight: the (Born) effective charge is not a simple scalar, but depends on the direction of displacement. Ball’s prescription has so far been applied only to simple metals,[20] where it may be useful for understanding lattice dynamics and, applying the same prescription to the potential, electron-phonon coupling.[21] Because the name pseudoatom has been used in so many different contexts, the designation enatom has been suggested for Ball’s pseudoatom.[20]
It remains true that trying to divide space into regions in which the charge density is assigned to a particular atom is a subjective, hence useless enterprise in practice. Ball’s approach differs, by deriving overlapping atomic densities extending perhaps to a few shells of neighbors. This observation conforms well to our finding,[3] discussed at more length below, that the occupation often does not vary at all between different charge states. If a rather small sphere were chosen to specify the charge, different charge states would have identical charges (in those regions). Where the charge state picture clearly works – which is very often – the electronic spectrum is a central property: occupied bands corresponding to occupied local spin-orbitals can be identified, and the sum of the orbital occupations determines the charge state. These have conventionally been pictured as atomic orbitals, but the development and use of Wannier functions (WFs) over the past decade provides an alternative viewpoint that we return to below.
4.2.2 Calculation of the oxidation state.
Two proposals for the definition and calculation of “oxidation states” (both used this terminology rather than charge states) have appeared recently. With molecular complexes in mind, Sit et al. suggested[22] projecting the occupied states onto atomic (, say) orbitals to obtain the spin-orbital occupation matrix as is done in the LDA+U method, diagonalize this matrix, and the number of eigenvalues representing full occupancy provide the number of occupied physical orbitals and hence the oxidation state. Smaller occupations are ignored. For the transition metal complexes they provided as examples, the procedure was relatively clear. However, possible ambiguities could be imagined: in one of the examples 0.93 needed to be interpreted as occupied, 0.63 as not occupied. More testing of these ideas should prove instructive.
Another proposal, by Jiang et al.,[23] applying specifically to periodic systems, employed developments in the theory of polarization in crystals to formulate their definition of oxidation number as the integral of (viz. average of) the Born effective charge as the ion’s sublattice is displaced adiabatically by one direct lattice vector. The material must remain insulating but otherwise the result is independent of the path in configuration space. This procedure does not identify an ion’s charge density or necessarily even entail a true charge, but does provide the interpretation of the change in polarization as being due to the transport of a number of unit charges equal to the oxidation state through a displacement corresponding to the lattice vector.
As in the case of the enatom mentioned earlier, this definition also does not make the oxidation state a property of the static reference state – displacement is required. Because the path is periodic (it can be repeated), any point can be considered as the starting (reference) point, with the same oxidation state (same integral). Thus the ion retains one fixed oxidation state along the path in configuration space. Considering that the Born effective charge is anisotropic, it seems possible that the oxidation state by this definition in an anisotropic insulator also depends – as does the Born effective charge – on the direction of the direct lattice vector that connects the end points. Further applications of this proposal will be enlightening, as will the fact that displacement is required to specify what is normally envisioned as a property of the static system.
4.2.3 Oxidation states from Wannier functions
In the survey in this paper of charge ordering transition involving different charge states, and hence of the specification of charge states more generally, we will begin to explore the viability of abandoning atomic orbitals, whose occupation often does not change at the ‘charge ordering’ transition, in favor of Wannier orbitals. The basic idea is: calculate atomic-like Wannier functions for the relevant states and explore whether these orbitals support the charge state viewpoint. Though ideas along these lines have been implicit in discussing specific materials, and Wannier functions have been integrated into the electronic structure calculations in various ways, this change from atomic to Wannier orbitals becomes transformational when applied to ‘charge ordering’ transitions. Without any change in actual () charge on the open-shell cation, what are the relevant degrees of freedom to consider? We return to some of these general issues in the Discussion in Sec. VIII, but we begin by considering a simple and nearly transparent case illustrating the idea.
In the double perovskite compound Ba2NaOsO6, osmium is formally a heptavalent Os7+ ion – a very high oxidation state. Calculating the charge in the ion, though one cannot arrive at a precise value as noted above, corresponds to occupation by around 4.5 (not 1.0) electrons.[24] Cases of large differences between actual charge and oxidation state are common knowledge in the electronic structure community. Does this signal the breakdown of the charge state picture for high valence state ions? It doesn’t: calculations[25, 26] indicate one electron in the otherwise unoccupied “ bands,” spin half of course, and if the occupation is not tied to the charge state (which it isn’t) then the formal valence picture survives in robust fashion.
Analysis shows that the occupied orbital (i.e. the Wannier function) is a strongly hybridized mixture of 50% Os state and 50% O contributions distributed around the neighboring oxygen ions. The other four electrons making up the total occupation of 4.5 are hybridized into (and thereby vanish into) the 6 atoms 3 orbitals = 18 occupied O “ bands.” Transformation from atomic orbitals to Wannier orbitals would presumably lead to 18 occupied O-centered orbitals of symmetry with tails of Os states, and one occupied Os -derived orbital with tails composed of O orbitals. So although several electrons vanish into the O bands, all five “ orbitals” survive by recovering charge from the orbitals. Understanding that strong metal-oxygen hybridization implies the efficacy of generalized (Wannier) orbitals has been around for a while; for example, it provided a simple picture explaining why second Cu-Cu neighbor coupling along a chain dominated over near neighbor coupling in the Cu-O magnetic chain compound Li2CuO2.[27]
Another example illustrates an apparent connection between WFs and formal valence. Volja et al.[28] have calculated WFs for the two charge states in a charge ordered manganite La1/2Ca1/2MnO3, finding a substantial difference in the extent of the tails, the “Mn4+” WF being more localized. Concerns about specifying charge states with WFs include (1) a computational issue: the gauge freedom means WFs are far from unique, so subjective choices may lead to different conclusions, and (2) a conceptual issue: the choice of projections – the orientations, for example – themselves are not objective. At one extreme are maximally localized WFs[29, 30] that may not be centered on an ion and may be unsymmetrical, therefore complicating if not destroying any utility in representing physical orbitals. Atom orbital- and symmetry-projected WFs[31] (“maximally projected”) provide an alternative approach, one that should provide a more physical representation, and the projection issue may present less of a non-uniqueness ambiguity. This viewpoint remains to be tested seriously.
5 Transition Metal Charge States: Illustrative Examples
In oxides containing two transition metals, one of the first tasks in understanding them is to categorize the charge states of the ions. The sum is known from oxygen and the simpler ions, but a number of competing factors (which are not well understood and are likely to be material-specific) determine the balance. The double perovskite structure is simple and provides our first example.
5.1 Competing Charge States of La2VCuO6
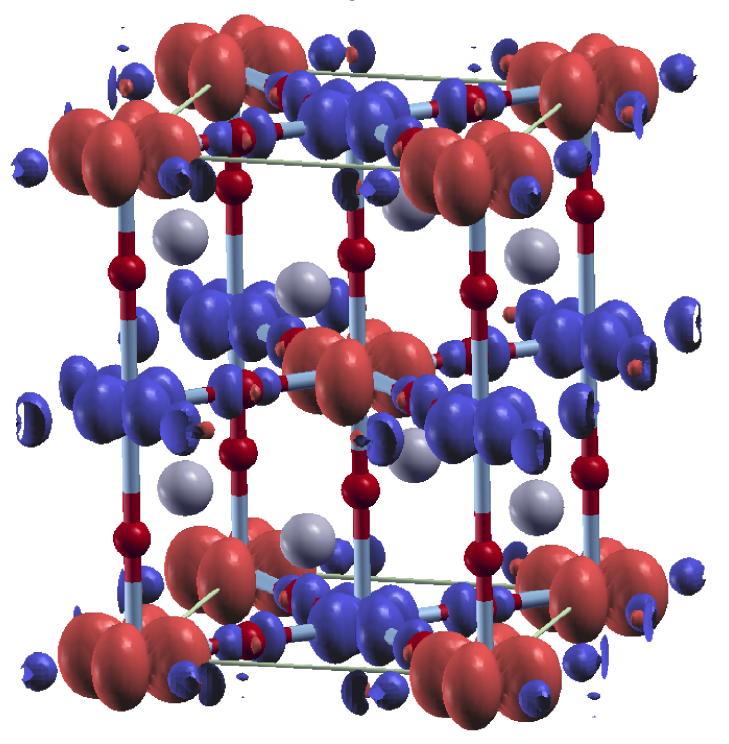
The computational methods we have used were described previously.[3, 32, 33] In our earlier work[34] on La2VCuO6, using the LDA+U method[35, 36] as is necessary for such oxides, it was found that the two configurations V5+Cu1+, a standard closed shell band insulator, and V4+Cu2+, a spin-compensated ferrimagnetic correlated insulator with a very small gap, are practically degenerate in energy after full structural relaxation. These charge state assignments fit in all respects. Structurally, the mean V-O distances are 1.84 Å and 1.88 Å respectively for the two configurations, differing by the difference in the corresponding V ionic radii (0.04 Å). The mean Cu-O distances are 2.02 Å and 1.98 Å, respectively, again differing by their ionic radii (0.04 Å also). The Jahn-Teller distortion magnitude for the magnetic configuration (long bond minus short bond) is 0.11 Å for both ions, an unambiguous JT distortion. Magnetically, V and Cu have one electron and one hole, respectively, as judged by the moment (reduced somewhat by hybridization) and by their respective filled and empty bands. These two configurations are “poster kids” for the charge state picture – nothing could be clearer. The spin density is pictured in Fig. 1 and supports the charge state description of the spin compensated Mott insulating phase.
| Atom | Total | |||||
|---|---|---|---|---|---|---|
| V up | 0.77 | 0.11 | 0.11 | 0.26 | 0.18 | 1.40 |
| V dn | 0.07 | 0.10 | 0.10 | 0.26 | 0.18 | 0.68 |
| V diff | 0.70 | 0.01 | 0.01 | 0.00 | 0.00 | 0.72 |
| V sum | 0.84 | 0.20 | 0.20 | 0.51 | 0.36 | 2.11 |
| V | 0.30 | 0.30 | 0.30 | 0.57 | 0.57 | 2.04 |
| Cu up | 0.94 | 0.92 | 0.92 | 0.95 | 0.29 | 4.03 |
| Cu dn | 0.94 | 0.92 | 0.92 | 0.95 | 0.97 | 4.70 |
| Cu diff | 0.00 | 0.00 | 0.00 | 0.00 | -0.68 | -0.68 |
| Cu sum | 1.88 | 1.84 | 1.84 | 1.90 | 1.26 | 8.72 |
| Cu | 1.75 | 1.75 | 1.75 | 1.86 | 1.86 | 8.97 |
What our earlier work[3] also established is that the total occupation in both charge states of V, and also of Cu, are identical (by this we mean 0.5% difference or less – no physically meaningful difference). It has occasionally been noted in the literature of electronic structure calculations (including our own) that atomic charges in different charge states “differ rather little” in charge. In this case, and in the few others that we have checked so far (see below), the difference is negligible.
In Table LABEL:TableI we display the spin-orbital occupation numbers for V and Cu in both charge states to illustrate some complexities that arise. They are not troublesome in this straightforward system, but are instructive in that they differ considerably from what the ideal picture would suggest. These values are spin-orbital occupations inside the LAPW spheres, which contain tails of neighboring oxygen ions and do not include the tails; all of these tails are in fact ill defined. The “total” charge difference in the sphere is typical of what is mentioned in the literature: the differences arise from tails of O orbitals originating at different distances. For the closed shell, band insulator state with cubic site symmetry, the occupations for Cu are 6% larger than for , a difference allowed by cubic symmetry and revealing a density that is mildly deformed from spherical. For V however, this difference is nearly a factor of two, reflecting the bonding of states with O states, much of which becomes hidden in the lower part of the O bands and has little consequence unless considering the actual charge.
The magnetic, JT distorted configurations are more enlightening. Although the charges are distributed over spin-orbitals in somewhat unexpected ways as reflected in Table LABEL:TableI, the magnetic moment arises, as the textbook picture would suggest, entirely from the JT-active orbitals, in V and in Cu. The moment on both V and Cu is reduced by hybridization with states: the majority charge is less that the formal charge picture suggests, the minority charge is greater, and each moment has magnitude about 30% smaller than the ideal spin-half value of 1 .
The charge state designation means many things, but it does not mean at all what the name seems to imply: atomic charge (and spin). A “charge state” designation that does not specify a specific charge seems to classify it as an oxymoron, yet charge state very often is an essential concept in conveying the character of the ion and its environs (“which local spin-orbitals are occupied”). Using the term “oxidation state” instead of “charge state” obscures the issue rather than clarifying it. It is this conundrum that we will expand on in the following sections. Note at this point that we have tried not to say ‘what atomic orbitals are occupied’ but instead what local orbitals are occupied. We provide most of our discussion that follows, with one exception, in the context of materials with “charge ordering transitions.”
5.2 Rare earth Nickelates
The structural and metal-insulator transition[37, 38] in the rare earth nickelates NiO3 has been discussed for two decades as a charge order transition, with experimental data being analyzed in considerable detail for YNiO3 and several others in terms of a fractional charge transfer 2Ni3+ Ni3+δ + Ni3-δ, with the latest analysis[39] pointing to 0.3 for YNiO3. The high temperature diffraction-determined structure has a single Ni site in the distorted GdFeO3-type cell containing four formula units with a single Ni site, while two separate sites Ni1 and Ni2 appear in the low temperature, symmetry broken (charge ordered) phase. The Ni-O octahedra remain nearly regular (i.e. without JT distortion), with the Ni1-O and Ni2-O mean distances being 2.02 Å and 1.92 Å, respectively. A simple breathing mode mediates the transition. The large Ni-O separation differences are consistent with the Ni2+ and Ni4+ charge state picture, except for =1 rather than =0.3. There are, however, several questions about the current interpretation that we now discuss.
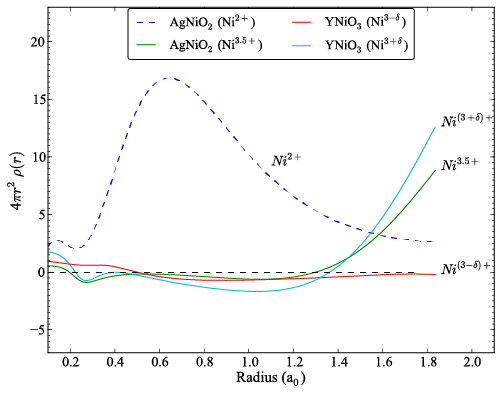
Our investigation into mechanisms of “charge ordering” transitions was spurred by noticing[3] that the Ni1 and Ni2 sites have identical charge, being also the same as in the high symmetry phase with a single Ni site. In Fig. 2 a different type of presentation is provided. A single “Ni2+” radial density is plotted, that of one of the sites in AgNiO2 (see below); the other Ni ions in this figure, even those with different charge states, are indistinguishable on this scale in the region of the peak. With this “Ni2+” site as the reference, the relative differences (expressed in percent) for “Ni(3-δ)+” (Ni1 in YNiO2), “Ni(3+δ)+” (Ni2 in YNiO3), and “Ni3.5+” (Ni1 in AgNiO2) are plotted. In the region of the peak in density =0.6, the differences are of the order of one-half percent. The shapes of the density (viz. orbital) become slightly different around 1, and the effects of oxygen tails at different distances become evident beyond 1.4. Note that the “Ni3-δ” density is the nearer to the “Ni2+” density than are the other two.
| Eigenvalue | Total | |||||
|---|---|---|---|---|---|---|
| Ni1 up | 0.91 | 0.92 | 0.92 | 0.85 | 0.83 | 4.43 |
| Ni1 dn | 0.91 | 0.91 | 0.91 | 0.19 | 0.17 | 3.08 |
| Ni2 up | 0.92 | 0.92 | 0.92 | 0.64 | 0.58 | 3.98 |
| Ni2 dn | 0.92 | 0.92 | 0.92 | 0.36 | 0.32 | 3.44 |
Since the NiO6 octahedra are somewhat distorted in this system, it is the eigenvalues of the occupation matrices for the two spins for (ferromagnetic) YNiO3 that we present in Table LABEL:YNiO3occnumbers. These values can be used to evaluate the oxidation state prescription of Sit et al.[22] Their prescription gives Ni2+ and Ni4+ oxidation states as long as one identifies 0.83 and 0.85 as ‘fully occupied’ (the other fully occupied states have eigenvalue 0.91-0.92), and 0.58 and 0.64 as not fully occupied and thus unoccupied. To make the issue more apparent, it is useful to think of scaling the maximum occupation for this sphere size, 0.92, up to 1.00. Then 0.840.91 must be “fully occupied” and 0.640.70 must be treated as “not fully occupied” to give the mentioned oxidation states. The atomic moments are calculated as 1.35 and 0.54 versus the idealized values of 2 and 0 respectively.
The atomic-orbital projected density of states (PDOS), presented earlier,[14, 3] is reproduced in Fig. 3. The larger moment on Ni1 arises almost equally from more majority states centered at -0.5 eV (an expected difference, near EF) and less minority states near -5 eV (an unexpected change in the strongly bound part of the spectrum). The amount of unoccupied spectral density does not differ much between Ni1 and Ni2, unlike the formal picture would suggest (a factor of two) but it is consistent with our finding of no difference of occupation. The difference lies in the spin and energetic distribution. The “charge state” picture thus is murky: the ionic radii are consistent with full disproportionation =1 whereas other data (see below) are used to justify =0.3 as the best value. The spin-orbital occupation eigenvalues and the PDOS are hardly definitive.
Very often the contrasting core level energies of different sites are used to identify and specify charge states, and this has been done for a few nickelates. In our earlier paper[3] we pointed out that these on-site energies are given well by DFT calculations, and thus are due to the differing environments rather than to any difference in local charge.
5.2.1 Charge order versus Jahn-Teller distortion
In charge order transformation phenomenology, or more broadly for the specification of the oxidation state, the real cation charge – the occupancy – is a peripheral, many say irrelevant as mentioned above, issue, and our specification of occupation reinforces that picture. However, the charge state language invites – in essence, requires – an interpretation of selected spin-orbitals to account for differences in the different sites. The ordered state of NiO3, which contains roughly symmetric NiO6 octahedra of substantially different size, cannot be understood in terms of an ion which should have strong JT tendencies, hence the conventional “charge order” designation. This picture would have the driving mechanism, the entropy frozen out at the transition, be due to charges hopping amongst disordered Ni and Ni sites.
Mazin et al.[14] observed that a fully disproportionated “high spin , no spin ” picture accounts for (1) the lack of JT distortion and (2) the large and small Ni moments. They confined their attention to the ordered phase (ground state). The large and small octahedra, expected on the basis of differences in ionic radii for distinct charge states, does not have any quantitative explanation – in any picture – for ions of identical charge and radial extent. They further suggested that the Hund’s rule magnetic energy is important in producing these configurations. Our earlier work established that there is negligible actual occupation difference between Ni1 and Ni2, which seems to leave the search for the true microscopic driving force between the charge transfer energy, Hund’s rule energy, and electron-lattice coupling, and the change in kinetic energy that results from the latter two and modulated by the former.

5.2.2 Disorder-order scenario
X-ray absorption spectra for nickelates suggests a very different view of the transition. Spectral signatures of the two distinct Ni sites are found in the high temperature, symmetric phase[40, 41] as well as beyond the phase transition under pressure.[42] The interpretation must be that the Ni1 and Ni2 sites are already different above the transition, but are disordered and fluctuating in both space and time. The ionic radii are not a good fit for the perovskite structure, and the structure adjusts by distorting to large and small octahedra. Without structural coherence, carriers can hop – the material is conducting although only as a very bad metal. The entropy is due to fluctuating local breathing modes that freeze in at the transition.
In the ordered phase, the coherent alternation of distortions – a nonzero amplitude of the zone boundary breathing mode, to use common language – opens a gap in the band structure and the material becomes a (correlated) insulator. The transition can be approached from the opposite direction: the ordered phase is a small-gap Mott insulator as long as the structural distortion is coherent, but loss of the coherence smears the gap and leads to a very bad metal but conducting phase. From either viewpoint, the transition is at the most basic level an order-disorder transition, rendered more complex than most by the electronic correlation effects.
The breathing distortion modulates the Ni on-site energy, and hence modulates the charge transfer energy between the O subsystem and each Ni site. JT distortions, on the other hand, retain the mean Ni-O distance and do not modulate the on-site energy significantly.
5.3 Results for Other Charge Order Systems
In our previous report[3] we noted two additional charge-order systems for which there is no difference in occupation of the “charge ordered” cations.
CaFeO3. This ferrate is isostructural with the NiO3 class and displays a similar MIT and structural change. The proposed disproportionation[43] invokes the unusually high oxidation state Fe5+ in addition to the charge-balancing Fe3+ state. The occupations, determined from the radial charge densities, in the charge ordered states for the two Fe sites are identical. It seems plausible that the disorder-order scenario proposed for NiO3 applies to CaFeO3 as well, though there is much less data to validate it. Yang and collaborators[44] noted from their DFT calculations that no meaningful (i.e. discernible) difference in real Fe charge (which they identified as around 5.1 electrons) could be obtained, which led them to categorize the ordered state in terms of ligand holes, + rather than as Fe3+ + Fe5+. The difference in Fe-O distance changes the hybridization considerably, and the resulting difference in hyperfine field that they calculated agreed well with the experimental data.
V4O7. Vanadates of many stoichiometries display MITs accompanied by structural transitions, and the intricacies of the structures complicate identification of the mechanism underlying the transitions. The low temperature, ordered phase of V4O7 has been characterized[45, 46] in terms of two distinct V3+ sites and two V4+ sites. Comparing the radial densities from DFT based calculations,[46] it became clear that all four of the V sites have the same occupation, as for the various other systems we have surveyed and discuss in this paper. The difference in deep core levels for the two Fe sites is 0.9-1.2 eV, similar to the calculated and measured values for the nickelates and CaFeO3, and used to substantiate “charge order.”
6 Charge Order Transition in AgNiO2
The structural transition at 365 K in this triangular lattice compound is not first order but instead continuous, and moreover it is not a MIT but rather a (semi)metal to (semi)metal transition, so AgNiO2 belongs to a separate class from the systems discussed above. It has nevertheless been characterized in some detail as a charge order system possessing other distinctions. It has been studied also for its unusual low temperature magnetic behavior and ordering, which are not our primary concern. The high temperature phase, while conducting, has a resistivity of 2-3 m cm, thus classifying it as a very bad metal or, more realistically, as a semimetal. Decreasing the temperature from the symmetric phase, the resistivity increases slightly but sharply below the transition before leveling off around 40 degrees below the transition and again resuming a positive (metallic) temperature derivative. This transport behavior is at a second order structural transition, where the freezing out of lattice fluctuations upon ordering normally leads to a decrease in resistivity.
The charge state in the symmetric high temperature phase, to the extent that one applies in a conductor, must be Ni3+ , so the triangular lattice of Ni sites provides a platform for frustration of orbital order as well as for potential magnetic order. The transition is to a increase of the cell caused by oxygen displacement radially outward (within its basal plane) from one Ni, denoted Ni1, creating a large Ni1O6 octahedron and two smaller octahedra Ni2O6 and Ni3O6. Ni2 and Ni3 sites differ only due to the stacking sequence of NiO2 slabs, and while this distinction is identifiable in some quantities, the difference is too small to be of interest here. At low temperature Ni1 has a moment of 1.5 while the moments on Ni2 and Ni3 are difficult to quantify, but suggested to be perhaps 0.1. The Curie-Weiss moment, both above and for a wide temperature range below Ts, is roughly consistent with either a moment of 0.7-0.8 on each Ni (the high T phase value), or 1.5 on 1/3 of the Ni ions (the low T phase values). The data and the analysis is not precise enough to distinguish between these two possibilities, or something intermediate.
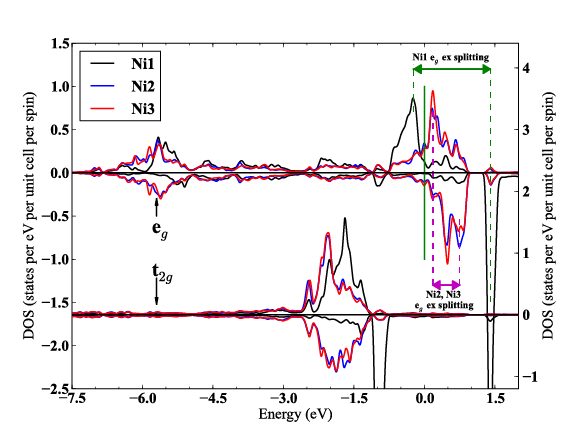
Wawrzynska et al. pointed out[47, 48] that DFT calculations indicate that the Ni1 bands are split 1 eV above and below EF (Fig. 4), giving it an S=1 (Ni2+) “Mott insulator” configuration (even though no strong correlation corrections need to be used in the DFT calculations), with moment reduced by hybridization to be consistent with the observed value. Ni2 and Ni3 are only weakly magnetic, with their bands crossing EF (Fig. 4) consistent with an unpolarized “Ni3.5+” designation for both ions, necessitated by charge neutrality. The O displacement amplitude at low temperature is 0.06 Å, giving a change in Ni-O distances due to the distortion of 0.04 Å. This amount is perhaps reasonable for oxidation states differing by 1/2, but Shannon’s Ni2+ - Ni3+ difference is 0.11 Å, suggesting that a Ni2+-Ni3.5+ difference should be around 0.15 Å rather than 0.04 Å.
As we found for the other compounds which are said to display different charge states, we find that the occupations in “charge ordered” AgNiO2, from the radial charge densities of the three Ni sites near their peaks, are indistinguishable – the charge on each is the same. More detailed results on AgNiO2, including energetics and magnetic moments during oxygen displacement, the Fermi surfaces in the paramagnetic state, comparison with available experimental data, will be published elsewhere.
7 Charge States in AgO
Copper with its various charge states has been well studied because of its central importance in the high temperature superconductors. The isovalent sister Ag rarely displays correlated behavior in ionic compounds or departs from its monovalent, closed shell configuration. The behaviour observed in AgO which we now review puts it in an unusual borderline class of materials containing group IB cations.
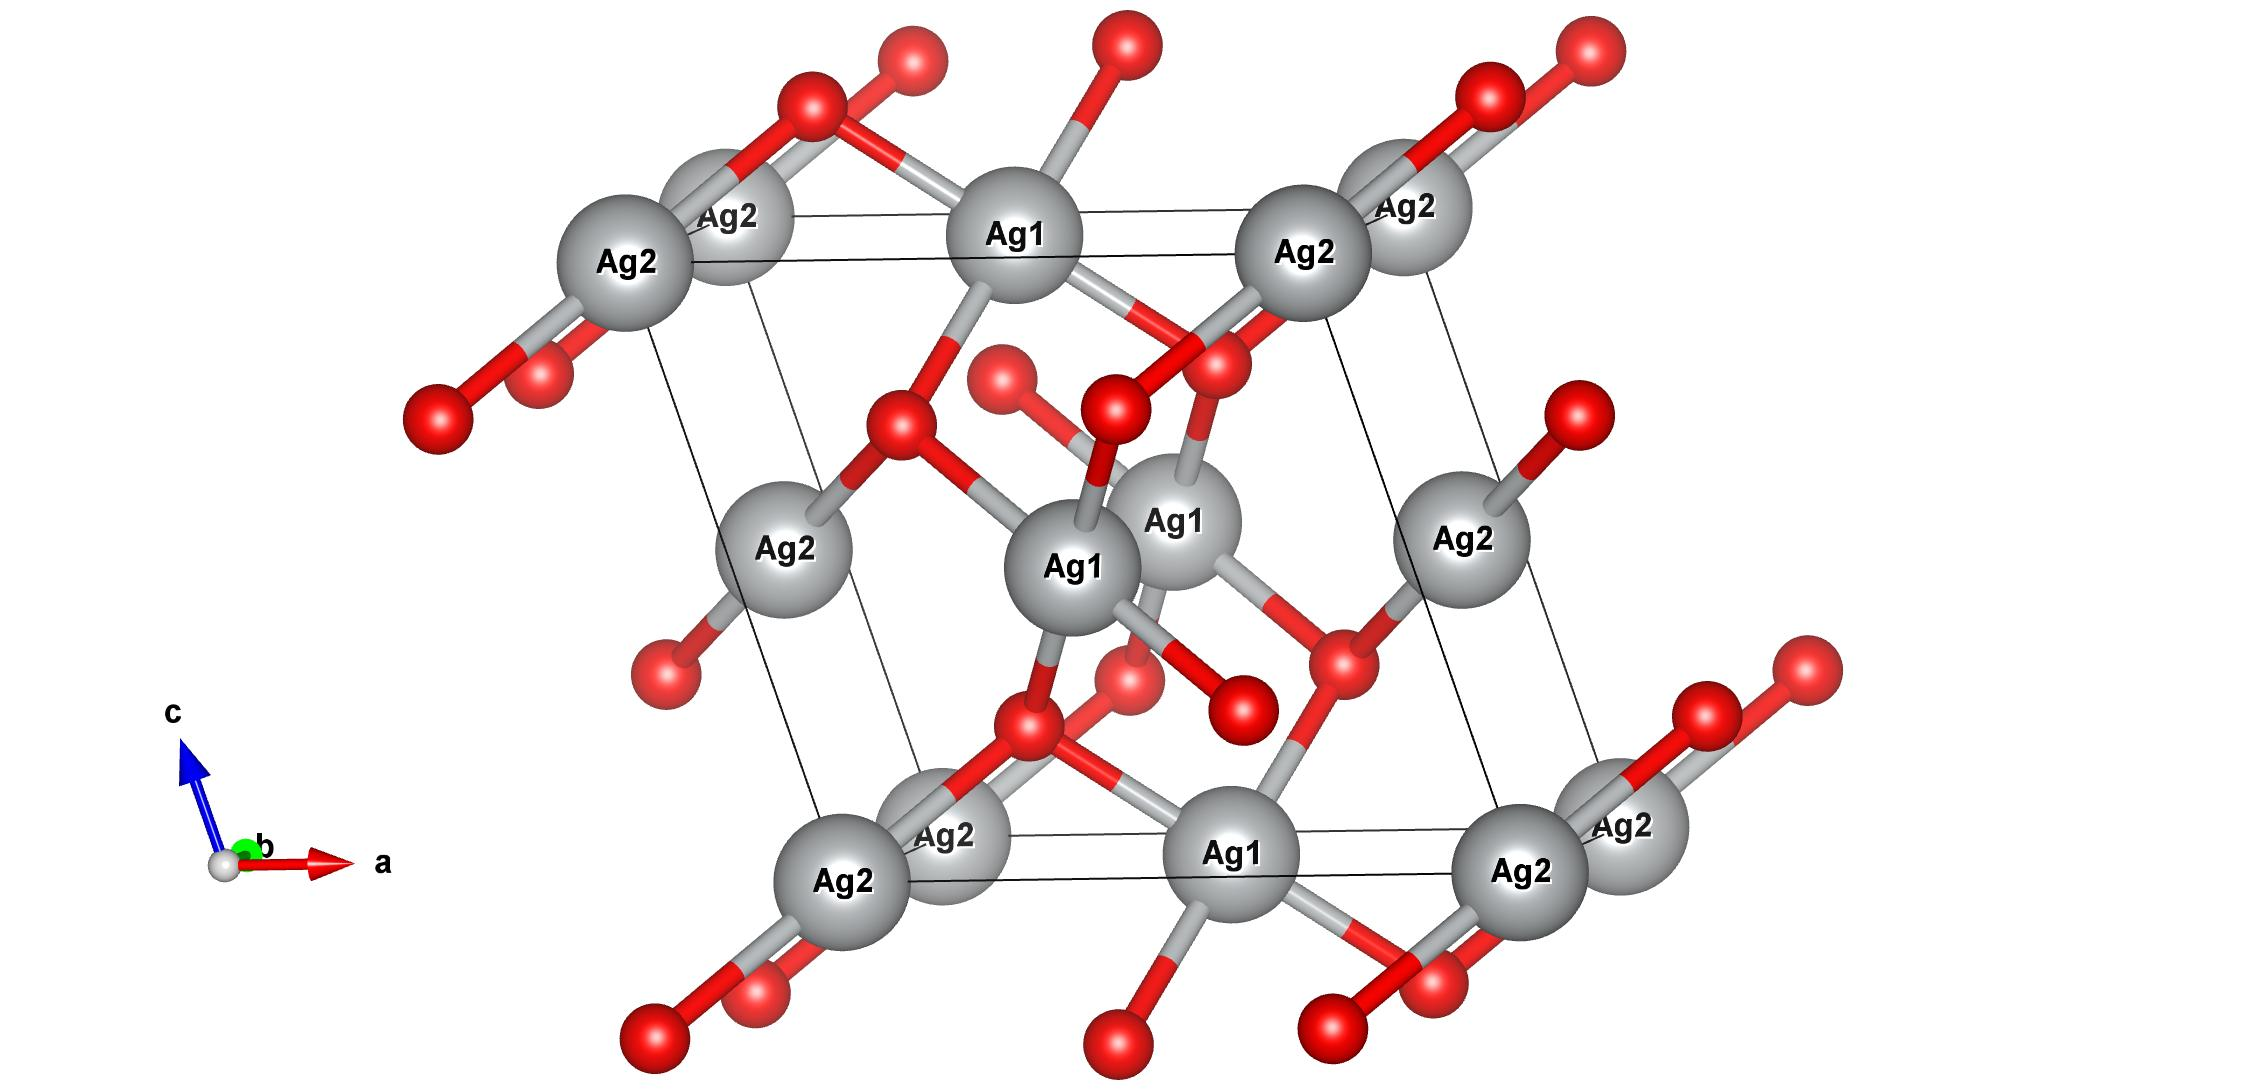
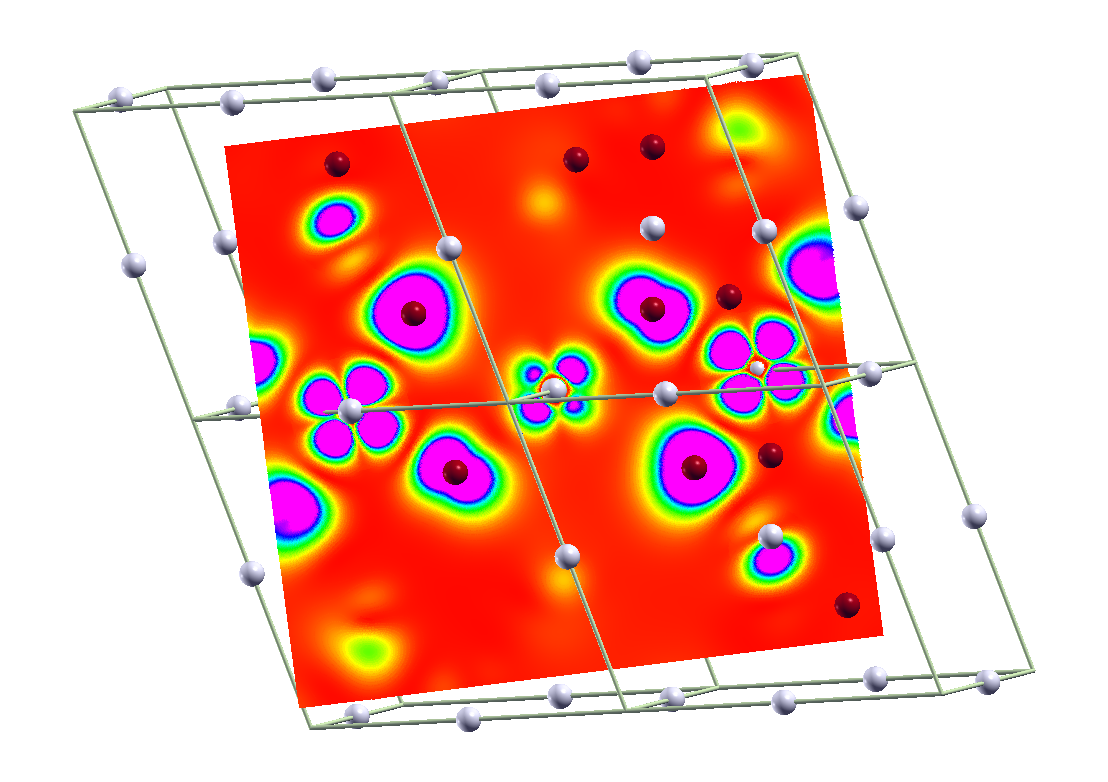
AgO does not display any charge order or other transition, being insulating and diamagnetic at all temperatures. It has however been characterized as displaying both Ag+ and Ag3+ charge states. The crystal structure, pictured in Fig. 5, is monoclinic P21/c (space group no. 14),[49, 50] =5.86Å, = 3.48Å, =5.50Å, , with two inequivalent Ag sites, as pictured in Fig. 5. The Ag1 (Wyckoff site ) sits at the center of a slightly distorted square, Ag2 (site ) forms a linear O-Ag2-O trimer of length 4.34Å, and the O ion sits at the Wyckoff site. The average Ag1-O bond length is 2.03Å, while the Ag2-O separation 2.17Å, consistent with a lower charge state and its lower coordination. Each O (only one crystallographic site) connects two AgO4 squares which are almost perpendicular and one O-Ag-O trimer. GGA and hybrid functional calculations by Allen et al. were interpreted to support the two charge state picture: an unoccupied band is Ag1 derived (one band per Ag1), while all of the Ag2 bands are occupied.[51, 52]
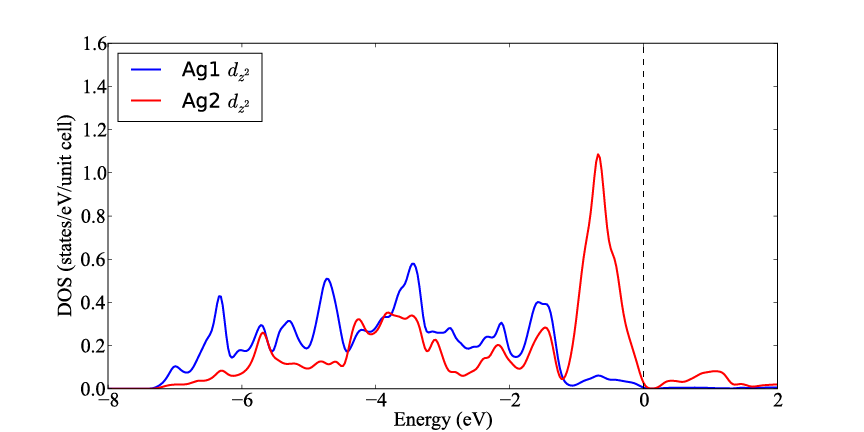
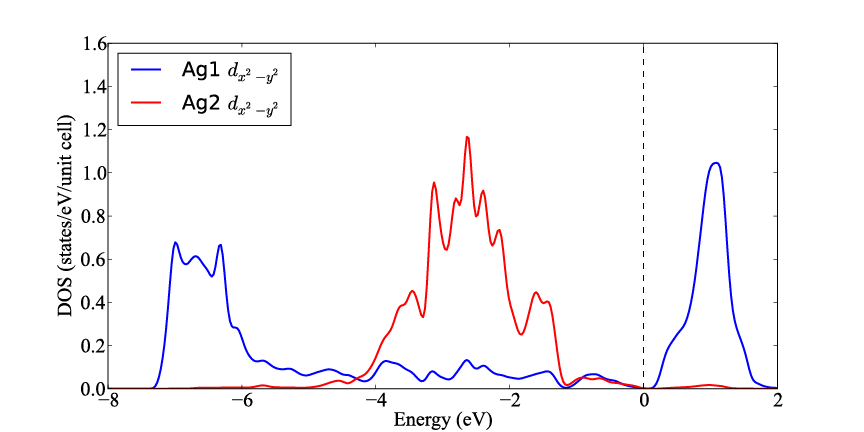
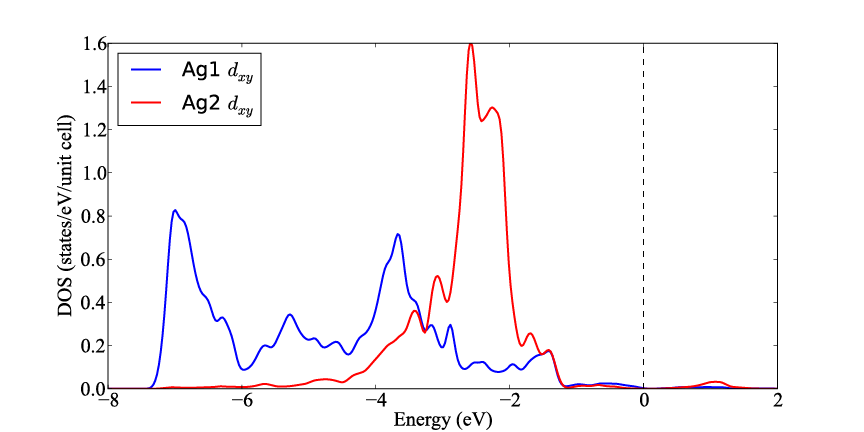
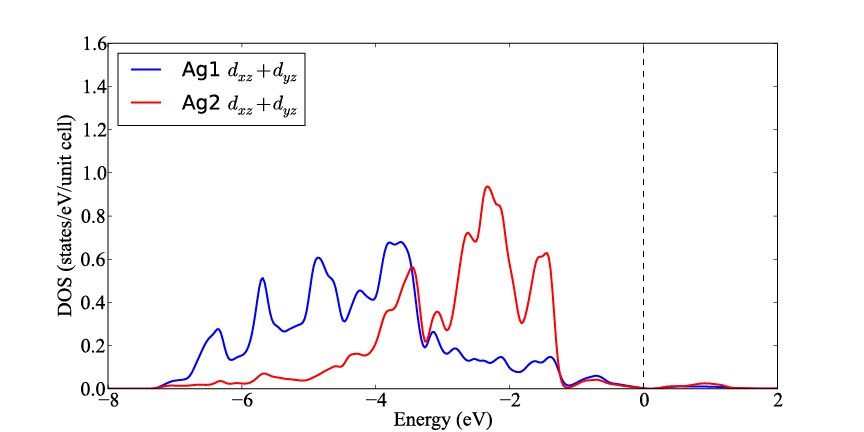
To check the occupation and do some further analysis, we carried out LDA+U (U=5eV, J=0.68eV) calculations using experimental structure. The atom-projected DOS (pDOS) is plotted in Fig. 6. The Ag1 pDOS dominates in the strongly bound region, from -7.5eV to -3.5eV, is smaller than that of Ag2 in the -3.5 eV to -1.5 eV, then is nearly negligible (“gapped”) from -1.5 eV through the bandgap. The unoccupied Ag1-derived band (one band per Ag1 ion) is however roughly half O character, an occurrence that is sometimes characterized as “O holes.” This latter picture would then assign the charge configuration Ag2+, where is a ligand (oxygen) hole, instead of Ag3+. Such a viewpoint becomes difficult to sustain, however, because the seemingly apparent Ag+ charge state requires it to be surrounded by O2- ions, and there is only the single O ion coordinating with both Ag1 and Ag2.
The Ag2 pDOS is contained primarily in a 4 eV wide peak centered at -2.5eV, plus the band just below the gap that is half O in character. The O pDOS is spread relatively evenly through the range of the bands, mixing strongly with both Ag1 and Ag2 except for some Ag2 bands in the -2 eV to -3.5 eV range.
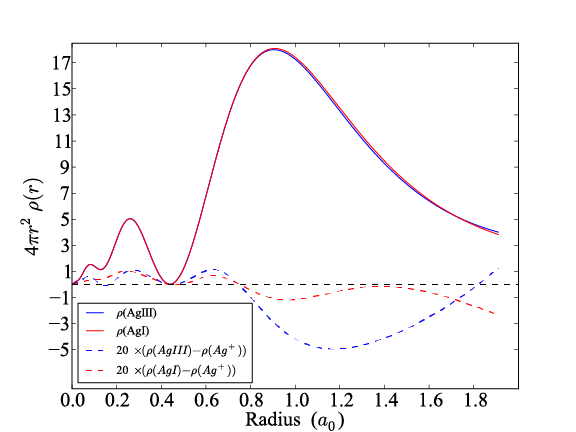
As in the several cases mentioned above, we find negligible difference in the occupation of actual charge (the radial charge densities are nearly identical near the peak). This negligible difference in charge, as well as the extreme similarity to the Ag+ ion density in AgNiO2, is illustrated in Fig. 8.
The oxidation state specification of Sit et al. can be tested here, using the natural local coordinate system where the orbital occupation matrix is nearly diagonal. For Ag2, four orbitals have occupation very near 0.80, i.e. nominal full occupation, since 20% of the charge extends out of the LAPW sphere. The other, , is 0.75. Supposing that 94% also corresponds to a filled orbital, Ag2 is indeed , Ag+. For Ag1 in the square, four orbitals have 0.82 occupation, while the orbital has occupation 0.54, about 68% full. Sit et al.’s prescription would be to ignore this, obtaining , Ag3+.
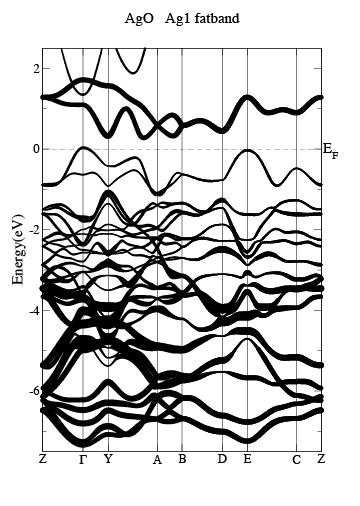
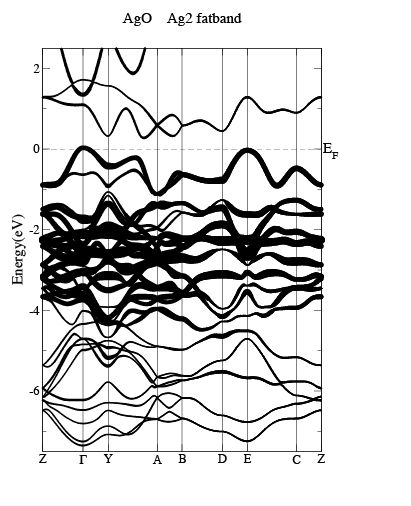
A more illustrative picture is provided by the Ag1- and Ag2-projected fatbands plotted in Fig. 7, which illustrate several characteristics. Much of the weight of the Ag1 atom lies in the lower regions of the bands, which are mixed strongly with O states. A strong ligand field splitting separates one orbital – the member that antibonds strongly with the neighboring O orbitals. The Ag2 1+ ion in the trimer has most of its weight from -4 eV to -1 eV, with a just split off antibonding combination forming a 1 eV narrow band below the gap.
8 Discussion
Briefly stated, we have observed that for several cases of “charge ordering” in solids, usually involving a first order metal-insulator transition, there is no change in cation occupation across the transition, hence no real charge ordering. This lack of any charge transfer between cations during a “charge ordering” transition raises fundamental questions about the mechanism(s) behind these transitions and the best way to understand the underlying physics. There has been some discussion of a similar conundrum in magnetite by Garcia and Subias.[53] At a more basic level, this observation raises perhaps more basic questions about the meaning and specification of “charge states” in solids in addition to the underlying mechanism – just what it is that orders at the transition, where is the entropy gained or lost?
As we have surveyed these few systems, we have observed that if Wannier functions rather than atomic orbitals are used as the physical local orbital, the charge state picture may survive as a useful characterization at least in most of the cases. The objectivity and generality of this viewpoint remains to be tested, and there are cases such as the NiO3 nickelates where the resulting picture seems less than convincing even with Wannier functions in mind. Likely other gray areas will be found as these questions are pursued; fractional charge ordering is especially problematic.
Returning to another underlying motivation – the faithful modeling of “charge ordering” transitions – the basic issues have changed as the microscopic behavior begins to be understood. The initial question we posed was: what are the appropriate terms in a model Hamiltonian to provide correct modeling of the charge-spin-orbital behavior through the transition that leads to “charge ordering transitions”? The answer is that this seems not to be the right question. The challenge is different: in a Wannier function basis of orbitals the most transparent local orbital basis, with occupations one or zero, is different on either side of the transition – the environment is instrumental in characterizing the charge state. The difference can be seen in several ways, but most clearly by the observation that the occupation would differ (by order unity, the difference in occupations) if they were not considerably different. A physical local orbital description on each side of the transition is simple only if substantially different local orbitals are used on either side. A basis sufficient to enable both representations is the set of all and orbitals (other orbitals are out of the picture); a single simple or t2g basis lacks the necessary flexibility. The issue is not what terms are in the Hamiltonian so much as that a good minimal basis on one side of the transition is a poor, insufficient one on the other.
Einstein is said to have stated: “a theory (or model) should be as simple as possible, but no simpler.” The requisite basis set, until shown differently, is (1) the set of relevant atomic states on the open shell cation ( or when crystal field splitting is large, for example) and (2) the active atomic orbitals on the ligand (oxygen). These O functions are necessary because the O participation in a Wannier function changes across the transition, and this is a crucial degree of freedom. The on-site repulsion is relevant due to its role in keeping the occupation fixed, but perhaps it can be thought of heuristically as a term as far as the mean field physics is concerned. Cation-ligand hopping terms and cation-ligand Coulomb energies, both distance-dependent, must be important. The on-site energy difference (“charge transfer” energy ) of a reference state (the high symmetry structure) is important in determining the character of the Wannier functions, and Hund’s rule energy is a relevant factor.
Setting up and carrying out fruitful modeling is a task for the future. A fundamental question remains: why does a given charge state – occupation of a specific type of Wannier orbitals – lead to a reasonably well defined ionic radius, rather than a continuum depending on the environment – why are ionic radii ‘quantized?’ More broadly stated: why does the conventional charge state picture function so usefully, when (or ) charge is not involved – both cation and anion charges are unchanged?[54] An understanding of “charge ordering” transitions may require an answer to this question.
9 Acknowledgments
The authors have benefited from discussions with a number of colleagues, notably P. B. Allen, D. Khomskii, and P. Kalifah. This work was supported by National Science Foundation award DMR-1207622-0.
References
- [1] E. J. W. Verwey, Nature 144, 327 (1939).
- [2] The distinction may be one of time scale of electron hopping between Fe sites, which will be reflected in the magnitude of the resistivity in the conducting phase.
- [3] Y. Quan, V. Pardo, and W. E. Pickett, Phys. Rev. Lett. 109, 216401 (2012).
- [4] G. Parkin, J. Chem. Educ. 83, 791 (2006).
- [5] D. W. Smith, J. Chem. Educ. 82, 1202 (2005).
- [6] M. Jansen and U. Wedig, Angew. Chem. Int. Ed. 47, 10026 (2008).
- [7] P. Ball, Chemistry World 6, January 8, 2009. DOI:10.1002/anie.200803605
- [8] I. D. Brown, The Chemical Bond in Inorganic Chemistry: The Bond Valence Model. (Oxford University Press, Oxford, U.K., 2002).
- [9] R. D. Shannon and C. T. Prewitt, Acta Cryst. B 25, 925 (1969).
- [10] R. Pietig, R. Bulla, and S. Blawid, Phys. Rev. Lett. 82, 4046 (1999).
- [11] C. S. Hellberg, J. Appl. Phys. 89, 6627 (2001).
- [12] S. K. Mishra, R. Pandit, and S. Satpathy, J. Phys.: Condens. Matt. 11, 8561 (1999).
- [13] S.-B. Lee, R. Chen, and L. Balents, Phys. Rev. B 84, 165119 (2011).
- [14] I. I. Mazin, D. I. Khomskii, R. Lengsdorf, J. A. Alonso, W. G. Marshall, R. M. Ibberson, A. Podlesnyak, M. J. Martıńez-Lope, and M. M. Abd-Elmeguid, Phys. Rev. Lett. 98, 176406 (2007).
- [15] H. Uchigaito, M. Udagawa, and Y. Motome, J. Phys. Soc. Jpn. 80, 044705 (2011).
- [16] M. A. Ball, J. Phys. C 8, 3328 (1975)
- [17] M. A. Ball, J. Phys. C 10, 4921 (1977).
- [18] R. Resta, Rev. Mod. Phys. 66, 899 (1994).
- [19] R. D. King-Smith and D. Vanderbilt, Phys. Rev. B 47, 1651 (1993).
- [20] J. Kunstmann, L. Boeri, and W. E. Pickett, Phys. Rev. B 75, 075107 (2007).
- [21] W.E. Pickett, J. Phys. C 12, 1491 (1979).
- [22] P. H.-L. Sit, R. Car, M. H. Cohen, and A. Selloni, Inorg. Chem. 50, 10259 (2011).
- [23] L. Jiang, S. V. Levchenko, and A. M. Rappe, Phys. Rev. Lett. 108, 166403 (2012).
- [24] K.-W. Lee and W. E. Pickett, unpublished.
- [25] K.-W. Lee and W. E. Pickett, Europhys. Lett. 80, 37008 (2007).
- [26] H. J. Xiang and M.-H. Whangbo, Phys. Rev. B 75, (2007) 052407.
- [27] R. Weht and W. E. Pickett, Phys. Rev. Lett. 880, 2502 (1998).
- [28] D. Volja, W.-G. Yin, and W. Ku, EPL 89, 27008 (2010).
- [29] N. Marzari and D. Vanderbilt, Phys. Rev. B 56, 12847 (1997).
- [30] N. Marzari, A. A. Mostofi, J. R. Yates, I. Souza, D. Vanderbilt, Rev. Mod. Phys. 84, 1419 (2012).
- [31] W. Ku, H. Rosner, W. E. Pickett, and R. T. Scalettar, Phys. Rev. Lett. 89, 167204 (2002).
- [32] The density functional based linearized augmented plane wave code wien2k[33] has been used in our calculations, where we have applied correlation corrections (LDA+U) as is usually necessary to describe oxides. Computational methods are as described in Ref. [34].
- [33] K. Schwarz and P. Blaha, Comp. Mat. Sci. 28, 259 (2003).
- [34] V. Pardo and W. E. Pickett, Phys. Rev. B 84, 115134 (2011).
- [35] V. I. Anisimov, J. Zaanen, and O. K. Andersen, Phys. Rev. B 44, 943 (1991).
- [36] E. R. Ylvisaker, K. Koepernik, and W. E. Pickett, Phys. Rev. B 79, 035103 (2009).
- [37] J.L. García-Muñoz, J. Rodríguez-Carvajal and P. Lacorre, Physica B 180, 306 (1992).
- [38] J. B. Torrance, P. Lacorre, and A. I. Nazzal, E. J. Ansaldo, Ch. Niedermayer Phys. Rev. B 45 8209 (1992).
- [39] U. Staub, G. I. Meijer, F. Fauth, R. Allenspach, J. G. Bednorz, J. Karpinski, S. M. Kazakov, L. Paolasini, and F. d’Acapito, Phys. Rev. Lett. 88, 126402 (2002).
- [40] C. Piamonteze, H. C. N. Tolentino, A.Y. Ramos, N. E. Massa, J. A. Alonso, M. J. Martıńez-Lope, and M. T. Casais, Phys. Rev. B 71, 012104 (2005).
- [41] M. Medarde, C. Dallera, M. Grioni, B. Delley, F. Vernay, J. Mesot, M. Sikora, J. A. Alonso, and M. J. Martıńez-Lope, Phys. Rev. B 80, 245105 (2009).
- [42] A.Y. Ramos, C Piamonteze, H. C. N. Tolentino, N. M. Souza-Neto, O. Bunau, Y. Joly, S. Grenier, J.-P. Itié, N. E. Massa, J. A. Alonso, and M. J. Martinez-Lope, Phys. Rev. B 85, 045102 (2012).
- [43] M. Takano, S. Nasu, T. Abe, K. Yamamoto, S. Endo, Y. Takeda, and J. B. Goodenough, Phys. Rev. Lett. 67, 3267 (1991).
- [44] J. B. Yang, M. S. Kim, Q. Cai, X. D. Zhou, H. U. Anderson, W. J. James, and W. B. Yelon, J. Appl. Phys. 97, 10A312 (2005).
- [45] J.-L. Hodeau and M. Marezio, J. Solid State Chem. 23, 253 (1978).
- [46] A. S. Botana, V. Pardo, D. Baldomir, A.V. Ushakov, and D. I. Khomskii, Phys. Rev. B 84, 115138 (2011).
- [47] E. Wawrzynska, R. Coldea, E. M. Wheeler, I. I. Mazin, M. D. Johannes, T. Sörgel, M. Jansen, R. M. Ibberson, and P. G. Radaelli, Phys. Rev. Lett. 99, 157204 (2007).
- [48] E. Wawrzynska, R. Coldea, E. M. Wheeler, T. Sörgel, M. Jansen, R. M. Ibberson, P. G. Radaelli, and M. M. Koza, Phys. Rev. B 77, 094439 (2008).
- [49] J. A. McMillan, J. Inorg. Nucl. Chem. 13, 28 (1960).
- [50] M. Jansen and P. Fischer, J. Less-Common Met. 137, 123 (1988).
- [51] J. P. Allen, D. O. Scanlon, and G. W. Watson, Phys. Rev. B 81, 161103(R) (2010).
- [52] J. P. Allen, D. O. Scanlon, and G. W. Watson, Phys. Rev. B 84, 115141 (2011).
- [53] J. García and G. Subías, J. Phys.: Condens. Matt. 16, R145 (2004).
- [54] In truth, there is some spread in a given ion’s ‘ionic radius’ in different compounds, but approximate quantization is observed.