The TeV blazar Markarian 421 at the highest spatial resolution
Abstract
Context. High-resolution radio observations allow us to directly image the innermost region of Active Galactic Nuclei (AGN). The Very Long Baseline Array (VLBA) data analyzed in this paper were obtained during a multiwavelength (MWL) campaign, carried out in 2011, from radio to Very High Energy (VHE) gamma rays, on the TeV blazar Markarian 421 (Mrk 421).
Aims. Our aim was to obtain information on the jet structure in Mrk 421 during the MWL campaign at the highest possible angular resolution and with high temporal frequency observations, in order to compare structural and flux density evolution with higher energy variations.
Methods. We consider data obtained with the VLBA at 43 GHz through two sets of observations: one is part of a dedicated multi-frequency monitoring campaign, in which we observed Mrk 421 once a month from January to December 2011 at three frequencies (see Lico et al. 2012, for the analysis of the 15 and 24 GHz data); the other is extracted from the Boston University monitoring program, which observes 34 blazars at 43 GHz about once per month. We model-fit the data in the visibility plane, study the proper motion of jet components, the light curve, and the spectral index of the jet features. We compare the radio data with optical light curves obtained at the Steward Observatory, considering also the optical polarization information.
Results. Mrk 421 has a bright nucleus and a one-sided jet extending towards the north-west for a few parsecs. The model-fits show that brightness distribution is well described using 6–7 circular Gaussian components, four of which are reliably identified at all epochs; all components are effectively stationary except for component D, at mas from the core, whose motion is however subluminal. Analysis of the light curve shows two different states, with the source being brighter and more variable in the first half of 2011 than in the second half. The highest flux density is reached in February. A comparison with the optical data reveals an increase of the magnitude and of the fractional polarization simultaneous with the enhancement of the radio activity.
Key Words.:
galaxies: active – BL Lacertae objects: individual: Mrk 421 – galaxies: jets1 Introduction
| Observation | Experiment | Map peak | Beam | rms | Notes |
|---|---|---|---|---|---|
| date in 2011 | code | (mJy/beam) | (mas mas, ∘) | (mJy/beam) | |
| Jan 02 | BM303o | 248 | 15.8 | 1.4 | — |
| Jan 14 | BG207a | 293 | , 13.7 | 0.23 | MK |
| Feb 05 | BM303p | 245 | , 16.8 | 0.6 | PT |
| Feb 25 | BG207b | 401 | , 20.3 | 0.27 | MK, NL |
| Mar 01 | BM303q | 281 | , | 0.9 | — |
| Mar 29 | BG207c | 323 | , | 0.23 | — |
| Apr 22 | BM303r | 278 | , | 0.5 | NL |
| Apr 25 | BG207d | 251 | , | 0.24 | NL |
| May 22 | BM303s | 317 | , | 0.8 | BR |
| May 31 | BG207e | 194 | , | 0.23 | BR |
| Jun 12 | BM303t | 214 | , | 0.6 | OV |
| Jun 29 | BG207f | 151 | , | 0.28 | LA |
| Jul 21 | BM303u | 157 | , | 1.0 | — |
| Jul 28 | BG207g | 173 | , 9.9 | 0.23 | MK |
| Aug 23 | BM303v | 203 | , | 0.5 | MK |
| Aug 29 | BG207h | 188 | , | 0.21 | HN |
| Sep 16 | BM303w | 132 | , | 0.9 | — |
| Sep 28 | BG207i | 213 | , 26.9 | 0.28 | MK |
| Oct 16 | BM353a | 214 | , | 0.7 | — |
| Oct 29 | BG207j | 207 | , | 0.21 | — |
| Nov 28 | BG207k | 260 | , | 0.20 | FD |
| Dec 02 | BM353b | 179 | , | 0.7 | — |
| Dec 23 | BG207l | 248 | , | 0.38 | FD, HN |
The TeV blazar Markarian 421 (Mrk 421, and , J2000) is a high synchrotron peaked (HSP) BL Lacertae object at , making it one of the closest BL Lacs in the sky. The spectral energy distribution (SED) of this object shows two peaks (Abdo et al. 2011): a low-frequency peak due to synchrotron emission from relativistic electrons in the jet, and a high-frequency peak probably due to inverse Compton scattering between the same population of relativistic electrons and the synchrotron radiation produced by themselves (Synchrotron Self Compton, SSC, model).
Mrk 421 is optically identified with a very bright elliptical galaxy with a non-thermal and highly polarized component of radiation from the nuclear region (Ulrich et al. 1997); it also shows high optical variability (Tosti et al. 1998) with two types of behaviour: variability on short time scales from days to hours, and variability on longer time scales of about 23 years.
Mrk421 was the first extragalactic source convincingly detected in very high energy (VHE, 0.1 TeV) gamma rays (by the 10 m Cherenkov Telescope at the Whipple Observatory, Punch et al. 1992). It is one of the brightest blazars at X-ray energies, and was one of the few BL Lacs detected by EGRET (Lin et al. 1992). As a result, Mrk 421 has been intensively studied and it has also shown very rapid -ray variability on different timescales, from days (Buckley et al. 1996) to 15 minutes (Gaidos et al. 1996), suggesting that the region responsible for VHE emission must be very small. This has led to the expectation of extreme values of the Doppler factor, but radio data analysed in previous works did not provide evidence for superluminal motion of jet components (Piner et al. 1999, 2010; Giroletti et al. 2006).
In this context, and after a first large multi-wavelength campaign organized in the Fermi era (Abdo et al. 2011), we set up a VLBA multi-frequency campaign to observe Mrk421 at 15, 24, and 43 GHz, in full polarization, once per month during 2011, to complement efforts carried out at various observatories at higher energies. In Lico et al. (2012, hereafter Paper I), we reported an analysis of the 15 and 24 GHz data. The results of this work show that at these frequencies the structure of Mrk 421 results dominated by a compact (0.13 mas) and bright nucleus, characterized by a flat spectral index (), with a one-sided jet detected out to 10 mas, that presents steeper spectral index (). Model-fitting of the source is well described by 5-6 components that are consistent with being stationary during this period, while the flux density analysis shows significant variations for the core, which is brighter during the first part of 2011. The observational properties suggest that the jet bulk velocity could be different between the radio and the high-energy emission regions: under a small viewing angle (), the inferred high energy and radio Doppler factors are respectively and 14 and 3).
In this paper, we focus on the 43 GHz data, which of all astronomical bands provide the best angular resolution achievable with a regular cadence. In addition, we consider data from the Boston University blazar monitoring project to sample the evolution of the radio jet with even higher cadence. We note that several more detailed publications are in preparation about the results of the multiwavelengthm (MWL) campaign; here we provide a first simple comparison between high resolution radio observations and optical data.
Wang et al. (2004) estimated the mass of the central supermassive black-hole in Mrk 421 using the relation between the mass and the velocity dispersion, obtained by the broadening of line, and they deduced . Considering that our VLBA images achieve an angular resolution of mas, in this paper we will focus on structures of the order of about Schwarzschild radii.
The paper is organized as follows: in Sect. 2 we describe the data used for model-fitting and for the MWL study; in Sect. 3 we present our results obtained by model-fitting, flux density analysis, and the MWL study. In Sect. 4 we discuss the astrophysical implications of the results and we present our conclusions in Sect. 5.
We adopt the following cosmological parameters for a flat universe: , , (Spergel et al. 2003). Then for , we obtain a linear scale of 0.593 pc/mas. The spectral index is defined such that .
2 Observations
2.1 Radio data


In this paper, we consider two datasets obtained with the VLBA at 43 GHz. The main one consists of 12 observations obtained once a month throughout 2011. At each epoch the source was observed for a net observing time of little more than 4 hours, distributed evenly over 8 hours. We observed three calibration sources: J0927+3902, J1310+3220, and J0854+2006 that we also used to check the amplitude calibration. The output signal from the correlator was divided into four IF with bandwidth of 16 MHz, each split into 32 channels with separations of 500 kHz. Phase and amplitude calibration of the fringe visibilities has been done with the AIPS 111http://www.aips.nrao.edu/index.shtml software package, while self-calibration procedures and imaging has been performed with Difmap Shepherd et al. 1994, 1995) software package.
In addition to the main dataset, we also include other VLBA observations at 43 GHz of Mrk 421 for a more detailed study of the source structure. These data (11 epochs in total) were provided by the Boston University blazar group222http://www.bu.edu/blazars/VLBAproject.html and belong to their monitoring program of gamma-ray blazars, which observes 34 blazars at 43 GHz about every once per month with the VLBA. These observations are characterized by shorter time duration: the total observation time for the source is about 40 minutes for each epoch, so the -plane coverage is more sparse and the sensitivity lower than in the main 43 GHz dataset.
Table 1 reports some useful information such as the size of the beam, the final rms noise, and antennas affected by significant failures at each observation. The two experiment codes, BG207 and BM303/BM353, denote that observations belong to the broadband campaign or to the Boston University program, respectively.
2.2 Optical data
For the MWL comparison, we consider optical data obtained at the Steward Observatory of Arizona University333http://james.as.arizona.edu/~psmith/Fermi/#mark2. The Steward Observatory monitors the optical linear polarization of a blazar sample using the SPOL CCD Imaging/Spectropolarimeter, and it yields also measurements of the brightness and spectral index of the optical synchrotron light (see Smith et al. 2009, for an overview of the optical program).
For Mrk 421, we consider observations between 2011 Jan 2 (MJD 55563) and 2011 Dec 31 (MJD 55926), characterized by the uneven coverage typical of optical observations. In total, we have useful data for magnitude (41 data points), and information about polarization percentage and position angle (49 points).
3 Results
3.1 Images
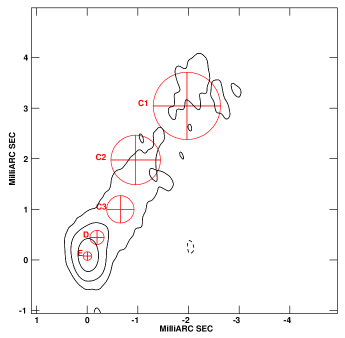
Figure 1 shows two sample images of the source, one from the main dataset and one from the Boston University data (in the left and right panel, respectively). We obtained the clean images with Difmap and produced the final contour plots with AIPS. The maps of Mrk 421 reveal a bright and variable core: the mean peak brightness is mJy beam-1 at 43 GHz, and the standard deviation is mJy beam-1, suggesting significant scatter in the core brightness. A collimated one-sided jet extends on a scale of few parsecs towards the north-west; the position angle (PA) of the jet is about for mas ( pc).
Lower frequency maps of Mrk421 from the literature (e.g. Giroletti et al. 2006; Piner et al. 1999; Giovannini et al. 1999), show a bright and collimated jet extending up to about 20 pc, which then widens and becomes fainter, also showing bending and diffuse emission on a scale of about 100 mas. Our higher frequency, hence higher resolution, images provide a better view of the innermost region, the closest one to the central black hole. We obtain a better estimate of the core size and flux density, and reveal finer details of the transverse structure, such as the brightness asymmetry at 1 mas from the core, where the western limb is slightly brighter than the eastern one. Such details are in agreement and lend support to the finding of previous, lower sensitivity, images of the source at the same frequency (Piner et al. 1999, 2010).
3.2 Model-fit
The model-fit technique, executed with Difmap, allows us to describe the brightness distribution of the source using a few simple components. Analyzing the components found from epoch to epoch we can determine their apparent proper motion. We consider both our main dataset and the additional 43 GHz VLBA data, provided by Boston University, in order to have more constraints for the identification of components from epoch to epoch. However, the latter observations are characterized by short time durations, so the model-fit procedure is only sensitive to the main features of the source.
For both datasets we used a point source (delta function) to describe the central region of the core, which we assume to be stationary, while the jet was fitted with circular Gaussian components. We show in Table LABEL:tab:dati_model-fit the parameters resulting from the model-fit procedure, epoch by epoch: the total flux density , the distance from the core in polar coordinates and , and the component size . We estimate flux density uncertainties considering both a calibration error of about 10% and a statistical error given by the rms of the map. Position errors were estimated according to the formula: where was calculated considering that each component is a circular Gaussian component, finally getting: . For each epoch there are some very bright components smaller than the beam size (they are not resolved), whose nominal uncertainties as a result are too small, so the error value is set equal to 10% of the beam size. There are also some very faint extended components, whose S/N ratio is less than 3. In this case the uncertainty is calculated by the formula , where is the number of times that the beam is included in the full width at half maximum (FWHM) of the component.
Overall, we obtain a good description of Mrk 421 with 6 or 7 components; comparing model-fit results of both datasets we note a good agreement with exception of the farthest component. This is not surprising, given the shorter duration of the runs in the BM303/BM353 series. In particular, by analysing the position with respect to the core and the flux density of each component from epoch to epoch, we identified across epochs five components in addition to the core (see Fig. 2). Comparing our data with the 15 and 24 GHz datasets, analysed in Paper I, we find a good agreement in the outer part of the jet, at 1 mas from the core, both in position and flux density (taking into account the spectral index of the components). Therefore we label the components in this region in the same way, i.e., with C1, C2 and C3. We note however that component C2 is barely detected at 43 GHz, consistent with its low flux density (a few mJy) and steep spectrum () at 15 and 24 GHz (see Paper I, ). Components within 1 mas of the core are difficult to interpret and identify, even if we compare them with components identified in Paper I. Indeed, the spatial frequencies accessible at 43 GHz allow us to describe the brightness distribution of the innermost region by a larger number of Gaussian components than the lower resolution data. We thus introduce two new components, labelled D and E, the first of which is identified only from February to August and it is usually placed between 0.3 and 0.5 mas from the core, while the second is the closest to the core (0.1 mas).
Analysing the parameters obtained for the components, it is interesting to note that components farther than 0.4 mas from the core moslty have PAs between and , while the closest components have quite variable PAs. In general, this is not too surprising, since the polar angle is more variable at small radii. However, the behaviour of component E is particularly remarkable: its PA is systematically off the main jet axis, positioning mainly to the north-east with respect to the core (PA). This suggests that there is a bending of the jet in the region closest to the core (0.5 mas from the core), with the jet emerging towards the north-east and then changing direction to the north-west. This characteristic was also observed in the same component by Piner et al. (1999, 2010), as well as in other BL Lac objects on similar angular scales, (e.g. in Mrk 501, Giroletti et al. 2004). We further note that Mrk 421 itself shows several PA changes out to the kiloparsec scale radio emission (Giroletti et al. 2006).
3.3 Apparent speed
The identification of the components from epoch to epoch is important for studying their motion with respect to the core, which is considered to be the stationary reference point of our frame. We have calculated the apparent speed of these components during 2011 making a linear fit of the separation from the core of identified components over the observation time range. For C1 we have fitted only our BG207 campaign VLBA data, while for C3, D and E we used both our VLBA data and the Boston University observations. Table 2 shows results of linear fits to the data.
| Apparent speed | |||
|---|---|---|---|
| Component | mas/yr | ||
| C1 | |||
| C3aafootnotemark: a | |||
| C3bbfootnotemark: b | |||
| D | |||
| E | |||

The resulting apparent speeds suggest that components C1 and E do not have significant proper motions — they are consistent with being stationary and their apparent speeds would be at most a few times . Component D has a subluminal proper motion at the 5.8 level (). We consider two scenarios for C3, using two different datasets. This is necessary because the identification of C3 in the January and February data of the Boston University observations (indicated by C3* in Table LABEL:tab:dati_model-fit) is less secure, since its separation from the core is not consistent with the one measured in the BG207 series in the same months. The results obtained through the two linear fits are indicated in Table 2 with superscripts a and b. The first linear fit, indicated by C in Table 2, includes the January and February data from the Boston University observations; in this case we see that C3 seems to move towards the core with a subluminal speed with a significance of about 3. The second linear fit (C) excludes C3* data and we obtain an apparent speed of , which is consistent with no motion.
3.4 Radio flux density analysis
Analysing the trend of radio flux density at the various epochs, it emerges that the more external components, C1, C2, C3 and D are the faintest components, and they do not show significant variations. A few outliers occur for each of them but these are more likely to be statistical fluctuations due to model-fit artefacts on faint and extended features.
On the other hand, the model-fit results on the most compact components, and the image peak itself, suggest that the core is genuinely variable. Thus, for the sake of uniformity, we convolved the 23 images with a circular beam with a radius of 0.3 mas, which is a conservative representation of the beam for VLBA data at 43 GHz. After this procedure we analyse the trend of map peak brightness through the 23 epochs, that we show in Figure 4 (top panel). Although there is a large scatter from epoch to epoch, we clearly see two different behaviours throughout 2011. During the first part of the year, the peak goes through a phase of variability and enhanced brightness; it increases and reaches a peak value in February (MJD 55617), then it decreases until July. In the second part of the year, from July to December, the overall behaviour of the peak brightness shows a lower level of activity and a more regular trend, with a slow increase of the brightness.
The bottom panel in Figure 4 shows that the light curves for the core and component E largely overlap and intersect each other. These two components are the brightest features in Mrk 421 and they are responsible for most of the total flux density of the source; since most of the flux density is collected within a radius of about 0.3 mas from the core, we confirm that Mrk 421 is a strongly core-dominated source. The overlap between the two light curves also suggests that the core and component E (whose separation is about one beam size) are really the same, slightly extended feature undergoing a single dissipation process.

3.5 Multiwavelength observations
At higher energies, Mrk 421 is a highly variable blazar; it has shown different episodes of dramatic flares since it was observed, among which one of the brightest X-ray and VHE flares ever seen in February 2010 (Isobe et al. 2010; Shukla et al. 2012) and an even brighter, recent one in March/April 2013 (e.g. Cortina & Holder 2013; Paneque et al. 2013). Comparing multiwavelength observations is interesting for studying the origin of the radiation and the size of emission region and eventually understanding not only the mechanisms that lead to the jet formation, but also the relation between jets, central black hole and accretion disk.
Indeed, the radio data presented in this paper and in Paper I are obtained in the framework of a large project, which involves multi-epoch and multi-instrument observations at different bands: in the sub-mm (SMA), optical/IR (GASP), UV/X-ray (Swift, RXTE, MAXI), -rays (Fermi-LAT, MAGIC, VERITAS), and at cm wavelengths (e.g., F-GAMMA, Medicina). While a series of dedicated papers are in preparation, we report here some first basic findings based on the correlated analysis of our radio data and the optical data from the Steward Observatory.
As we saw previously, 43 GHz emission during 2011 shows a peak in February observation (MJD 55617) and variability throughout the first half of the year: data show that the flare seems to have a duration of about days (from MJD to MJD ), corresponding to an emission region of about , or 0.13 pc, considering the causality argument which implies the size of emission region must be . The flare could be somewhat longer since we do not consider data before 2011 January 2. However, during the second part of 2011 Mrk 421 does not show any flares; the total flux density has a minimum in July (MJD 55764), then it slightly increases until the end of 2011.

In Figure 5 we show optical data (V magnitude, polarization percentage and angle) and radio brightness of the map peak during 2011. Comparing radio to optical data we see that radio peak is almost simultaneous with an optical peak (MJD 55624). It is interesting to note that just before the enhanced activity, from MJD 55594 to MJD 55600, the V magnitude decreases, the associated polarization angle has a wide scatter of about , and the polarization percentage is very low (1–2%); while during the flare the polarization percentage reaches values of about 7% and the polarization angle has a very small scatter, of about .
It is also interesting to note that the public high energy data by Fermi555http://fermi.gsfc.nasa.gov/ssc/data/access/lat/msl_lc/source/Mrk_421 show a similar behaviour during 2011 when compared with our data. During the period between MJD 55550 and MJD 55950, the -ray light curve reveals an enhanced activity in the first part of the year, in agreement with our results in the radio and optical bands. However, we remind that a dedicated -ray analysis and much more detailed MWL study are in preparation.
4 Discussion
4.1 Comparison with 15 and 24 GHz data
We compare our 43 GHz results with the 15 and 24 GHz data, analyzed in Paper I, belonging to the same monitoring campaign. Images confirm the same structure on the parsec-scale: a dominant central compact nucleus, from which a one-sided jet extends towards north-west, with a PA of about .
The difference is angular resolution, which increases going to higher frequencies, as we can see from the beam size: for January observation we obtain mas at 15 GHz, mas at 24 GHz and mas at 43 GHz. This is also clearly visible in the model-fit results. At 15 GHz we need five Gaussian components, while the 24 GHz data are well described by six Gaussian components. In Paper I, we pointed out that the second innermost 15 GHz component splits into two components at 24 GHz because of the higher angular resolution. At 43 GHz the brightness distribution is well described by six or seven components: we further resolve and better constrain the inner features, while we become less sensitive to the more extended regions, like C2, which are also depressed due to their steep spectrum nature.
We also find good agreement between the 43 and the 15 and 24 GHz datasets in terms of apparent motions, with linear fits to 15, 24, and 43 GHz data always yielding low values for apparent speeds. In particular, our findings are fully consistent with those of Paper I for component C1 and a good match is also found for C3 if we consider our C3 result. Moreover, our results are also in agreement with the most recent MOJAVE 15 GHz VLBA measurements (Lister et al. 2013).
Analysing flux densities we note similar light curves at all three radio-frequencies, with highest values in the first half of 2011; the maximum is reached somewhat earlier at 43 GHz, with a prominent peak in February, while at the lowest frequencies the values of February and March are quite similar. The overall variability also increases with frequency, as seen by the values of the modulation index (e.g. Richards et al. 2011):
Indeed, the modulation index calculated for the image peak rises from to . The effect would become even larger if the total flux density were considered, since the extended and less variable components are more prominent at lower frequencies. This is clearly visible from the spectral index value. We estimate an average spectral index both for the innermost region ( 1 mas from the core) and for the external region ( 1 mas from the core), by fitting a power law to the mean flux density at three radio frequencies. We find for the innermost region, and for the outermost region. The relatively large uncertainties derive from the somewhat crude assumption of a power law, since some spectral curvature is present, in particular in the core.
4.2 Proper motion and Doppler factor
Our results lend further support to the growing evidence of lack of superluminal motions in VHE blazars in general, and in Mrk 421 in particular. Besides the present work and Paper I, other studies on Mrk 421 have shown jet components with subluminal speeds (Piner et al. 1999, 2005, 2010). A recent work has reported inward radial motion for one component soon after the large X-ray flare of Mrk 421 occurred in 2010 mid-February (Niinuma et al. 2012). In the latter work, the authors propose that the inward component motion is actually due to a shift of the centroid of the core component following the ejection of an unresolved superluminal component. This is not the case for our component C3. Therefore, it could indicate that superluminal components, if any, tend to be detected soon after giant flares rather than in quiescent states. On the other hand, we can calculate the distribution of the linear velocity estimated from any set of four consecutive measurements of the C3 position in our campaign. It turns out that 5/18 sets () yield a negative velocity as large as that reported by Niinuma et al. (2012). Although this does not rule out the previous hypothesis, it nonetheless highlights how components wander around the line of best fit, and that it can be risky to extrapolate apparent short-term motions too far.
In any case, the lack of superluminal motions on -yr timescale for all components remains somewhat surprising for blazars which showing high variability at TeV energies. Such variability and the presence of VHE emission itself require quite a high Doppler factor, , to avoid suppression of -ray emission region through pair production. Various works show how is naturally required in quiescent states, and even higher values are needed during rapid variability events (Gaidos et al. 1996; Albert et al. 2007; Donnarumma et al. 2009; Abdo et al. 2011). In the radio band, Mrk 421 shows a one-sided jet structure and a large core dominance value, which, as widely discussed in the literature, imply it is subject to mild relativistic boosting effects, with a few. Thus, even though the jet is likely to be relativistically boosted in both bands, completely different levels of boosting are typically required. We refer to Paper I for a detailed discussion of the proper motion, jet velocity, viewing angle, and Doppler factor estimate (Sects. 3.5, 3.6, and 4) and briefly highlight below the main implications of the results from our campaign.
-
•
The consistent values found at 15, 24, and 43 GHz for the polar coordinates and the sensible spectral behaviour of each jet component suggests that they provide a well defined description of the jet structure; however, they are much less prominent features than the typical bright, compact knots found in flat spectrum radio quasars (FSRQ).
-
•
None of the components in Mrk 421 shows apparent superluminal proper motion, again in sharp contrast to the behaviour of many FSRQs and apparently at odds with various constraints on the Doppler factor in Mrk 421 itself.
- •
-
•
The fact that the pattern speed is generally not a good representation of the bulk speed is generally accepted also for more powerful blazars; however, in those sources components moving at close to the bulk speed are detected occasionally if long enough monitoring projects are carried out; the fact that in over 17 years of VLBI monitoring not one single component has been seen in Mrk 421 travelling at very large velocity suggests that the plasma is probably not moving at highly relativistic bulk speeds in the radio jet.
-
•
The jet bulk velocity structure is complex, with different values for the gamma-ray and the radio emitting regions, either along or across the jet; in the latter case, we could have a spine-layer model, with the jet transversally structured with respect to its axis and consisting of an inner spine, characterized by higher velocity and the outer layer, which decelerates because of interaction with external medium, proceeding more slowly.
-
•
In support of the presence of a velocity structure across the jet axis, our images show evidence of a transversally resolved brightness structure (see Fig. 1). Giroletti et al. (2006) suggest a limb-brightening structure in Mrk 421 at distances down to 2 mas from the core, while Piner et al. (2010) argue evidence of limb-brightening structure on smaller scale, at least 0.25 mas from the core.
-
•
All the evidence for complex velocity structures in the VLBI jet of Mrk 421 and other sources implies that many of the estimates of jet emission parameters from high-energy SSC modeling that used one-zone homogeneous sphere models are likely to be over-simplifications.
4.3 Variability and multi-frequency analysis
Whereas Mrk 421 has shown dramatic variability in the X-ray and VHE bands, it has traditionally been quite stable at radio frequencies. Therefore, our finding of an enhanced variability in the first half of 2011 is quite remarkable. Even more, the source has then shown a dramatic radio flare at 15 GHz in September 2012, with an increase of approximately 2.5 times well fit by an exponential curve with a doubling time of 9 days (Hovatta et al. 2012). No new jet knots have appeared in our VLBA images after the February 2011 peak, showing that the cooling is very efficient and takes place within the 43 GHz beam.
A further interesting piece of information comes from the comparison of the radio and optical data (see Fig. 5) and in particular of the optical polarization. We observe an increase of the polarization fraction during the radio and optical flare, associated to a remarkably small () scatter of the electric vector position angle (EVPA). This suggests that the flare is associated with the transition from a chaotic and turbulent magnetic field in the emission region to a more ordered state, that is responsible for optical and radio luminosity increase. The near simultaneity of the optical and radio flares indicates that optical and radio emission region are co-spatial and given the light curves of the radio components we can constrain it to be within cm.
Later in the year, the optical emission continues to be variable but it never reaches again the same value of optical magnitude () and percentage polarization (). The discussion of the optical and MWL behaviour of the source in 2011 will be the subject of future papers.
5 Conclusions
The new results presented and discussed in this paper provide both strong support of previous discoveries on TeV blazar jets as well as some new interesting findings. We confirm the presence of a limb-brightened jet structure near the radio core region, the lack of a high velocity proper motion, and the absence of bright substructures (knots) in the jet. We note that in FSRQs fast proper motions have been measured in bright knots or substructures present in radio jets. The uniform brightness of the Mrk 421 jet not only prevents a reliable proper motion measure but suggests a physical difference between jets in FSRQ and BL Lac sources.
In addition, thanks to the high observing frequency and the dense time sampling, we have a sharp view on the inner core which provides evidence of significant and somewhat unexpected variability in the core region. Such variability presents an intriguing correlation with the optical behaviour of the source in optical magnitude and percentage polarization, hinting at a significant evolution of the magnetic field playing an important role in the emission process.
We anticipate that further insight into the physics of Mrk 421 and of TeV blazars in general will be obtained from the analysis of the VLBA polarimetry data and from the dedicated time and spectral study of the whole broadband (radio to gamma rays) 2011 campaign. These works will also provide a reference for the analysis of MWL data from recent and unprecedented flaring episodes across the whole electromagnetic spectrum (Hovatta et al. 2012; Cortina & Holder 2013; Paneque et al. 2013).
Acknowledgements.
This work is based on observations obtained through the BG207, BM303, and BM353 VLBA projects, which make use of the Swinburne University of Technology software correlator, developed as part of the Australian Major National Research Facilities Programme and operated under licence (Deller et al. 2011). The National Radio Astronomy Observatory is a facility of the National Science Foundation operated under cooperative agreement by Associated Universities, Inc. We acknowledge financial contribution from grant PRIN-INAF-2011. This research is partially supported by KAKENHI (24540240). K.V.S. and Y.Y.K. are partly supported by the Russian Foundation for Basic Research (project 11-02- 00368 and 12-02-33101), and the basic research program “Active processes in galactic and extragalactic objects” of the Physical Sciences Division of the Russian Academy of Sciences. Y.Y.K. is also supported by the Dynasty Foundation. The research at Boston University was supported in part by NASA through Fermi grants NNX08AV65G, NNX08AV61G, NNX09AT99G, NNX09AU10G, and NNX11AQ03G, and by US National Science Foundation grant AST-0907893. This study makes use of 43 GHz VLBA data from the Boston University gamma-ray blazar monitoring program (http://www.bu.edu/blazars/VLBAproject.html), funded by NASA through the Fermi Guest Investigator Program. Data from the Steward Observatory spectropolarimetric monitoring project were used. This program is supported by Fermi Guest Investigator grants NNX08AW56G, NNX09AU10G, and NNX12AO93G.References
- Abdo et al. (2011) Abdo, A., Ackermann, M., Ajello, M., et al. 2011, ApJ, 736, 131
- Albert et al. (2007) Albert, J., Aliu, E., Anderhub, H., et al. 2007, ApJ, 663, 125
- Buckley et al. (1996) Buckley, J.H., Akerlof, C.W., Biller, S., et al. 1996, ApJ, 472, 9
- Cortina & Holder (2013) Cortina, J. & Holder, J. 2013, ATel, 4976, 1
- Donnarumma et al. (2009) Donnarumma, I., Vittorini, V., Vercellone, S., et al. 2009, ApJ, 691, L13
- Gaidos et al. (1996) Gaidos, J. A., Akerlof, C. W., Biller, S., et al. 1996, Nature, 383, 319
- Giovannini et al. (1999) Giovannini, G., Feretti, L., Venturi, T., et al. 1999, ASPC, 159, 439
- Lico et al. (2012) Lico, R., Giroletti, M., Orienti, M., et al. 2012, A&A, 545, A117
- Lin et al. (1992) Lin, Y. C., Bertsch, D. L., Chiang, J., et al. 1992, ApJ, 401, L61
- Giroletti et al. (2004) Giroletti, M., Giovannini, G., Feretti, L., et al. 2004, ApJ, 600, 127
- Giroletti et al. (2006) Giroletti, M., Giovannini, G., Taylor, G.B., et al. 2006, ApJ, 646, 801
- Hovatta et al. (2012) Hovatta, T., Richards, J. L., Aller, M. F., Aller, H. D., Max-Moerbeck, W., Pearson, T. J., & Readhead, A. C. S. 2012, ATel, 4451, 1
- Isobe et al. (2010) Isobe, N., Sugimori, K., Kawai, N., et al. 2010, PASJ, 62, L55
- Lister (1999) Lister, M. L. 1999, Ph. D. Thesis, Boston University
- Lister et al. (2013) Lister, M. L., Aller, M. F., Aller, H. D., et al. 2013, AJ submitted
- Niinuma et al. (2012) Niinuma, K., Kino, M., Nagai, H., et al. 2012, ApJ, 759, 84
- Paneque et al. (2013) Paneque, D., et al. 2013, ATel, 4977, 1
- Piner et al. (1999) Piner, B.G., Unwin, S.C., Wehrle, A.E., et al. 1999, ApJ, 525, 176
- Piner et al. (2005) Piner, B.G., & Edwards, P.G., 2005, ApJ, 622, 168
- Piner et al. (2010) Piner, B.G., Pant, N. & Edwards, P.G., 2010, ApJ, 723, 1150
- Punch et al. (1992) Punch, M., Akerlof, C.W., Cawley, M.F., et al. 1992, Nature, 358, 477
- Richards et al. (2011) Richards, J. L., Max-Moerbeck, W., Pavlidou, V., et al. 2011, ApJS, 194, 29
- Shukla et al. (2012) Shukla, A., Chitnis, V.R., Vishwanath, P.R., et al. 2012, A&A, 541, 140
- Smith et al. (2009) Smith, P. S., Montiel, E., Rightley, S., et al. 2009, arXiv:0912.3621
- Spergel et al. (2003) Spergel, D. N., Verde, L., Peiris, H. V., et al. 2003, ApJS, 148, 175
- Tavecchio et al. (2001) Tavecchio, F., Maraschi, L., Pian, E., et al. 2001, ApJ, 554, 725
- Tosti et al. (1998) Tosti, G., Fiorucci, M., Luciani, M., et al. 1998, A&A, 339, 41
- Ulrich et al. (1997) Ulrich, M., Maraschi, L., & Urry, C. M., 1997, ARA&A, 35, 445
- Wang et al. (2004) Wang, J. M., Luo, B., Ho, L. C., 2004, ApJ, 615, 9
| Epoch | experiment | Component | ||||||
|---|---|---|---|---|---|---|---|---|
| code | (mJy) | (mJy) | (mas) | (mas) | (∘) | (mas) | ||
| 2011 Jan 02 | BM303o | Core | 95 | 10 | Ref | 0 | Ref | 0 |
| E | 204 | 20 | 0.04 | 0.03 | 0.3 | 0.15 | ||
| – | 25.5 | 3 | 0.49 | 0.05 | 47.1 | 0.42 | ||
| C3* | 8.5 | 1.6 | 1.47 | 0.03 | 41.5 | 0.14 | ||
| C2 | 10.3 | 1.7 | 2.01 | 0.03 | 26.3 | 0.16 | ||
| – | 16.2 | 6.4 | 3.4 | 0.5 | 30.1 | 1.28 | ||
| 2011 Jan 14 | BG207a | Core | 140 | 14 | Ref | 0 | Ref | 0 |
| E | 156 | 15 | 0.04 | 0.03 | 81.7 | 0.11 | ||
| – | 42 | 4 | 0.16 | 0.03 | 22.3 | 0.30 | ||
| – | 12.8 | 1.3 | 0.64 | 0.03 | 36.9 | 0.34 | ||
| C3 | 12.8 | 1.3 | 1.28 | 0.03 | 37.9 | 0.54 | ||
| C1 | 9.8 | 1.4 | 4.23 | 0.14 | 33.9 | 1.41 | ||
| 2011 Feb 05 | BM303p | Core | 194 | 19 | Ref | 0 | Ref | 0 |
| E | 75 | 8 | 0.08 | 0.02 | 53.0 | 0.08 | ||
| D | 21.9 | 2.3 | 0.38 | 0.02 | 25.2 | 0.30 | ||
| – | 4.7 | 1.0 | 0.93 | 0.06 | 40.6 | 0.33 | ||
| C3* | 11.2 | 1.9 | 1.52 | 0.08 | 36.6 | 0.59 | ||
| – | 5.0 | 4 | 3.1 | 0.5 | 30.8 | 1.59 | ||
| 2011 Feb 25 | BG207b | Core | 203 | 20 | Ref | 0 | Ref | 0 |
| E | 224 | 22 | 0.04 | 0.04 | 24.6 | 0.14 | ||
| D | 29 | 3 | 0.31 | 0.04 | 5.2 | 0.33 | ||
| – | 10.5 | 1.1 | 0.69 | 0.04 | 42.3 | 0.38 | ||
| C3 | 14.4 | 1.5 | 1.30 | 0.07 | 35.4 | 0.77 | ||
| – | 2.0 | 0.4 | 2.78 | 0.13 | 46.7 | 0.48 | ||
| C1 | 5.6 | 0.8 | 4.01 | 0.14 | 33.1 | 0.71 | ||
| 2011 Mar 01 | BM303q | Core | 168 | 17 | Ref | 0 | Ref | 0 |
| E | 131 | 13 | 0.06 | 0.03 | 76.3 | 0.07 | ||
| D | 20.2 | 2.2 | 0.36 | 0.03 | 8.1 | 0.17 | ||
| – | 10.0 | 1.3 | 0.53 | 0.03 | 52.4 | 0.30 | ||
| C2 | 10.8 | 2.8 | 1.78 | 0.21 | 32.6 | 0.87 | ||
| – | 14.6 | 3 | 3.54 | 0.17 | 26.0 | 0.91 | ||
| 2011 Mar 29 | BG207c | Core | 189 | 19 | Ref | 0 | Ref | 0 |
| E | 170 | 17 | 0.06 | 0.03 | 37.8 | 0.11 | ||
| D | 27.6 | 2.8 | 0.37 | 0.03 | 18.6 | 0.32 | ||
| – | 6.3 | 0.7 | 0.78 | 0.03 | 35.3 | 0.29 | ||
| C3 | 12.6 | 1.4 | 1.29 | 0.05 | 34.5 | 0.56 | ||
| C1 | 11.8 | 1.6 | 3.98 | 0.11 | 34.9 | 1.20 | ||
| 2011 Apr 22 | BM303r | Core | 127 | 13 | Ref | 0 | Ref | 0 |
| E | 199 | 20 | 0.06 | 0.02 | 28.2 | 0.12 | ||
| D | 33.2 | 3 | 0.36 | 0.02 | 20.8 | 0.33 | ||
| C3 | 15.1 | 2.0 | 1.09 | 0.15 | 33.9 | 0.61 | ||
| C2 | 3.0 | 0.6 | 1.93 | 0.02 | 32.4 | 0.13 | ||
| – | 11.9 | 3 | 3.9 | 0.4 | 36.3 | 1.51 | ||
| 2011 Apr 25 | BG207d | Core | 153 | 15 | Ref | 0 | Ref | 0 |
| E | 97 | 10 | 0.06 | 0.03 | 88.9 | 0.06 | ||
| – | 33 | 3 | 0.13 | 0.03 | 10.6 | 0.13 | ||
| D | 17.3 | 1.8 | 0.38 | 0.03 | 27.4 | 0.28 | ||
| – | 0.8 | 0.8 | 0.80 | 0.07 | 49.6 | 0.47 | ||
| C3 | 11.4 | 1.4 | 1.43 | 0.17 | 31.7 | 0.76 | ||
| C1 | 5.2 | 0.9 | 4.20 | 0.11 | 34.4 | 0.79 | ||
| 2011 May 22 | BM303s | Core | 216 | 22 | Ref | 0 | Ref | 0 |
| E | 148 | 15 | 0.08 | 0.02 | 50.5 | 0.08 | ||
| D | 38.3 | 4 | 0.40 | 0.02 | 14.2 | 0.27 | ||
| C3 | 12.7 | 1.9 | 1.20 | 0.08 | 36.4 | 0.41 | ||
| C2 | 15.2 | 4 | 2.5 | 0.3 | 30.2 | 1.17 | ||
| – | 11.2 | 5 | 4.7 | 0.7 | 32.5 | 1.48 | ||
| 2011 May 31 | BG207e | Core | 116 | 12 | Ref | 0 | Ref | 0 |
| E | 106 | 11 | 0.06 | 0.03 | 20.9 | 0.12 | ||
| D | 15.9 | 1.6 | 0.45 | 0.03 | 18.2 | 0.26 | ||
| C3 | 7.6 | 0.9 | 1.24 | 0.05 | 33.8 | 0.44 | ||
| C2 | 1.9 | 0.5 | 2.34 | 0.10 | 37.1 | 0.46 | ||
| C1 | 5.9 | 1.4 | 4.18 | 0.24 | 36.1 | 1.23 | ||
| 2011 Jun 12 | BM303t | Core | 114 | 11 | Ref | 0 | Ref | 0 |
| E | 116 | 12 | 0.06 | 0.02 | 52.1 | 0.07 | ||
| – | 32.1 | 3 | 0.29 | 0.02 | 14.1 | 0.25 | ||
| – | 10.4 | 1.6 | 0.75 | 0.12 | 38.0 | 0.47 | ||
| C3 | 4.6 | 0.8 | 1.37 | 0.02 | 26.9 | 0.16 | ||
| C2 | 12.1 | 5 | 2.85 | 0.8 | 46.1 | 1.94 | ||
| 2011 Jun 29 | BG207f | Core | 92 | 9 | Ref | 0 | Ref | 0 |
| E | 84 | 8 | 0.07 | 0.02 | 11.7 | 0.12 | ||
| D | 15.5 | 1.6 | 0.41 | 0.02 | 20.4 | 0.23 | ||
| – | 1.9 | 0.3 | 0.63 | 0.02 | 37.3 | 0.00 | ||
| C3 | 10.6 | 1.3 | 1.26 | 0.13 | 35.5 | 0.64 | ||
| C1 | 3.9 | 1.4 | 4.10 | 0.4 | 34.9 | 1.19 | ||
| 2011 Jul 21 | BM303u | Core | 117 | 12 | Ref | 0 | Ref | 0 |
| E | 54 | 5 | 0.09 | 0.03 | 26.1 | 0.08 | ||
| D | 21.7 | 2.4 | 0.41 | 0.03 | 18.5 | 0.22 | ||
| C3 | 9.7 | 2.3 | 1.26 | 0.12 | 30.7 | 0.55 | ||
| – | 4.6 | 1.1 | 2.70 | 0.03 | 30.0 | 0.14 | ||
| – | 18.8 | 5 | 3.97 | 0.27 | 33.6 | 1.17 | ||
| 2011 Jul 28 | BG207g | Core | 118 | 12 | Ref | 0 | Ref | 0 |
| E | 74 | 7 | 0.07 | 0.03 | 6.1 | 0.17 | ||
| D | 18.0 | 1.8 | 0.48 | 0.03 | 24.1 | 0.28 | ||
| C3 | 8.9 | 1.0 | 1.19 | 0.04 | 33.5 | 0.54 | ||
| C2 | 3.9 | 0.8 | 2.19 | 0.16 | 26.0 | 0.98 | ||
| C1 | 5.3 | 1.0 | 3.62 | 0.22 | 33.0 | 1.33 | ||
| 2011 Aug 23 | BM303v | Core | 139 | 14 | Ref | 0 | Ref | 0 |
| E | 76 | 8 | 0.07 | 0.04 | 11.7 | 0.17 | ||
| D | 25.5 | 2.6 | 0.46 | 0.04 | 20.6 | 0.43 | ||
| C3 | 12.4 | 1.4 | 1.27 | 0.06 | 34.4 | 0.59 | ||
| C2 | 2.9 | 0.5 | 2.46 | 0.04 | 58.1 | 0.15 | ||
| – | 12.4 | 2.1 | 4.48 | 0.19 | 32.3 | 1.44 | ||
| 2011 Aug 29 | BG207h | Core | 129 | 13 | Ref | 0 | Ref | 0 |
| E | 72 | 7 | 0.04 | 0.03 | 28.4 | 0.11 | ||
| – | 18.5 | 1.9 | 0.29 | 0.03 | 0.9 | 0.15 | ||
| D | 14.3 | 1.5 | 0.50 | 0.03 | 27.1 | 0.33 | ||
| C3 | 8.7 | 1.0 | 1.23 | 0.07 | 31.4 | 0.56 | ||
| C1 | 6.5 | 1.2 | 4.32 | 0.19 | 36.8 | 1.21 | ||
| 2011 Sep 16 | BM303w | Core | 77 | 8 | Ref | 0 | Ref | 0 |
| E | 69 | 7 | 0.09 | 0.02 | 41.0 | 0.08 | ||
| – | 26.4 | 3 | 0.31 | 0.09 | 23.6 | 0.53 | ||
| C3 | 7.3 | 2.1 | 1.25 | 0.16 | 55.2 | 0.57 | ||
| C2 | 6.5 | 1.2 | 2.16 | 0.05 | 45.6 | 0.27 | ||
| – | 4.6 | 1.0 | 2.78 | 0.02 | 57.6 | 0.00 | ||
| 2011 Sep 29 | BG207i | Core | 124 | 12 | Ref | 0 | Ref | 0 |
| E | 98 | 10 | 0.05 | 0.04 | 4.4 | 0.12 | ||
| – | 25.1 | 2.5 | 0.39 | 0.04 | 19.8 | 0.26 | ||
| – | 8.5 | 0.9 | 0.88 | 0.04 | 30.8 | 0.36 | ||
| C3 | 5.3 | 0.6 | 1.43 | 0.04 | 33.8 | 0.35 | ||
| C1 | 11.5 | 1.6 | 4.49 | 0.16 | 34.8 | 1.56 | ||
| 2011 Oct 16 | BM353a | Core | 150 | 15 | Ref | 0 | Ref | 0 |
| E | 79 | 8 | 0.05 | 0.03 | 31.5 | 0.14 | ||
| – | 36.2 | 4 | 0.31 | 0.03 | 34.8 | 0.36 | ||
| – | 16.1 | 2.0 | 0.86 | 0.06 | 34.5 | 0.46 | ||
| C2 | 4.6 | 0.8 | 1.99 | 0.03 | 48.4 | 0.14 | ||
| – | 7.6 | 3 | 4.2 | 0.4 | 39.5 | 1.15 | ||
| 2011 Oct 29 | BG207j | Core | 119 | 12 | Ref | 0 | Ref | 0 |
| E | 102 | 10 | 0.03 | 0.03 | 173.9 | 0.11 | ||
| – | 27.2 | 2.7 | 0.24 | 0.03 | 16.2 | 0.27 | ||
| – | 11.6 | 1.2 | 0.66 | 0.03 | 32.5 | 0.35 | ||
| C3 | 9.6 | 1.0 | 1.25 | 0.04 | 30.7 | 0.46 | ||
| C1 | 10.9 | 1.7 | 4.26 | 0.18 | 34.4 | 1.56 | ||
| 2011 Nov 28 | BG207k | Core | 156 | 16 | Ref | 0 | Ref | 0 |
| C4 | 106 | 11 | 0.05 | 0.03 | 167.9 | 0.08 | ||
| – | 30 | 3 | 0.17 | 0.03 | 11.1 | 0.12 | ||
| – | 18.8 | 1.9 | 0.40 | 0.03 | 22.9 | 0.33 | ||
| – | 5.7 | 0.6 | 0.91 | 0.03 | 38.5 | 0.25 | ||
| C3 | 7.9 | 0.9 | 1.39 | 0.05 | 32.2 | 0.50 | ||
| C1 | 9.2 | 1.3 | 3.81 | 0.13 | 36.1 | 1.26 | ||
| 2011 Dec 02 | BM353b | Core | 92 | 9 | Ref | 0 | Ref | 0 |
| – | 69 | 7 | 0.07 | 0.02 | 29.0 | 0.05 | ||
| E | 42.0 | 4 | 0.07 | 0.02 | 51.6 | 0.13 | ||
| – | 17.4 | 2.0 | 0.41 | 0.02 | 19.0 | 0.31 | ||
| C3 | 16.0 | 2.5 | 1.14 | 0.08 | 57.2 | 0.65 | ||
| – | 4.7 | 0.9 | 5.10 | 0.02 | 39.2 | 0.15 | ||
| 2011 Dec 23 | BG207l | Core | 150 | 15 | Ref | 0 | Ref | 0 |
| E | 143 | 14 | 0.05 | 0.02 | 32.8 | 0.13 | ||
| – | 19.2 | 2.0 | 0.44 | 0.02 | 20.8 | 0.29 | ||
| – | 8.6 | 1.1 | 0.87 | 0.09 | 37.1 | 0.45 | ||
| C3 | 6.6 | 1.0 | 1.28 | 0.12 | 28.3 | 0.45 | ||
| C1 | 5.0 | 1.1 | 4.37 | 0.12 | 34.2 | 0.59 |