Clustering Memes in Social Media
Abstract
The increasing pervasiveness of social media creates new opportunities to study human social behavior, while challenging our capability to analyze their massive data streams. One of the emerging tasks is to distinguish between different kinds of activities, for example engineered misinformation campaigns versus spontaneous communication. Such detection problems require a formal definition of meme, or unit of information that can spread from person to person through the social network. Once a meme is identified, supervised learning methods can be applied to classify different types of communication. The appropriate granularity of a meme, however, is hardly captured from existing entities such as tags and keywords. Here we present a framework for the novel task of detecting memes by clustering messages from large streams of social data. We evaluate various similarity measures that leverage content, metadata, network features, and their combinations. We also explore the idea of pre-clustering on the basis of existing entities. A systematic evaluation is carried out using a manually curated dataset as ground truth. Our analysis shows that pre-clustering and a combination of heterogeneous features yield the best trade-off between number of clusters and their quality, demonstrating that a simple combination based on pairwise maximization of similarity is as effective as a non-trivial optimization of parameters. Our approach is fully automatic, unsupervised, and scalable for real-time detection of memes in streaming data.
I Introduction
The amount of information shared on online social media has been growing at unprecedented rates during recent years. Platforms such as Twitter are used for spreading news and opinions [13, 3], coordinating social protest efforts [8, 9], aggregating individuals with common interests [28], and more. The uncontrolled nature of social media makes them vulnerable to exploitation for spreading spam, rumors, slander, and other types of misinformation [7, 20]. In the domain of politics, the more subtle phenomenon of astroturfing has received attention in the recent literature [23, 24]. Astroturfing arises when one or a few individuals make a coordinated effort to create the false impression of a spontaneous (grassroot) movement, inducing users to deem the information reliable and feed its propagation.
The detection of these kinds of orchestrated campaigns is becoming a key problem, and a challenging one. It requires the ability to classify the massive amount of content continuously produced on online social media. Manual labeling is infeasible on a large scale. The task is also difficult due to the limitations of the textual content typical of online social media. For example, Twitter enforces a maximum length of publishable messages (tweets) of 140 characters. Therefore, we postulate that the unit of classification should not be a single tweet, but rather a meme, defined as a unit of information — an idea or a concept — that can spread from person to person through the social network. Equivalently, we can think of a meme as the set of tweets carrying the same piece of information. Once a meme is identified, supervised learning methods can be applied to classify different types of communication.

We are developing a platform for Detecting Early Signatures of Persuasion in Information Cascades (DESPIC), whose architecture is depicted in Fig. 1. There are two core components: a message clustering algorithm that takes a stream of tweets and groups them into memes, and a meme classification algorithm that labels these memes according to categories of interest. In this paper we focus on the clustering framework using Twitter as a test-bed scenario for our analysis.
Classic document clustering techniques based on lexical analysis alone are again ineffective due to the sparsity of text, the limited context of individual tweets, and the use of references to external content. We therefore propose a strategy that leverages various sources of available metadata in addition to text. Tweets may contain hashtags, informally defined textual tokens that are used to identify topics of discussion; mentions of other users that are used to address messages to their attention and help identify the contributors of a conversation; and URLs that point to external resources. We can easily group messages based on these atomic entities, that we call protomemes.
None of these entities alone, however, is necessarily capable to capture a meme at the appropriate level of granularity; a protomeme can be too specific or too general as a concept. Furthermore, each protomeme may only capture a particular aspect of a conversation, while a meme may require a more nuanced description. We argue that combinations of protomemes may provide meaningful signatures of memes. Operationally, we propose a pre-clustering step based on protomemes.
Contributions and outline
This paper formalizes the problem of meme clustering and proposes an operational definition of memes as overlapping clusters of related tweets, aggregated according to content- and network-based features. In the remainder of the paper we make the following contributions.
-
•
We introduce the notion of protomemes that provide an effective way to pre-cluster messages in real-time, streaming social media scenarios.
-
•
We define several similarity measures between memes, leveraging various content, metadata, and network features of tweets; and we propose different ways to combine them for clustering memes.
-
•
We compare multiple clustering algorithms, finding that hierarchical clustering outperforms K-means in terms of the trade-off between quality of the clusters and their number and size.
-
•
We show that pre-clustering based on protomemes is an effective strategy compared to clustering the original tweets.
-
•
Finally, we compare different similarity measures and their combinations. We show that a simple combination based on pairwise maximization of similarity is as effective as a non-trivial optimization of parameters for robust performance. Our algorithm outperforms baseline methods, including one that exploits full information about the underlying social network.
II Clustering framework
The meme clustering problem is defined for any social media platform used to spread messages on a directed social network; microblogging systems like Twitter, Google Plus, and Yahoo! Meme are popular examples. In these systems, users are connected by directed links: using Twitter terminology, one follows others to see their messages. Users can re-post (retweet) any seen post (tweet), spreading it to their followers.
In the following we introduce the notion of protomeme and describe how protomemes have been incorporated into our clustering methodology.
II-A Defining protomemes
Let us define a set of features that can be easily extracted from a tweet and used to at least partially identify the topic of the tweet [23, 24]:
- Hashtag:
-
Twitter users can incorporate in the text of their tweets one or more hashtags, textual tokens prefixed by hash marks (#), that identify the topic of the message.
- Mention:
-
We say that a tweet mentions a user when it includes the target’s username preceded by the ‘@’ symbol, thus addressing that specific user.
- URL:
-
Tweets may include links to external sources of information. A URL is the Web address identifying a linked resource.
- Phrase:
-
The textual content of a tweet that remains after removing hashtags, mentions, URLs, stop words, and punctuation, and after stemming words [22], is defined as a phrase. Phrases may capture semantically equivalent lexical variations of textual messages.
Hereafter we will refer to instances of these features as entities. Consider the tweet “@All_4Given Gingrich: Romney Most Likely Nominee http://t.co/CectDLni #All4Given” as an example. This tweet contains four entities: the hashtag #All4Given, the mention @All_4Given, the URL http://t.co/CectDLni, and the phrase gingrich romnei most like nomine. In the following we will denote as protomeme the set of all tweets that contain a specific entity. Think of a protomeme as a primitive meme. One consequence of this representation is that protomemes overlap; the tweet in the above example belongs to four protomemes.
Additionally, any tweet is accompanied by a plethora of metadata, such as author information (e.g., username, number of tweets and followers, self-reported user location), temporal and geographical information (e.g., timestamp and latitude/longitude coordinates of the tweet), retweet information, and so on. The set of features could be expanded to exploit such metadata.
Protomemes leverage the wisdom of the crowd [11, 21]: users exploit content features that allow for the effective identification of discussion topics (hashtags), ongoing conversations (mentions), or external resources (URLs). Thus, by adopting protomemes we intend to alleviate the problem of text sparsity, which has proven to hinder the application of topic modeling techniques to Twitter [12].
Moreover, protomemes can aid in the task of clustering messages in a streaming scenario, as they are easily extracted in real time by defining a set of matching rules, such as regular expressions. Incoming tweets are seamlessly added to existing protomemes, which form natural initial tweet clusters. Protomemes therefore provide an efficient pre-clustering strategy to aggregate messages.
Our social media clustering framework uses protomemes as the fundamental units. Natural similarity measures can be defined over the protomemes (sets of tweets), to aggregate related protomemes into broader memes.
II-B Similarity measures
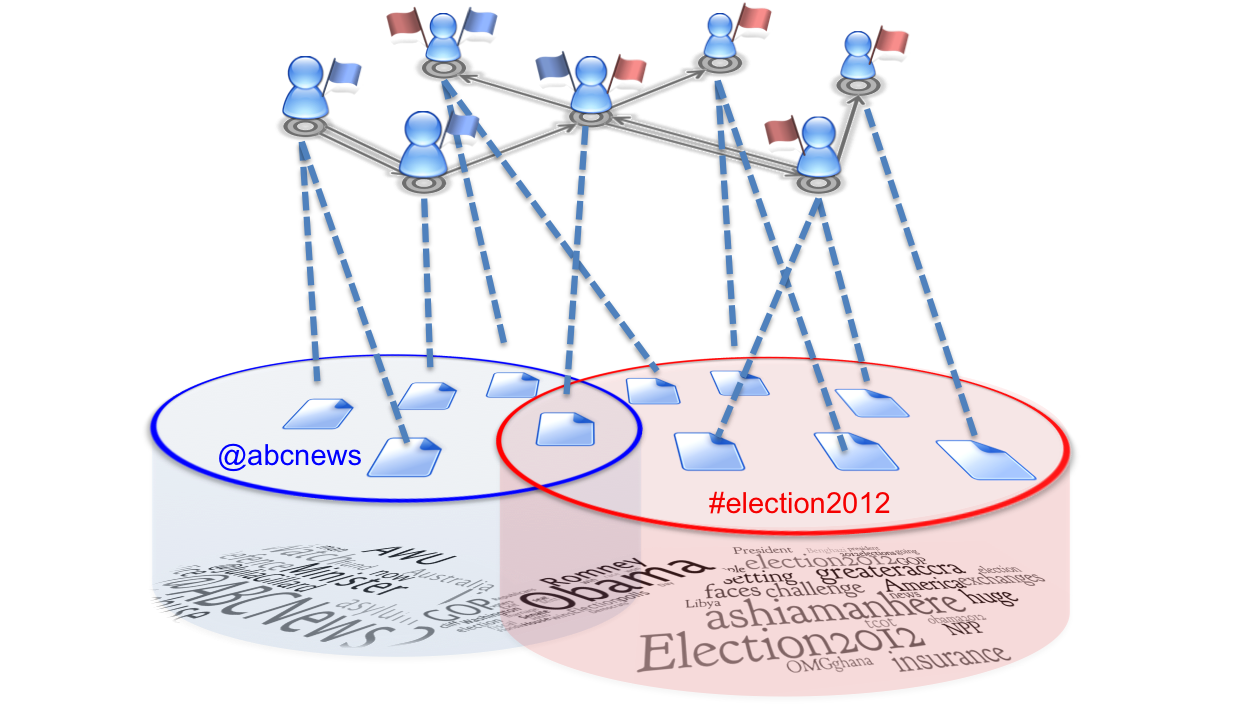
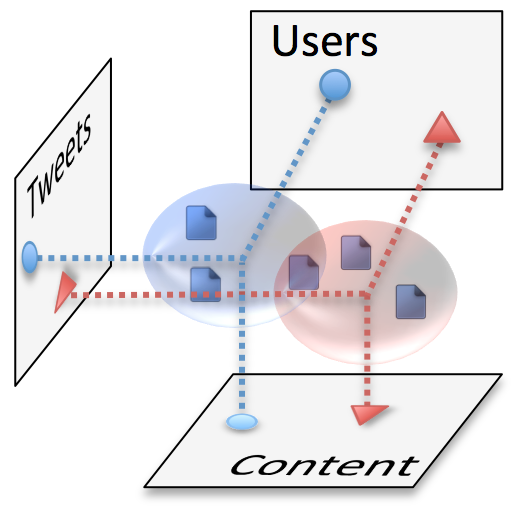
Fig. 2 (left) illustrates the mutual relations between protomemes, the tweets they contain, their content, the users who post them, and the underlying follower network. We can define similarity measures between protomemes by considering the projections of the protomemes onto spaces induced by these features, also depicted in Fig. 2 (right).
Let us provide a few preliminary definitions. Let be a set of tweets, be the set of users that produced tweets in ( because a user may post more than one tweet), and be the set of terms obtained by concatenating all tweets in . We can now define a set of measures, which we will apply to compute the similarity between protomemes.
-
Common user similarity
between protomemes and is the cosine similarity between their user frequency vectors
(1) where is the number of times user adopts protomeme .
-
Common tweet similarity
between protomemes and is the cosine similarity between their (binary) tweet vectors
(2)
-
Content similarity
between protomemes and is the cosine similarity between their TF-IDF vectors
(3) where is the TF-IDF weight assigned to term .
Since we cannot assume that information about the follower social network is available to the clustering algorithm, let us exploit mention and retweet metadata as a proxy for the underlying network structure to define a forth similarity measure. Let be the diffusion set of , where is the set of users mentioned in tweets in , and is the set of users who have retweeted posts in .111Note that is not necessarily a subset of when only a sample of the tweets are considered in the stream; the sample may include a retweeted message but not the original one.
-
Diffusion similarity
between protomemes and is the cosine similarity between their diffusion (binary) vectors
(4)
II-C Combinations
There are many ways to combine different similarity measures. One of the goals of our experimentation will be to explore how different similarity measures and combinations of them affect the quality of the meme clusters. In the following we introduce two different methods incorporated in our framework.
The pairwise maximization strategy aims at choosing the measure that provides the highest value every time we compute the similarity between two protomemes. The rationale is to capture the characteristics of a particular pair of protomemes; the relatedness of two protomemes may be best described by their content while that of two other protomemes may be more obvious by considering users, say. Given a set of similarity measures , the maximum pairwise similarity is formally defined as
| (5) |
A second approach is a linear combination of similarity measures, extending the idea of averaging [30, 25]. Formally,
| (6) |
with the constraint that , allowing for a normalized combination such that (assuming ). The set of parameters introduces an -dimensional parameter space whose exploration is instrumental for understanding what combinations of similarity measures provide the best performance in terms of clustering. This aspect will be investigated in detail in our experiments.
II-D Clustering algorithms
The ideal clustering framework should allow for the detection of memes (clusters) at different levels of granularity — in some cases one might prefer small clusters of tightly related protomemes, in other cases a smaller number of broader groups may be required. Hierarchical clustering algorithms are naturally designed to span a range of granularities. On the other hand, if the desired number of clusters is known in advance, K-means offers an efficient alternative. Since different clustering algorithms work best for different tasks, we will evaluate whether hierarchical or K-means clustering is better suited for our task. Of course there are many other clustering methods; we only consider these two widely adopted techniques as we are more interested in the role of the protomemes and various similarity measures in determining cluster quality.222In the next section we extensively discuss criteria for determination of cluster quality. Once a set of objects to cluster (tweets or protomemes) and similarity measures among objects are defined, it is possible to apply any off-the-shelf clustering algorithm — or to design new ones.
Both algorithms can appropriately work in our platform, taking as input the protomemes produced in the pre-clustering detection system from the datastream. In our system the clustering is intended as an asynchronous, off-line process, that at predetermined time intervals analyzes and clusters the amount of protomemes captured in a recent time window (say, the last hour of data). New tweets incoming from the social stream can be assigned to the existing clusters via the protomeme pre-clustering processing until the next execution of the clustering algorithm will further refine the existing clusters, exploiting additional data points and disregarding protomemes not observed in recent data.
Regarding hierarchical clustering, we adopt the average-linkage method to determine the similarity among clusters. The similarity between two clusters is simply the average pairwise similarity among all protomemes belonging to them. This approach alleviates the sensitivity of the algorithm in the presence of outliers. The similarity matrix among all protomemes is computed once at the start.
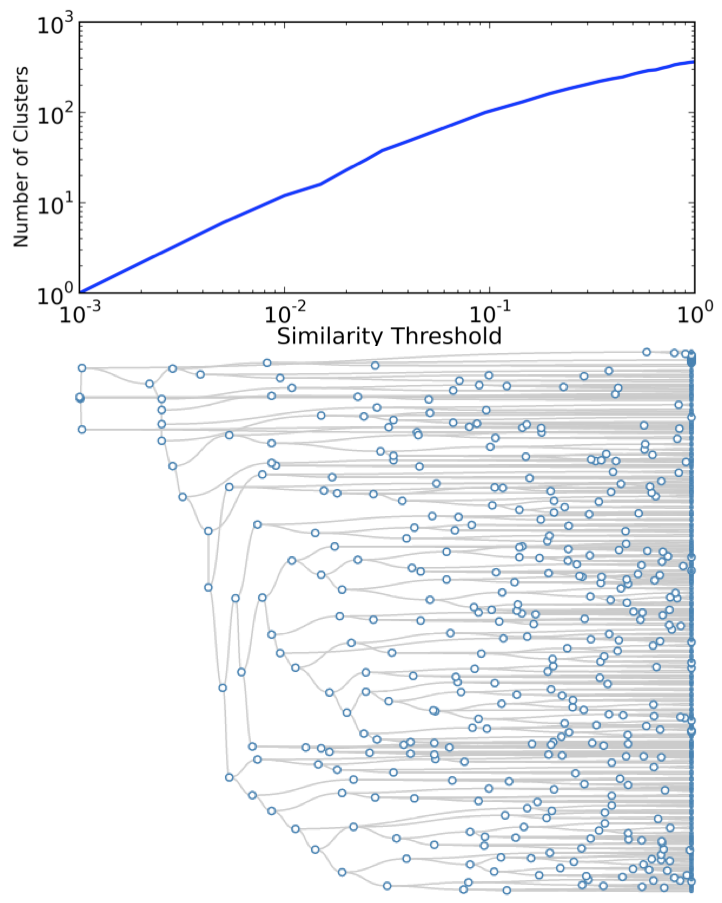
Once the dendrogram has been generated by the hierarchical clustering algorithm, a dendrogram cut is applied by picking a similarity threshold . This process allows for tuning the performance of hierarchical clustering to find the correct trade-off between number and size of clusters, as shown in Fig. 3. In our experimental trials we will show how the number of clusters (determined by the choice of ) affects the quality of the clustering solution. While K-means clustering requires to select the number of clusters in advance, one can run K-means for different numbers of clusters, exploring a similar range of solutions.
III Evaluation
In this section we discuss a systematic evaluation process carried out to assess performance in the meme clustering task. First we describe a dataset adopted as ground truth in our evaluation. Then we introduce a quality metric, motivating its adoption and giving some intuition for how it works.
III-A Ground truth dataset
For evaluation purposes, we used an existing dataset of hand-curated tweets as ground truth. Tweets about political news regarding the US presidential primaries were collected during April 2012 using the Twitter APIs (dev.twitter.com/docs/api). To verify the completeness of the dataset, we compared it with Twitter’s gardenhose sample, which collects about 10% of all public tweets. We observed that the number of tweets in the dataset was roughly ten times larger than those in the gardenhose data. This suggests that the dataset includes nearly all of the tweets that were published about these topics during the observation period. The dataset comprises of 5,523 tweets containing 2,866 URLs, 2,780 hashtags, and 1,848 mentions. Note that exact duplicates and retweets were removed from the dataset. This possibly penalizes the performance of the clustering algorithms by biasing the similarity measures. For example, retweet information is not available when computing diffusion similarity.
We annotated the set of tweets in two steps. We first manually reviewed all tweets in the dataset identifying topics consisting of at least three tweets. Then we labeled each tweet with one or more topics. Our annotations resulted in a set of clusters corresponding to 26 topics. Some examples of tweets contained in the dataset and relative cluster assignments are reported in Table I.
Given the brevity of tweets, most (92.1%) discuss only a single topic. However, 7.9% of the tweets were assigned to more than one cluster. We will exploit this information during our evaluation to assess whether our clustering framework is able to capture such overlap. Table II reports the composition of the clusters obtained after the manual annotation.
| Rick Santorum ends presidential campaign after conceding to Mitt Romney in phone call - The Ticket - Yahoo! News http://t.co/L6IYHt6d |
| Santorum suspends campaign, clearing Romney’s path http://t.co/HC3XtptZ #cnn |
| #BREAKING: Rick #Santorum suspends his campaign for president, making Mitt #Romney likely Republican nominee. |
| MITT ROMNEY EXPRESS: Is Rick Santorum In Or Out Of The 2012 Race? http://t.co/zva9ZK3i |
| Rick Santorum quits campaign to leave field clear for Romney http://t.co/oKVBUYo3 #News #CNN #Politico |
| Cluster | Tweets | Overlap | Cluster | Tweets | Overlap |
|---|---|---|---|---|---|
| ratio | ratio | ||||
| 1 | 1,654 | 16.14% | 14 | 57 | 28.07% |
| 2 | 1,522 | 13.14% | 15 | 54 | 35.18% |
| 3 | 405 | 29.62% | 16 | 49 | 24.49% |
| 4 | 376 | 6.64% | 17 | 43 | 0.00% |
| 5 | 355 | 14.92% | 18 | 41 | 4.88% |
| 6 | 343 | 17.20% | 19 | 35 | 20.00% |
| 7 | 245 | 8.57% | 20 | 29 | 0.00% |
| 8 | 230 | 9.56% | 21 | 27 | 22.22% |
| 9 | 128 | 3.91% | 22 | 21 | 14.28% |
| 10 | 97 | 18.55% | 23 | 20 | 0.00% |
| 11 | 86 | 15.11% | 24 | 4 | 25.00% |
| 12 | 71 | 0.00% | 25 | 4 | 0.00% |
| 13 | 63 | 6.35% | 26 | 3 | 0.00% |
III-B Evaluation metric
To assess the quality of the clusters, we adopt a measure based on Normalized Mutual Information (NMI) [10]. The NMI assumes the availability of a ground truth that represents the correct clusters. Let be the correct cluster assignment, and suppose that it contains clusters. Let be the output of a clustering algorithm operating on the same data and producing clusters. We can define a confusion matrix , whose rows correspond to the clusters in and whose columns represent clusters in . Each entry of this confusion matrix reports the number of elements of the correct -th cluster that happen to be assigned to the -th cluster by the clustering algorithm. The Normalized Mutual Information is defined as
where (resp., ) is the sum of the elements in the -th row (resp., -th column) of the confusion matrix, and is the sum of all elements of . The output of this measure is normalized between zero (when the clusters in the two solutions are totally independent), and one (when they exactly coincide). Therefore, the higher the value of NMI, the better the quality of the clusters found by the algorithm.
Measures based on mutual information have been shown to best capture different facets of a clustering process, such as how well a clustering algorithm reflects the number, size, and composition of clusters with respect to the ground truth, as opposed to some other widely used measures, which may produce biased evaluations [19]. Our investigation with accuracy, precision, recall, and confirmed the limitations of these measures, all of which report indistinguishable results due to the dominance of true negatives. Purity, on the other hand, is by definition biased toward rewarding the presence of tiny clusters, which tend to be pure. For these reasons, NMI has been recently adopted in the evaluation of tasks such as event detection in social media [4].
The previous definition does not work well in the case of overlapping clusters. We therefore adopt in our evaluation a variant called LFK-NMI, which accounts for overlapping clusters. Details on the formulation of LFK-NMI are outside the scope of this paper, and can be found in the paper by Lancichinetti et al. [14].
IV Results
There are many potential configurations of our clustering framework; next we present experiments designed to evaluate several aspects of meme clustering.
IV-A Hierarchical vs. K-means clustering
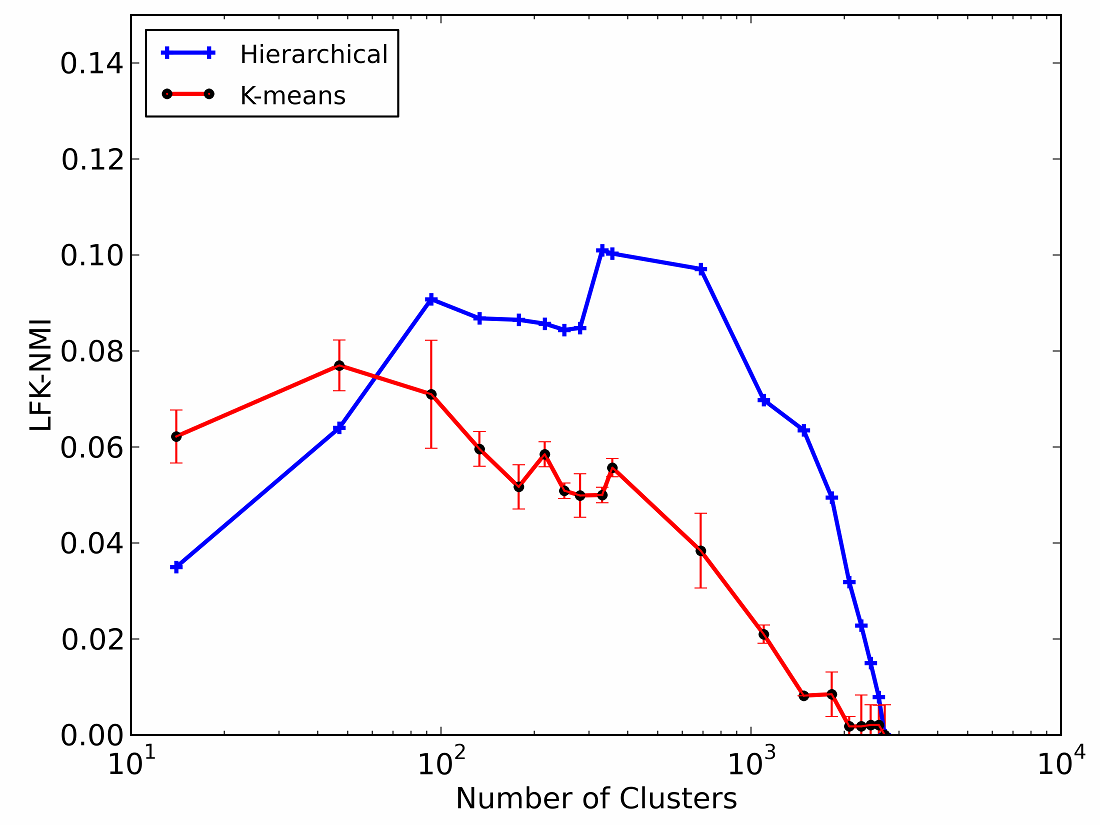
The first experiment aims at choosing one clustering algorithm. Fig. 4 compares hierarchical and K-means clustering algorithms. We report the value of LFK-NMI as a function of the number of clusters, obtained with each of the clustering methods. By varying the similarity threshold in hierarchical clustering, we obtained partitions with different numbers of clusters (cf. Fig. 3). We then ran K-means for each of the corresponding numbers of clusters.
K-means generally performs well at finding a very small number of clusters, but the quality of discovered clusters quickly deteriorates when the number of clusters increases. Hierarchical clustering outperforms K-means over a broad range of values for the number of clusters, and also achieves a better overall cluster quality.
While the experiment reported in Fig. 4 is based on protomemes and content similarity, we systematically explored other measures. All experiments provided the same verdict: hierarchical clustering outperforms K-means in our meme clustering task on Twitter. As a result, we employ hierarchical clustering in the rest of our evaluation.
IV-B Experimental setup
Our second and more important experiment aims at assessing whether protomemes convey a concrete advantage in the task of clustering memes in social media. To this purpose we compare two different configurations of our clustering framework that operate with protomemes against two configurations that operate directly on individual tweets. The description of these four configurations follows.
Baseline: This configuration is a straightforward implementation of hierarchical clustering of simple tweets. The similarity measure adopted to compare tweets and aggregate them is content similarity based on TF-IDF.
Baseline+Followers: This configuration is inspired by the event detection system recently proposed by Aggarwal and Subbian [2], namely a tweet clustering algorithm based on both content- and network-based features. The main limitation of this approach is that it relies on the full knowledge of the follower network of all users present in the dataset. Such information is very time-consuming to obtain and this task seems unfeasible in real-time, streaming scenarios. To compute tweet similarity, the authors adopt TF-IDF, and we reproduced this choice in our implementation. Follower similarity is implemented using Eq. 4 but with actual follower sets; this is a variation of the original formulation, which is not applicable in our framework. The two similarity measures are linearly combined with equal weights, and used with hierarchical clustering (note that hierarchical clustering provides better performance than K-means in this case as well.)
MAX: In this configuration we adopt protomemes as the atoms of our clustering algorithm. We use all four similarity scores defined above (, , , and ), and combine them via the maximum pairwise similarity (Eq. 5).
Linear combination: The last configuration also exploits all four similarity measures, combined by way of a linear combination (Eq. 6). We discuss how to determine the parameters of the linear combination later in this section.
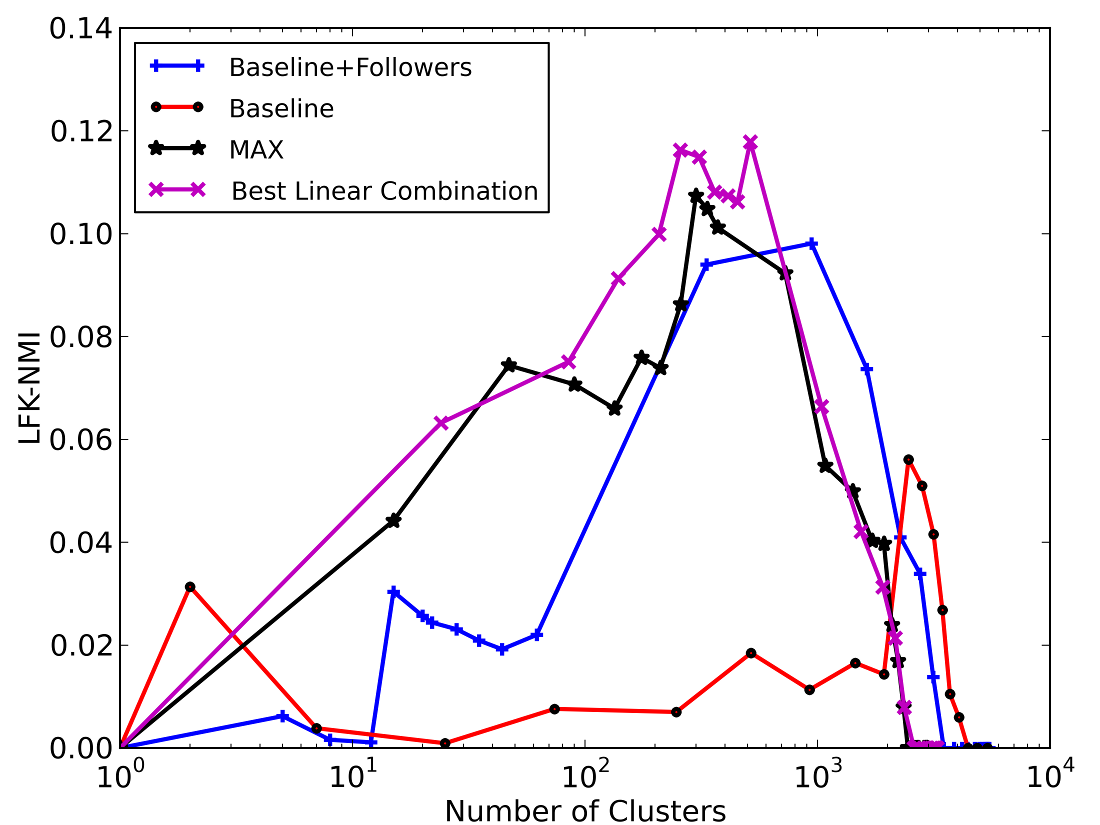
Fig. 5 presents a comparison between the performance of the four configurations. The baseline achieves its best performance for a number of clusters that is comparable to the number of tweets, which is not very helpful in our setting. This is understandable since either the tweets are very similar, or due to the sparsity of the text, their similarity is likely close to zero. The Baseline+Followers algorithm performs better, achieving higher quality and with fewer clusters. This configuration, however, might not be viable for our task in the streaming scenario. The MAX strategy obtains its best performance for a much smaller number of clusters, even outperforming Baseline+Followers when the number of clusters is closer to that in the ground truth. This is remarkable given that MAX does not have access to the full follower network. We interpret these results as evidence that protomemes provide a significant advantage. This advantage becomes further evident considering the performance of the linear combination. This configuration provides a slight improvement over the MAX strategy, although the parameters are optimized with knowledge of the ground truth.
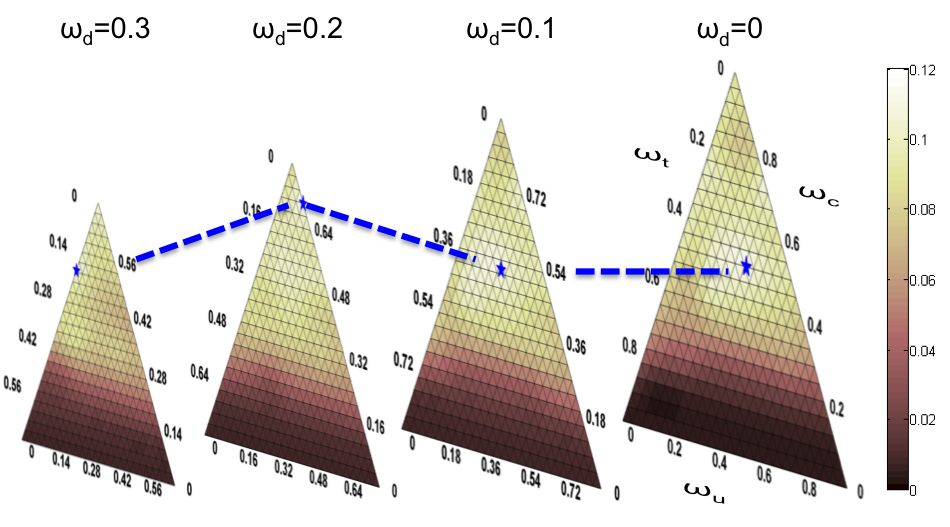
To determine the weights of the linear combination of the four similarity measures (Eq. 6), we used a greedy optimization procedure. We ran the hierarchical clustering algorithm for each set of weights in a 3-dimensional simplex with step 0.1, resulting in 286 parameter configurations. For each parameter set we found the best LFK-NMI value, irrespective of the number of clusters. We finally selected the best overall setting.
Fig. 6 shows that optimal solutions (high LFK-NMI values) are provided by non-trivial combinations of the four parameters. The highest LFK-NMI peak is obtained with the following weights: , , , . Common tweet similarity does not contribute to this particular configuration, although it is to be noted that other parameter settings yield higher LFK-NMI for different values of the number of clusters (for example, another configuration with yields compareble LFK-NMI for fewer clusters.)
IV-C Cross-validation
The optimization procedure outlined above for tuning the parameters of the linear combination of similarity measures uses knowledge about the ground truth labels for both learning the weights and evaluating the quality of the clusters. This runs the risk of over-fitting on a training set. To assess the robustness of our performance evaluation, we performed a cross-validation analysis.
We opted for 5-fold cross-validation so that the test sets would not be too small for cluster quality evaluation. We randomly assigned each tweet to one of the 5 folds, guaranteeing equal fold sizes and unbiased distribution of topics across each fold, in spite of the considerable class imbalance (cf. Table II). For each iteration, we used the combination of 4 folds as training data (to optimize the weights as described in the previous subsection), and the remainder 20% of the tweets as test set (to measure clustering quality). Performance of the clustering algorithm was computed after splitting the ground truth topics consistently with the generated folds. Results were finally averaged across the 5 runs of the cross-validation test.
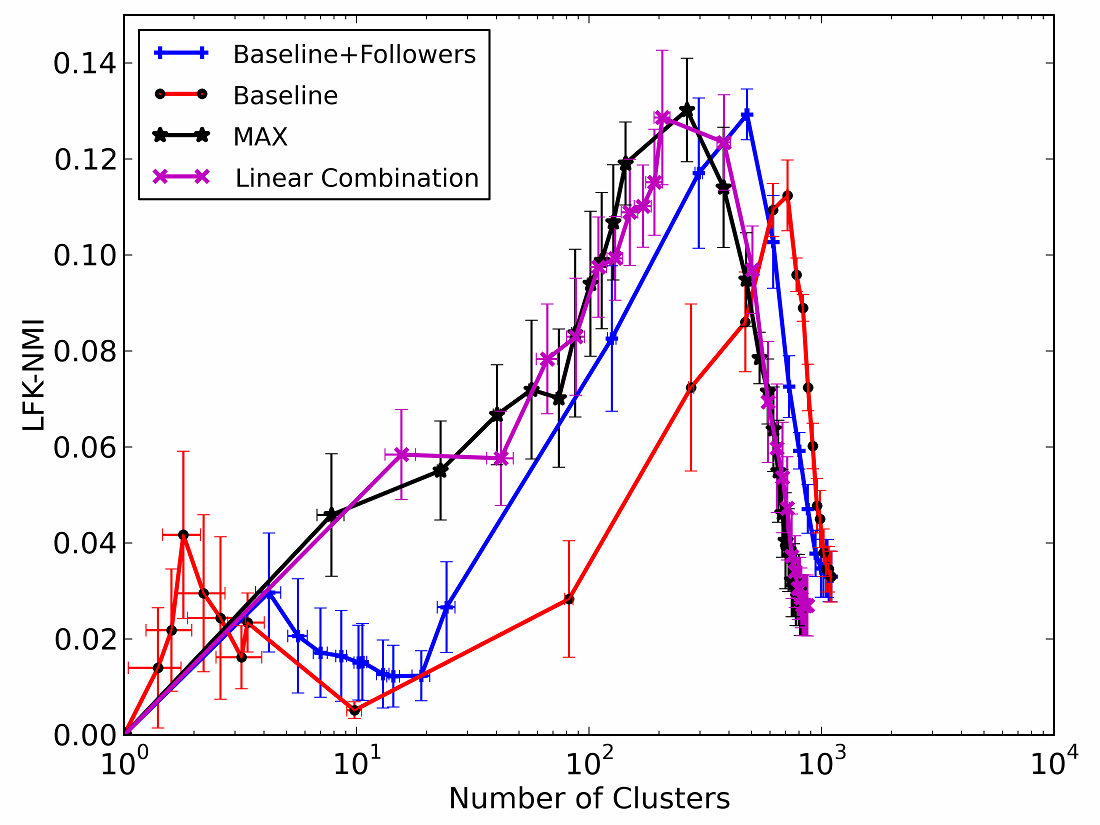
Fig. 7 shows the results of our cross-validation analysis. It is worth noting that the test sets contain only 20% of the data, and therefore the number of clusters is smaller than that reported in Fig. 5, where performance was assessed on the entire dataset. To obtain a meaningful comparison, we evaluated the other algorithms on the same test sets. They perform relatively better on this easier clustering task, as reflected in higher values of LFK-NMI compared to Fig. 5.
The cross-validation analysis demonstrates that the performance obtained with the learned linear combination of similarity measures is not statistically better than that obtained with the MAX strategy. Interestingly, we can achieve close to optimal performance without having to assume prior knowledge of the ground truth, which of course makes our clustering algorithm more amenable to a realistic streaming scenario.
V Related work
This work, to the best of our knowledge, is the first to formalize the problem of clustering memes in online social media. Recent literature has discussed related problems, such as the identification of topics or memes [16, 29, 27] or emerging events in social streams [26, 6, 18, 17, 15].
Leskovec et al. [16] presented memetracker, a platform that tracks memes produced in online media such as mainstream news sites and Weblogs. Memetracker can group together short, distinctive phrases that act as signatures of specific topics and identify small variations of them. This creates groups of news on related topics that can be tracked over time to define patterns of diffusion in the news cycle. Memetracker identifies and aggregates disjoint memes on the basis of textual similarity but no systematic evaluation of the quality of the retrieved memes is provided. Our work instead focuses on the assessment of the quality of the meme clustering process, and allows for overlapping memes.
The problem of tracking news for meme extraction has been tackled also by Simmons et al. [27]. Based on the memetracker dataset, they investigated the extent to which information evolves and mutates due to collective processing of social media users. While defining protomemes, we rooted our work on the findings of both Leskovec et al. [16] and Simmons et al. [27], expanding on the aggregation of meme variants based not only on textual similarity, but also on other network and meta-data features.
Our framework shares some similarities also with another line of research on event detection systems. Aggarwal and Subbian [2] presented a clustering algorithm that exploits both content- and network-based features to detect events in social streams. We adapted their algorithm to work in the context of meme clustering. Unfortunately, the algorithm assumes a preexisting knowledge about the follower network of Twitter users. In a streaming scenario, such information is expensive to get, especially when encountering popular users. In our framework, we proposed to rely on mention and retweet diffusion sets, which can be inferred in real-time from the observed data. Also, we achieved better performance by pre-clustering based on protomemes and relative similarity measures.
Agarwal et al. [1] recently proposed a graph-based algorithm for the real-time discovery of clusters in dynamic networks. The strategy is based on the discovery of dense clusters on the inferred graph of correlated keywords, extracted from tweets in a given time-frame. This method relies on the adoption of the short cycle property that allows to find a local approximate solution. Performance of the system has been tested by using a simulated stream of tweets based on events reported by Google news in a given period, yielding high precision/recall in the task of identifying the largest events.
Concluding, Becker et al. [5] presented an event classification system designed for Twitter. The authors used temporal features in addition to social and topical ones. These features are adopted to train a classifier that consumes manually annotated clusters of data points representing specific events on Twitter. The best performance is provided by SVM, being a Naive Bayes classifier used as baseline. The results provided by the authors are promising and represent a starting point in the task of classifying different types of memes in Twitter.
VI Conclusions
In this work we formalized the problem of clustering memes from social streams such as Twitter, and we presented a framework to deal with this task. Our clustering framework adopts a novel pre-clustering procedure, namely protomeme detection, aimed at identifying atomic tokens of information inside tweets. Due to its efficiency, this strategy should be particularly well suited to work in streaming scenarios. Additional work will be needed to empirically confirm this conjecture.
Several similarity measures among protomemes have been defined, leveraging various features including content- and network-based ones, to build clusters of semantically and structurally related tweets. The proposed diffusion similarity measure uses mention and retweet information, that can be reconstructed in real-time from the observed data, considering each protomeme diffusion set. We carried out a systematic evaluation showing the promising performance of the clustering framework, by using a manually-curated dataset as a ground truth. The best trade-off between quality, number, and size of clusters is obtained by pre-clustering using protomemes, and combining similarity measures exploiting heterogeneous features, with a simple pairwise maximization strategy. This approach performs as well as methods that assume prior knowledge of the data, and better than methods that assume knowledge of the underlying social network.
As for future work, we will extend the set of features incorporated by our clustering framework, considering for instance images. Furthermore, our preliminary analysis suggests that the introduction of time series as features may yield significant performance improvements.
Our long-term plan is to integrate the meme clustering framework with a meme classifier to distinguish engineered types of social media communication from spontaneous ones. This platform will adopt supervised learning techniques to classify memes and determine their legitimacy, with the aim of early detection of attempts to spread misinformation and deceiving campaigns. The platform will be optimized to work with the real-time, high-volume streams of messages.
Acknowledgment
The authors are grateful to Qiaozhu Mei, Sergey Malinchik, and Zhe Zhao for fruitful discussions. This work is supported by NSF (grants CCF-1101743 and IIS-0968489), DARPA (grant W911NF-12-1-0037), and the McDonnell Foundation. The funders had no role in study design, data collection and analysis, decision to publish, or preparation of the manuscript.
References
- [1] M. Agarwal, K. Ramamritham, and M. Bhide. Real time discovery of dense clusters in highly dynamic graphs: identifying real world events in highly dynamic environments. Proceedings of the VLDB Endowment, 5(10):980–991, 2012.
- [2] C. Aggarwal and K. Subbian. Event detection in social streams. In Proceedings of SIAM International Conference on Data Mining, 2012.
- [3] E. Bakshy, J. Hofman, W. Mason, and D. Watts. Everyone’s an influencer: quantifying influence on twitter. In Proceedings of the 4th ACM International Conference on Web Search and Data Mining, pages 65–74. ACM, 2011.
- [4] H. Becker, M. Naaman, and L. Gravano. Learning similarity metrics for event identification in social media. In Proceedings of the 3rd ACM International Conference on Web Search and Data Mining, pages 291–300. ACM, 2010.
- [5] H. Becker, M. Naaman, and L. Gravano. Beyond trending topics: Real-world event identification on twitter. In Proceedings of the 5th International AAAI Conference on Weblogs and Social Media, 2011.
- [6] M. Cataldi, L. Di Caro, and C. Schifanella. Emerging topic detection on twitter based on temporal and social terms evaluation. In Proceedings of the 10th International Workshop on Multimedia Data Mining, page 4. ACM, 2010.
- [7] C. Chew and G. Eysenbach. Pandemics in the age of twitter: content analysis of tweets during the 2009 h1n1 outbreak. PLoS One, 5(11):e14118, 2010.
- [8] M. D. Conover, C. Davis, E. Ferrara, K. McKelvey, F. Menczer, and A. Flammini. The geospatial characteristics of a social movement communication network. PloS one, 8(3):e55957, 2013.
- [9] M. D. Conover, E. Ferrara, F. Menczer, and A. Flammini. The digital evolution of Occupy Wall Street. PloS one, 8(5):e64679, 2013.
- [10] L. Danon, A. Díaz-Guilera, J. Duch, and A. Arenas. Comparing community structure identification. Journal of Statistical Mechanics: Theory and Experiment, 2005(09):P09008, 2005.
- [11] S. Golder and B. Huberman. Usage patterns of collaborative tagging systems. Journal of information science, 32(2):198–208, 2006.
- [12] L. Hong and B. Davison. Empirical study of topic modeling in twitter. In Proceedings of the 1st Workshop on Social Media Analytics, pages 80–88. ACM, 2010.
- [13] H. Kwak, C. Lee, H. Park, and S. Moon. What is twitter, a social network or a news media? In Proceedings of the 19th International Conference on World Wide Web, pages 591–600. ACM, 2010.
- [14] A. Lancichinetti, S. Fortunato, and J. Kertész. Detecting the overlapping and hierarchical community structure in complex networks. New Journal of Physics, 11(3):033015, 2009.
- [15] J. Lehmann, B. Gonçalves, J. Ramasco, and C. Cattuto. Dynamical classes of collective attention in twitter. In Proceedings of the 21st International Conference on World Wide Web, pages 251–260, 2012.
- [16] J. Leskovec, L. Backstrom, and J. Kleinberg. Meme-tracking and the dynamics of the news cycle. In Proceedings of the 15th ACM SIGKDD International Conference on Knowledge Discovery and Data Mining, pages 497–506. ACM, 2009.
- [17] A. Marcus, M. Bernstein, O. Badar, D. Karger, S. Madden, and R. Miller. Twitinfo: aggregating and visualizing microblogs for event exploration. In Proceedings of the 2011 Annual Conference on Human Factors in Computing Systems, pages 227–236. ACM, 2011.
- [18] M. Mathioudakis and N. Koudas. Twittermonitor: trend detection over the twitter stream. In Proceedings of the 2010 International Conference on Management of Data, pages 1155–1158. ACM, 2010.
- [19] M. Meilă. Comparing clusterings – an information based distance. Journal of Multivariate Analysis, 98(5):873–895, 2007.
- [20] P. Metaxas and E. Mustafaraj. From obscurity to prominence in minutes: Political speech and real-time search. In Proceedings of Web Science: Extending the Frontiers of Society On-Line, 2010.
- [21] P. Mika. Ontologies are us: A unified model of social networks and semantics. Web Semantics: Science, Services and Agents on the World Wide Web, 5(1):5–15, 2007.
- [22] M. Porter. An algorithm for suffix stripping. Program, 14(3), 1980.
- [23] J. Ratkiewicz, M. Conover, M. Meiss, B. Gonçalves, A. Flammini, and F. Menczer. Detecting and tracking political abuse in social media. In Proceedings of the 5th International AAAI Conference on Weblogs and Social Media, 2011.
- [24] J. Ratkiewicz, M. Conover, M. Meiss, B. Gonçalves, S. Patil, A. Flammini, and F. Menczer. Truthy: mapping the spread of astroturf in microblog streams. In Proceedings of the 20th International Conference Companion on World Wide Web, pages 249–252. ACM, 2011.
- [25] J. Reisinger and R. Mooney. Multi-prototype vector-space models of word meaning. In Proceedings of Annual Conference of the North American Chapter of ACL, 2010.
- [26] H. Sayyadi, M. Hurst, and A. Maykov. Event detection and tracking in social streams. In Proceedings of the 3rd International AAAI Conference on Weblogs and Social Media, 2009.
- [27] M. Simmons, L. A. Adamic, and E. Adar. Memes online: Extracted, subtracted, injected, and recollected. In Proceedings of the 5th International AAAI Conference on Weblogs and Social Media. AAAI, 2011.
- [28] S. Wu, J. Hofman, W. Mason, and D. Watts. Who says what to whom on twitter. In Proceedings of the 20th International Conference on World Wide Web, pages 705–714. ACM, 2011.
- [29] L. Xie, A. Natsev, J. R. Kender, M. Hill, and J. R. Smith. Visual memes in social media: tracking real-world news in youtube videos. In Proceedings of the 19th ACM International Conference on Multimedia, pages 53–62. ACM, 2011.
- [30] W. Yih and V. Qazvinian. Measuring word relatedness using heterogeneous vector space models. In Proceedings of Annual Conference of the North American Chapter of ACL, 2012.