Cyclostationary Approach for Heart and Respiration Rates Monitoring with Body Movement Cancellation Using Radar Doppler System
Abstract
Heart and respiration rate measurement using Doppler radar is a non-contact and non-obstructive way for remote thorough-clothing monitoring of vital signs. The modulated back-scattered radar signal in the presence of high noise and interference is non-stationary with hidden periodicities, which cannot be detected by ordinary Fourier analysis. In this paper we propose a cyclostationary approach for such signals and show that by using non-linear transformation and then Fourier analysis of the radar signal, the hidden periodicities can be accurately obtained. Numerical results show that the vital signs can be extracted as cyclic frequencies, independent of SNR and without any filtering or phase unwrapping.
Index Terms:
Non-Stationary signal, Hidden periodicities, Cyclostationary, Amplitude and phase modulation, Doppler, Time varying statistical parametersI Introduction
For a long time, non-contact monitoring of heart and respiratory activity of patients and elderly persons, based on CW microwave Doppler radar phase modulation, has been a valuable approach to remote sensing diagnosis of syndromes risks and heart attacks in medicine and telemedicine [1]-[3]. Many applications, such as baby monitoring to prevent sleep apnea or vital sign detection through clothing, have motivated several studies to find the best methods to extract information from a signal modulated by small chest motion [4, 5]. The main challenges in these studies pivot around accurate information extraction in the presence of high noise, clutter, and body motion interference [6, 7]. A quadrature receiver is the best approach to prevent phase demodulation null points by choosing the larger of the two signals, through direct phase demodulation or by combining the signals [8, 9]. The Gram-Schmidt technique for known phase and amplitude imbalances is used to orthonormalize the two quadrature vectors and analyze the error [10]. Equal-ratio combining, maximum-ratio combining, and principal component analysis also are some data-driven approaches that are used to combine two channel signals [11]. Although high RF frequencies (small wavelengthes) result in high signal-to-noise ratio (SNR) of the detected chest-wall motion signal, the small angle approximation then does not hold, and, hence, nonlinear combining techniques are needed [12, 13]. The Levenberg-Marquardt (LM) estimation algorithm is a nonlinear method used to center the I-Q arc and to remove dc offsets and imbalances [14, 15]. Although successful Doppler radar non-contact vital sign detection under different environments for stationary persons has been reported in recent years [2, 3], [16]-[18], a number of challenges still remain, including development of nonlinear channel combining algorithms [12, 13], cancelation of motion artifacts and background clutter [12], [19], and improvement of rate estimation methods under low SNR conditions [20].
As a matter of fact, since non-contact vital sign estimation is based on detection of phase modulation induced by small chest motion in the millimeter range, the presence of environmental noise and random body movements that occur in situations with small transceivers and large distances are difficult challenges for obtaining accurate results.
In this paper, we present a non-stationary approach to vital sign detection and characterization in the presence of noise and interference. Many common statistical signal processing methods treat random signals as if they were statistically stationary, but generally the parameters of the underlying physical process that generates the signals vary with time. The detection, analysis, and feature extraction of signals involving general unknown non-stationarities, with only a few signal records, is generally impossible. Fortunately, some real-world signals such as heart and respiration modulated signals have some parameters that vary periodically or almost periodically with time. This leads to the fact that a random signal with property periodicity could be modeled as a cyclostationary process [21, 22].
Cyclostationary theory is one of the most suitable methods for analyzing signals, that have a cyclic pattern of statistical properties. It mainly uses the cyclic statistics to analyze, detect, and estimate signals with hidden periodicities. Another basic advantage is the robustness of cyclostationary processing in an environment with high noise and interference [23]-[26]. For these reasons, the cyclostationaity approach can be utilized in monitoring heart and respiratory activity of patients, as a robust signal processing method, and to obtain accurate rate estimation using a phase modulated signal in situations with very low SNR and in the presence of two-dimensional (2-D) random body movements, for which common filtering approaches fail. The analytical development of the cyclostationairty approach is straight-forward for accurately extracting the hidden periodicities in the signal returned from a patient, where existing common frequency demodulation methods and Fourier analysis would not work in the presence of high noise and body motion interference [27]-[30].
This paper is organized as follows, Doppler radar background for vital sign monitoring is presented in Section II. In Sections III and IV, the fundamental second-order cyclostationary formulation is presented for a time series and statistical approach. In Section V, simulated data is applied to validate this theory, and it is shown that the method is insensitive to SNR level and therefore robust to very low SNR and notable random body motion.
II Radar Doppler Background
A Doppler radar vital sign sensing transceiver transmits a CW radio signal and receives a motion-modulated signal reflected from the moving chest wall of the subject. Two main periodic motions due to heart beat and respiration affect the chest motion. These two motions can be modeled as, respectively,
| (1) |
and
| (2) |
where parameters , , , and are, respectively, the heart and respiration beat component amplitudes and frequencies. Therefore, based on the Doppler effect, the RF wave reflected from the surface of the patient’s chest, undergoes two main phase shifts proportional to the surface displacement due to these two components.
In front of the radar system with sufficient beam-width, the subject will typically have some random body movement in the and directions. For full-dimentional monitoring capability at all possible angles that a subject may move, two identical radar systems with relatively large beam-width antennas can be implemented at two corners of the room as shown in Fig. 1. In each successive time interval, the larger of the receiver signals from the two radar systems is processed. Slow movements in the overall, practical, and least informative scenario can be modeled as a one-dimensional (1-D) random process with uniform distribution in the specified interval for both directions. Therefore, 2-D random motion of the subject for each receiver is 1-D and the phase of the baseband signal for each system is affected by the sum of the 1-D random motions and residual phase noise [6]. Thus, we formulate the resulting in-phase (I) and quadrature (Q) components of the RF signal as,
| (3) | |||||
| (4) | |||||
where the signals , , and denote the phase noise and the receiver noises in the two quadrature channels, respectively, represents the dc value of the initial subject range, and denotes the wavelength of the electromagnetic probing signal. This modeling would account for all possible random body movements. The main sources of phase noise and its statistically model is discussed in Appendix A. The and noise is usually modeled as i.i.d. (identically independently distributed) Gaussian white noise with zero mean and variance .
We define two parameters to simplify subsequent formulations,
| (5) | |||
| (6) |
Because the chest moves a greater distance over a greater area due to breathing than it does for the heart beating, the amplitude of the respiration signal is typically about 100 times greater than that of the heart beat signal [2]. The resting heart rate is generally between 0.83 and 1.5 Hz (50 and 90 beats per minute), while the resting respiration rate is generally between 0.15 and 0.4 Hz (9 and 24 breaths per minute) [2].
Because of the random body motion and noise components, (3) and (4) constitute two random signals. A time-varying statistical mean of these signals is calculated as shown below,
| (7) | |||||
| (8) | |||||
where denotes the time average operator. Thus, the received vital signals are inherently non-stationary random processes, which have no obvious periodicity and hence no lines in the spectral density, so the information obtained from ordinary frequency analysis methods is limited. In the next section, we prove that with the deployment of cyclostationary theory, the rate and amplitude information can be extracted in high noise and interference, without any demodulation, filtering, or phase unwrapping. The results conducted later on simulated data will demonstrate the effectiveness of the proposed method.

III Cyclostationary Analysis of Time Series Signal
As noted, according to the Doppler effect, the reflected signal from a moving target has a modulated phase in proportion to the target position. The goal is the extraction of the heart and respiration periodic rates and amplitudes from the received modulated random signal, with the addition of minimal amounts of in-band noise. The existence of noise [, , and ] and interference resulting from random body movement [] in (3) and (4), in addition to the two periodic components (heart and respiration), cause non-stationary behavior of the signal that involves two hidden periodicities. By definition, the cyclostationary signal has a random statistically non-stationary nature, with periodic behavior in one or more of its parameters [21]. In order to show the basic cyclic structure of the received radar signals and introduce the cyclostationarity approach, we apply the analytical form of the I-Q signals obtained from the two receiver chains. It is noted that two quadrature receiver chains are used to prevent the null point problem [2]. Accordingly, the analytic signal is formulated as,
| (9) | |||||
where,
We re-express (9) as
where,
and
| (11) |
is the exponential of the random motion and phase noise, where and are assumed real and mutually independent. As noted, the noises and are zero-mean white Gaussian. The signal in (LABEL:eq:a10) is in a basic cyclic form that has cyclostationary properties and can be interpreted as an amplitude and frequency modulated (AM-FM) signal [31]. The periodic signal can be thought of as a phase modulated signal with modulating signal , where the RF signal (before modulation) has been obtained by downshifting the original RF signal, and likewise for the signal . Finally, since frequency modulation is the derivative of phase modulation, each of the signals
| (12) |
and
| (13) |
is therefore a complex baseband signal representing a real FM signal with a single tone as the modulating signal. The multiplication of these two signals is AM modulated by signal . Therefore, is an AM-FM modulated signal with amplitude and multi-carrier frequency. Signals and without any nonlinear transformation have spectral lines and therefore, would be first-order cyclostationary processes. The frequency-domain representations of and are given by [21]
| (14) | |||||
| (15) |
where is the first order Bessel function of order . Thus, the periodic signals and nominally contain all harmonics of and , with specific magnitudes given by the Bessel functions evaluated at and , respectively. The carrier frequencies of the multi-carrier AM-FM signal can be determined by convolving the impulsive spectra and . The resultant discrete spectrum contains all sums and differences of the frequencies of the original two discrete spectra; that is, all sums and differences of all harmonics of and . Thus we can write
| (16) | |||||
where is the Fourier transform of in (11). Since the signal is contaminated by strong noise terms [, , ], random body motion interference , and also the dc term (), its periodicities would be hidden, and so conventional frequency analysis methods are not suitable to extract the hidden information.
In Fig. 2 we depict one realization of the random process in (LABEL:eq:a10) for a carrier frequency of 2.4 GHz ( 0.125 cm), where the , , , and values in this example are assumed as 0.01 cm, 1 cm, 1.9 Hz, and 0.4 Hz, respectively. The variance of zero-mean white Gaussian noises and is assumed equal to 5. Phase noise is zero-mean Gaussian noise with variance 5. Random body motion is assumed a uniform random process between zero to 10 cm []. As shown in Fig. 2, there is no visible periodicity in the signal.

Now, we turn to higher-order frequency analysis, which concentrates on the periodic features of the signal, and will prove that a signal with structure (16) is a cyclostationary signal. By definition, a signal is cyclostationary of order if and only if an th-order nonlinear transformation of the signal can be found that generates finite sine wave components [21]. In this section, we will prove that the signal is cyclostationary of second-order and the related nonlinear (quadrature) transformation to generate sine wave components is the limit periodic autocorrelation function [32]. As is obvious from (16), each one of the spectral lines is of magnitude
| (17) |
and frequency , being carriers of an AM signal having baseband modulating signal . Therefore, the cycle frequencies of are of the conjugate type and for order 2, are equal to the second harmonics of all the multiple carrier frequencies: . All higher-order cycle frequencies are simply sums and differences of these 2nd-order cycle frequencies, and contain no new information about the cyclostationarity of this signal. Therefore, this signal has two periodic components and so is called second-order cyclostationary [21]. Accordingly, any attempt to apply the cyclostationarity approach should use the second-order cyclostationarity properties, i.e., the instantaneous conjugate autocorrelation or conjugate spectral correlation functions. The limit periodic autocorrelation functions of signals and are expressed as [32]:
| (18) | |||||
| (19) | |||||
where and . In Appendix A, it is proved that the autocorrelation function of signal is a function of the lag index only. Therefore, the overall limit periodic autocorrelation function is written,
| (20) | |||||
Since the limit periodic autocorrelation function of the signal has lines in its spectral analysis, the signal is almost second-order cyclostationary with frequencies and [21]. Now to seek the hidden frequencies, it is helpful to localize the correlation of frequency-shifted signals for a cyclostationary random signal in the frequency domain. The cyclic-auto-correlation function of is the Fourier coefficient of the limit periodic autocorrelation function at cyclo-frequency . Therefore, the overall cyclic autocorrelation function is expressed,
| (21) | |||||
Since the noises and are assumed white, the autocorrelation functions of and are delta functions. Moreover, the spectral correlation function (SCF) of the second-order cyclostationary signal is the Fourier transform of (21), and is expressed as [21]
| (22) | |||||
According to (21), the function involves all frequencies and, therefore, the SCF is a 2-D function that has all of the frequencies along one axis, showing discrete hidden frequencies and harmonics, and cyclic frequency along the other axis. The function, which is the Fourier transform of the motion and phase noise, acts as multiplicative noise for the delta functions, and terms of and which are the Fourier transforms of and respectively, are two constants that don’t affect the delta functions except at very low SNR. Moreover the SCF of the cyclostationary signal along the cyclic axis is insensitive to all of the noncyclic components. Cyclostationary theory can be used as a powerful tool to extract the cyclic frequencies from noisy non-stationary signals independent of the SNR level.
IV Statistical Cyclostationary Analysis
In Section III, the second-order cyclostationary property of the received radar signal was proven in a time series analysis. Now, a statistical approach is presented to prove the cyclostationary property for an ensemble in terms of expected value. According to [32], the joint fraction-of-time amplitude distribution for a time series is defined by,
| (23) | |||||
where is the unit-step function and is the least common multiple of and . So the joint fraction-of-time amplitude density for typical is expressed as,
| (24) |
where both and are jointly periodic with respect to both time variables and , over period . It is shown in [32] that the probabilistic autocorrelation is given by,
| (25) | |||||
Therefore, from this and (20), the limit period autocorrelation can be interpreted as the probabilistic autocorrelation,
| (26) |
Moreover, this expected value can be interpreted as an ensemble average [32]. According to the limit periodic autocorrelation function in (20) and its Fourier transforms in (21) and (22), it is proven that the heart and respiration frequencies can be extracted independent of SNR level using the statistical approach.
Since the peak-to-peak chest motion due to heart beat is about 0.5 mm whereas that due to respiration ranges from 4 mm to 12 mm [2], the values of and in (5) and (6) at a nominal RF frequency of 2.4 GHz would be 0.0502 and in the range of 0.401 to 1.205, respectively. Out of all possible combinations over the respective ratios of spectral lines (22), we search for the highest values of over these ranges of the and parameters. It can be shown that if the relation of heart and respiration amplitudes is assumed as noted above, i.e , then the largest values of and respective frequencies are ordered as shown in Table 1. Therefore, the heart amplitude can be found from and relations and the respiration amplitude obtained from and relations.
| Order of peaks | Amplitude | Frequency |
|---|---|---|
| 0 | ||
Simulation results will show that the hidden frequencies from the signal contaminated by high noise and random body motion can be accurately extracted without any filtering, demodulation, or phase unwrapping, and are also insensitive to SNR level.
V Simulation Results
In this section, we demonstrate the robustness of the cyclostaionary approach to vital-sign detection in heart and respiration monitoring for typical receiver signals in Doppler radar systems. The spectral correlation exhibited by cyclostationary or almost-cyclostationary processes is completely characterized by the cyclic spectra or equivalently by the cyclic auto-correlation [21]. In practice, the cyclic-spectral density must be estimated because the signals being considered are defined over a finite time interval , and therefore, the cyclic spectral density cannot be measured exactly. Estimates of the cyclic spectral density are obtained via a time-smoothing technique [33]:
| (27) |
where
| (28) |
is the total observation time of the signal, is the short-time FFT window length, and
| (29) |
Two examples with different SNR and SINR (signal-to-interference-plus-noise ratio) values will be simulated. Here we define SNR as the ratio of (heart or respiration) signal power to ( or ) receiver noise power, and the SINR as the ratio of (heart or respiration) signal power to the sum of the powers of motion interference and phase noise . We assume that is 1-D random motion with uniform distribution in the or direction, the sources of the phase noise are of the type for which it has been proved that is stationary (Appendix A), and and are assumed i.i.d Gaussian white noise with zero mean and variance . The first example is for the signal that is plotted in Fig. 2. With the parameter values assumed for this signal, the SNR and SINR are both equal to –30 dB for the heart signal and –10 dB for the respiration signal.
A plot of the power spectral density of this signal obtained, using an -point DFT MATLAB function with = 131072, is shown in Fig. 3. As can be seen, there is no information in the spectral density of the received signal about the heart and respiration frequencies and amplitudes.


(a)
(b)
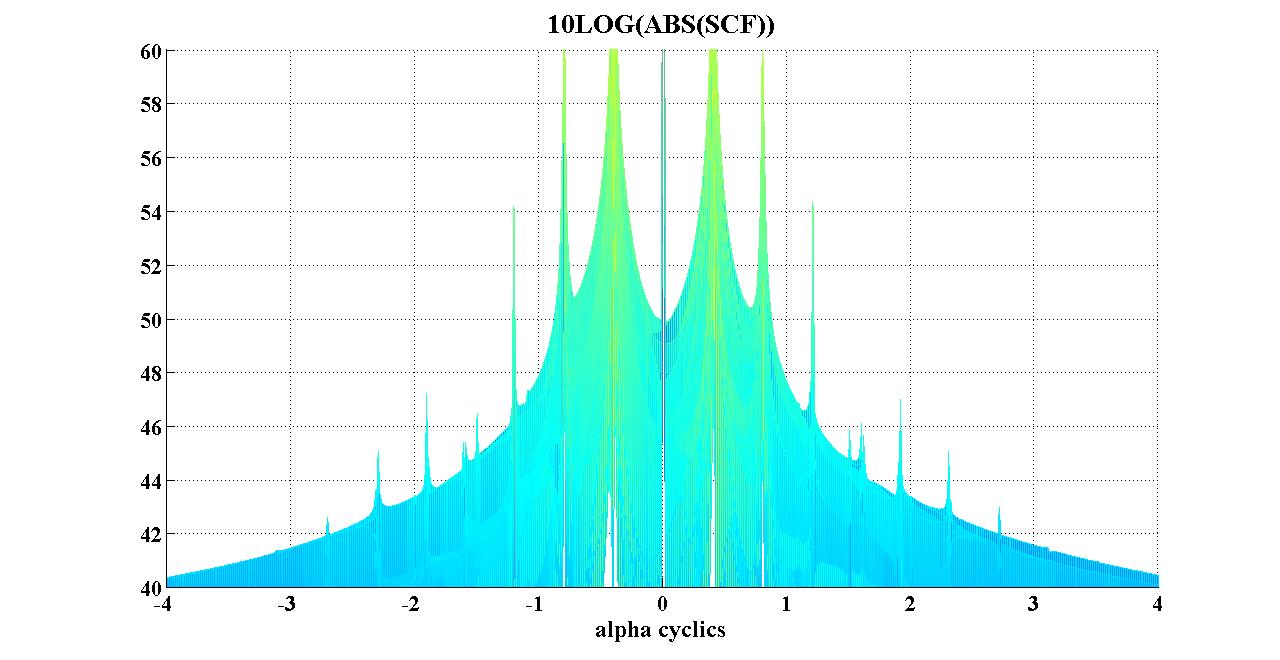
The SCF function (27) of this signal is shown in Fig. 4 and indicates that the signal has a continuous frequency distribution due to the non-stationary nature at the frequency axis for and a discrete cyclic distribution due to the cyclostationary nature at the cyclic frequency axis for .
In the second example, the and frequencies are assumed equal to 1.6 and 0.7, respectively, and the heart and respiration amplitudes equal to 0.45 mm and 7 mm respectively. With normal values of SNR = SINR = –40 dB for the heart signal and SNR = SINR = –20 dB for the respiration signal, the heart and respiration frequencies and amplitudes obtained are equal to 1.622 Hz, 0.712 Hz, 0.462 mm and 9.31 mm, respectively.
VI Experiment Setup
Fig.5 shows the designed 2.4GHz miniature radar sensor with the size of 5cm 5cm. The radar sensor was configured with a ZigBee module for wireless data transmission, which allows wireless monitoring of the heartbeat and respiration of the subject. This CW Doppler radar system is AC-coupled and the configuration of homodyne direct conversion architecture was adopted to design it. The output I/Q signal will be amplified by an operational amplifier (OP) and read out by an NI-DAQ [24]. The three lead Tektronix 412 ECG is used as reference system to validate the measurement errors.
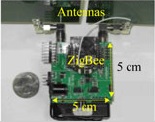
We used two of these systems at two corners to cover the space around the subject in both two directions. Fig.6.

At first test, the stationary subject stand at 1m distance from both of two systems and data was recorded every 0.05s during 90s. I and Q recorded signals are shown in Fig.7.
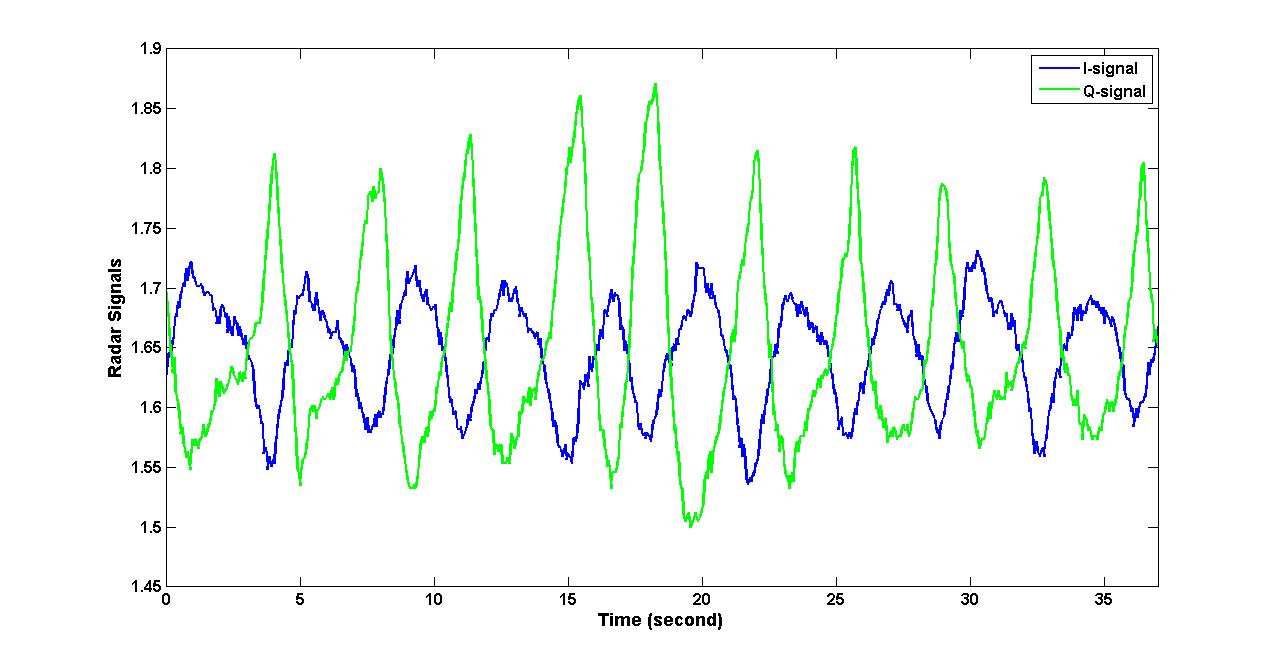
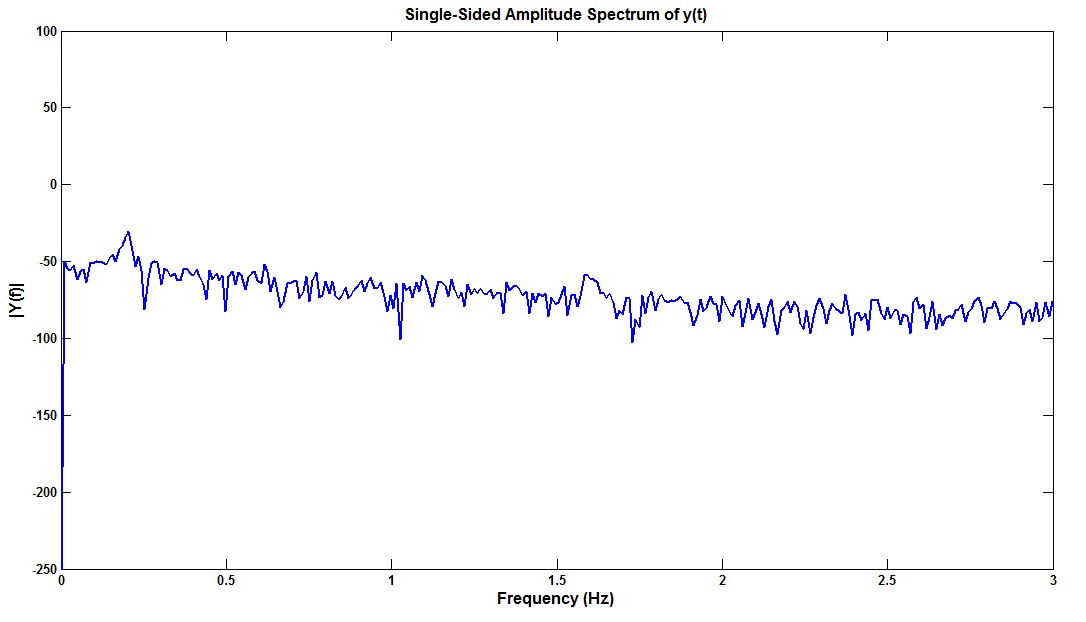
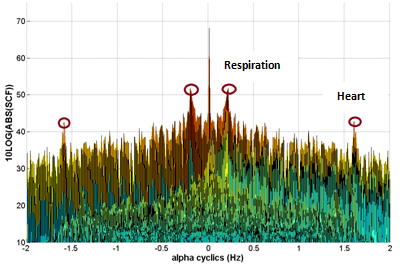
These signals are amplitude and frequency modulated with heart beat and respiration chest wall motions. We apply FFT and cyclostationary algorithms to extract the heart and respiration information from modulated signals. The spectrum and SCF graph of analytical signal is shown in Fig.8. It can be seen that the heart and respiration peaks could not be shown using FFT analysis but two peaks of heart and respiration are obvious in the SCF graph.
(a)
(b)
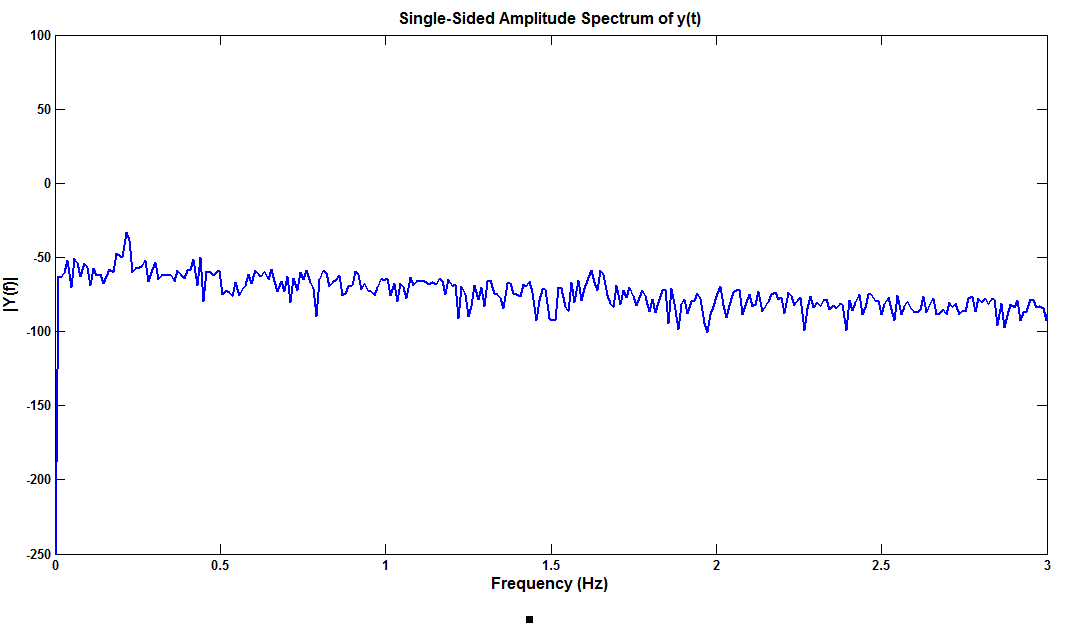
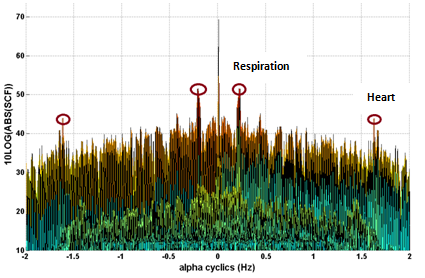
The second experiment is due the person which has slightly movement in front of the systems. The amounts of body movement dose not proceed from 10 cm in line of sight of the radar system. The effect of movement is addition of noise in spectrum but it is canceled in SCF graph with acceptable level of performance. Fig.9.
(a)
(b)
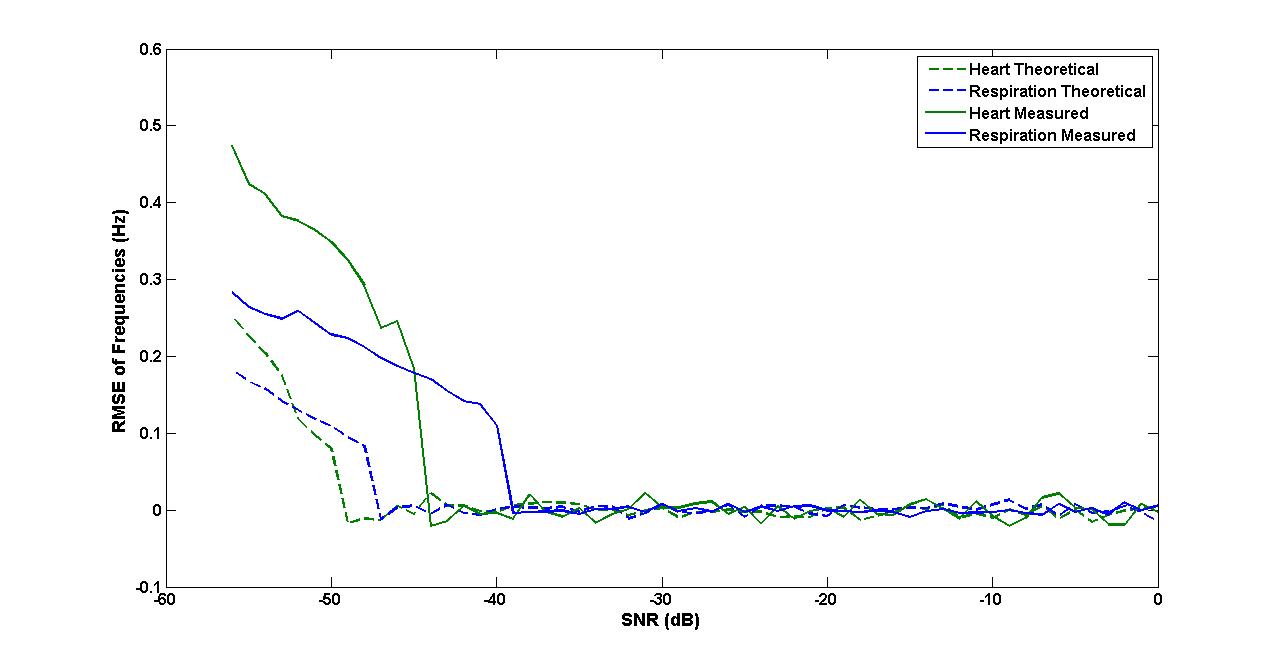
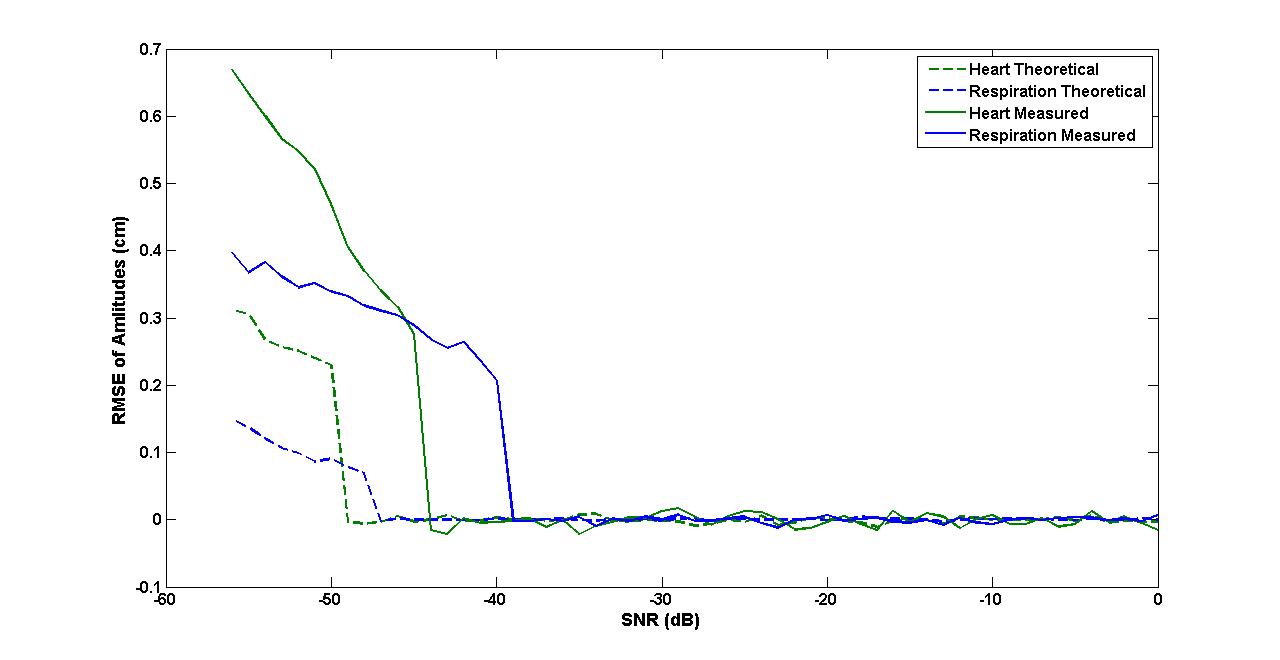
Fig. 10 show how the root mean square error (RMSE) of the frequency and amplitude estimates varies with the SNR.
(a)
(b)
As previously noted, after the threshold has been reached, the simulation results indicate that the cyclostationary analysis is insensitive to the level of SNR and can accurately extract vital-sign information even with low SNR and SINR. At very low SNR the signal will eventually fade in multiplicative noise, so the error then increase. It is also noted that at very low SNR, the delta function near the offsets and , defined in (22), would be reduced, so the error is high [25].
VII Conclusion
We have shown that by applying cyclostationary theory to a complex radar signal, the heart and respiration rates and amplitudes can be accurately estimated. By the fact that rate detection should be robust at low SNR such as in environments with high noise, long ranges, and weak signals, or in situations where body motion is large, common signal processing tools and time-frequency approaches fail to extract the periodic components information, whereas vital sign detection using cyclostationary theory, would be insensitive to SNR levels, without any needing phase unwrapping or demodulation.
Appendix A
In this appendix, we prove that the auto-correlation function of signal in (11), is independent of time. First it is necessary to model phase noise and also random motion of the subject. There are three main sources of noise in a Doppler radar system [2]:
-
1.
: Residual phase noise from the RF oscillator
-
2.
: RF AWGN
-
3.
: flicker noise from the mixer and baseband circuit
These noise sources are uncorrelated and therefore, when they have been converted to baseband, their powers are additive. The three baseband noise powers are formulated as follows. The baseband noise power from residual phase noise is expressed
| (30) | |||||
where , , , , and are the transmitted power, antenna gain, receiver gain, mixer conversion gain, radar cross section of the target, and 1-Hz intercept of the phase noise spectrum, respectively. The down-converted RF AWGN noise can be formulated as,
| (31) |
where , , and are, respectively, the noise figure of the receiver, Boltzman’s constant, absolute temperature, and bandwidth, Finally, the baseband flicker noise is written
| (32) |
where is the noise power in a 1-Hz bandwidth centered at 1 Hz. To prove time-invariance of the autocorrelation function of , we express,
where
and
| (35) |
According to [34], the residual phase noise for a free-running oscillator is a non-stationary random process, but is modeled as stationary. The noise is white Gaussian and the is approximated as stationary random noise [2]. By applying the statistical method for linearization of exponential functions of random variables [34], transformation of a random variable with mean and variance to the random variable can be approximated by the random variable , where the and parameters can be calculated. Therefore, the exponential function is also approximately stationary, and thus is stationary.
As noted, the Doppler effect resulting from random motion in the overall, practical, and least-informative scenario can be modeled as a 1-D random process, uniformly distributed in the specified interval for both directions. With this assumption and by applying the linearization method, the random variable also has uniform distribution. Therefore, is also stationary, and consequently, the autocorrelation function of is a function of the lag index only.
Acknowledgment
A deep sense of gratitude is expressed to Professor D.R. Morgan for his invaluable help and guidance through some of the issues given in successfully completion of this study. We also appreciate the efforts by Dr. Yang Zhang and Ms. Yiran Li for the hardware setup.
References
- [1] M. F. Hilton, R. A. Bates, K. R. Godfrey, M. J. Chappell, and R. M. Cayton, “Evaluation of frequency and time-frequency spectral analysis of heart rate variability as a diagnostic marker of the sleep apnea syndrome,” Med. Biol. Eng. Comput., vol. 37, no. 6, pp. 760-769, 1999.
- [2] A. Droitcour, “Non-contact measurement of heart and respiration rates with single-chip microwave Doppler radar,” Ph.D dissertation, Dept. Elect. Eng., Stanford University, Stanford, CA, 2006.
- [3] K. Chen, J. Zhang, and A. Norman, “Microwave life-detection systems for searching human subjects under earthquake rubble or behind barrier,” IEEE Trans. Biomed. Eng., vol. 47, no. 1, pp. 105-114, Jan. 2000.
- [4] S. Bakhtiari, N. Gopalsami, T. W. Elmer, and A. C. Raptis, “Millimeter wave sensor for far-field standoff vibrometry,” in Proc. AIP Conf., vol. 1096 , July 2008, pp. 1641-1648.
- [5] V. M. Lubecke, O. Boric-Lubecke, A. Host-Madsen, and A. E. Fathy, “Through-the-wall radar life detection and monitoring,” in IEEE MTT-S Int. Microw. Symp. Dig., May 2007, pp. 769-772.
- [6] S. Bakhtiari, S. Liao, T. Elmer, N. Sami Gopalsami, and A. C. Raptis, “A real-time heart rate analysis for a remote millimeter wave I-Q sensor,” Trans. Biomedi. Eng., pp. 1839 - 1845, vol.58, no.6, June 2011.
- [7] C. Li and J. Lin, “Random body movement cancellation in Doppler radar vital sign detection,” IEEE Trans. Microw. Theory Tech., vol. 56, no. 12, pp. 3143-3152, Dec. 2008.
- [8] B.-K. Park, O. Boric-Lubecke, and V. M. Lubecke, “Arctangent demodulation with dc offset compensation in quadrature Doppler radar receiver systems,” IEEE Trans. Microw. Theory Tech., vol. 55, no. 5, pp. 1073-1079, May 2007.
- [9] H. J. Kim, K. H. Kim, Y. S. Hong, and J. J. Choi, “Measurement of human heartbeat and respiration signals using phase detection radar,” Rev .Sci. Instrum., vol. 78, no. 10, pp. 104703-104703-3, Oct 2007.
- [10] F. E Churchill, G. W. Ogar, and B. J, Thompson, “The correction of I and Q errors in a coherent processor,” IEEE Trans. Aerosp. Electron. Syst., vol. AES-17, no. 1, pp 131-137, Jan. 1981.
- [11] D. G. Brennan, “Linear diversity combining techniques,” Proc.IEEE, vol. 91, pp. 331-356, Feb. 2003.
- [12] O. Boric-Lubecke, V. M. Lubecke, I. Mostafanezhad1, B.Kwon Park, W. Massagram, and B. Jokanovic, “Doppler radar architectures and signal processing for heart rate extraction,” Microw. Rev., vol. 15, no. 2, pp. 12-17, 2009.
- [13] B.-K. Park, V. Lubecke, O. Boric-Lubecke, and A. Host-Madsen, “Center tracking quadrature demodulation for Doppler radar motion detector,” in Proc. IEEE/MTT-S Int. Microwave Symposium, Jun. 2007, pp. 1323- 1326.
- [14] N. Chernov, and C. Lesort, “Least squares fitting of circles”, Math. Imaging Vision, vol. 23, no. 3, pp. 239-252, Nov. 2005.
- [15] M. Zakrzewski, H. Raittinen, and J. Vanhala, “Comparison of center estimation algorithms for heart and respiration monitoring with microwave Doppler radar,” IEEE Sensors, vol. 12, no. 3, pp. 627-634, Mar. 2012.
- [16] A. Host-Madsen, N. Petrochilos, O. Boric-Lubecke, V. M. Lubecke, B. K. Park, and Q. Zhou, “Signal processing methods for Doppler radar heart rate monitoring,” in D. Mandic et al (Eds): Signal Processing Techniques for Knowledge Extraction and Information Fusion. Springer-Verlag, Berlin, 2008.
- [17] W. Massagram, N. Hafner, B.-K. Park, O. Boric-Lubecke, A. Host-Madsen, and V. Lubecke, “Feasibility of heart rate variability measurement from quadrature Doppler radar using arctangent demodulation with DC offset compensation,” in Proc. 29th IEEE Ann. Int. Conf Eng. In Medicine and Biology Society, Aug. 2007, pp. 1643-1646.
- [18] W. Massagram, V. Lubecke, A. Host-Madsen, and O. Boric-Lubecke, “Assessment of heart rate variability and respiratory sinus arrhythmia via Doppler radar,” IEEE Trans. Microw. Theory Tech., vol. 57, no. 10, pp. 2542-2549, Oct. 2009.
- [19] C. Li, and J. Lin, “Complex signal demodulation and random body movement cancellation techniques for non-contact vital sign detection,” in Proc. IEEE/MTT-S Int. Microwave Symposium, Jun. 2008, pp. 567- 570.
- [20] D. R. Morgan and M. G. Zierdt, “Novel signal processing techniques for Doppler radar cardiopulmonary sensing,” Signal Processing, vol. 89, no. 1, pp. 45-66, Jan. 2009.
- [21] W. A. Gardner, Statistical Spectral Analysis: A Nonprobabilistic Theory, Prentice-Hall, Englewood Cliffs, NJ, 1987.
- [22] G .B. Giannakis, ”Cyclostationary signal analysis” in: V.K. Madisetti, D.B. Williams (Eds.), The Digital Signal Processing Handbook, CRC Press. and IEEE Press., Boca Raton, FL and New York, 1998, Chap. 17.
- [23] M. Derakhshani, “Efficient cooperative cyclostationary spectrum sensing in cognitive radios at low snr regimes,” IEEE Trans. Wireless Commun., vol. 10, no. 11, pp. 3754-3764, Nov. 2011.
- [24] C. Gu, R. Li, H. Zhang,A. Y. C. Fung, C. Torres, S. B. Jiang, C.Li, ”Accurate respiration measurement using DC-coupled continuous-wave radar sensor for motion-adaptive cancer radiotherapy,” IEEE Trans Biomed Eng., vol. 59. no. 11, pp. 3117-3123, Nov. 2012.
- [25] H. Sadeghi, “Cyclostationarity-based cooperative spectrum sensing for cognitive radio networks,” in Proc. International Symposium on Telecommunications (IST), 27-28 Aug. 2008, pp. 429-434.
- [26] Z. Quan, “Optimal spectral feature detection for spectrum sensing at very low SNR,” IEEE Trans. Commun., vol. 59, no. 1, pp. 201-212, Jan. 2011.
- [27] L. R. Rabiner, M. J. Chang, A. E. Rosenberg, and C. A. McGonegal, “A comparative performance study of several pitch detection algorithms,” IEEE Trans. Acoust., Speech, Signal Process., vol. ASSP-24, no. 5, pp. 399-418, Oct. 1976.
- [28] B. G. Quinn and E. J. Hannan, The Estimation and Tracking of Frequency, Cambridge, U.K.: Cambridge Univ. Press., 2001.
- [29] P. D. Welch, “The use of fast Fourier transform for the estimation of power spectra: A method based on time averaging over short, modified periodograms,” IEEE Trans. Audio Electroacoust., vol. AU-15, pp. 70-73, Jun. 1967.
- [30] R. O. Schmidt, “Multiple emitter location and signal parameter estimation,” IEEE Trans. Antennas Propagat., vol. AP-34, pp. 276-290, Mar. 1986.
- [31] B. P. Lathi, Modern Digital and Analog Communication Systems, Oxford University Press., 1998.
- [32] W. A. Gardner. “The spectral correlation theory of cyclostationary time-series,” IEEE Trans., Commun., vol. 11, pp. 13 36, Jul. 1986.
- [33] E. Perez Serna, S. Thombre, M. Valkama, S. Lohan, V. Syrj l , M. Detratti, H. Hurskainen, aand J. Nurmi, ”Local oscillator phase noise effects on GNSS code tracking,” Inside GNSS, pp. 52-62, vol. Nov./Dec. 2010.
- [34] J. Farison, “Approximation of exponential functions of random variables by statistical linearization,” IEEE Trans. Autom. Control, vol. 13, pp. 174-178, Apr. 1968.