DPF2013-93 March 12, 2024

Production and spectroscopy of hadrons containing a b quark at ATLAS

Rui Wang111This work was supported by the US Department of Energy.

Department of Physics and Astronomy
University of New Mexico, Albuquerque, NM, USA, 87131

On behalf of the ATLAS Collaboration.

We present studies of the production and spectroscopy of some members of the B-hadron family. We reconstruct B ground states in their hadronic decay modes with a J/Οˆπ½πœ“J/\psi or Ξ₯Ξ₯\Upsilon in the final state. These studies are based on the 2011 7 TeV dataset collected by the ATLAS detector.

PRESENTED AT


DPF 2013
The Meeting of the American Physical Society
Division of Particles and Fields
Santa Cruz, California, August 13–17, 2013

1 Introduction

The production of B-hadrons at the Large Hadron Collider (LHC) provides particular challenges and opportunities for insight into Quantum Chromodynamics (QCD), especially as a probe of the properties of the fundamental constituents of matter and their interactions in a new energy regime. Mesons and baryons containing a b quark can be seen as the hydrogen and helium atoms of QCD, therefore the measurement of their spectra plays an especially important role in understanding the strong interactions. The characteristices of b-hadrons at the LHC can also give input for tuning models and refining event generators in a new energy regime.

The most important elements of the ATLAS detector for B physics measurements are the Inner Detector (ID) tracker, the Electromagnetic Calorimeter, and the Muon Spectrometer (MS); details can be found in [1]. Dedicated B physics triggers are based on both single muons and di-muons with different thresholds and mass ranges.

2 Measurement of the B+superscript𝐡B^{+} production cross-section

Refer to caption
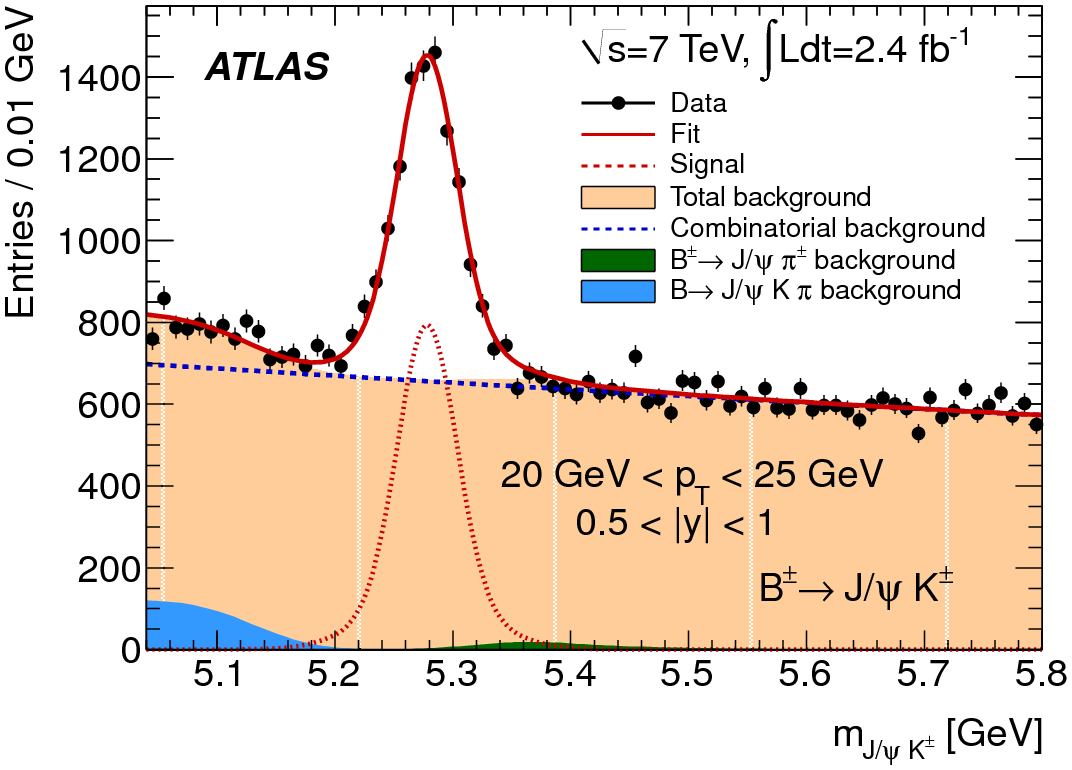
Figure 1: The observed invariant mass distribution of BΒ±superscript𝐡plus-or-minusB^{\pm} candidates, mJ/Οˆβ€‹KΒ±subscriptπ‘šπ½πœ“superscript𝐾plus-or-minusm_{J/\psi K^{\pm}}, with transverse momentum and rapidity in the range 20 GeV <pT<absentsubscript𝑝𝑇absent<p_{T}< 25 GeV, 0.5 <|y|<absent𝑦absent<|y|< 1 (dots), compared to the binned maximum likelihood fit (solid line). The error bars represent the statistical uncertainty. Also shown are the components of the fit as described in the legend.

Several B-hadron production cross sections have been measured [2, 3, 4, 5, 6, 7, 8, 9, 10, 11, 12, 13], but the theoretical uncertainty remains up to 40% due to uncertainty in the factorization and renormalization scales of the b-quark production, and the b-quark mass mbsubscriptπ‘šπ‘m_{b} [14]. The LHC provides an opportunity to perform more precise measurements of B-hadron production cross-sections. Also the B-hadron production cross-section measurements in pp collisions at the LHC can provide tests of QCD calculations for heavy-quark production at high center-of-mass energies and in wide transverse momentum (pTsubscript𝑝𝑇p_{T}) and rapidity (y𝑦y) ranges.

Refer to caption
Refer to caption
Refer to caption
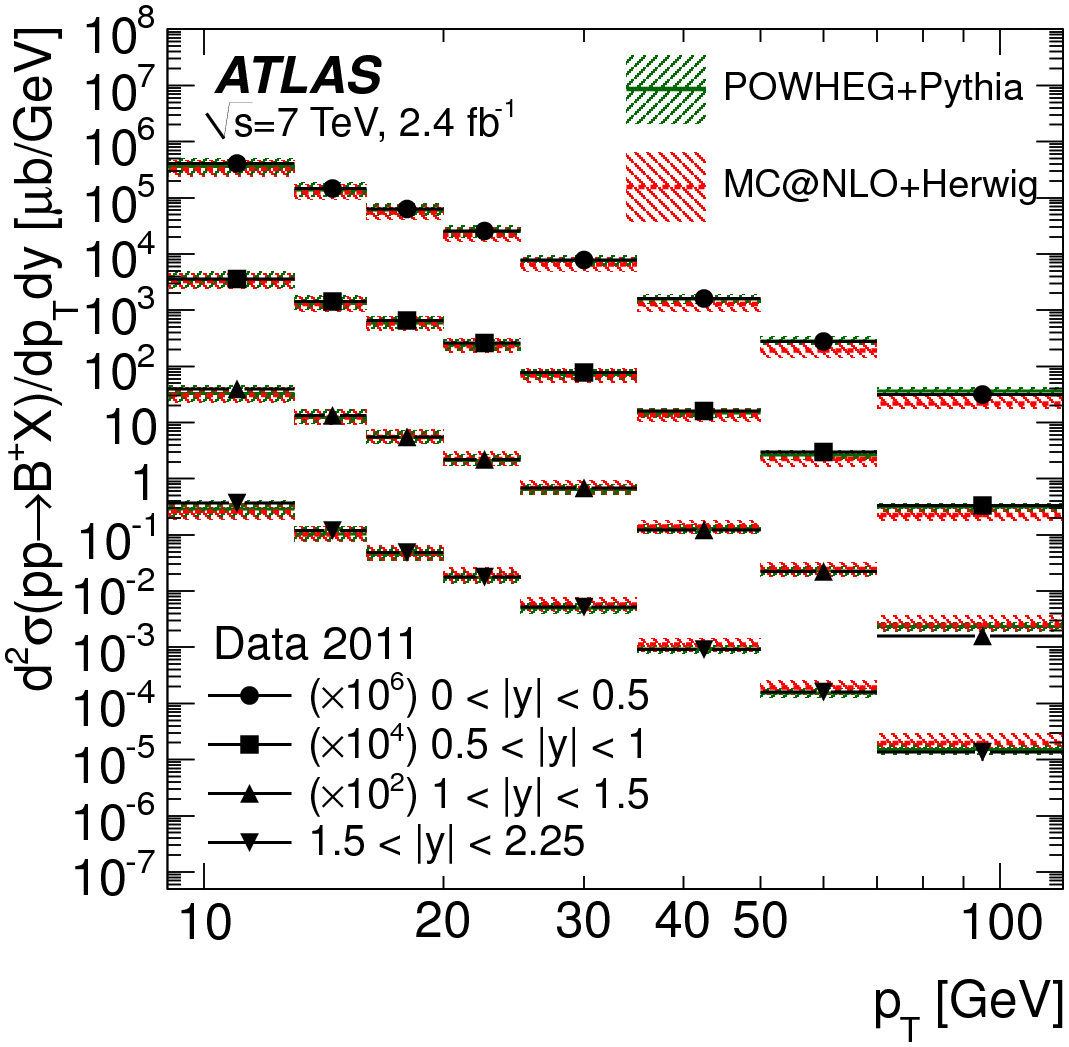
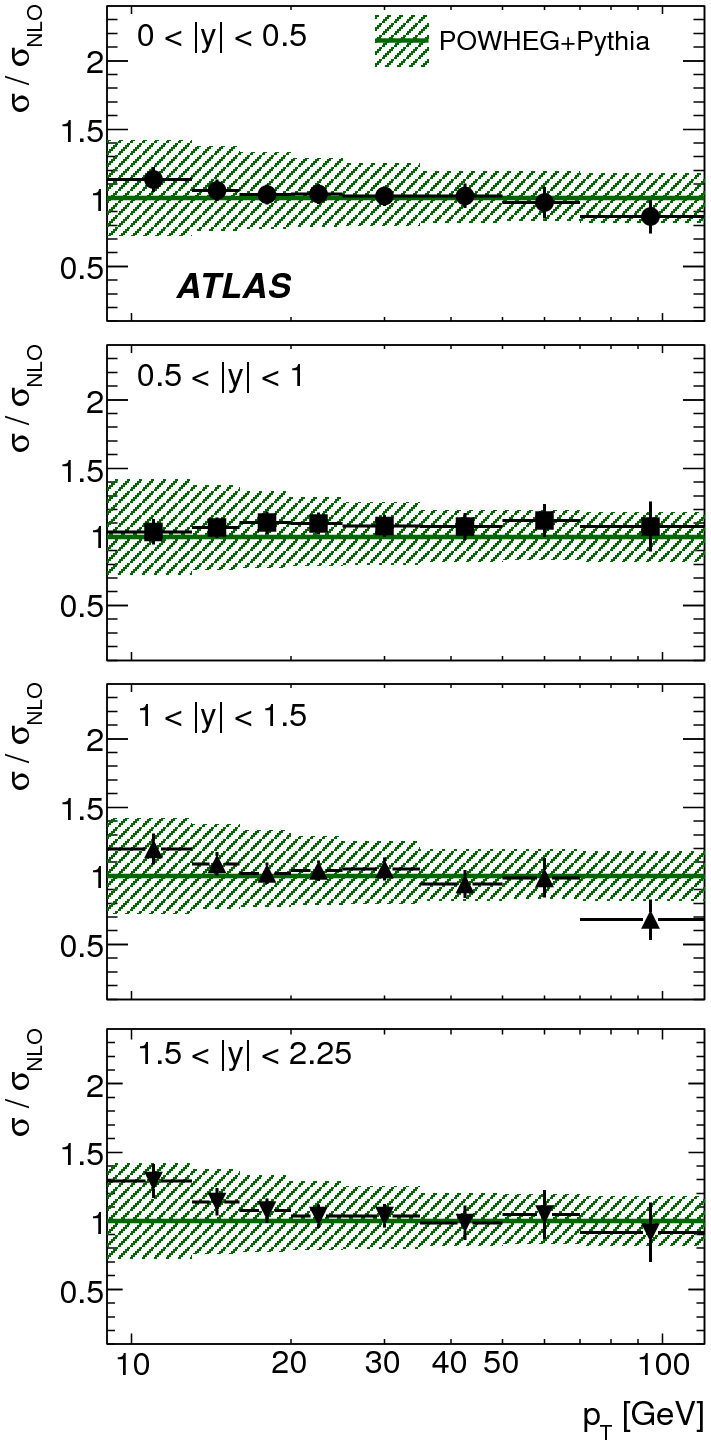
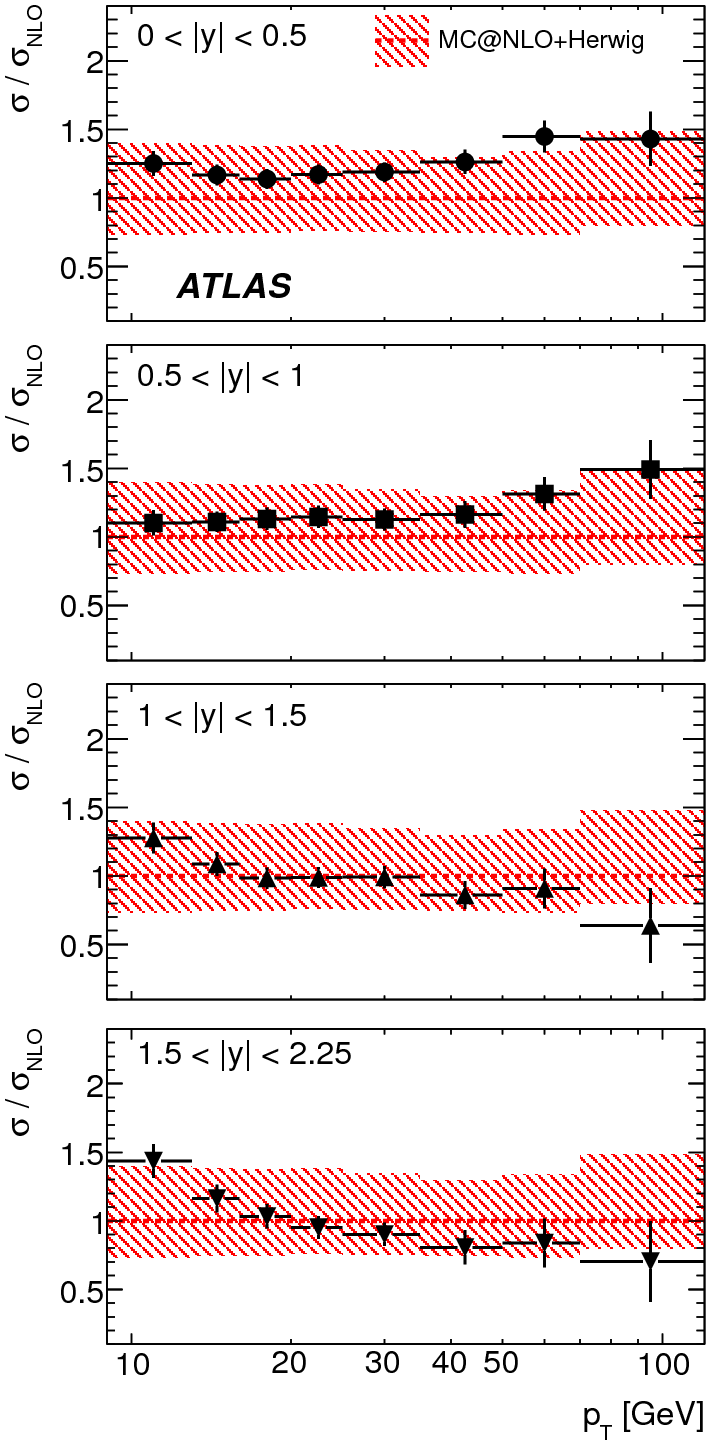
Figure 2: (a) The doubly-differential cross-section for B+superscript𝐡B^{+} production as a function of pTsubscript𝑝𝑇p_{T} and y𝑦y, averaged over each (pTsubscript𝑝𝑇p_{T}, y𝑦y) interval and quoted at its center. The data points are compared to NLO predictions from POWHEG and MC@NLO. The shaded areas around the theoretical predictions reflect the uncertainty from renormalization and factorization scales and the b-quark mass. The ratio of the measured cross-section to the theoretical predictions (Οƒ/ΟƒN​L​O𝜎subscriptπœŽπ‘πΏπ‘‚\sigma/\sigma_{NLO}) of POWHEG (b) and MC@NLO (c) in eight pTsubscript𝑝𝑇p_{T} intervals in four rapidity ranges is shown. The points with error bars correspond to data with their associated uncertainties, which is the combination of the statistical and systematic uncertainty. The shaded areas around the theoretical predictions reflect the uncertainty from renormalization and factorization scales and the b-quark mass.
Refer to caption
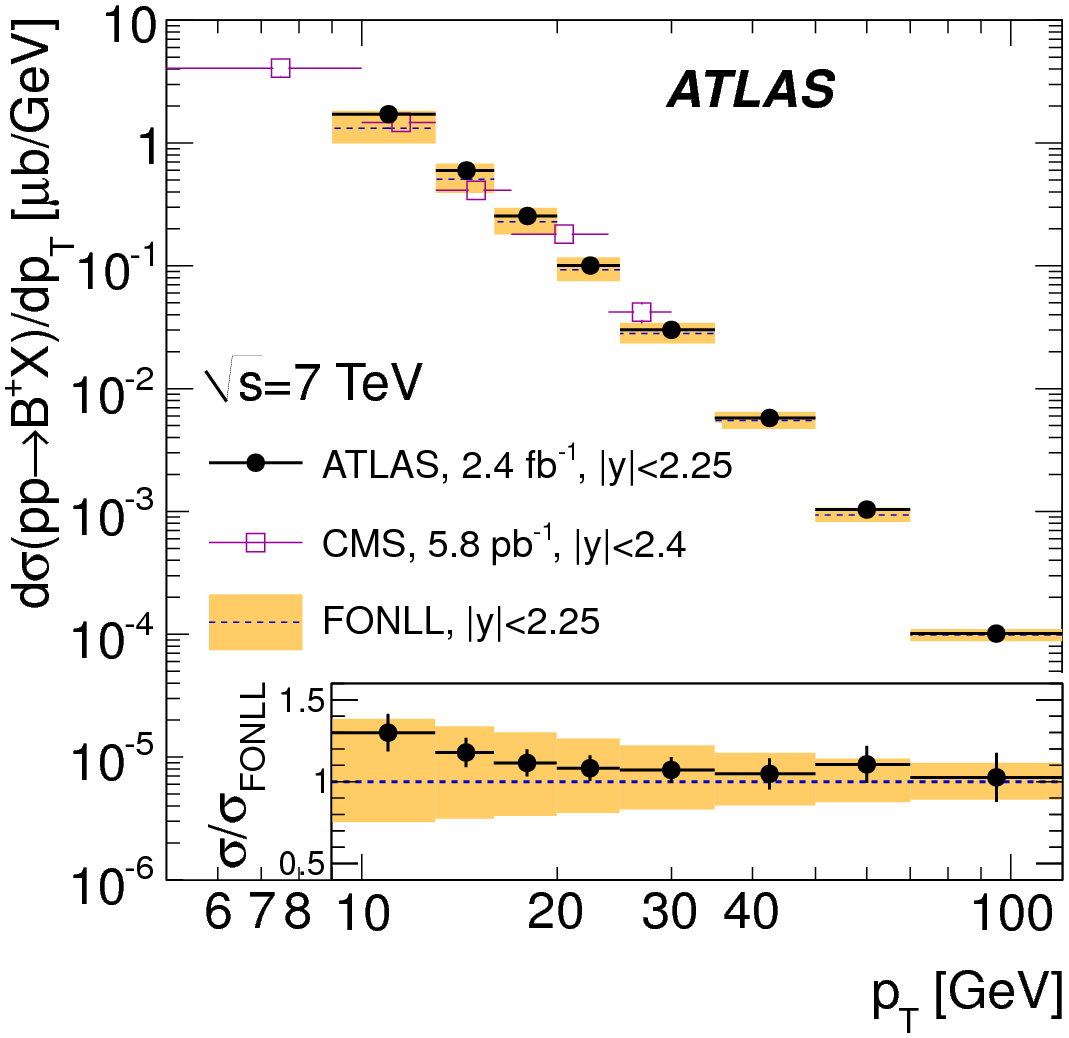
Figure 3: The differential cross-section for B+superscript𝐡B^{+} production versus pTsubscript𝑝𝑇p_{T}, integrated over rapidity. The solid points with error bars correspond to the differential cross-section measurement by ATLAS with total uncertainty (statistical and systematic) in the rapidity range |y|<𝑦absent|y|< 2.25, averaged over each pTsubscript𝑝𝑇p_{T} interval and quoted at its center. For comparison, data points from CMS are also shown, for a measurement covering pT<subscript𝑝𝑇absentp_{T}< 30 GeV and |y|<𝑦absent|y|< 2.4 [23]. Predictions of the FONLL calculation for b-quark production are also compared with the data, assuming a hadronization fraction fbβ†’B+subscript𝑓→𝑏superscript𝐡f_{b\rightarrow B^{+}} of (40.1Β±0.8)%percentplus-or-minus40.10.8(40.1\pm 0.8)\% [24] to fix the overall scale. Also shown is the ratio of the measured cross-section to the predictions by the FONLL calculation (Οƒ/ΟƒF​O​N​L​L𝜎subscriptπœŽπΉπ‘‚π‘πΏπΏ\sigma/\sigma_{FONLL}). The upper and lower uncertainty limits on the prediction were obtained by considering scale and b-quark mass variations.

ATLAS has measured the B+superscript𝐡B^{+} production cross-section using the decay channel B+β†’J/Οˆβ€‹K+β†’superscriptπ΅π½πœ“superscript𝐾B^{+}\rightarrow J/\psi K^{+} in pp collisions at s𝑠\sqrt{s} = 7 TeV, as a function of B+superscript𝐡B^{+} transverse momentum and rapidity [15]. The measurement uses data of integrated luminosity of 2.4 f​bβˆ’1𝑓superscript𝑏1fb^{-1} recorded in early 2011 data |y|<𝑦absent|y|< 2.25 and pTsubscript𝑝𝑇p_{T} up to 100 GeV. Events were selected using a di-muon trigger where both muons are required to have pT>subscript𝑝𝑇absentp_{T}> 4 GeV and pass a loose selection requirement compatible with J/Οˆπ½πœ“J/\psi meson decay into a muon pair. The B+superscript𝐡B^{+} candidates are reconstructed from a J/Οˆπ½πœ“J/\psi candidate combined with a hadron track with pT>subscript𝑝𝑇absentp_{T}> 1 GeV and required to have pT>subscript𝑝𝑇absentp_{T}> 9 GeV, |y|<𝑦absent|y|< 2.3, and Ο‡2/Nd.o.f<superscriptπœ’2subscript𝑁formulae-sequenceπ‘‘π‘œπ‘“absent\chi^{2}/N_{d.o.f}< 6. The muon tracks and hadron tracks are required to have sufficient numbers of hits in the Pixel, Semiconductor Tracker (SCT) and Transition Radiation Tracker (TRT) detectors to ensure accurate ID measurements.

The differential cross-section for B+superscript𝐡B^{+} production is given by

d2​σ​(p​pβ†’B+​X)d​pT​d​y⋅ℬ=NB+ℒ⋅Δ​pT⋅Δ​y,β‹…superscriptd2πœŽβ†’π‘π‘superscript𝐡𝑋dsubscript𝑝𝑇d𝑦ℬsuperscript𝑁superscript𝐡⋅⋅ℒΔsubscript𝑝𝑇Δ𝑦\frac{\mathrm{d}^{2}\sigma(pp\rightarrow B^{+}X)}{\mathrm{d}p_{T}\mathrm{d}y}\cdot{\cal{B}}=\frac{N^{B^{+}}}{{{\cal L}}\cdot\Delta p_{T}\cdot\Delta y},

where NB+superscript𝑁superscript𝐡N^{B^{+}} is derived from the average yield of the two reconstructed charged states B+superscript𝐡B^{+} and Bβˆ’superscript𝐡B^{-} in each (pTsubscript𝑝𝑇p_{T}, y𝑦y) interval after correcting for detector effects and acceptance. The total number of BΒ±superscript𝐡plus-or-minusB^{\pm} events is extracted using a binned maximum likelihood fit in each (pTsubscript𝑝𝑇p_{T}, y𝑦y) bin (e.g.Β FigureΒ 1). The differential cross-section is calculated in 8 pTsubscript𝑝𝑇p_{T} bins and 4 y𝑦y bins in the full kinematic range 9 GeV <pT<absentsubscript𝑝𝑇absent<p_{T}< 120 GeV and |y|<𝑦absent|y|< 2.25 as shown in FigureΒ 2(a). The data points have been compared to next-to-leading order (NLO) [14, 16] predictions from POWHEG [17, 18] and MC@NLO [19, 20]. As shown in FigureΒ 2(b)(c), the POWHEG prediction shows good agreement with data in both cross section and shape while MC@NLO predicts a lower cross section and softer pTsubscript𝑝𝑇p_{T} spectrum at low y𝑦y and a harder pTsubscript𝑝𝑇p_{T} spectrum in high y𝑦y. The results have been compared to fixed order plus next-to-leading logarithms (FONLL) [21, 22] as well. As shown in FigureΒ 3, the FONLL prediction shows good agreement especially with pT<subscript𝑝𝑇absentp_{T}< 30 GeV, and is still compatible in the high pTsubscript𝑝𝑇p_{T} range even up to 100 GeV.

3 Bcsubscript𝐡𝑐B_{c} meson observation

The BcΒ±superscriptsubscript𝐡𝑐plus-or-minusB_{c}^{\pm} meson is a bound state of the two heave quarks able to form a stable state. Weak decays of the BcΒ±superscriptsubscript𝐡𝑐plus-or-minusB_{c}^{\pm} meson provide a unique probe of heavy quark dynamics that is inaccessible to b​b¯𝑏¯𝑏b\overline{b} or c​c¯𝑐¯𝑐c\overline{c} bound states.

Refer to caption
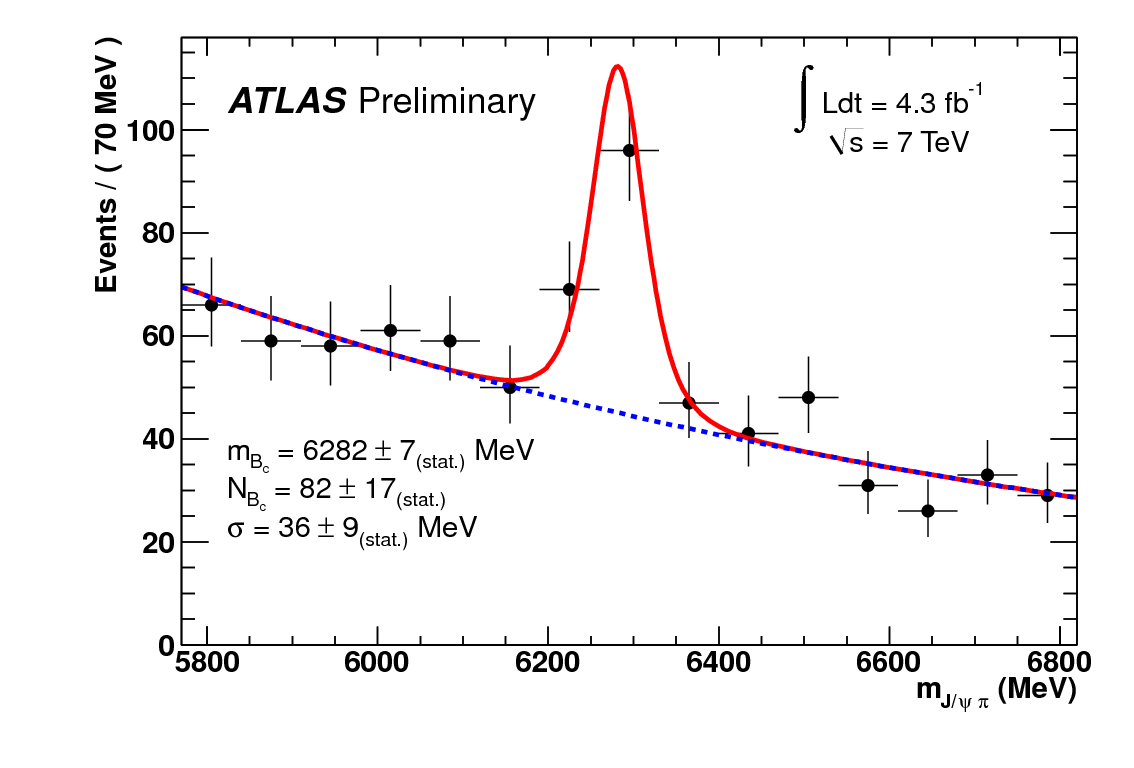
Figure 4: The invariant mass distribution of reconstructed BcΒ±β†’J/Οˆβ€‹Ο€Β±β†’superscriptsubscript𝐡𝑐plus-or-minusπ½πœ“superscriptπœ‹plus-or-minusB_{c}^{\pm}\to J/\psi\pi^{\pm} candidates. The points with error bars are the data. The solid line is the projection of the results of the unbinned maximum likelihood fit to all candidates in the mass range 5770-6820 MeV. The dashed line is the projection for the background component on the same fit.

The BcΒ±superscriptsubscript𝐡𝑐plus-or-minusB_{c}^{\pm} meson is reconstructed using ATLAS pp collision data collected in the year 2011 at s𝑠\sqrt{s} = 7 TeV using the decay mode Bcβ†’Jβ€‹Οˆβ€‹Ο€β†’subscriptπ΅π‘π½πœ“πœ‹B_{c}\rightarrow J\psi\pi [25]. Single and di-muon triggers with various transverse momentum have been used. Each muon candidate must have a track reconstructed in the MS combined with a track reconstructed in the ID. The di-muon selection requires a pair of oppositely charged muons with pT>subscript𝑝𝑇absentp_{T}> 4 GeV for both in the first half year and pT>subscript𝑝𝑇absentp_{T}> (6, 4) GeV in the second half year. Additionally they are required to pass a loose selection requirement compatible with J/Οˆπ½πœ“J/\psi meson decay into a muon pair. The Bcsubscript𝐡𝑐B_{c} candidate is reconstructed from the J/Οˆπ½πœ“J/\psi candidate combined with a hadron track with pT>subscript𝑝𝑇absentp_{T}> 4 GeV. Unlike B+superscript𝐡B^{+}, the short Bcsubscript𝐡𝑐B_{c} meson lifetime means that lifetime cuts are not efficient in separating the Bcsubscript𝐡𝑐B_{c} signal from direct J/Οˆπ½πœ“J/\psi combinations. The transverse impact parameter significance has been proven to be more efficient, and it is required to be larger than 5. The reconstructed Bcsubscript𝐡𝑐B_{c} candidates are required to have pT>subscript𝑝𝑇absentp_{T}> 15 GeV and Ο‡2/Nd.o.f<superscriptπœ’2subscript𝑁formulae-sequenceπ‘‘π‘œπ‘“absent\chi^{2}/N_{d.o.f}< 2.

With the full 2011 integrated luminosity of 4.3 f​bβˆ’1𝑓superscript𝑏1fb^{-1} of data, 82Β±17plus-or-minus821782\pm 17 Bcsubscript𝐡𝑐B_{c} ground state mesons have been extracted using an unbinned maximum likelihood fit (FigureΒ 4). The Bcsubscript𝐡𝑐B_{c} mass returned by the fit is 6282Β±7plus-or-minus628276282\pm 7 MeV, which is consistent with the PDG mass[26] of 6277Β±7plus-or-minus627776277\pm 7 MeV.

4 Measurement of the Ξ›bsubscriptΛ𝑏\Lambda_{b} lifetime and mass

Ξ›b0superscriptsubscriptΛ𝑏0\Lambda_{b}^{0} is the lightest b-baryon. Although it has been measured by many experiments [27, 28, 29], its lifetime still has large experimental uncertainty (2-3%), and the discrepancy between the CDF and D0 measurements is high (1.8ΟƒπœŽ\sigma).

Refer to caption
Refer to caption
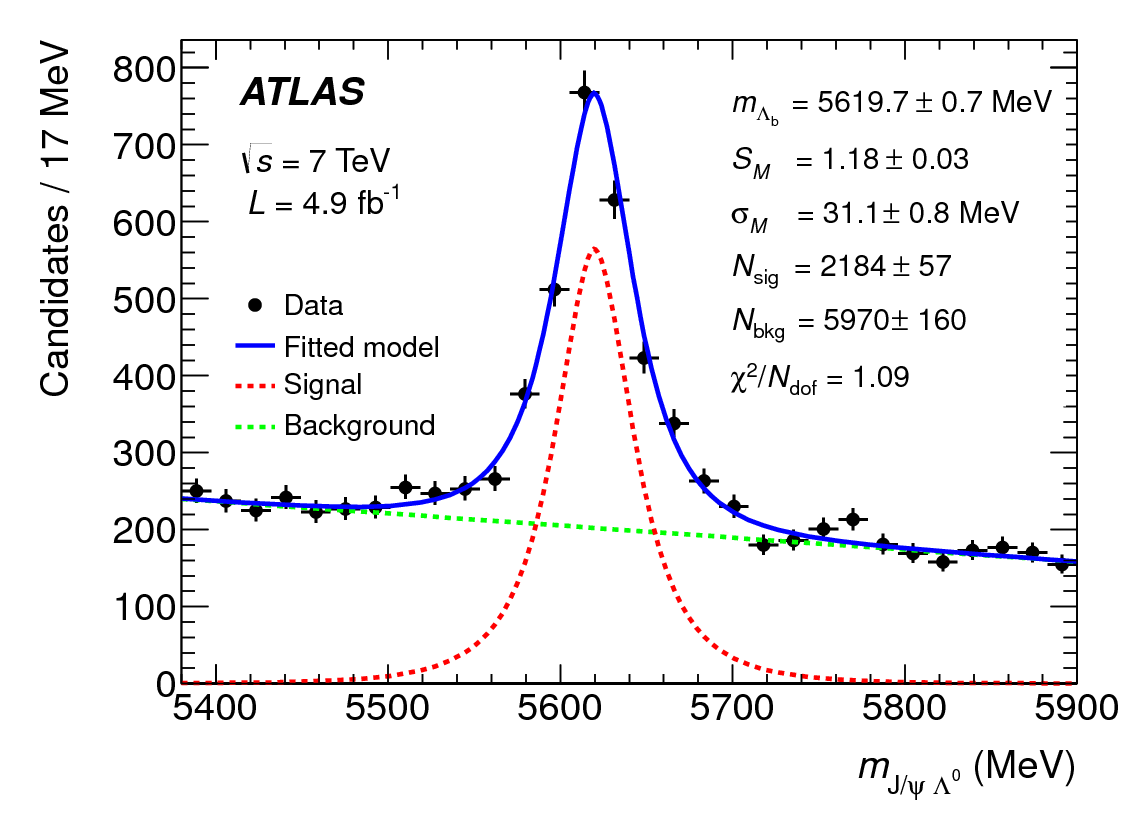
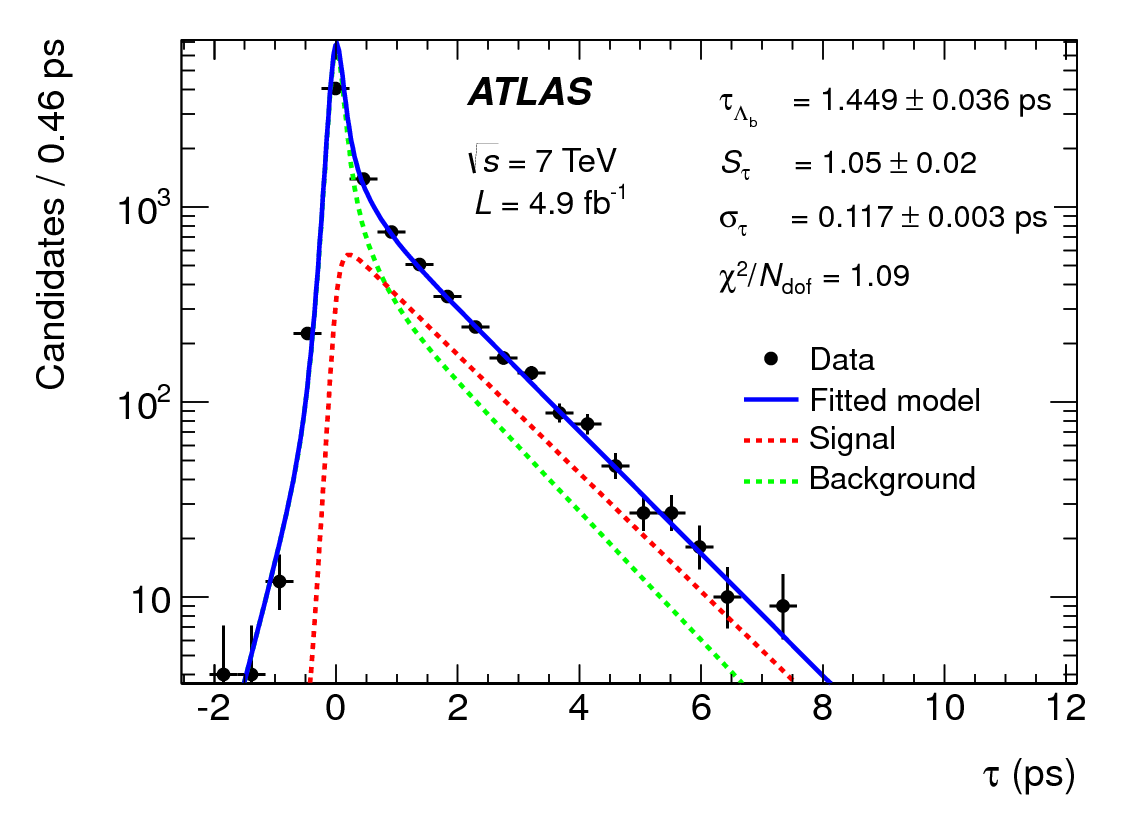
Figure 5: Projection of the fitted probability density function onto the mass (a) and the proper decay time (b) axis for Ξ›bsubscriptΛ𝑏\Lambda_{b} candidates. The displayed errors are statistical only. The Ο‡2/Nd.o.fsuperscriptπœ’2subscript𝑁formulae-sequenceπ‘‘π‘œπ‘“\chi^{2}/N_{d.o.f} value is calculated from the dataset binned in mass and decay time with the number of degrees of freedom Nd.o.fsubscript𝑁formulae-sequenceπ‘‘π‘œπ‘“N_{d.o.f} = 61.

This analysis is based on 4.9 f​bβˆ’1𝑓superscript𝑏1fb^{-1} data collected by ATLAS in 2011 using single muon and di-muon J/Οˆπ½πœ“J/\psi triggers and reconstructed through the decay channel of Ξ›b0β†’J/Οˆβ€‹(ΞΌ+β€‹ΞΌβˆ’)​Λ0,Ξ›0β†’p+β€‹Ο€βˆ’formulae-sequenceβ†’superscriptsubscriptΛ𝑏0π½πœ“superscriptπœ‡superscriptπœ‡superscriptΞ›0β†’superscriptΞ›0superscript𝑝superscriptπœ‹\Lambda_{b}^{0}\rightarrow J/\psi(\mu^{+}\mu^{-})\Lambda^{0},\leavevmode\nobreak\ \Lambda^{0}\rightarrow p^{+}\pi^{-} [30]. Muon tracks are reconstructed in the ID and identified in the MS, with pTsubscript𝑝𝑇p_{T} above 400 MeV and pseudorapidity |Ξ·|<πœ‚absent|\eta|< 2.5 required. The reconstructed J/Οˆπ½πœ“J/\psi candidates are selected within a mass window of 2.8 GeV <m​(ΞΌ+β€‹ΞΌβˆ’)<absentπ‘šsuperscriptπœ‡superscriptπœ‡absent<m(\mu^{+}\mu^{-})< 3.4 GeV with a vertex fit constrained to the J/Οˆπ½πœ“J/\psi mass of 3069.92 MeV and muon pT>subscript𝑝𝑇absentp_{T}> 4 GeV. Reconstructed Ξ›0superscriptΞ›0\Lambda^{0} candidates are selected within a mass window of 1.08 GeV <m​(p​π)<absentπ‘šπ‘πœ‹absent<m(p\pi)< 1.15 GeV with a vertex fit constrained to the Ξ›0superscriptΞ›0\Lambda^{0} mass of 1115.68 MeV; additionally the Ξ›0superscriptΞ›0\Lambda^{0} vertex is required to point to the J/Οˆπ½πœ“J/\psi vertex. Finally the Ξ›b0superscriptsubscriptΛ𝑏0\Lambda_{b}^{0} candidates are reconstructed using a cascade vertex fit applied to the four tracks ΞΌ+,ΞΌβˆ’,p,Ο€superscriptπœ‡superscriptπœ‡π‘πœ‹\mu^{+},\leavevmode\nobreak\ \mu^{-},\leavevmode\nobreak\ p,\leavevmode\nobreak\ \pi simultaneously with all the J/Οˆπ½πœ“J/\psi and Ξ›0superscriptΞ›0\Lambda^{0} constraints. For comparison, Bdsubscript𝐡𝑑B_{d} candidates with similar topology are reconstructed as well. The reconstructed Ξ›b0superscriptsubscriptΛ𝑏0\Lambda_{b}^{0} candidates are required to have pT>subscript𝑝𝑇absentp_{T}> 3.5 GeV, transverse decay length larger than 10 mm, global Ο‡2/Nd.o.f<superscriptπœ’2subscript𝑁formulae-sequenceπ‘‘π‘œπ‘“absent\chi^{2}/N_{d.o.f}< 3, and the difference between the cumulative Ο‡2superscriptπœ’2\chi^{2} probabilities of the two fits larger than 0.05.

The mass and the proper decay time, defined as:

Ο„=Lx​y​mP​D​GpT𝜏subscript𝐿π‘₯𝑦superscriptπ‘šπ‘ƒπ·πΊsubscript𝑝𝑇\tau=\frac{L_{xy}m^{PDG}}{p_{T}}

of the Ξ›b0superscriptsubscriptΛ𝑏0\Lambda_{b}^{0} are extracted using a simultaneous unbinned maximum likelihood fit with per event error (FigureΒ 5). Including systematic uncertainties on event selection and reconstruction bias, the fit model, Bd0superscriptsubscript𝐡𝑑0B_{d}^{0} contamination, and the pTsubscript𝑝𝑇p_{T} scale, the mass and proper decay time measured are:

mΞ›b0=5619.7Β±0.7​(s​t​a​t)Β±1.1​(s​y​s​t)​MeVsubscriptπ‘šsuperscriptsubscriptΛ𝑏0plus-or-minus5619.70.7π‘ π‘‘π‘Žπ‘‘1.1𝑠𝑦𝑠𝑑MeVm_{\Lambda_{b}^{0}}=5619.7\pm 0.7(stat)\pm 1.1(syst)\leavevmode\nobreak\ \rm{MeV}
τΛb0=1.449Β±0.036​(s​t​a​t)Β±0.017​(s​y​s​t)​ps.subscript𝜏superscriptsubscriptΛ𝑏0plus-or-minus1.4490.036π‘ π‘‘π‘Žπ‘‘0.017𝑠𝑦𝑠𝑑ps\tau_{\Lambda_{b}^{0}}=1.449\pm 0.036(stat)\pm 0.017(syst)\leavevmode\nobreak\ \rm{ps}.

They are consistent with the PDG value [24] and the LHCb result [31].

The ratio of the Ξ›b0superscriptsubscriptΛ𝑏0\Lambda_{b}^{0} and Bd0superscriptsubscript𝐡𝑑0B_{d}^{0} lifetimes has been measured:

R=τΛb0/Ο„Bd0=0.960Β±0.025​(s​t​a​t)Β±0.016​(s​y​s​t).𝑅subscript𝜏superscriptsubscriptΛ𝑏0subscript𝜏superscriptsubscript𝐡𝑑0plus-or-minus0.9600.025π‘ π‘‘π‘Žπ‘‘0.016𝑠𝑦𝑠𝑑R=\tau_{\Lambda_{b}^{0}}/\tau_{B_{d}^{0}}=0.960\pm 0.025(stat)\pm 0.016(syst).

This ratio is intermediate to the recent determination by D0, RD​0=0.864Β±0.052​(s​t​a​t)Β±0.033​(s​y​s​t)superscript𝑅𝐷0plus-or-minus0.8640.052π‘ π‘‘π‘Žπ‘‘0.033𝑠𝑦𝑠𝑑R^{D0}=0.864\pm 0.052(stat)\\ \pm 0.033(syst) [33], and the measurement by CDF, RC​D​F=1.020Β±0.030​(s​t​a​t)Β±0.008​(s​y​s​t)superscript𝑅𝐢𝐷𝐹plus-or-minus1.0200.030π‘ π‘‘π‘Žπ‘‘0.008𝑠𝑦𝑠𝑑R^{CDF}=1.020\pm 0.030(stat)\pm 0.008(syst) [32]. It agrees with heavy quark expansion calculations which predict the value of the ratio to be between 0.88 and 0.97 [34] and is compatible with the next-to-leading order QCD predictions with central values ranging between 0.86 and 0.88 (uncertainty of Β± 0.05plus-or-minus0.05\pm\leavevmode\nobreak\ 0.05) [35].

5 Observation of a new Ο‡bsubscriptπœ’π‘\chi_{b} state in radiative transitions to Ξ₯​(1​S)Ξ₯1𝑆\Upsilon(1S) and Ξ₯​(2​S)Ξ₯2𝑆\Upsilon(2S)

Refer to caption
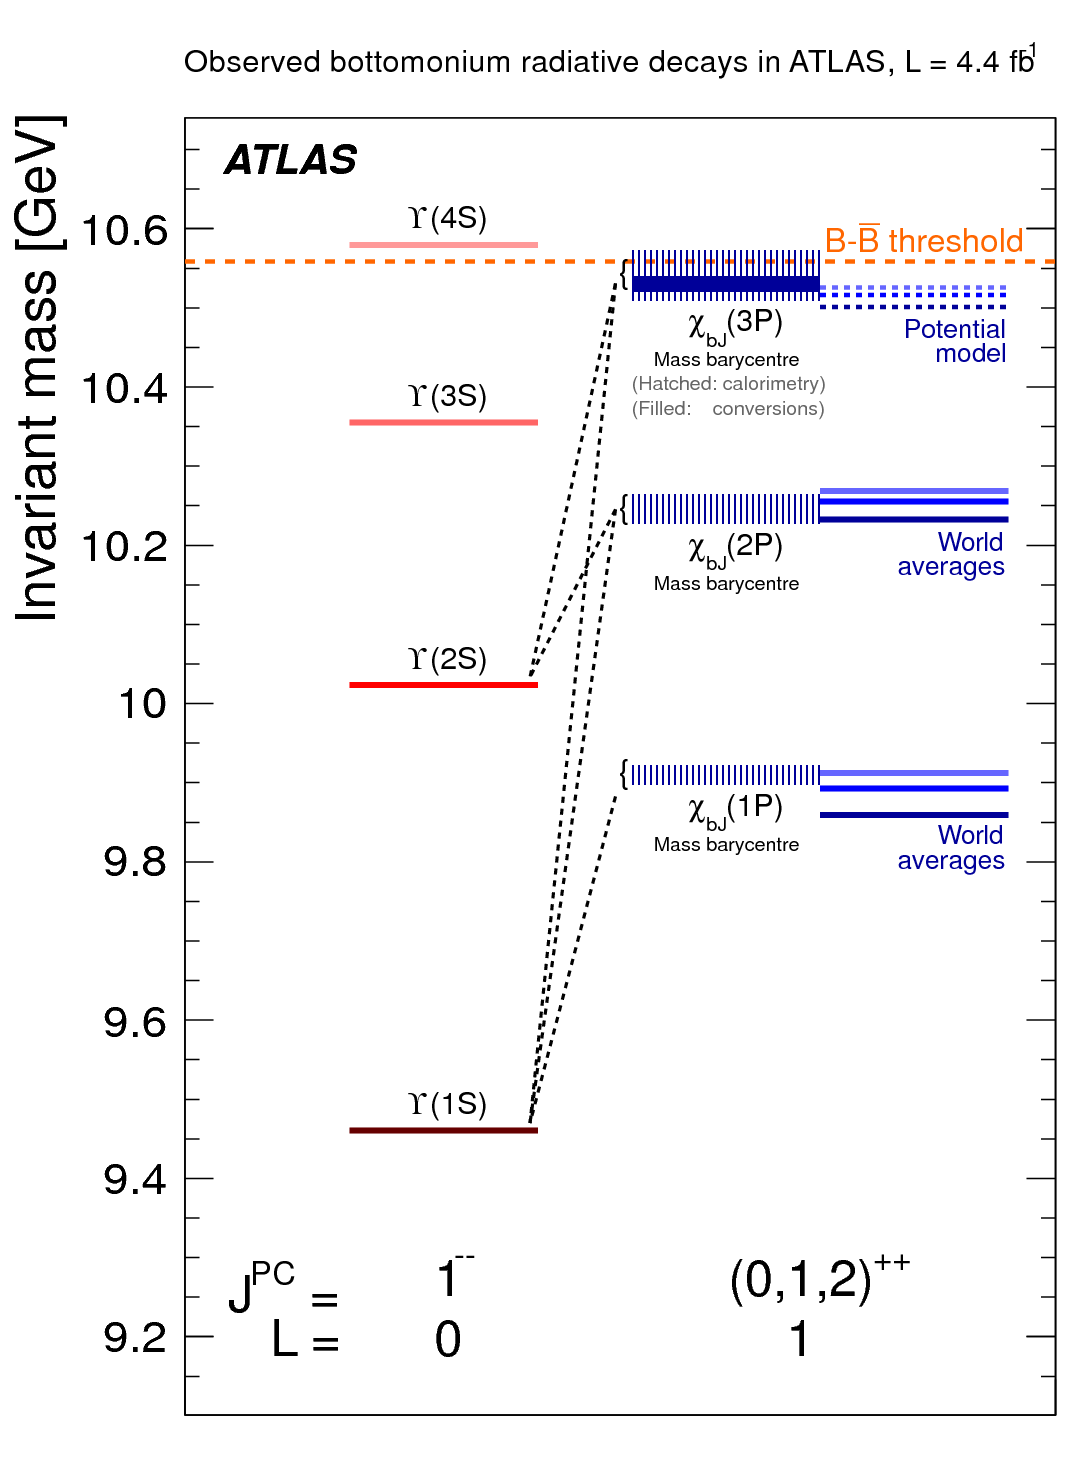
Figure 6: Masses and radiative transitions of the Ο‡bsubscriptπœ’π‘\chi_{b} states as observed in ATLAS. The first column shows the world-average masses of the Ξ₯ states. The second column displays the ATLAS mass barycenter determination for each of the Ο‡b​(1​P,2​P,3​P)subscriptπœ’π‘1𝑃2𝑃3𝑃\chi_{b}(1P,2P,3P) triplets, with the bands of vertical stripes indicating the measurements from the analysis using unconverted photons and the solid band representing the measurement from the converted photon analysis (Ο‡b​(3​P)subscriptπœ’π‘3𝑃\chi_{b}(3P) only). Dashed lines between the states in the second and first columns indicate the radiative transitions observed by ATLAS. In the third column, the world averages (or Potential Model predictions in the case of the 3P) are shown for the three multiplets. Progressively paler shades of blue indicate the J = 0, 1, 2 states.
Refer to caption
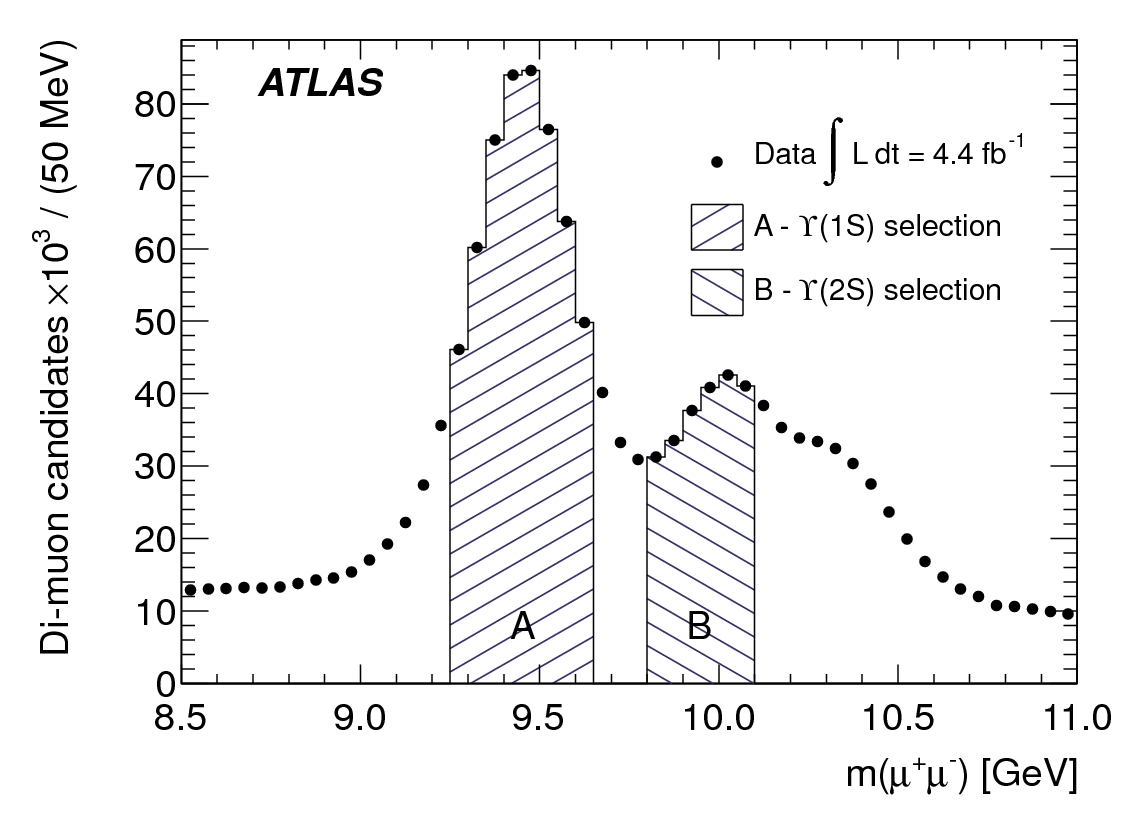
Figure 7: The invariant mass of selected di-muon candidates. The shaded regions A and B show the selections for Ξ₯​(1​S)Ξ₯1𝑆\Upsilon(1S) and Ξ₯​(2​S)Ξ₯2𝑆\Upsilon(2S) candidates respectively.

The Ο‡b​(1​P)subscriptπœ’π‘1𝑃\chi_{b}(1P) and Ο‡b​(2​P)subscriptπœ’π‘2𝑃\chi_{b}(2P) states have been observed in previous experiments, but the Ο‡b​(3​P)subscriptπœ’π‘3𝑃\chi_{b}(3P) state has not. The Ο‡b​(3​P)subscriptπœ’π‘3𝑃\chi_{b}(3P) state is the highest P state predicted below the Bβˆ’B¯𝐡¯𝐡B-\overline{B} threshold as shown in FigureΒ 6 with mass about 10.52 GeV and hyperfine splitting about 10-20 MeV. The Ο‡b​(n​P)subscriptπœ’π‘π‘›π‘ƒ\chi_{b}(nP) states are sought using a data sample corresponding to an integrated luminosity of 4.9 f​bβˆ’1𝑓superscript𝑏1fb^{-1} of ATLAS 2011 data [36], through decay modes of Ο‡b​(n​P)β†’Ξ₯​(1​S)​γ→subscriptπœ’π‘π‘›π‘ƒΞ₯1𝑆𝛾\chi_{b}(nP)\rightarrow\Upsilon(1S)\gamma and Ο‡b​(n​P)β†’Ξ₯​(2​S)​γ→subscriptπœ’π‘π‘›π‘ƒΞ₯2𝑆𝛾\chi_{b}(nP)\rightarrow\Upsilon(2S)\gamma.

Refer to caption
Refer to caption
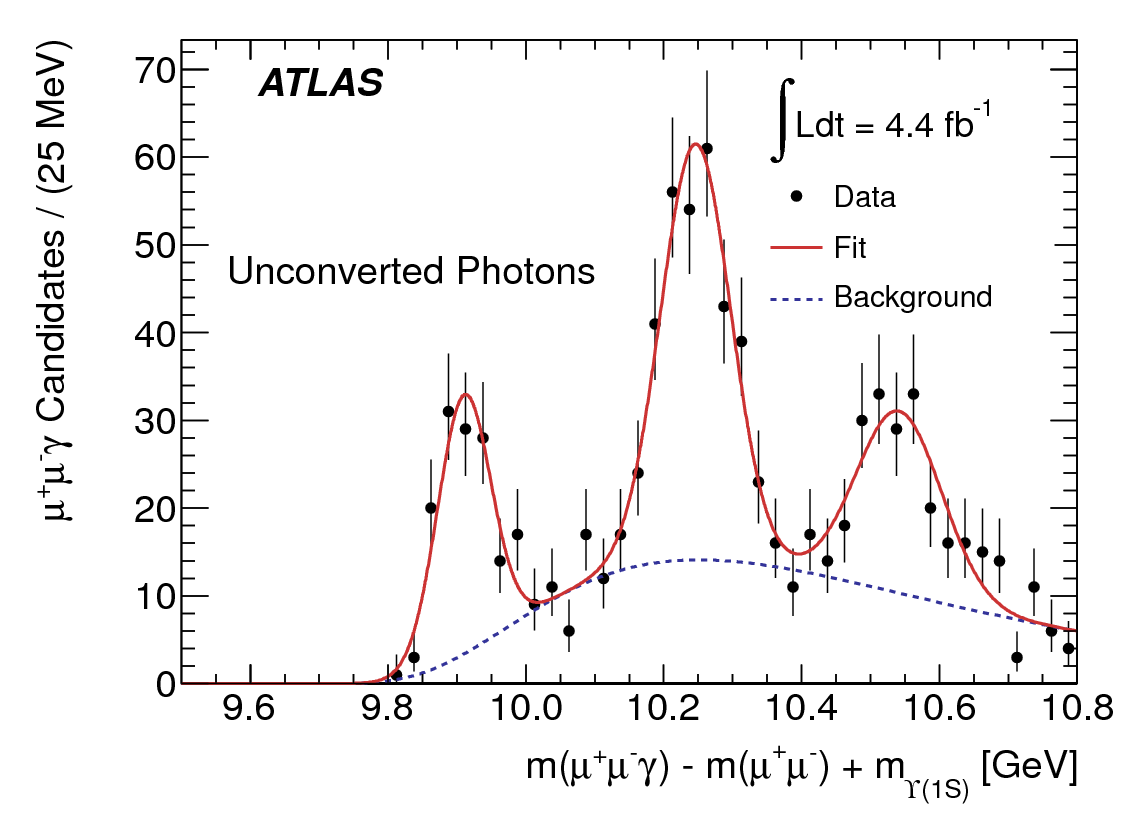
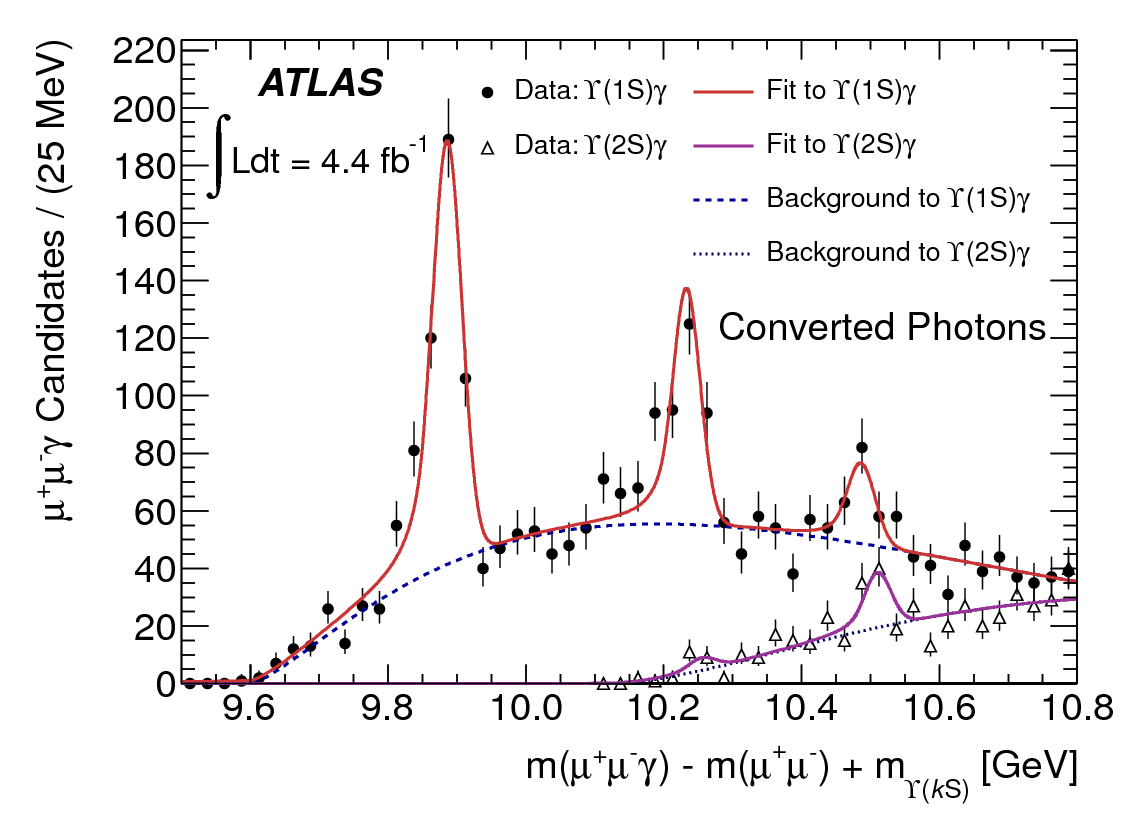
Figure 8: (a) The mass distribution of Ο‡bβ†’Ξ₯​(1​S)​γ→subscriptπœ’π‘Ξ₯1𝑆𝛾\chi_{b}\rightarrow\Upsilon(1S)\gamma candidates for unconverted photons reconstructed from energy deposits in the electromagnetic calorimeter (Ο‡f​i​t2/Nd.o.f.subscriptsuperscriptπœ’2𝑓𝑖𝑑subscript𝑁formulae-sequenceπ‘‘π‘œπ‘“\chi^{2}_{fit}/N_{d.o.f.} = 0.85). (b) The mass distributions of Ο‡bβ†’Ξ₯​(k​S)​γ→subscriptπœ’π‘Ξ₯π‘˜π‘†π›Ύ\chi_{b}\rightarrow\Upsilon(kS)\gamma (k = 1, 2) candidates formed using photons which have converted and been reconstructed in the ID (Ο‡f​i​t2/Nd.o.f.subscriptsuperscriptπœ’2𝑓𝑖𝑑subscript𝑁formulae-sequenceπ‘‘π‘œπ‘“\chi^{2}_{fit}/N_{d.o.f.} = 1.3). Data are shown before the correction for the energy loss from the photon conversion electrons due to bremsstrahlung and other processes. The data for decays of Ο‡bβ†’Ξ₯​(1​S)​γ→subscriptπœ’π‘Ξ₯1𝑆𝛾\chi_{b}\rightarrow\Upsilon(1S)\gamma and Ο‡bβ†’Ξ₯​(2​S)​γ→subscriptπœ’π‘Ξ₯2𝑆𝛾\chi_{b}\rightarrow\Upsilon(2S)\gamma are plotted using circles and triangles respectively. Solid lines represent the total fit result for each mass window. The dashed lines represent the background components only.

In this measurement, a set of muon triggers designed to select events containing muon pairs or single high transverse momentum muons was used to collect the data sample. Each muon candidate must have a track reconstructed in the MS combined with a track reconstructed in the ID with pT>subscript𝑝𝑇absentp_{T}> 4 GeV and pseudorapidity |Ξ·|<πœ‚absent|\eta|< 2.3. The di-muon selection requires a pair of oppositely charged muons which are fitted to a common vertex. The di-muon candidate is also required to have pT>subscript𝑝𝑇absentp_{T}> 12 GeV and |Ξ·|<πœ‚absent|\eta|< 2.0. Ξ₯​(1​S)→μ​μ→Ξ₯1π‘†πœ‡πœ‡\Upsilon(1S)\rightarrow\mu\mu candidates with masses in the range 9.25<mμ​μ<9.659.25subscriptπ‘šπœ‡πœ‡9.659.25<m_{\mu\mu}<9.65 GeV and Ξ₯​(2​S)→μ​μ→Ξ₯2π‘†πœ‡πœ‡\Upsilon(2S)\rightarrow\mu\mu candidates with masses in the range 9.80<mμ​μ<10.109.80subscriptπ‘šπœ‡πœ‡10.109.80<m_{\mu\mu}<10.10 GeV are selected (FigureΒ 7). This asymmetric mass window for Ξ₯​(2​S)Ξ₯2𝑆\Upsilon(2S) candidates is chosen in order to reduce contamination from the Ξ₯​(3​S)Ξ₯3𝑆\Upsilon(3S) peak and continuum background contributions. A photon is combined with each Ξ₯Ξ₯\Upsilon candidate. Converted photons reconstructed by ID tracks from e+​eβˆ’superscript𝑒superscript𝑒e^{+}e^{-} pairs with a conversion vertex and unconverted photons reconstructed by electromagnetic calorimeter energy deposit are used. The converted photon candidates are required to be within |Ξ·|<πœ‚absent|\eta|< 2.30 while the unconverted photon candidates are required to be within |Ξ·|<πœ‚absent|\eta|< 2.37. Unconverted photons must also be outside the transition region between the barrel and endcap calorimeters, 1.37 <|Ξ·|<absentπœ‚absent<|\eta|< 1.52. Requirements of pT​(ΞΌ+β€‹ΞΌβˆ’)>subscript𝑝𝑇superscriptπœ‡superscriptπœ‡absentp_{T}(\mu^{+}\mu^{-})> 20 GeV and pT​(ΞΌ+β€‹ΞΌβˆ’)>subscript𝑝𝑇superscriptπœ‡superscriptπœ‡absentp_{T}(\mu^{+}\mu^{-})> 12 GeV are applied to Ξ₯Ξ₯\Upsilon candidates with unconverted and converted photon candidates respectively. These thresholds are chosen in order to optimize signal significance in the Ο‡b​(1​P,2​P)subscriptπœ’π‘1𝑃2𝑃\chi_{b}(1P,2P) peaks.

As shown in the mass difference m​(ΞΌ+β€‹ΞΌβˆ’β€‹Ξ³)βˆ’m​(ΞΌ+β€‹ΞΌβˆ’)+mP​D​G​(Ξ₯)π‘šsuperscriptπœ‡superscriptπœ‡π›Ύπ‘šsuperscriptπœ‡superscriptπœ‡subscriptπ‘šπ‘ƒπ·πΊΞ₯m(\mu^{+}\mu^{-}\gamma)-m(\mu^{+}\mu^{-})+m_{PDG}(\Upsilon) distributions (FigureΒ 8), in addition to the mass peaks corresponding to the decay modes of Ο‡b​(1​P,2​P)β†’Ξ₯​(1​S,2​S)β†’subscriptπœ’π‘1𝑃2𝑃Ξ₯1𝑆2𝑆\chi_{b}(1P,2P)\rightarrow\Upsilon(1S,2S), a new structure centered at mass 10.530Β±0.005(stat.)Β±0.009(syst.)10.530\pm 0.005(stat.)\pm 0.009(syst.) GeV is observed with a significance of more than 6ΟƒπœŽ\sigma in both of those two independent samples. This is interpreted as the Ο‡b​(3​P)subscriptπœ’π‘3𝑃\chi_{b}(3P) state.

References

  • [1] ATLAS Collaboration, JINST. 3, S08003(2008).
  • [2] UA1 Collaboration, Phys. Lett. B 186 (1987) 237.
  • [3] UA1 Collaboration, Phys. Lett. B 213 (1988) 405.
  • [4] CDF Collaboration, Phys. Rev. D 66 (2002) 032002.
  • [5] CDF Collaboration, Phys. Rev. Lett. 71 (1993) 500.
  • [6] CDF Collaboration, Phys. Rev. Lett. 75 (1995) 1451.
  • [7] CDF Collaboration, Phys. Rev. D 65 (2002) 052005.
  • [8] D0 Collaboration, Phys. Rev. Lett. 74 (1995) 3548.
  • [9] D0 Collaboration, Phys. Rev. Lett. 84 (2000) 5478, [hep-ex/9907029].
  • [10] D0 Collaboration, Phys. Rev. Lett. 85 (2000) 5068, [hep-ex/0008021].
  • [11] CDF Collaboration, Phys. Rev. D 71 (2005) 032001,[hep-ex/0412071].
  • [12] CDF Collaboration, Phys. Rev. D 75 (2007) 012010.
  • [13] CDF Collaboration, Phys. Rev. D 79 (2009) 092003.
  • [14] P. Nason, S. Dawson, and R. K. Ellis, Nucl. Phys. B 327 (1989) 49.
  • [15] ATLAS Collaboration, submitted to JHEP, arXiv:1307.0126 [hep-ex]. (2013).
  • [16] P. Nason, S. Dawson, and R. K. Ellis, Nucl. Phys. B 303 (1988) 607.
  • [17] P. Nason, JHEP 11 (2004) 040, [hep-ph/0409146].
  • [18] S. Frixione, P. Nason, and G. Ridolfi, JHEP 09 (2007) 126, [arXiv:0707.3088].
  • [19] S. Frixione and B. R. Webber, JHEP 06 (2002) 029, [hep-ph/0204244].
  • [20] S. Frixione, P. Nason, and B. R. Webber, JHEP 08 (2003) 007, [hep-ph/0305252].
  • [21] M. Cacciari, M. Greco, and P. Nason, JHEP 05 (1998) 007, [hep-ph/9803400].
  • [22] M. Cacciari, S. Frixione, and P. Nason, JHEP 05 (2001) 006, [hep-ph/0102134].
  • [23] CMS Collaboration, Phys. Rev. Lett. 106 (2011) 112001, [arXiv:1101.0131].
  • [24] J. Beringer et al., Phys. Rev. D 86 (2012) 010001.
  • [25] ATLAS Collaboration, ATLAS-CONF-2012-028. (2012).
  • [26] K. Nakamura et al. (Particle Data Group), J. Phys. (2010) G 37 075021.
  • [27] CDF Collaboration, Phys. Rev. Lett. 104, 102002 (2010).
  • [28] CDF Collaboration, Phys. Rev. Lett. 106, 121804 (2011).
  • [29] D0 Collaboration, Phys. Rev. D 85, 112003 (2012).
  • [30] ATLAS Collaboration, Phys. Rev. D. 87, 032002, 032021, (2013)
  • [31] LHCb Collaboration, Phys. Lett. B 708, 241 (2012).
  • [32] CDF Collaboration, Phys. Rev. Lett. 106, 121804 (2011).
  • [33] D0 Collaboration, Phys. Rev. D 85, 112003 (2012).
  • [34] N. Uraltsev, Phys. Lett. B 376 (1996) 303; I. Bigi, M. Shifman, and N. Uraltsev, Ann. Rev. of Nucl. Part. Science 47, 591 (1997); D. Pirjol and N. Uraltsev, Phys. Rev. D 59, 034012 (1999); M. B. Voloshin, Phys. Rev. D 61, 074026 (2000).
  • [35] C. Tarantino, Eur. Phys. J. C33, S895 (2004); F. Gabbiani, A. I. Onishchenko, and A. A. Petrov, Phys. Rev. D 70, 094031(2004).
  • [36] ATLAS Collaboration, Phys. Rev. Lett. 108, 152001, (2012).