Fragmentation and limits to dynamical scaling in viscous coarsening:
An interrupted in-situ X-ray tomographic study
Abstract
X-Ray microtomography was used to follow the coarsening of the structure of a ternary silicate glass experiencing phase separation in the liquid state. The volumes, surfaces, mean and Gaussian curvatures of the domains of minority phase were measured after reconstruction of the 3D images and segmentation. A linear growth law of the characteristic length scale was observed. A detailed morphological study was performed. While dynamical scaling holds for most of the geometrical observables under study, a progressive departure from scaling invariance of the distributions of local curvatures was evidenced. The latter results from a gradual fragmentation of the structure in the less viscous phase that also leads to a power-law size distribution of isolated domains.
Introduction – The construction of a theoretical framework describing the phase separation of binary liquidsBray (1994); Onuki (2002); Ballufi et al. (2005) has been fueled by successive experimental developments. Up to the 90’s, most experimental observations were performed in the Fourier space, with light or neutron scattering. Model systems were immiscible solutions Chou and Goldburg (1979); Wong and Knobler (1981), and polymer blends Bates and Wiltzius (1989); Takenaka and Hashimoto (1992), or glasses Mazurin and Porai-Koshits (1984). These experiments confirmed that the dynamical scaling assumption is relevant for these systems, i.e. it is possible to rescale the structure factor by a unique length scale . This length increases with a power law: , depending on the growth regime Bray (2003). More recent numerical simulations confirmed this scaling behavior, and provided some insights about the geometry in real space Wagner and Yeomans (1998); González-Segredo et al. (2003); Ahmad et al. (2012a). Meanwhile, access to direct space was made possible by new techniques of observation, such as scanning laser confocal microscopy: curvatures could be measured on phase-separated polymer blends Jinnai et al. (2000); Lopez-Barron and Macosko (2009). These observations are especially relevant to discuss the local mechanisms that govern the coarsening: pinch-off was for instance observed in a colloidal glass Aarts et al. (2005). Recent predictions concerning statistical quantities such as size or surface distributions of domainsSicilia et al. (2007, 2009) and numerical studies of aging in phase-separating fluidsAhmad et al. (2012b); Majumder and Das (2013) also motivate the observation in real space.
The effect of the mobility on the morphology has recently raised a growing interest. Experiments on polymers revealed the spectacular influence of visco-elasticity Tanaka (2000). Recent work Testard et al. (2013) evidenced a logarithmic (stress-assisted) growth for a gas-glass phase separation. Numerical simulations with a viscosity contrastNovik and Coveney (2000); Luo et al. (2004) showed a strong effect on morphology. However, the influence of a sole viscosity contrast has not yet been experimentally investigated in the hydrodynamical regime.
The development of X-ray microtomography provides an suitable tool to explore phase separation in 3-D, with submicron spatial resolution reached in Synchrotron facilities Baruchel et al. (2006); Buffiere et al. (2010). Phase-separated polymer blends were already observed with phase-contrast imaging Pyun et al. (2007).
Glass-forming liquids offer an interesting opportunity to study phase separation Mazurin and Porai-Koshits (1984). A fast quench below the glass transition temperature enables one to study the frozen structure in the solid state, thereby extending the variety of available characterization techniques. Transmission and scanning electron microscopy, Raman Scattering and Atomic Force Microscopy have been used to characterize quantitatively phase separation in glasses Dalmas et al. (2007); Schuller et al. (2011); Hodroj et al. (2013). We focus here on the late stage of spinodal decomposition after a deep quench into the unstable region, that produces interconnected structures. After an initial stage where the interfaces form, the growth can be described by a competition between the interfacial tension that favors the decrease of the surface area between each phase, and dissipative forces (viscosity, inertia).
In the following, we present first results on the observation of the coarsening in silicate melts at high temperature, using X-ray microtomography. After a description of the experimental system, a 3D analysis of the main features of the coarsening stage is given. The dynamical scaling hypothesis is tested up to its limits on a full set of morphological observables. Associated with the onset of a fragmentation process, a gradual departure from scaling invariance is observed on local curvatures.
Materials and Methods – A model glass for phase separation – Using the knowledge available in glass science Mazurin and Porai-Koshits (1984), we designed a barium borosilicate glass to study phase separation. The composition of the glass was 57.1 %wt \ceSiO2, 23.3 %wt \ceBaO, 18.9 %wt \ceB2O3. Elaborated from raw materials, this composition was subsequently checked by wet chemical analysis. The glass decomposes into two phases: a minority barium-rich one, and a majority barium-poor. This ensures a good absorption contrast for X-ray tomography, as barium is much more absorbing than the other elements. This system has a large metastable region which extends well above the liquidus Levin and Ugrinic (1953); Levin and Cleek (1958), which is appropriate to study the coarsening of a binary liquid. The viscosity contrast in the range of temperatures of our experiments is very high, the minority phase being much less viscous than the majority phase.
After elaboration, an interconnected microstructure of typical size m was already present, because of the large temperature difference between the decomposition dome, and the glass transition temperature, that permitted phase separation even during a fast quench.
X-ray tomography – A series of microtomography experiments were performed on the ID19 beamline at the European Synchrotron Radiation Facility (ESRF). m m diameter samples were placed into refractory crucibles, the glass samples were then observed during a heat treatment at a temperature corresponding to a liquid state. Three experiments were done, at different temperatures: , and , using an interrupted in-situ protocol Buffiere et al. (2010). The samples were quenched in air at regular time intervals to room temperature. They were subsequently scanned, then heated again to the working temperature until the next quench. The typical time scale for the temperature changes is of the order of a few seconds. Because of the glassy nature of the material and the relatively fast quench compared to the characteristic time of the domain growth, it is expected that the successive quenches should not influence the main features of the coarsening. We used a pink beam X-ray radiation with a peak photon energy at 31 keV. For each scan, 900 X-ray radiographies were recorded, from which the 3-D absorption field was reconstructed using the standard filtered-back projection algorithm, resulting in volumes of pixels. Pixel size was , and scan time was approximately .
Image processing – In order to study the geometrical and temporal evolution of each phase during demixtion, the following image processing was used. First, reconstructed 3-D images were denoised using a Total Variation filter Chambolle (2004); the barium-rich and silica-rich phases were subsequently identified with Random Walker algorithm Grady (2006) (see supplementary materials). The different domains could then be identified as distinct connected components. Then, geometrical characteristics, such as volume , surface of all domains , and local curvatures, were computed from the statistics of neighboring configurations of 8-voxel cubes Lang et al. (2001); Vogel et al. (2010). Curvatures were obtained from a local fit of the interface by a quadric Sander and Zucker (1990).
Results – After reconstruction and segmentation, the visual observation of a timeseries of images (Fig. 1) offers an intuitive idea of the coarsening. Most of the minority phase (barium rich), whose volume fraction is , lies in a percolating network, but we observe also a growing fraction of isolated domains when time increases. The coarsening appears clearly: the width of the domains grows, and their surface gets smoother and smoother.
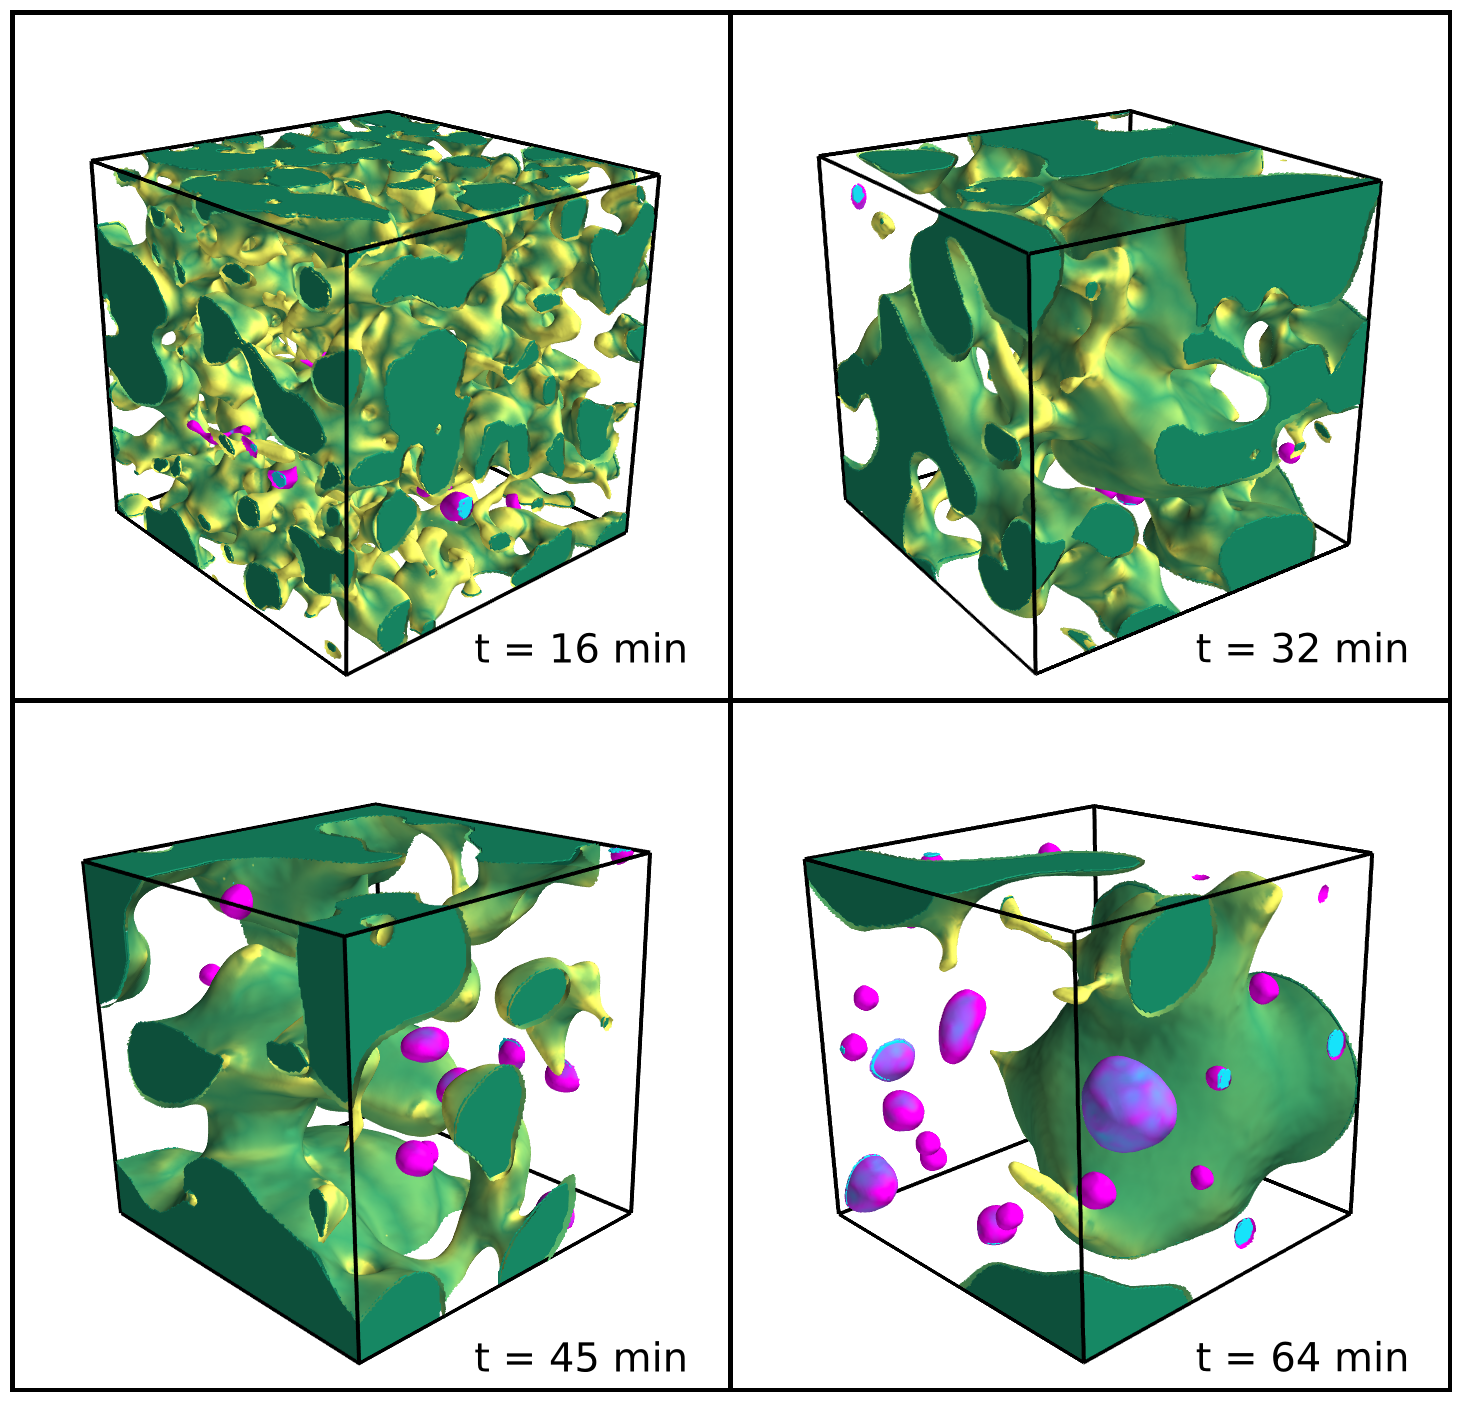
In the following, we first study quantities averaged over the whole volume, in analogy to previous experiments, to show the linear growth in time of the typical scale. Then, we give a more detailed account of the morphological features of the interconnected structure and their time evolution. Finally, we characterize the development of a growing fraction of isolated domains.
Viscous coarsening – As mentioned before, various coarsening regimes have been proposed for phase separation, depending on the leading driving forces (diffusion, viscosity, inertia, etc.). The general scaling law is . Here, we define , the characteristic length scale, as three times the ratio between the total volume and the total surface area of the minority phase:
| (1) |
The prefactor is chosen so that the characteristic length of a system of spheres of radius is exactly .
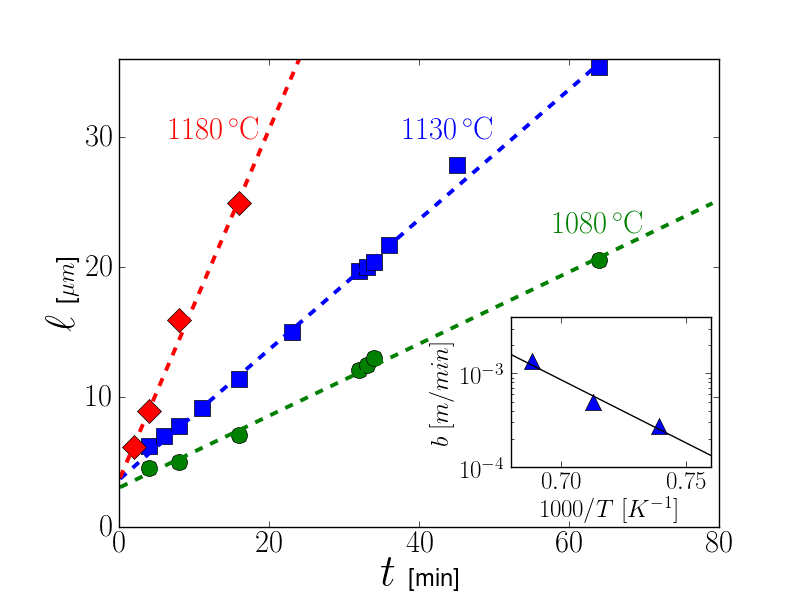
The time evolution of this length is plotted on Fig. 2 for T=, and , along with linear fits. As there was already a microstructure at the beginning of the experiment, . Our results are consistent with the linear growth proposed by Siggia Siggia (1979) due to a hydrodynamic flow controlled by a competition between surface tension and viscosity :
| (2) |
This mechanism assumes that the Laplace pressure due to local curvatures induces a flow. It requires that the minority phase is interconnected, since the flow inside isolated domains stops as they approach a sphere. During the experiment, most of the minority phase remains in the percolating domain (final volume ratio of about to in our experiments), so we do not expect a significant slowing down on the measure of . The coarsening is faster at higher temperature, due to the decrease of viscosity. Growth rates at different temperatures seem consistent with an Arrhenius law (inset, Fig. 2).
Domain shape – Using the data from individual domains, we characterize their shape from the relation between their surface area and their volume. In order to characterize the shapes at different times, we normalize the volume and the surface of each domain, using the characteristic length scale :
| (3) |
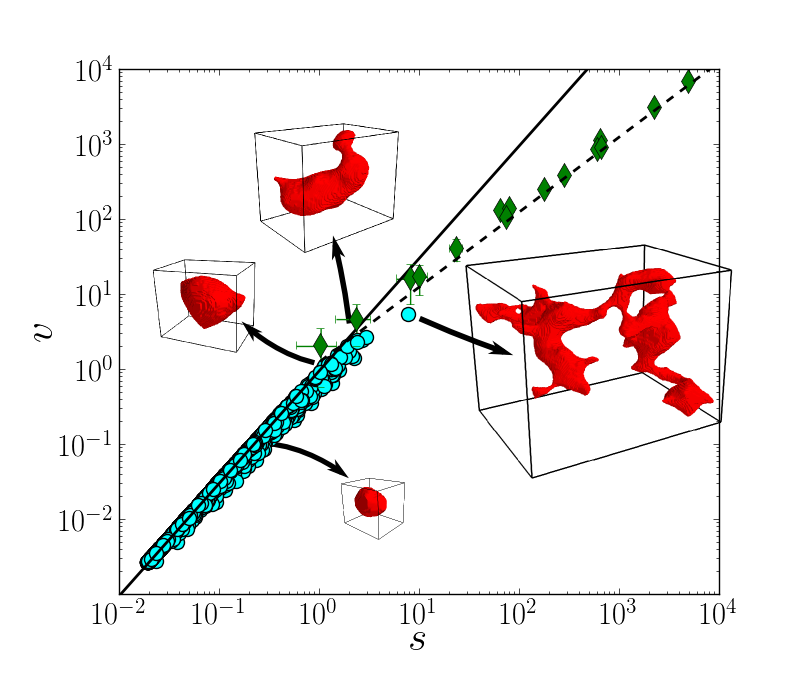
The reduced volume is plotted as a function of the reduced volume for all domains and different times in Fig. 3. When close to a sphere, the volume of a domain should lie close to the solid line representing the sphere case. If more elongated, or ramified (see examples of domains in Fig. 3), it should have an excess of surface compared to a sphere, and hence get away from this line. According to this classification, we observe that most of the small domains are close to a spherical shape, whereas bigger domains deviate more and more as their volume increases. The dynamic lengthscale separates a dominant population of small spheroidal clusters from a lower fraction of large ramified clusters.
Despite poor statistics on large domains, a natural assumption would be to consider that the shape of large domains is inherited from the percolating structure, as isolated domains detached from it. They would subsequently change their shape towards spheres and/or fragment in more smaller domains. If we plot the normalized volume of the percolating domain as a function of its rescaled surface , measured at different times and in boxes of different sizes within a given image, we find a linear relation: , see Fig 3, dotted line. The large ramified domain shape follows also the same linear relation, and the crossover between the large and small domains corresponds well to the intersection of the two asymptotic regimes. Note that a non-trivial exponent could have been expected with an initial condition closer to the percolation threshold in three dimensions Sicilia et al. (2007, 2009).
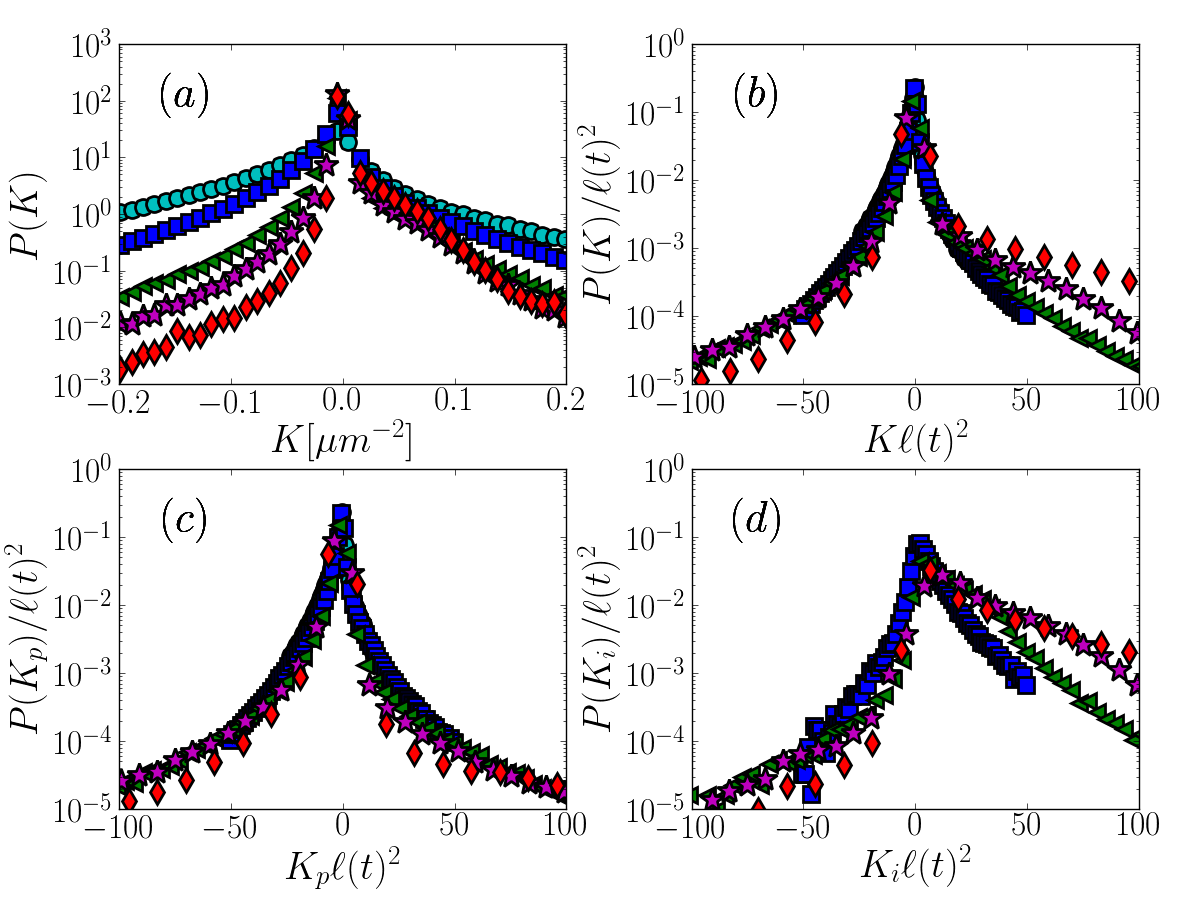
Local curvatures – Another benefit of real space imaging is the possibility to access local geometrical observables such as local curvatures Lopez-Barron and Macosko (2009); López-Barrón and Macosko (2010) of the minority phase. In Fig. 4 (a) we show the distributions of the Gaussian curvature obtained after 16, 23, 32, 45 and at . As expected, the distribution get narrower and narrower along the coarsening process. The asymmetry of Gaussian curvatures reflects the topology of the structure, the surface being dominated by saddle-like shapes (negative value). For the whole system, the time evolution appears to be reasonably well captured by means of a simple rescaling by the dynamic length:
After rescaling (see Fig. 4 (b)) the distribution collapses onto a master curve (), a similar collapse is observed for the mean curvature (see supplementary materials). Still, this collapse is limited by the fragmentation of the percolating domain: an additional positive Gaussian curvature appears with time due to the increasing number of isolated domains. Real-space imaging therefore enables us to show the origin of this gradual departure from scaling invariance. When restricted to the percolating cluster ( Fig. 4 (c)), a perfect collapse is recovered while a clear breaking of scaling invariance is obtained when the same analysis is performed within the sub-set of isolated domains ( Fig. 4 (d)). The collapse indicates that any measure of would be equivalent (which was checked, e.g. using chord length distribution, or the spatial correlation function). Besides, as only the percolating domain has a self-similar growth, one should prefer a measure of that excludes other domains ; here their contribution is limited by their small volume fraction.
Fragmentation – As was shown previously in Fig 1, isolated domains are not observed in the early stage of the experiment but they grow in number during the experiment, as a consequence of a fragmentation of the initial percolating structure. We show in Fig. 5 the time evolution of size distribution of the domains per unit volume , computed as the probability density to find a domain of volume per unit volume, measured at . Very small domains of linear size smaller than 10 pixels are hard to identify with certainty and are therefore not shown here. We computed the sampling bias affecting large domains touching the boundaries of the field of view (see supplementary material). We observe that more domains are present at longer times. In addition, the tail of the distribution changes with time, since large domains are observed at longer times. Despite the difficulty to obtain robust statistics for these large domains, the distribution seems to converge towards a power law distribution: with an exponent .
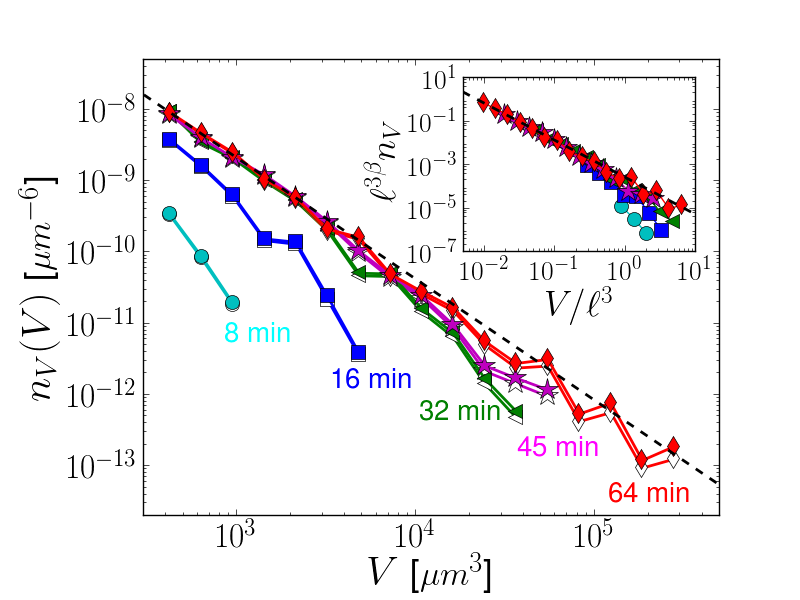
The power law distribution seems to develop due to the formation of larger domains that detach from the percolating domain after some time, while the distribution of small domains remains fairly constant once they are formed. This suggests that an intrinsic size distribution exists and can be rescaled by . The difficulty to sample very small domains would hide the power law behavior for these domains at early times. Hence we tested the scaling (with as characteristic volume):
| (4) |
and obtained a reasonable collapse of the data as illustrated in Fig. 5 for the experiment performed at .
With the assumptions that domains of volume detach at time , and that a larger number of breaking events occur in a more ramified domain according to , we obtain the distribution of domain volumes , consistent with our observation .
Conclusion – The use of interrupted in-situ X-ray tomography gives access to a full 3-D characterization of the coarsening process. Dynamic scaling was shown to account well for the evolution of all geometrical observables. However, a detailed morphological analysis, including the measurements of local curvatures, allowed us to observe a progressive departure from scaling invariance. The latter results from the gradual fragmentation of the (minority) interconnected domain. This process induces a complex multiscale microstructure, with a power-law distribution of isolated domain volumes, co-existing with the percolating phase.
Acknowledgements.
Acknowledgments This work was supported by the ANR program “EDDAM” (ANR-11-BS09-027). Experiments were performed on beamline ID19 at ESRF in the framework of proposal HD501. We gratefully acknowledge the help of J. Grynberg, A. Lelarge, S. Patinet, F. Lechenault and J.-P. Valade for performing the experiments at the ESRF, as well as fruitful conversations with M.-H. Chopinet and L. Cugliandolo. We thank Yohann Bale for his help in sample preparation and Erick Lamotte for the glass elaboration.References
- Bray (1994) A. J. Bray, Advances in Physics 43 (1994).
- Onuki (2002) A. Onuki, Phase transition dynamics (Cambridge Univ. Press, 2002).
- Ballufi et al. (2005) R. W. Ballufi, S. M. Allen, and W. Craig Carter, Kinetics of materials (Wiley Interscience, 2005).
- Chou and Goldburg (1979) Y. Chou and W. Goldburg, Physical Review A 20 (1979).
- Wong and Knobler (1981) N. C. Wong and C. M. Knobler, Physical Review A 24, 3205 (1981).
- Bates and Wiltzius (1989) F. S. Bates and P. Wiltzius, The Journal of Chemical Physics 91, 3258 (1989).
- Takenaka and Hashimoto (1992) M. Takenaka and T. Hashimoto, The Journal of Chemical Physics 96, 6177 (1992).
- Mazurin and Porai-Koshits (1984) O. Mazurin and E. Porai-Koshits, Phase Separation in Glass (North-Holland, 1984).
- Bray (2003) A. J. Bray, Philosophical transactions. Series A, Mathematical, physical, and engineering sciences 361, 781 (2003).
- Wagner and Yeomans (1998) A. J. Wagner and J. M. Yeomans, Physical Review Letters 80, 1429 (1998).
- González-Segredo et al. (2003) N. González-Segredo, M. Nekovee, and P. Coveney, Physical Review E 67, 1 (2003).
- Ahmad et al. (2012a) S. Ahmad, S. K. Das, and S. Puri, Phys. Rev. E 85, 031140 (2012a).
- Jinnai et al. (2000) H. Jinnai, Y. Nishikawa, H. Morimoto, T. Koga, and T. Hashimoto, Langmuir 16, 4380 (2000).
- Lopez-Barron and Macosko (2009) C. R. Lopez-Barron and C. W. Macosko, Langmuir : the ACS journal of surfaces and colloids 25, 9392 (2009).
- Aarts et al. (2005) D. G. Aarts, R. P. Dullens, and H. N. W. Lekkerkerker, New Journal of Physics 7, 40 (2005).
- Sicilia et al. (2007) A. Sicilia, J. Arenzon, A. J. Bray, and L. Cugliandolo, Physical Review E 76, 1 (2007).
- Sicilia et al. (2009) A. Sicilia, Y. Sarrazin, J. Arenzon, A. J. Bray, and L. Cugliandolo, Physical Review E 80, 1 (2009).
- Ahmad et al. (2012b) S. Ahmad, F. Corberi, S. K. Das, E. Lippiello, S. Puri, and M. Zannetti, Phys. Rev. E 86, 061129 (2012b).
- Majumder and Das (2013) S. Majumder and S. K. Das, Phys. Rev. Lett. 11, 055503 (2013).
- Tanaka (2000) H. Tanaka, Journal of Physics: Condensed Matter 207 (2000).
- Testard et al. (2013) V. Testard, L. Berthier, and W. Kob, arXiv preprint arXiv:1309.1587 (2013).
- Novik and Coveney (2000) K. Novik and P. Coveney, Physical review. E, Statistical physics, plasmas, fluids, and related interdisciplinary topics 61, 435 (2000).
- Luo et al. (2004) K. Luo, W. Gronski, and C. Friedrich, Macromolecular Theory and Simulations 13, 365 (2004).
- Baruchel et al. (2006) J. Baruchel, J.-Y. Buffiere, P. Cloetens, M. Di Michiel, E. Ferrie, W. Ludwig, E. Maire, and L. Salvo, Scripta Materialia 55, 41 (2006).
- Buffiere et al. (2010) J. Y. Buffiere, E. Maire, J. Adrien, J. P. Masse, and E. Boller, Experimental Mechanics 50, 289 (2010).
- Pyun et al. (2007) A. Pyun, J. R. Bell, K. H. Won, B. M. Weon, S. K. Seol, J. H. Je, and C. W. Macosko, Macromolecules 40, 2029 (2007).
- Dalmas et al. (2007) D. Dalmas, A. Lelarge, and D. Vandembroucq, Journal of Non-Crystalline Solids 353, 4672 (2007).
- Schuller et al. (2011) S. Schuller, O. Pinet, and B. Penelon, J. Amer. Ceram. Soc. 94, 447 (2011).
- Hodroj et al. (2013) A. Hodroj, P. Simon, P. Florian, M.-H. Chopinet, and Y. Vaills, J. Amer. Ceram. Soc. 96, 2454 (2013).
- Levin and Ugrinic (1953) E. M. Levin and G. M. Ugrinic, 25, 47 (1953).
- Levin and Cleek (1958) E. M. Levin and G. W. Cleek, Journal of the American Ceramic Society 41, 175 (1958).
- Chambolle (2004) A. Chambolle, Journal of Mathematical Imaging and Vision 20, 89 (2004).
- Grady (2006) L. Grady, IEEE transactions on pattern analysis and machine intelligence 28, 1768 (2006).
- Lang et al. (2001) C. Lang, J. Ohser, and R. Hilfer, Journal of microscopy 203, 303 (2001).
- Vogel et al. (2010) H.-J. Vogel, U. Weller, and S. Schlüter, Computers & Geosciences 36, 1236 (2010).
- Sander and Zucker (1990) P. Sander and S. Zucker, IEEE Transactions on Pattern Analysis and Machine Intelligence 12, 833 (1990).
- Ramachandran and Varoquaux (2011) P. Ramachandran and G. Varoquaux, Computing in Science & Engineering 13, 40 (2011).
- Siggia (1979) E. D. Siggia, Physical Review A 20, 595 (1979).
- López-Barrón and Macosko (2010) C. R. López-Barrón and C. W. Macosko, Soft Matter 6, 2637 (2010).