2Department of Chemistry, ”Sapienza” University of Rome P.le A. Moro 5, 00185 Rome
Primordial star formation: relative impact of H2 three-body rates and initial conditions
Abstract
Context. Population III stars are the first stars in the Universe to form at out of a pure hydrogen and helium gas in minihalos of M⊙ . Cooling and fragmentation is thus regulated via molecular hydrogen. At densities above cm-3, the three-body H2 formation rates are particularly important for making the gas fully molecular. These rates were considered to be uncertain by at least a few orders of magnitude.
Aims. We explore the impact of new recently derived accurate three-body H2 formation for three different minihalos, and compare them with the results obtained with three-body rates employed in previous other studies.
Methods. The calculations were performed with the cosmological hydrodynamics code enzo (release 2.2) coupled with the chemistry package krome (including a network for primordial chemistry), which was previously shown to be accurate in high-resolution simulations.
Results. While the new rates can shift the point where the gas becomes fully molecular, leading to a different thermal evolution, there is no trivial trend in the way this occurs. While one might naively expect the results to follow the rate coefficients trend, the behavior can vary depending on the dark-matter halo that is explored.
Conclusions. We conclude that employing the correct three-body rates is about equally important as the use of appropriate initial conditions, and that the resulting thermal evolution needs to be calculated for every halo individually.
Key Words.:
Astrochemistry – Molecular processes – ISM: molecules – Methods: numerical – evolution - cosmology: theory - Population III1 Introduction
Chemistry and cooling are known to be very important in regulating gravitational collapse and the fragmentation of the gas (Li et al., 2003; Peters et al., 2012). Since the pioneering work by Saslaw & Zipoy (1967), it is well-known that molecular hydrogen forms already at in the early Universe. Cooling via H2 then allows gravitational collapse and star formation in minihalos with 105-106 M⊙ at . These Population III stars were thought to be very massive and short lived (Abel et al., 2002; Bromm & Larson, 2004; Yoshida et al., 2008), and subsequently shape their environment via chemical, mechanical, and radiative feedback (Ciardi & Ferrara, 2005; Tornatore et al., 2007; Schleicher et al., 2008; Schneider et al., 2008). In this way, they provide the initial conditions for subsequent star formation.
Recent studies suggested that fragmentation occurs, which leads to the formation of clusters and binary systems (Turk et al., 2009; Clark et al., 2011; Greif et al., 2011; Smith et al., 2011; Greif et al., 2012), while radiative feedback provides upper mass-limits of the order of M⊙ (Hosokawa et al., 2011; Susa, 2013). In particular for the potential formation of low-mass stars, the details of the thermal evolution can be highly relevant, because they influence the resulting fragmentation process. It is therefore very important to clearly assess the accuracy of the microphysical processes that involve the main coolant, which is molecular hydrogen.
At low densities H2 begins to form via the H- path (Saslaw & Zipoy, 1967; Peebles & Dicke, 1968) and becomes an effective coolant around 10 cm-3. At high densities, the importance of the three-body (3B) rates increases significantly (Palla et al., 1983), because collisions then scale with the density to the third power. The dominant reaction is given as
| (1) |
and its inverse reaction, the collisionally induced dissociation (CID),
| (2) |
comes into play. The three-body H2 formation can also substantially contribute to the heating of the gas, because the binding energy of H2 is released into the gas.
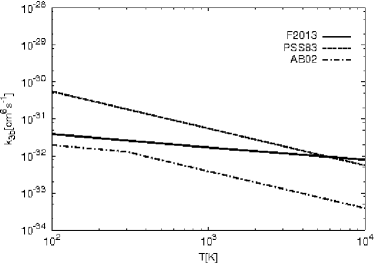
The uncertainty of the reaction in Eq. 1 formerly encompassed about two orders of magnitude (see Fig. 1). The choice of the rate may accordingly strongly affect the features of the collapsing cloud and its final mass (Glover, 2008). The main uncertainty has been explored by Turk et al. (2011a) using adaptive-mesh refinement (AMR) simulations with enzo (The Enzo Collaboration et al., 2013) and smoothed particle hydrodynamics (SPH) simulations with Gadget (Springel, 2005). These authors concluded that the inner region of the collapsing cloud is strongly affected by the rate at which H2 forms, producing lower or higher accretion rates onto the disk. The latter is potentially relevant for disk stability and fragmentation. It also appeared that the different initial conditions employed with the two codes may have a strong impact on the results. While Turk et al. (2011a) focused more on possible discrepancies caused by the use of two different approaches (AMR and SPH), we decided to explore the effect of new 3B rates by employing different initial conditions within the same AMR code. This is more consistent and allows us to assess some additional effects because of the different minihalo selection.
We addressed this uncertainty here by adopting a new accurate three-body H2 formation rate that was recently derived by Forrey (2013a). We calculated the resulting thermal and chemical evolution for three minihalos and compare them with the results obtained from the rates that were previously employed in the literature. A detailed discussion of the new and previously employed rates is given in the following section. The numerical approach employed here is then described in Section 3, including the methodology and the initial setup. Our main results are given in Section 4, and Section 5 summarizes our main conclusions.
| H2 formation rates (cm6s-1) | |
|---|---|
| AB02 | 1.310 () |
| AB02 | 1.310 () |
| PSS83 | 5.510 |
| F2013 | |
| H2 destruction rates (cm3s-1) | |
| AB02 | ( |
| PSS83 | 5.24 |
| F2013 | same as AB02 |
2 Three-body H2 formation and CID rates
The rate for the CID reaction in Eq. 2, which is the inverse process of Eq. 1, was first measured by Jacobs et al. (1967) with experimental studies on shock waves in a temperature range from 2900 K to 4700 K. The analytic expression for the dissociation rate constants was based on JANAF111http://kinetics.nist.gov/janaf/ equilibrium data and the error was estimated to be about a factor of 2. However, the comparison with previous experimental data shows differences of an order of magnitude. The Jacobs et al. (1967) rates have been widely used over the years as a starting point to evaluate 3B H2 formation rate (Eq. 1) and as benchmark for additional theoretical studies. For instance, Palla et al. (1983) and Flower & Harris (2007) reported H2 formation rate coefficients obtained from the measurements of Jacobs et al. (1967) by applying the principle of detailed balance.
Direct 3B H2 formation rates have been obtained by Shui (1973) by employing phase-space theory (PST) for temperatures ranging from 300 K to 10000 K. A detailed comparison between experimental and theoretical data has been reported and discussed. While the CID rates agreed well with previous existing data (Jacobs et al., 1967; Gardiner & Kistiakowsky, 1961; Hurle et al., 1969), no good match was found with the experimentally inferred values for reaction of Eq. 1. All the previous studies are based on an indirect evaluation of the 3B formation rates by using data from direct dissociation shock-tube experiments. The only direct measurements reported by Bennett & Blackmore (1968) exhibited a maximum at a temperature below 3000 K and was three times lower than the theoretical values reported by Shui (1973). The work by Bennett & Blackmore (1968) unfortunately has never been considered in astrophysical studies, which always referred to the original Jacobs et al. (1967) work. The resonance complex theory was employed by Orel (1987) and new rates were provided at temperatures of a few hundred kelvins and were compared with the earlier work by Whitlock et al. (1974) (who applied a similar method), showing a discrepancy of a factor of 2. Finally, Esposito & Capitelli (2009) reported rate coefficients based on quasi-classical approaches.
We can therefore conclude that based on the publications during the past 50 years, it is easy to find large discrepancies between theoretical and experimental data. There are at least three different rates that are commonly used in cosmological simulations: (i) the one proposed by Palla et al. (1983) based on the experiment of Jacobs et al. (1967), which has been obtained by applying the principle of detailed balance to reaction in Eq. 2; (ii) the extrapolation by Abel et al. (2002) based on a direct calculation of the formation path by Orel (1987) between 10-300 K: this rate shows a sudden change of slope at 300 K that is artificial because of the extrapolation adopted by the authors to higher temperatures; (iii) the Flower & Harris (2007) rates, which are based on the work of Jacobs et al. (1967) but were obtained by using a different set of partition functions, and (iv) a new fit used by Clark et al. (2011) based on the CID rate constants of Martin et al. (1996). The above rates have been used in several studies and the differences between them have been discussed by Turk et al. (2011a) and Glover (2008).
The recent calculation performed by Forrey (2013a) is, to our knowledge, the first accurate quantum-mechanical study for the 3B formation of molecular hydrogen. It was obtained by applying the Sturmian theory (Forrey, 2013b) under the energy sudden approximation (Kramer & Bernstein, 1964; Khare, 1978). These results agree well with the experiment by Jacobs et al. (1967) and with the theoretical results from the PST (Shui, 1973) and QCT (Orel, 1987) calculations. It is worth noting that this is the first direct calculation of the formation reaction that is valid for a wide range of temperatures for which no extrapolation has been applied.
We note that Forrey (2013a) also reported an error in the rate calculation by Flower & Harris (2007) that was previously pointed out by Esposito & Capitelli (2009) and discussed in Galli & Palla (2013). Because the H2 partition function was evaluated neglecting the electron spin degeneracy, the final rate was higher by a factor of 4 than that reported by Palla et al. (1983) based on the same CID measurements (Jacobs et al., 1967). The calculation by Flower & Harris (2007) thus leads to the same rates as that of Palla et al. (1983) if the correct normalization is employed. Even though the rates by Flower & Harris (2007) have been employed in previous studies, here we decided to not include them. From a more physical point of view, one should include the correction pointed out by Forrey (2013a), which leads to a rate equivalent to the Palla et al. (1983) result.
3 Numerical method
3.1 Cosmological setup
We performed our simulations by employing the cosmological hydrodynamics AMR code enzo, version 2.2 (The Enzo Collaboration et al., 2013). A split hydro-solver with the third order piece-wise parabolic (PPM) method was employed for solving the hydrodynamics, and the dark matter was modeled using the particle-mesh technique. Self-gravity was calculated via a multigrid Poisson solver, and a network for the primordial chemistry was solved using the chemistry package krome (Grassi et al., 2013) described in the next subsection. We followed the evolution of the halo starting from redshift z = 99 with a top grid resolution of 1283 cells. Two initial nested grids were subsequently added with a grid resolution of 1283 cells each. A simulation box of cosmological size of 0.3 Mpc h-1, centered on the most massive minihalo, was used. In total, we initialized 6291456 particles to compute the evolution of the dark-matter dynamics and obtained a final dark-matter resolution of 70 . The parameters for creating the initial conditions and the distribution of baryonic and dark-matter components were taken from the WMAP seven-year data (Jarosik et al., 2011).
We furthermore allowed additional 27 levels of refinement in the central 18 kpc region of the halo during the course of simulation, which yielded a total effective resolution of 0.9 AU in comoving units. The resolution criteria used in these simulations are based on the Jeans length, the gas over-density, and the particle-mass resolution. We mandated a fixed Jeans resolution of 64 cells per Jeans length throughout the evolution of the simulations. It was suggested recently (Federrath et al., 2011; Turk et al., 2012; Latif et al., 2013b) that a resolution of at least 32 cells per Jeans length is needed to capture turbulent velocity fluctuations, for example. We stopped the simulations when they reached the highest refinement level.
3.2 Chemistry
We followed the non-equilibrium evolution of nine species: H, H+, H-, H2, H, He, He+, He2+, and e-. A total of 21 kinetic reactions were included by using the rates discussed in Abel et al. (1997) and Anninos et al. (1997). The heating and cooling rates include H2 formation heating as described in Omukai (2000) , H2 cooling as reported in Glover & Abel (2008), H and He collisional ionization, collisional excitation, recombination coolings, and bremsstrahlung cooling (Cen, 1992). The heating due to the formation of H2 from 3B processes was changed accordingly, following the rates of Table 1 to take into account the original CID rate from what the recombination was obtained by applying the detailed balance.
The rate equations and the thermal evolution were solved by employing the new chemistry package krome (Grassi et al., 2013). Its implementation in enzo has previously been discussed in Bovino et al. (2013a), where we showed the accuracy and stability of the dlsodes solver (Hindmarsh, 1983; Hindmarsh et al., 2005) included in the package. As we have shown there, the latter significantly improves the convergence of thermodynamical quantitites in high-resolution simulations. It is worth noting that we are considering an optically thin gas, which might lead to slightly lower temperatures.
4 Results
We performed a total of nine simulations to study the effect of the new H2 3B formation rates. For this purpose, we varied the 3B rates given in Table 1 and chose three different realizations of the cosmic density field, yielding minihalos with masses of 1.3105 , 7105 , and 1106 , respectively.
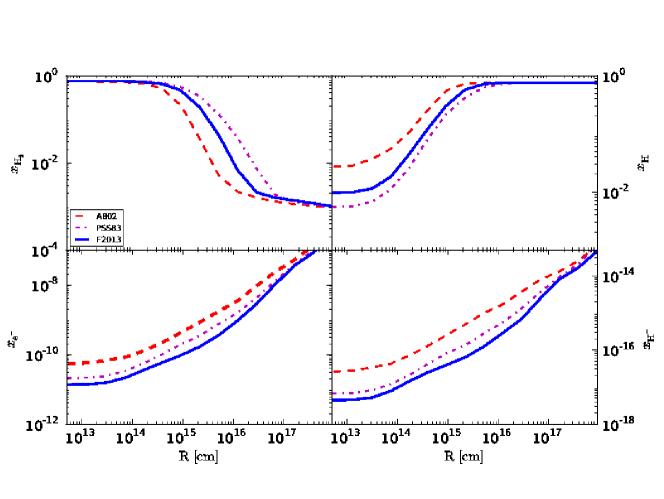
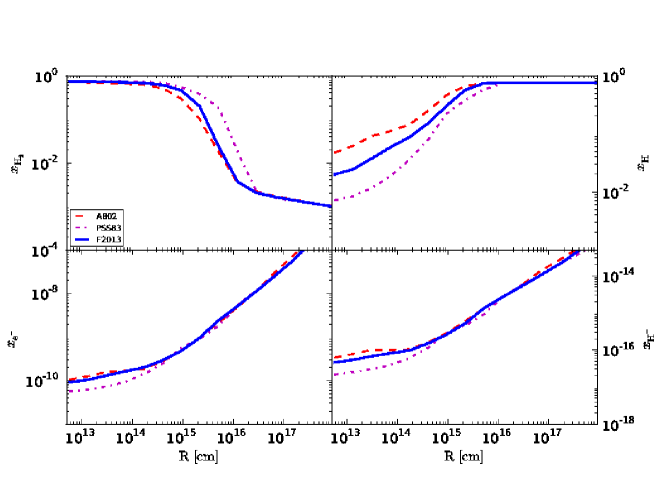
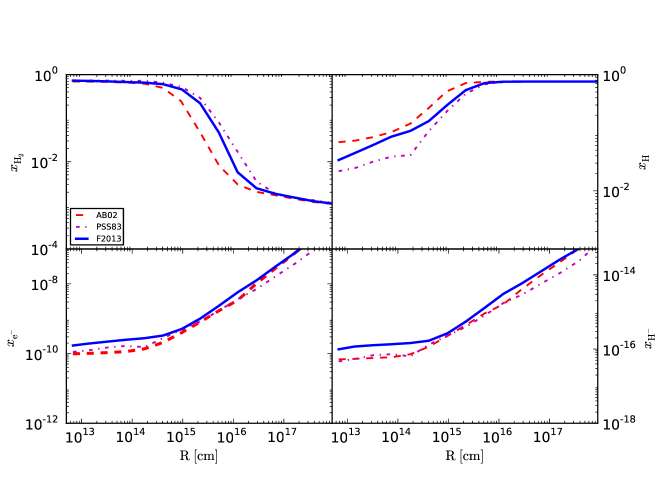
In Fig.s 2, 3, and 4 we report the averaged radial pofiles for the chemical species H, H2, e-, and H- of the nine different realizations. As stated in the introduction, we are interested in studying the effect of changing the H2 3B formation rate in our primordial chemical network and exploring different initial conditions.
The chemical abundances show similar general features for the three different halos employed: decreasing abundances of the electrons, H, and H- in favor of the formation of molecular hydrogen in the inner region ( 1015 cm) where, in fact, the H2 profile shows a sudden increase. For different three-body rates, we found that the physical size of the molecular cores increases moving from a less efficient process (AB02) to the most efficient one (PSS83), which then has the largest molecular core, in agreement with the results of Turk et al. (2011a). This is also reflected in the atomic hydrogen shown in the top right panels of the same figures, where clearly the H abundance significantly decreases at radii of 1016 cm for the PSS83 case and slowly decreases for the less efficient rate reported by Abel et al. (2002). The new rate calculated by Forrey (2013a) is, as expected, in between those of Abel et al. (2002) and Palla et al. (1983), thus producing results for the H2 abundance that agree with the overall trend. However, the details also depend on the halo under consideration, because it is closer to Abel et al. (2002) in halo B, closer to Palla et al. (1983) in halo C, and intermediate in halo A.
The dependence on the initial conditions is also visible in the electron abundance (bottom left panels) and in the H- profile (bottom right). These quantities do not necessarily lie in between the limiting cases of Palla et al. (1983) and Abel et al. (2002) either, as is visible in Figure 2 for the electron mass fraction, where the new rates yield a lower electron mass fraction. In Figs. 3 and 4, on the other hand, the electron mass fraction is enhanced for radii 1015 cm in the F2013 case.
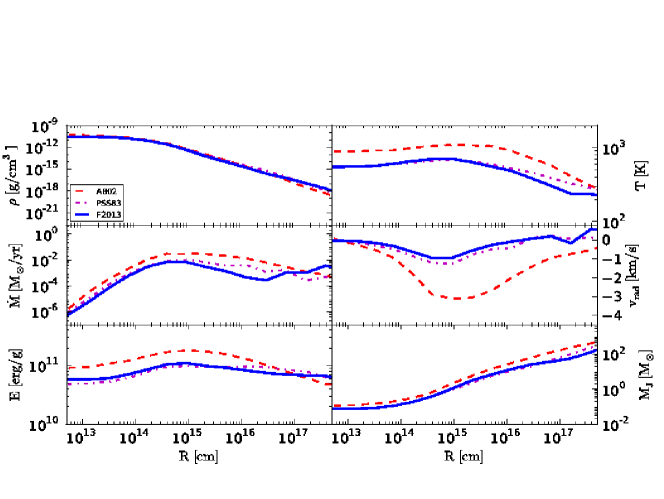
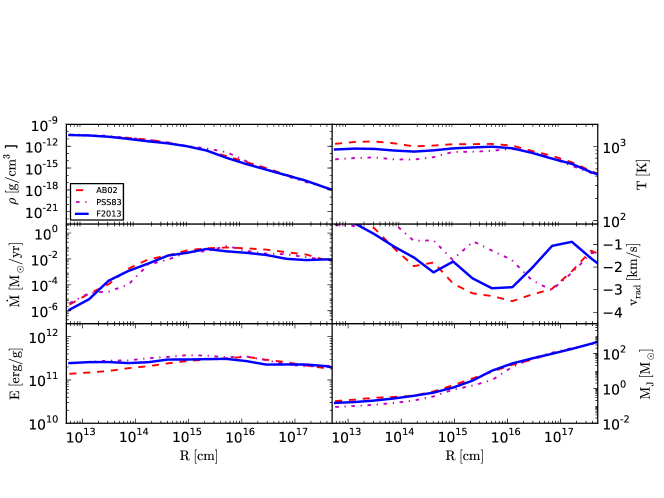
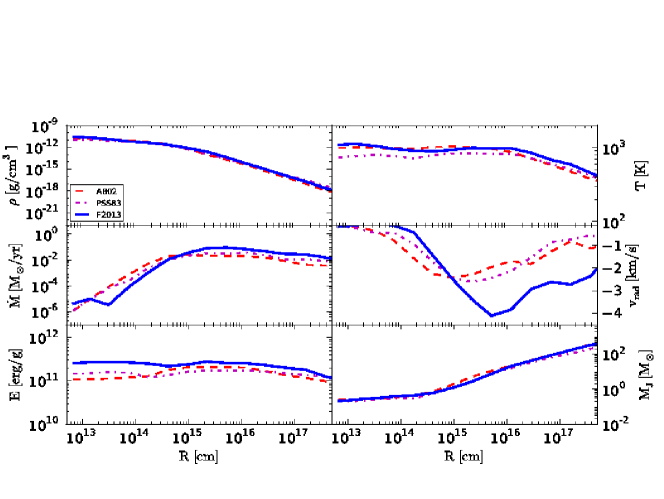
The spherically averaged profiles for temperature, accretion rate, density, radial velocity, total energy, and Jeans mass are reported in Fig.s 5, 6, and 7 for the three different minihalos employed as a function of the radius and centered on the high-density peak. We only plot the region at which the core begins to become fully molecular and the new rates are relevant, corresponding to radii below 1017 cm. On larger scales, we obtained results identical to those in Bovino et al. (2013a).
The thermal evolution (top right panels) is strongly affected by the molecular hydrogen evolution because it regulates the cooling, which thus depends on the changes in its formation rate. In Figure 5, the only remarkable difference is in the AB02 run, where clearly the lower efficiency in forming H2 via Eq. 1 produces less cooling and leads to a higher temperature. The two runs produce a similar behavior with a temperature in the inner region around 400-500 K. This is consistent with the fact that the F2013 run approaches the fully molecular stage (i.e. ) in a rather similar way to the simulations based on PSS83. For halo B in Figure 6, on the other hand, the evolution is completely different. The AB02 run still produces the highest temperature (1000 K) and F2013 follows a similar trend until a radius of 1015 cm, when it slightly departs from the AB02 behavior. This is mainly because in F2013, the molecular stage is reached earlier. PSS83 again provides a very similar H2 mass fraction.
In Figure 7, the results for halo C are shown. In this case, we obtained the most surprising results: PSS83 and AB02 are still the two limiting cases because of their related 3B rates, but F2013 agrees very well with the AB02 temperature profile, which is not (at least at the first glance) strongly related to the H2 behavior. The difference is also more pronounced if we compare the runs for halo A (Fig. 5) and halo C (Fig. 7), where a similar H2 profile was obtained. In both cases, AB02 and F2013 have a similar molecular physical size, for instance, AB02 is fully molecular in both runs around 21014 cm and F2013 around 5-61015 cm, but the temperature profiles are very different. In halo A, AB02 is 200-300 K warmer, while in the halo C runs the temperatures are almost identical. We note in particular that the gas in halo A is initially colder with about 25 K at a radius of 51017 cm, while halos B and C have temperatures of 40 K at the same radial position. These differences naturally occur because of the different halo masses, collapse redshifts, and spin parameters.
The dynamical impact of these changes is explored in more detail in the same figures. In particular, we report relatively large differences in the radial velocities (middle right panels) where the magnitude changes by about 2-3 km/s and the position of the peak moves depending on the 3B rate employed, which differs from the results reported by Turk et al. (2011a) where the differences were up to 1 km/s and the peak position was quite consistent. This is more evident for halos B and C (and particularly pronounced in halo C), where the F2013 run produces a radial velocity four times higher than in the other runs. This causes an increase in the total energy (bottom left panels). Changes in the accretion rate (middle left panels), on the other hand, appear rather minor, and a similar result is obtained for the Jeans mass, which we computed as
| (3) |
where , , and are the density, gravitational constant, and the temperature, respectively. The mean molecular weight is evaluated as
| (4) |
where is the proton mass. Judging from these quantities, the resulting stellar masses may thus depend more on the initial conditions than the exact values of the three-body rates. We note that a dependence of the final mass scale on the properties of the halo has also been reported by Latif et al. (2013a, c) for atomic cooling halos.
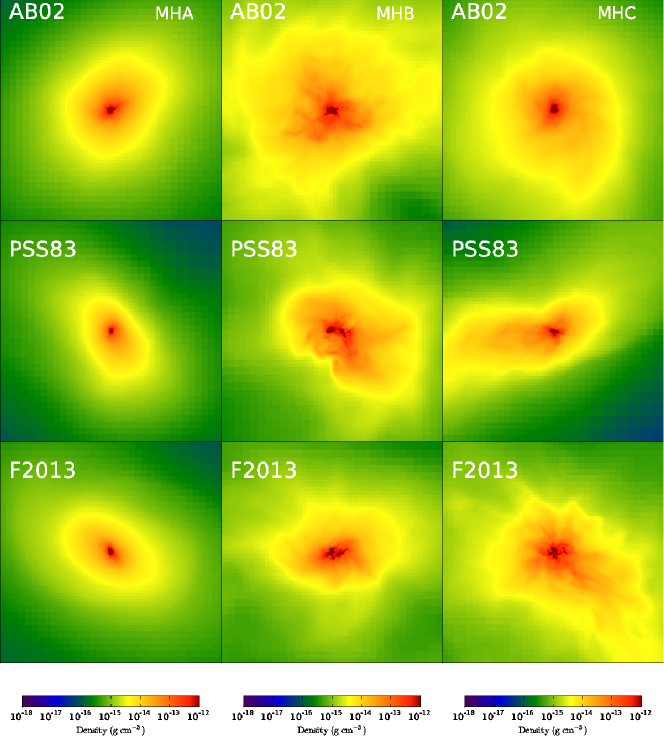
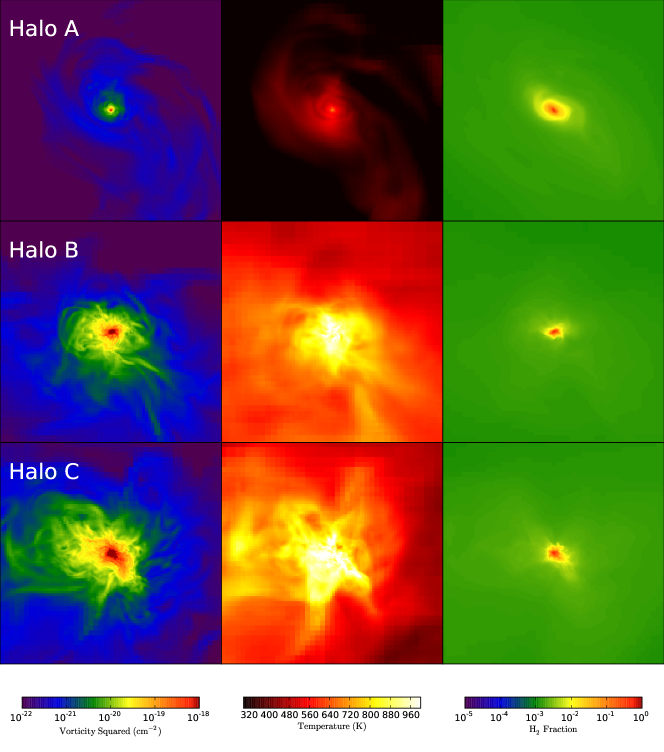
To explore the structure in the collapsing halos, Figure 8 shows a comparison of the morphology for AB02, PSS83, and F2013. The density projections for the three minihalos reflect the results reported and discussed in Figs. 5, 6, and 7 for the thermal evolution, infall velocity, and Jeans mass. In addition, there are relevant differences in the morphology, because halo A (MHA) is almost spherically symmetric while halos B (MHB) and C (MHC) show a more turbulent structure. Comparing the the same halo for the three different rates employed here, the differences in morphology seem to depend more on the halo than the three-body rate: (i) halo A is largely spheroidal/ellipsoidal in all the cases and the only difference lies on the more massive central core obtained by employing the AB02 rate. This is caused by the higher temperature reached at that stage compared with the PSS83 and F2013 realizations; (ii) halo B seems to go from a turbulent large structure to a more compact one when going from AB02 to F2013. Owing to the lower temperature achieved by the PSS83 and F2013, we note here some turbulent-clumpy structures in the center of the collapse, which are not present in the AB02 run. In these realizations, we also see a more compact structure when we use the F2013 rate; (iii) finally, halo C seems to exhibit either a spherical (AB02), turbulent (F2013), or disk-like structure (PSS83) depending on the three-body rate. It is worth noting that we can only assess general and qualitative statements about the morphology of the collapsing cloud and that a deeper analysis and longer evolution are needed to explore possible fragmentation processes.
To conclude our analysis, we show in Figure 9 the vorticity squared, the temperature, and the H2 projections for the realizations performed by using the new accurate quantum-mechanical H2 3B formation rate (Forrey, 2013a). These quantities reflect the behavior discussed above and show how much the initial conditions can affect the morphology of the collapsing cloud. While we recommend now using the correct three-body rates provided by Forrey (2013a), it appears at least equally important to explore larger samples to capture the range of possible initial conditions.
5 Conclusions
We studied the effect of the three-body H2 formation rate in Population III star formation simulations, employing the recent accurate quantum-mechanical calculation by Forrey (2013a). We compared the relative importance of correct three-body rates with the potential effect of different initial conditions.
We performed nine simulations for three different minihalos and three different 3B formation rates commonly used in the literature, including those by Palla et al. (1983), Abel et al. (2002), and the new rates by Forrey (2013a), and analyzed their impact on chemistry, thermal evolution, and the dynamics of the collapse. Our simulations started from cosmological initial conditions and employed the adaptive mesh refinement technique until we reached the highest refinement level at densities around 10-11 g cm-3.
While one might naively expect the new Forrey (2013a) rates to lead to a behavior in between the simulations based on Palla et al. (1983) and Abel et al. (2002), the actual evolution is sometimes closer to Abel et al. (2002), and sometimes closer to Palla et al. (1983), depending on the initial conditions. We note that situations may even occur where the H2 abundance evolves according to the Abel et al. (2002) runs, while the thermodynamics are closer to the run based on Palla et al. (1983), and vice versa. The latter shows that a different H2 formation rate gives rise to a different nonlinear evolution, which thus has nontrivial consequences on the results. To understand the behavior of a particular halo, it is thus mandatory to employ accurate rates.
While the accretion rates and the Jeans mass only show a minor dependence on the reaction rates and a stronger dependence on the initial conditions, an accurate modeling is nevertheless relevant. In addition, it shows now an increasing need to study larger samples to understand the expected statistical distribution in halo properties. In addition, it will be important to assess the impact on fragmentation by continuing these simulations beyond the formation of the first peak and following the accretion onto the central clump and also the potential formation of additional clumps.
We note that during the collapse, radiative feedback from the protostar will become relevant and may limit the subsequent accretion. Studies by Hosokawa et al. (2011) and Susa (2013) indeed suggested a characteristic mass scale of the order of 50 M⊙. Hirano et al. (2013) investigated a total of 100 minihalos, confirming these results, but showing a considerable distribution of the stellar masses around the mean. This confirms our assessment that the initial conditions have a strong impact on the final results. We also note that magnetic fields are efficiently amplified during the collapse in minihalos (Schleicher et al., 2010; Sur et al., 2010; Schober et al., 2012; Turk et al., 2012; Bovino et al., 2013b) and can subsequently suppress fragmentation and change the final mass scale (Machida et al., 2008; Machida & Doi, 2013). A treatment of these effects will therefore be necessary in future studies.
The results presented here thus confirm the potential importance of choosing the correct reaction rates, but also hint at the potentially larger relevance of the initial conditions. This is in line with previous results obtained by Jappsen et al. (2009), showing that the initial conditions can be more relevant than metallicity thresholds. While this also makes sense for a primordial gas, it is still reassuring that an important uncertainty has been removed via quantum-chemical calculations.
Acknowledgements
S.B. thanks for funding through the DFG priority programme ‘The Physics of the Interstellar Medium’ (project SCHL 1964/1-1). D.R.G.S. thanks for funding via the SFB 963/1 on ”Astrophysical Flow Instabilities and Turbulence” (project A12). T.G. thanks the CINECA consortium of the awarding of financial support while the present research was carried out. The simulation results are analyzed using the visualization toolkit for astrophysical data YT (Turk et al., 2011b).
References
- Abel et al. (1997) Abel T., Anninos P., Zhang Y., Norman M. L., 1997, New Astronomy, 2, 181
- Abel et al. (2002) Abel T., Bryan G. L., Norman M. L., 2002, Science, 295, 93
- Anninos et al. (1997) Anninos P., Zhang Y., Abel T., Norman M. L., 1997, New Astronomy, 2, 209
- Bennett & Blackmore (1968) Bennett J. E., Blackmore D. R., 1968, Royal Society of London Proceedings Series A, 305, 553
- Bovino et al. (2013a) Bovino S., Grassi T., Latif M. A., Schleicher D. R. G., 2013a, MNRAS, 434, L36
- Bovino et al. (2013b) Bovino S., Schleicher D. R. G., Schober J., 2013b, New Journal of Physics, 15, 013055
- Bromm & Larson (2004) Bromm V., Larson R. B., 2004, ARA&A, 42, 79
- Cen (1992) Cen R., 1992, ApJS, 78, 341
- Ciardi & Ferrara (2005) Ciardi B., Ferrara A., 2005, Space Science Reviews, 116, 625
- Clark et al. (2011) Clark P. C., Glover S. C. O., Smith R. J., Greif T. H., Klessen R. S., Bromm V., 2011, Science, 331, 1040
- Esposito & Capitelli (2009) Esposito F., Capitelli M., 2009, Journal of Physical Chemistry A, 113, 15307
- Federrath et al. (2011) Federrath C., Sur S., Schleicher D. R. G., Banerjee R., Klessen R. S., 2011, ApJ, 731, 62
- Flower & Harris (2007) Flower D. R., Harris G. J., 2007, MNRAS, 377, 705
- Forrey (2013a) Forrey R. C., 2013a, ApJ, 773, L25
- Forrey (2013b) Forrey R. C., 2013b, ArXiv e-prints:1307.0549
- Galli & Palla (2013) Galli D., Palla F., 2013, ARA&A, 51, 163
- Gardiner & Kistiakowsky (1961) Gardiner Jr. W. C., Kistiakowsky G. B., 1961, J. Chem. Phys., 35, 1765
- Glover (2008) Glover S., 2008, in O’Shea B. W., Heger A., eds, First Stars III Vol. 990 of American Institute of Physics Conference Series, Chemistry and Cooling in Metal-Free and Metal-Poor Gas. pp 25–29
- Glover & Abel (2008) Glover S. C. O., Abel T., 2008, MNRAS, 388, 1627
- Grassi et al. (2013) Grassi T., Bovino S., Schleicher D. R. G., Prieto J., Seifried D., Simoncini E., Gianturco F. A., 2013, MNRAS, in preparation
- Greif et al. (2012) Greif T. H., Bromm V., Clark P. C., Glover S. C. O., Smith R. J., Klessen R. S., Yoshida N., Springel V., 2012, MNRAS, 424, 399
- Greif et al. (2011) Greif T. H., Springel V., White S. D. M., Glover S. C. O., Clark P. C., Smith R. J., Klessen R. S., Bromm V., 2011, ApJ, 737, 75
- Hindmarsh (1983) Hindmarsh A. C., 1983, IMACS Transactions on Scientific Computation, 1, 55
- Hindmarsh et al. (2005) Hindmarsh A. C., Brown P. N., Grant K. E., Lee S. L., Serban R., Shumaker D. E., Woodward C. S., 2005, ACM Trans. Math. Softw., 31, 363
- Hirano et al. (2013) Hirano S., Hosokawa T., Yoshida N., Umeda H., Omukai K., Chiaki G., Yorke H. W., 2013, ArXiv e-prints:1308.4456
- Hosokawa et al. (2011) Hosokawa T., Omukai K., Yoshida N., Yorke H. W., 2011, Science, 334, 1250
- Hurle et al. (1969) Hurle I. R., Jones A., Rosenfeld J. L. J., 1969, Proceedings of the Royal Society of London. A. Mathematical and Physical Sciences, 310, 253
- Jacobs et al. (1967) Jacobs T. A., Giedt R. R., Cohen N., 1967, J. Chem. Phys., 47, 54
- Jappsen et al. (2009) Jappsen A.-K., Mac Low M.-M., Glover S. C. O., Klessen R. S., Kitsionas S., 2009, ApJ, 694, 1161
- Jarosik et al. (2011) Jarosik N., Bennett C. L., Dunkley J., Gold B., Greason M. R., Halpern M., Hill R. S., Hinshaw G., Kogut A., Komatsu E., Larson D., Limon M., Meyer S. S., Nolta M. R., Odegard N., Page L., Smith K. M., Spergel D., Tucker G. S., Weiland J. L., Wollack E., Wright E. L., 2011, ApJS, 192, 14
- Khare (1978) Khare V., 1978, J. Chem. Phys., 68, 4631
- Kramer & Bernstein (1964) Kramer K. H., Bernstein R. B., 1964, J. Chem. Phys., 40, 200
- Latif et al. (2013a) Latif M. A., Schleicher D. R. G., Schmidt W., Niemeyer J., 2013a, MNRAS, 433, 1607
- Latif et al. (2013b) Latif M. A., Schleicher D. R. G., Schmidt W., Niemeyer J., 2013b, MNRAS, 430, 588
- Latif et al. (2013c) Latif M. A., Schleicher D. R. G., Schmidt W., Niemeyer J. C., 2013c, ArXiv e-prints: 1309.1097
- Li et al. (2003) Li Y., Klessen R. S., Mac Low M.-M., 2003, ApJ, 592, 975
- Machida & Doi (2013) Machida M. N., Doi K., 2013, ArXiv e-prints: 1308.2754
- Machida et al. (2008) Machida M. N., Matsumoto T., Inutsuka S.-i., 2008, ApJ, 685, 690
- Martin et al. (1996) Martin P. G., Schwarz D. H., Mandy M. E., 1996, ApJ, 461, 265
- Omukai (2000) Omukai K., 2000, ApJ, 534, 809
- Orel (1987) Orel A. E., 1987, J. Chem. Phys., 87, 314
- Palla et al. (1983) Palla F., Salpeter E. E., Stahler S. W., 1983, ApJ, 271, 632
- Peebles & Dicke (1968) Peebles P. J. E., Dicke R. H., 1968, ApJ, 154, 891
- Peters et al. (2012) Peters T., Schleicher D. R. G., Klessen R. S., Banerjee R., Federrath C., Smith R. J., Sur S., 2012, ApJ, 760, L28
- Saslaw & Zipoy (1967) Saslaw W. C., Zipoy D., 1967, Nature, 216, 976
- Schleicher et al. (2008) Schleicher D. R. G., Banerjee R., Klessen R. S., 2008, Phys. Rev. D, 78, 083005
- Schleicher et al. (2010) Schleicher D. R. G., Banerjee R., Sur S., Arshakian T. G., Klessen R. S., Beck R., Spaans M., 2010, A&A, 522, A115
- Schneider et al. (2008) Schneider R., Salvaterra R., Choudhury T. R., Ferrara A., Burigana C., Popa L. A., 2008, MNRAS, 384, 1525
- Schober et al. (2012) Schober J., Schleicher D., Federrath C., Glover S., Klessen R. S., Banerjee R., 2012, ApJ, 754, 99
- Shui (1973) Shui V. H., 1973, J. Chem. Phys., 58, 4868
- Smith et al. (2011) Smith R. J., Glover S. C. O., Clark P. C., Greif T., Klessen R. S., 2011, MNRAS, 414, 3633
- Springel (2005) Springel V., 2005, MNRAS, 364, 1105
- Sur et al. (2010) Sur S., Schleicher D. R. G., Banerjee R., Federrath C., Klessen R. S., 2010, ApJL, 721, L134
- Susa (2013) Susa H., 2013, arXiv:1304.6794
- The Enzo Collaboration et al. (2013) The Enzo Collaboration Bryan G. L., et al. 2013, arXiv 1307.2265
- Tornatore et al. (2007) Tornatore L., Ferrara A., Schneider R., 2007, MNRAS, 382, 945
- Turk et al. (2009) Turk M. J., Abel T., O’Shea B., 2009, Science, 325, 601
- Turk et al. (2011a) Turk M. J., Clark P., Glover S. C. O., Greif T. H., Abel T., Klessen R., Bromm V., 2011a, ApJ, 726, 55
- Turk et al. (2012) Turk M. J., Oishi J. S., Abel T., Bryan G. L., 2012, ApJ, 745, 154
- Turk et al. (2011b) Turk M. J., Smith B. D., Oishi J. S., Skory S., Skillman S. W., Abel T., Norman M. L., 2011b, ApJS, 192, 9
- Whitlock et al. (1974) Whitlock P. A., Muckerman J. T., Roberts R. E., 1974, J. Chem. Phys., 60, 3658
- Yoshida et al. (2008) Yoshida N., Omukai K., Hernquist L., 2008, Science, 321, 669