Correspondent author. Current address: ]Los Alamos National Laboratory
A simple concentration-dependent pair interaction model for large-scale simulations of Fe-Cr alloys
Abstract
This work is motivated by the need for large scale simulations to extract physical information on the iron-chromium system which is a binary model alloy for ferritic steels used or proposed in many nuclear applications. From first principle calculations and the experimental critical temperature we build a new energetic rigid lattice model based on pair interactions with concentration and temperature dependence. Density Functional Theory calculations in both norm-conserving and projector augmented wave approaches have been performed. A thorough comparison of these two different ab initio techniques leads to a robust parameterization of the Fe-Cr Hamiltonian. Mean field approximations and Monte Carlo calculations are then used to account for temperature effects. The predictions of the model are in agreement with the most recent phase diagram at all temperatures and compositions. The solubility of Cr in Fe below 700 K remains in the range of about 6% to 12%. It reproduces the transition between the ordering and demixing tendency and the spinodal decomposition limits are also in agreement with the values given in the literature.
pacs:
61.80.Az,61.82.Bg,61.66.Dk, 61.50.LtI Introduction
As it has been extensively reported in the literature Caro et al. (2005); Malerba et al. (2008); Yvon and Carré (2009); Klueh and Nelson (2007), ferritic steels with a content in Cr ranging from 5 to 13 at. % present a set of features concerning their radiation damage resistance that makes them the strongest candidates for future nuclear energy applications as structural materials. To develop new materials capable of working at high irradiation doses we need to understand both their thermodynamic and kinetic properties. At high temperature, the kinetic evolution is rapid enough to observe the formation of the phase and the decomposition of Fe-Cr alloys into two body centered cubic (BCC) solid solutions, and and therefore the phase diagram is well-known. Below 700 K, the equilibrium state is still in debate. The phase diagrams available in usual compilations and database like CALPHAD Saunders and Miodownik (1998); SGTE et al. (2004); Kubaschewski (1982) are derived from high temperature experiments Williams (1974); Hertzman and Sundman (1982); Andersson and Sundman (1987); Chuang et al. (1987); Lin et al. (1987). They display an almost symmetrical - miscibility gap and yield a zero solubility limit of Cr in Fe at low temperature. However, first principles calculations by Hennion Hennion (1983) in 1983, confirmed a few years later by a neutron study of short range order (SRO) Mirebeau et al. (1984); Mirebeau and Parette (2010) have shown that Fe-Cr alloys display an ordering tendency for low chromium contents. This anomaly has been extensively studied using various ab initio methods and is now well understood, although the Cr concentration at which the sign of the mixing energy changes depends on the approach (from 5% up to approximately 10%) Olsson et al. (2003, 2006); Klaver et al. (2006); Paxton and Finnis (2008). This behavior has been rationalized in terms of an anti-alignment of the magnetic moment of Cr in the Fe matrix, the repulsion between first nearest neighbor (1nn) Cr, and the ordering tendency observed at low concentrations Klaver et al. (2006). Moreover, a few experimental observations in alloys submitted to irradiation have been recently reviewed by Bonny et al. Bonny et al. (2008). They suggest that the chromium solubility remains above 8%, even at low temperatures. This interpretation is based on the assumption that irradiation only results in an enhancement of diffusion and that more complex effects that could modify the solubility limit, such as ballistic disordering or radiation induced segregation, can be neglected. Recent critical reviews have therefore highlighted the need to modify the Fe-Cr phase diagram at low temperature Xiong et al. (2010); Bonny et al. (2008, 2010).
Several atomistic models have been proposed in this context to reproduce the complex thermodynamic behavior of Fe-Cr alloys. Semi-empirical potentials have been developed that take into account the change of sign of the mixing energy, such as the concentration dependent model (CDM) of Caro et al. Caro et al. (2005) or the Two-Band Model (2BM) of Olsson et al. Olsson et al. (2005) recently updated by Bonny et al. Bonny et al. (2011). A lot of work has been done in order to assess their thermodynamic properties as well as their dynamical behavior Bonny et al. (2009a); Erhart et al. (2008a, b); Bonny et al. (2009b). However, it remains difficult to develop a potential fitting simultaneously all the key properties that control the thermodynamics and kinetics of the Fe-Cr decomposition (such as the mixing energies, the point defects formation energies and migration barriers, with their dependence on the local atomic distribution and with the corresponding vibrational entropy contributions). Furthermore, magnetic contributions have not been introduced in these potentials. Because the kinetic modeling of phase transformations including atomic relaxations and vibrational contributions is a challenging task Bocquet (2002), these potentials are usually mapped on a rigid lattice model which in turn affects their thermodynamic and kinetic properties.
Cluster expansion (CE) techniques, based on a rigid lattice approximation with -body concentration-independent interactions, have been proposed to model the thermodynamics of Fe-Cr alloys Inden and Schon (2008); Lavrentiev et al. (2007); Nguyen-Manh et al. (2008). However, to be able to reproduce the ab initio mixing energies of Fe-Cr, a purely chemical CE (i.e. that does not take explicitly into account the magnetic moments) requires a large set of many-body interactions Nguyen-Manh et al. (2008); Lavrentiev et al. (2007). The difficulty of obtaining a small set of effective interactions was also reported by authors using a screened generalized perturbation method Ruban et al. (2008). Therefore, a cluster interaction model, although restricted to a rigid lattice description, remains quite heavy numerically. The whole corresponding phase diagram was not published, but following the trend of the empirical concentration-dependent energy models, it is expected that the critical temperature for the miscibility gap is way too high compared to experiments and classical CALPHAD database Saunders and Miodownik (1998); Andersson and Sundman (1987). Two missing ingredients in those CE models are the vibrational entropy (which is significant in the Fe-Cr system Swan-Wood et al. (2005); Lucas et al. (2008)) and the magnetic contributions. The screen generalized perturbation model has been used to show how the effective cluster interactions depend on the magnetic state of the alloy and therefore on the temperature Ruban et al. (2008) and the composition Korzhavyi et al. (2009). Mixed models including chemical and magnetic interactions have been proposed Ackland (2006); Inden and Schon (2008); Lavrentiev et al. (2010a, b). The Ising model by Ackland, with magnetic moments of constant amplitude, reproduces some key features of the Fe-Cr alloys. The magnetic cluster expansion of Lavrentiev et al. Lavrentiev et al. (2010a, b) is able to reproduce the ab initio mixing energies with much fewer interactions than a purely chemical CE and it can take into account the variation of the magnetic moments with the concentration, but its phase diagram has never been calculated in the - region. The last model we wanted to mention is the Stoner Hamiltonian developed by Nguyen-Manh and Dudarev Nguyen-Manh and Dudarev (2009). It is shown that all the significant features of the Fe-Cr alloys can be explained in terms of bonding effects involving 3d electron orbitals and magnetic symmetry-breaking effects resulting from intra-atomic on-site Stoner exchange. The complete phase diagram has not been reported for this Hamiltonian and, as it is said in the manuscript, further approximate computational algorithms will have to be developed suitable for large scale simulations.
Finally, it is worth noting that using a magnetic model in a kinetic simulation of the - decomposition (such as a kinetic Monte Carlo simulation) would require the relaxation of the atom-vacancy exchange events and magnetic moments transitions which probably occur at very different time scale. Even with simplifying assumption (e.g. if the relaxation time of the magnetic moment is negligible), it would make the simulation much more time consuming than for a non-magnetic model. We propose here an alternative model: a concentration and temperature dependent pair interaction model fitted on ab initio calculations and the experimental critical temperature of Fe-Cr alloys. The goal is to keep the model simple enough to be used in kinetic Monte Carlo simulations such as the one of Ref.Soisson and Fu, 2007.
The manuscript is organized as follows. In Sec.II the results from density functional theory (DFT) calculations on the energetics of the Fe-Cr system, that have been used to parameterize the interaction model, are reported. Because energy values, in the magnetic Fe-Cr system, depend on the method, we have performed our own ab initio calculations using two different methods. In Sec.III we present the concentration and temperature dependent pair interaction model and its phase diagram, computed in a mean-field approximation and by Monte Carlo simulations. The phase diagram, including the spinodal decomposition region, and the short range order are compared with available experimental data. Comparison with other models are discussed in Sec. IV. Finally, some conclusions and perspectives are highlighted.
II DFT calculations
Several studies have already been devoted to the calculations of energetic properties of FeCr alloys Olsson et al. (2003, 2006); Klaver et al. (2006); Paxton and Finnis (2008); Erhart et al. (2008a). We have nevertheless performed a new systematic first principles study in order to parameterize our interaction model in a self-consistent way. In particular, we have calculated the enthalpy of mixing of the FeCr alloy to account for its behavior in the whole concentration range. We have also estimated the interactions between two Cr(Fe) impurities in a bcc Fe(Cr) matrix, which allows to determine the cutoff of interactions distance of the pair-interaction model. Ferromagnetic (FM) Fe and (100)-layered antiferromagnetic (AF) Cr have been taken as reference states to obtain the values mentioned above. Note that even though the experimental magnetic ground state of pure bcc Cr is an incommensurate spin-density wave (SDW), the presence of Fe atoms seems to reduce the stability of such a long-ranged state. It, indeed, becomes unstable against the formation of AF structures with 1.6 of Fe Fawcett et al. (1994a). Because our interest is mainly focused on the Fe-rich side of the alloy, we assume the AF state for Cr in the present study.
Calculations are performed in the framework of Density Functional Theory as implemented in the PWSCF code et al. (2009). They are spin polarized within the Generalized Gradient approximation (GGA) with the PBE parametrization Perdew et al. (1996). We have used the Projector Augmented Wave (PAW) potential instead of pseudopotentials. The kinetic energy cutoff chosen for the plane-wave basis set was 544 eV. All the calculations are fully relaxed, i.e., both atomic positions and simulation-cell volumes are optimized. The corresponding residual force and stress tolerances are respectively 0.04 eV/Å and 5 kbar. We have also calculated the mixing enthalpies using norm-conserving (NC) pseudopotentials and localized basis sets, as implemented in the SIESTA code Soler et al. (2002). This approach has been shown to give results of equivalent accuracy as plane-wave DFT methods. In particular, properties of defects in various Fe based systems have been satisfactorly predicted Fu et al. (2004, 2005); Fu and Willaime (2005); Soisson and Fu (2007). It is however less computationally demanding thanks to significant reduction of the basis size. The aim is to check the ability of this less standard DFT approach for quantitative prediction of properties in FeCr alloys, where the energetics may be extremely sensitive to magnetic couplings Klaver et al. (2006); Soulairol et al. (2010).
II.1 Mixing Enthalpy
The enthalpy of mixing is defined as:
| (1) |
where is the total energy of a mixed system containing Fe atoms and Cr atoms. and are energies per atom of the Fe and Cr reference systems. Because the calculations are performed at zero pressure this value is also equivalent to the mixing energy.
The supercells used for different concentrations have been generated using two methods. The first generation method is "user"-chosen. It consists of a large set of ordered structures devised to explore various energetic landscapes (, B2, Fen-1Cr, FeCrm-1 etc.), the same as considered in a previous work on Fe-Cu alloys Soisson and Fu (2007). The other generation method is based on the special quasi-random structure methodology (SQS) Zunger et al. (1990)) which allows to generate a supercell with as small short range order as possible. These supercells are thus the best representative configurations of a random solid solution for each concentration. The number of atoms in each supercell is either 54 or 128.
The resulting mixing enthalpies for both ordered and SQS structures are shown in Fig. 1.
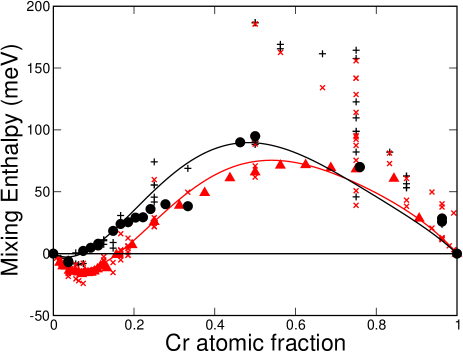
In good agreement with previous DFT results Olsson et al. (2007); Klaver et al. (2006), we note a change of sign of the mixing enthalpy, showing negative values for low Cr concentrations according to both PWSCF and SIESTA approaches. However, the range of this negative part of the enthalpy of mixing as well as its depth strongly depend on the approach. From the SIESTA-NC calculations the change in sign is around while with the PWSCF-PAW approach, the value is about .
First of all, we focus on two extreme cases, i.e., infinite dilution in Fe and Cr respectively, where we may also define the solution energy as:
| (2) |
where X and Y are either Fe or Cr, is the total energy of a supercell containing n-1 atoms of Y and one atom of X and and are the energy per atom of the pure systems: bcc FM Fe and AF Cr. The solution energies are well converged within 1meV for atoms. For the case of Cr dissolution in Fe we find a value of eV using PWSCF while SIESTA predicts eV. They are consistent with previous DFT values ranging between eV and eV Klaver et al. (2006); Olsson et al. (2007). We see that all DFT results predict Cr dissolution to be exothermic, i.e., energeticaly favorable to insert one substitutional Cr in the Fe matrix. However, the precise value reveals to be method dependent. In particular, the SIESTA-NC result overestimates the solution tendency of Cr in Fe with respect to the PWSCF-PAW data. In order to gain more insight into the origin of this overstimation, we have performed complementary PWSCF calculations using a NC pseudopotential (PWSCF-NC) as close as possible to that of SIESTA. The obtained Cr solution energy in Fe is -0.49 eV, very close to the SIESTA value. This comparison suggests that the overestimation of Cr solution energy is essentially due to the NC-pseudopotential approximation rather than the use of localized basis functions in the SIESTA approach. We have also checked that the magnitude of Cr solution energy is indeed closely correlated with the local magnetic moments of the Cr in Fe. The corresponding values from the PWSCF-PAW, PWSCF-NC and SIESTA-NC studies are 2.1 , 2.6 and 2.5 respectively. It is interesting to point out that the overstimation of the Cr solution energy from a NC pseudopotential prediction is closely correlated to the obtained higher value of Cr local moments with respect to the PAW value.
When a Cr atom is substituted by one Fe atom in the Cr matrix, the solution energy obtained was eV using PWSCF and eV with SIESTA, indicating an endothermic reaction. In this case, the Fe local magnetic moment found for the Fe impurity is within the precision limits, 0.02 while SIESTA gives 0.14 . In both cases the magnetic moment of the Fe solute is anti-alligned to the local moment of its first nearest neighbors. The local magnetic moment of all the Cr atoms remains, as expected, practically the same as in pure AF Cr. The small moment of Fe may be explained as a consequence of magnetic frustration resulting from the competition between the Fe and its first- and second-nearest Cr neighbors. As also suggested by a previous study Klaver et al. (2006), Fe and Cr first and second nearest neighbors prefer an antiferromagnetic coupling, which can clearly not be satisfied for an isolated Fe in a bcc AF Cr lattice.
Beyond the infinite diluted cases, ordered structures with a mixing energy lower than the SQS-random configurations () are observed at low Cr concentrations with both PWSCF and SIESTA. In particular, the system with the 2 Cr atoms separated by (1.5,1.5,1.5) times the bcc lattice parameter (a0) has an energy lower than the solid solution of the same composition, suggesting the possible formation of an intermetallic phase for that concentration at low temperatures. Indeed, the same structure has also been pointed out by Erhart et al. as a possible intermetallic system Erhart et al. (2008a). Other DFT calculations predict that the Fe15Cr Lavrentiev et al. (2007) or the Fe14Cr Pareige et al. (2009) ordered structures could be the ones forming the intermetallic compounds. However, it should be noticed that the relative stability of such phases is difficult to assess because their difference in formation energies is very close to the DFT uncertainties and because it remains to be verified whether they may exist at finite temperatures when the entropy becomes relevant.
On the other hand, at higher Cr concentrations, SQS systems show overall lower energy than the ordered configurations. This is indeed consistent with the positive mixing enthalpies suggesting a tendency to phase separation rather than ordering.
II.2 Impurity Interactions
In order to determine the cutoff distance of the pair interaction model for FeCr, we have also evaluated the interaction between two Cr(Fe) impurities in a bcc Fe(Cr) matrix. Binding energy between two X atoms nearest neighbors in a bcc lattice of Y atoms is defined as follows, where positive values mean attraction:
| (3) |
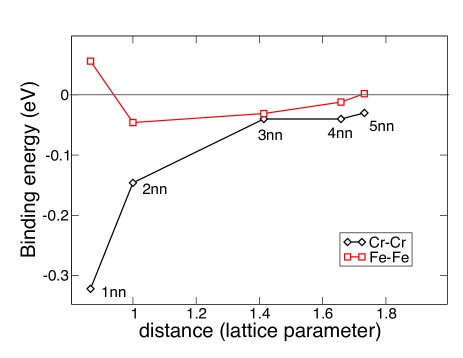
where is the total energy of the system with the two X atoms at a nearest neighbor distance, is the total energy of Y-atoms in the corresponding reference system (either ferromagnetic bcc Fe or antiferromagnetic bcc Cr), and is the total energy of the system of atoms with just one impurity atom. The values for the binding energies of Cr-Cr in Fe and Fe-Fe in Cr are shown in Fig. 2. The calculations have been done within the more accurate PAW approach using 128-atom supercells.
Consistent with previous DFT calculations Olsson et al. (2007) and with the experimentally observed ordering tendency at low Cr content, we find that two Cr atoms repel each other in a dilute FeCr alloy. Such repulsion is particularly strong for and interactions. The binding energies are -0.32 eV and -0.15 eV respectively from the PWSCF calculations. For to the Cr repulsion becomes significantly weaker (around -0.04 eV) according to our results (Fig. 2). It vanishes for farther Cr-Cr distances within the estimated error bar of 0.025 eV. As explained in previous studies Klaver et al. (2006), this Cr-Cr repulsion is directly correlated to the corresponding local magnetic structure. Local magnetic moments of both Cr atoms are found to be parallel to each other when they are close neighbors. Also, their moment amplitudes are reduced as compared with that of an isolated Cr (2.2 ). For instance, we find local moment reductions of around 0.1 for two and Cr atoms with respect to an isolated Cr. This can be understood as a magnetic frustration resulting from competition between various magnetic coupling tendencies, i.e., antiferromagnetic for Fe-Cr and Cr-Cr and ferromagnetic for Fe-Fe pairs. Indeed, when performing complementary calculations constraining all the Cr local moments to zero, the resulting Cr-Cr binding energies become negligible.
On the other hand, in the case of two Fe impurities in a Cr matrix, their binding energy is slightly positive for a separation (0.06 eV), whereas it is negative for the Fe-Fe pair (-0.05 eV). Beyond, all the values are repulsive, but their magnitudes are smaller than 0.03 eV, close to our estimated error bar (Fig. 2). It is interesting to mention that the change of interaction between the to the separations , i.e., from an attraction to a repulsion, may be linked to a change of local magnetic moments of the respective Fe atoms. Indeed, as discussed in Sec. II.1, an isolated Fe in the AF-Cr shows a small moment due to the magnetic frustration. It is also the case for all the Fe atoms separated by a distance or farther. However, the magnetic state can be expected to change when Fe atoms get close to each other. For instance, when they are first nearest neighbors, one of the two Fe atoms adopts a high moment of 2.11 whereas the other remains at a low-moment state (0.53). Both Fe moments align parallel to each other, but only the high-moment Fe is antiferromagnetically coupled to its Cr first-nearest neighbors. This assymetric configuration suggests that at least the magnetic frustration of one iron atom, i.e., the high-moment Fe, is partly relaxed, inducing a decrease of the system energy. It is worth mentioning that other metastable states may also exist for the Fe-Fe case. For instance, we have found another magnetic configuration where both Fe atoms have low local moments. The corresponding binding energies is practically zero.
Even though the absolute values of Cr-Cr interaction energies in Fe are overall larger than the corresponding Fe-Fe values, in both cases, the range of the significant interactions is up to a second-nearest neighbor distance, which may therefore be reasonably considered as the cutoff distance for our pairwise energetic model as described below (Sec. III).
III Thermodynamic model
III.1 Constant pair interactions (Ising model)
Our objective is now to build an interaction model able to take into account the key energetic properties revealed by DFT calculations and to predict a phase diagram in agreement with the experimental one. The most simple model of phase separation in a binary A-B alloy is probably the Ising model, with constant pair interactions , and between A and B atoms on neighbor sites. The mixing free enthalpy of a solid solution can be computed using mean-field (MF) approximations (see e.g. Porter and Easterling (1992)). With the simplest Bragg-Williams (BW) approximation and when , one gets for the mixing enthalpy:
| (4) |
While the configurational entropy of mixing is given by:
| (5) |
where is the B atomic fraction and the Boltzmann constant,
| (6) |
is the ordering energy and the coordination number of shell i. The minimization of the free enthalpy gives a symmetrical miscibility gap, with a critical temperature . In the BW approximation, when all the combination are negative, the phase diagram depends exclusively on and not on the distribution of the interactions among the different coordination shells . This approach neglects the short range order in the solid solution. In the specific case of alloys with nearest neighbors interactions, the BW critical temperature is 20% larger than the Monte Carlo reference value Domb (1974). The discrepancy decreases with the range of interactions (for infinitely long-range interactions, mean-field approximations become exact Domb and Dalton (1966)).
III.2 Composition-dependent pair interactions
A constant pair interaction model always gives symmetrical mixing energies and phase diagrams and therefore cannot reproduce the DFT mixing energies of Fe-Cr alloys (Fig. 1), with negative mixing energies in the Fe-rich configurations only. To be able to reproduce the mixing enthalpy in the whole concentration range we introduce pair interactions that depend on the local composition, using a polynomial expression. In the BW approximation, the mixing enthalpy is given by:
| (7) |
also known as the Redlich-Kister formalism Redlich and Kister (1948). is the maximum order of the parametrization and is called interaction parameter of order and it has the form:
| (8) |
The parameters at 0 K (i.e. the parameters) are fitted on the mixing energies of the SQS structures presented in sec. II. Ordered structures are not taken into account because the SQS configurations are more representative of a random solid solution described by the BW approximation. The best fit we have found (see Fig. 1) is of the form:
| (9) |
where the values of , , and for the PWSCF-PAW and SIESTA-NC results are given in table 1. The maximum of the in the PWSCF-PAW fit is at with a value of 0.089 eV, whereas for the SIESTA-NC and the value is 0.071 eV.
| PWSCF-PAW | SIESTA-NC | |
|---|---|---|
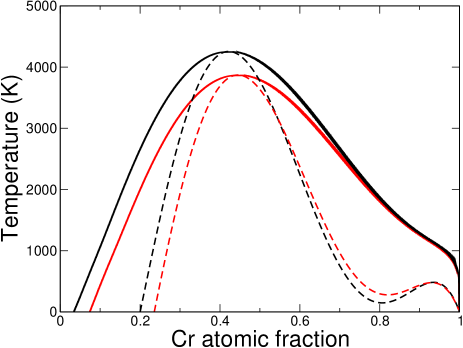
The corresponding phase diagram has been first computed in the BW approximation, with , i.e. with temperature independent pair interactions (see Fig.3). We observe that the solubility limits are non-symmetric. The solubility of Cr in Fe does not vanish at 0K. On the other hand, the Fe solubility in Cr is negligible at that temperature. The non-zero solubility limit on the Fe rich side is in contradiction with the reference phase diagram given by CALPHAD Andersson and Sundman (1987) but in accord with more recent studies Bonny et al. (2008); Xiong et al. (2010); Bonny et al. (2010, 2011). The critical temperature (about 4200 K for the PWSCF-PAW parametrization and 3800 K for the SIESTA-NC values) is much higher than the experimental one (approximately 1000 K Xiong et al. (2010)). The spinodal limits for both parametrizations, defined as:
| (10) |
are shown in the same Fig. 3. We observe an unusual local minimum (for ) on the Cr rich side. This phenomenon occurs at temperatures lower than 500 K, regime where data is difficult to obtain experimentally due to slow kinetics. The phase diagram obtained with the PWSCF-PAW and SIESTA-NC parameters are qualitatively similar. Since the PWSCF-PAW is more reliable and for the sake of clarity, we will only discuss the corresponding results in the following.
The phase diagram has also been computed by Monte Carlo simulations in the semi-grand canonical ensemble Frenkel and Smit (2001). In the BW approximation, as for the constant interaction model, the phase diagram only depends on the ordering enthalpy (Eq. 9). For the Monte Carlo simulations for the same ordering energy, one must consider the pair interactions , and , the range of interactions and the way they decrease with the distance. For the sake of simplicity we have chosen that cross interactions carry the dependency on the local concentration. The self-interactions and are considered as constants given by the cohesive energies of the pure elements, according to (Caro and coworkers followed the same strategy in the development of their CDM model Caro et al. (2005)). The local Cr concentration around a Fe-Cr pair is defined as the fraction of Cr atoms among their neighbors. If the interactions are limited to the nearest-neighbors, the local chromium concentration around a Fe atom on site and a Cr atom on site is defined as:
where when the neighbor of the site at a neighbor position is occupied by a Cr atom. We also include in the calculation the type of the atoms in sites i and j.
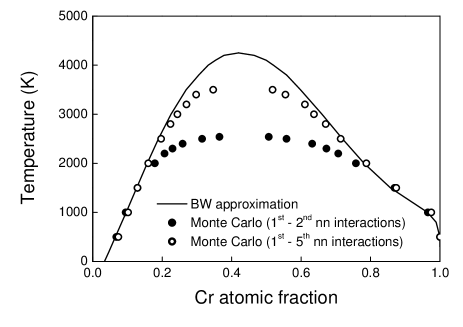
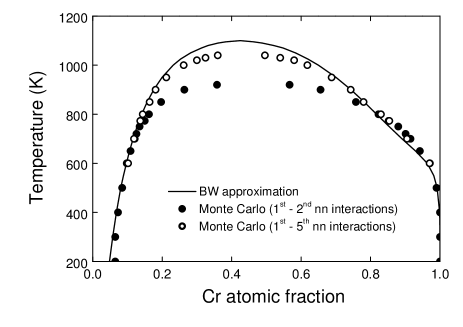
To assess the effect of the interaction range, we have used two sets of pair interactions. One has to consider enough neighbors to get a sufficient discretization of the mixing energy with its change of sign at 7%, so that first nearest-neighbor interactions are not enough. Therefore, the first set of parameters is limited to first and second neighbor interactions, with the second neighbor interactions two times smaller than the first ones (. The second set includes up to the fifth nearest-neighbors interactions and they decrease more slowly, as the inverse of interatomic distance.
The resulting phase diagrams are compared with the BW approximation on Fig. 4: at low temperature, the BW approximation is close to the Monte Carlo results. At high temperature it underestimates the mutual solubility of Fe and Cr and overestimates the critical temperature, by approximately 40% when the interactions are limited to the first and second neighbor shells. The discrepancy is then two times larger than for the usual Ising model. The critical temperature of the Monte Carlo simulations is significantly higher with interactions up to the fifth neighbors. This is in agreement with the usual tendency, where the mean field and Monte Carlo results converge for infinite interaction range Domb and Dalton (1966).
III.3 Temperature dependence
The critical temperatures calculated by the composition-dependent approach, shown in Figs. 3 and 4, lay well above the critical temperature observed experimentally for this system, of about 1000 K Xiong et al. (2010). The CDM potential shows the same deviation, as does the chemical CE (see section IV).
We rationalize this difference in terms of the mayor effects that are not taken into account:
- The competition between magnetic and chemical interactions.
- The intrinsic nature and the amplitude of the atomic magnetic moments change. The magnetic moments decrease with the temperature what in turn decreases the pair interaction strength Fawcett et al. (1994b).
- The vibrational entropy.
- The magnetic entropy.
One could in principle evaluate the vibrational entropy from DFT calculations, for instance in the harmonic approximation, but would be obliged to take the rest of the temperature effects empirically. We consequently decided to introduce an empirical temperature dependency on the ordering energy to compensate all the effects of the non-configurational entropies and magnetic contributions. In order to keep the simplicity of the model and to get a phase diagram closer to the experimental one we assign to the ordering energy a simple linear dependency on temperature:
| (11) |
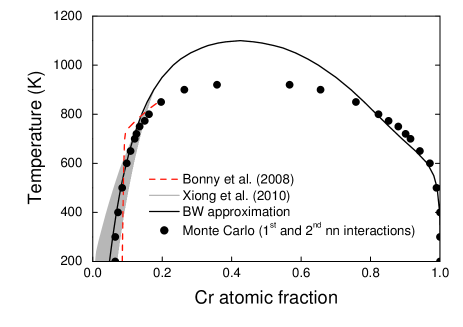
where has units of temperature and it is adjusted such that the Monte Carlo simulations yield the experimental critical temperature ( 1000 K). This effect is again taken into account solely to fit the pair interaction cross term . We find K using the PWSCF-PAW parameters. The phase diagram as given by this model is shown in Fig. 5. It is worth noting that it is not just a temperature rescaling of the one in Fig. 4, since the configurational entropy is not changed. As a consequence the BW and the Monte Carlo results are closer than before. These results match quite well the collection of experimental results reported by Xiong et al. Xiong et al. (2010) and Bonny et al. Bonny et al. (2008) (Fig. 6). The Cr solubility in Fe is larger than 0 at low temperatures. Following the results by Xiong et al. the solubility limit at 250 K should be between 1 and 7%. We have obtained a value of around 7% with our model. The solubility limit in the Cr rich side is lower than 1% at temperatures below 600 K. At very low temperatures the Monte Carlo results show a solubility of Cr in Fe of about 6%.
Long runs of Monte Carlo simulations at lower temperatures seem to confirm that the Cr solubility in Fe at zero temperature is different from zero. This unusual aspect of a demixing alloy can be explained by the change of sign of the mixing energy, as already mentioned. No evidence of long-range ordered structure has been observed above 200 K. At lower temperature, the stability of such structures is difficult to study because the efficiency of the Monte Carlo algorithm decreases. A negative ordering energy invariant with respect to the local concentration would imply the stabilization of an ordered phase. At 0 K, the solid solution would be less energetically favorable than the two-phase system formed by the ordered phase and a pure phase. However, in the case of a concentration dependent model, it is possible that in the small concentration range associated with a negative value of the ordering energy there is no formation of an ordered phase and then stabilization of the solid solution.
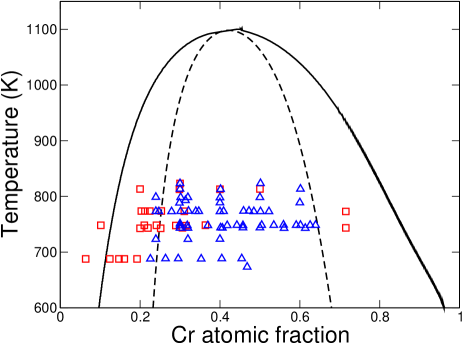
The spinodal decomposition limits as given by our concentration and temperature dependent model are shown in Fig. 7 (computed in the BW approximation) where they are compared to the experimental data compiled by Xiong et al. Xiong et al. (2010) obtained in the temperature range of 650 to 800 K. The existence of a strictly defined limit between two kinetic regimes (nucleation and growth and spinodal decomposition) is debatable Binder (2001). Nevertheless, we observe in Fig. 7 that the spinodal limits we are proposing are in good agreement with the existing experimental data.
III.4 Short Range order
The negative part of the enthalpy of mixing at low Cr concentrations induces the formation of short range order (SRO) structures in the Fe-Cr alloy, as shown experimentally by Mirebeau et al. Mirebeau et al. (1984); Mirebeau and Parette (2010) who measured the Cowley-Warren SRO parameter for different Cr contents via neutron diffraction at 703 K. They observed a change in sign in the parameter at around 10% Cr, showing a minimum close to 5%. This inversion of sign was earlier predicted by Hennion Hennion (1983) carrying out ab initio calculations on ferromagnetic systems.
The analysis of the SRO parameter is of technological importance because of its implications on the mechanical properties of the alloy. It is usually defined following the Cowley’s notation Cowley (1950a, b) where the expression for the atomic shell of a B atom in an A-B binary allow is given by:
| (12) |
where denotes the number of A atoms in the shell from a B atom, is the total number of atoms in the shell and is the global concentration of B atoms. The value of this parameter will tend to 1 in a segregated alloy and it will be close to 0 for a random solution. For a system with ordering tendency the value will be negative, with a minimum given by:
| (13) |
This latter value indicates the maximum degree of short range order that an alloy can possibly attain. In the studies by Mirebeau et al. the parameter that is actually measured is specific for BCC structures, defined for the Fe-Cr system as:
| (14) |
To be able to compare to the experimental measurements and to the recently published data based on the empirical energetic models described above, we have performed equilibrium Monte Carlo calculations in the semigrand-canonical ensemble Frenkel and Smit (2001) and measured the parameter described in eq. 14 for different Cr concentrations. Results are shown in Fig. 8 where the concentration and temperature dependent model was used with interactions up to the . We observe that the model slightly overstimates the ordering tendency but captures the ordering trend of the alloy for small Cr concentrations. The values tend to with temperature due to entropic effects. The solubility limits are also shown in the figure. Beyond the solubility limit, the SRO parameters are measured in metastable solid solutions which remain homogeneous during the simulation.
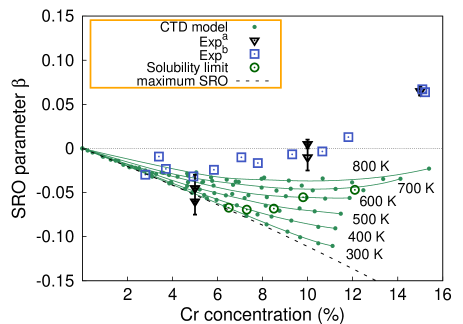
We have shown how the model captures the ordering tendency of Cr in the Fe matrix. The parameter becomes negative for low Cr concentrations. Experiments show the same trend, with negative values for low Cr concentration and a change in sign at around . This inversion of sign observed experimentally is probably due to the presence of a secondary phase, as explained by Erhart et al. Erhart et al. (2008b). Our results are in very good agreement with those presented in Erhart et al. (2008b) using the CDM semiempirical potential Caro et al. (2005).
IV Discussion
The results given above show that the simple pair interaction model described along the manuscript is able to reproduce the main features of the experimental phase diagram. In the following we are going to analyze the matches and the disagreements between our model and existing models in the literature with special attention to the Cr solubility in Fe, since it controls the precipitation driving force.
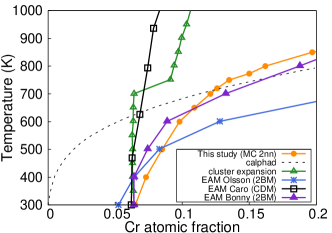
Our model has been fitted to the experimental critical temperature following the CALPHAD approach by Andersson and Sundman Andersson and Sundman (1987) (dotted line in Fig. 9) and therefore it reproduces the value given by the regular solution results but with a solubility limit of Cr in Fe different from zero. The magnetic model proposed by Inden and Schn Inden and Schon (2008) following a cluster variation method was fitted to high temperature values of the experimental phase diagram. It reproduces the magnetic phase transitions with a critical temperature for the miscibility gap of around 880 K. The solubility limits at low temperature tend to in both sides of the phase diagram. It would be interesting to see the results of this model with the parameters fitted to ab initio results. In the magnetic Ising model by Ackland Ackland (2006) the temperature is not in real units and it is hard to compare. However, it reproduces the magnetic transitions in spite of its simplicity and results in an asymmetric phase diagram. Concerning the non-magnetic CE of Lavrentiev et al. Lavrentiev et al. (2007); Bonny et al. (2009a), the solubility of Cr in Fe at low temperatures reported in that study matches the values obtained with our model (see Fig. 9), even though the curves deviate for temperatures above 400 K, with the solubility predicted by our approach larger than the one given by the CE. This CE development does not take into account the vibrational or magnetic entropy which results in low solubility at high temperatures.
The semi-empirical interatomic potentials existing in the literature and described in Sec. I have not been fitted to the phase diagram itself, but only to the enthalpy of mixing at 0 K. The original 2BM predicts a symmetric mixing enthalpy, with two changes of sign at low and high Cr concentration implying a non-zero Fe concentration in Cr at low temperatures. The vibrational entropy is found to be very high what implies a decrease in the critical temperature to around 750 K (EAM Olsson in Fig. 9). For the new version of the potential, the mixing enthalpy is non-symmetric, following the DFT results by Olsson et al Olsson et al. (2007) using SQS structures. Therefore, the solubility of Fe in Cr is closer to the experimental values. The vibrational entropy is lower in this case which increases the critical temperature to a value close to 1100 K (EAM Bonny in Fig. 9). The CDM is fitted to the enthalpy of mixing of the alloy as given by exact muffin-tin orbitals theory within the coherent potential approximation (EMTO-CPA) calculations Olsson et al. (2003). The maximum value is, in this case, higher than using SQS-PAW structures. This effect, added to the fact that the vibrational entropy is lower, results in a critical temperature above the experimental melting temperature (EAM Caro in Fig. 9). These models have been fitted to 0 K enthalpy of mixing curves. Both Fe and Cr undergo a magnetic transition at high temperatures (around 1043 K for Fe and 312 K for Cr). This means that calculations beyond the magnetic critical temperature of the alloy are out of their scope. In a kinetic calculation in a rigid lattice Bonny et al. (2009c); Pareige et al. (2011) using these potentials directly, the vibrational contribution to the entropy is not taken into account, which modifies the solubility limits and therefore the chemical composition in each phase. More specifically, the experimental solubility limit at 773 K in the Fe rich side of the phase diagram is about 14-15% Novy et al. (2009); Xiong et al. (2010); Bonny et al. (2009a). On the other hand, the original 2BM potential (according to the latest reported values Bonny et al. (2011)) gives no miscibility gap at 773 K, while, if the data shown in Ref. Bonny et al., 2009a is still valid, the solubility limit at the same temperature without the vibrational contribution is around 8%. The new version of the potential gives a solubility about 20% and it seems more suitable for these kind of kinetic calculations because its vibrational entropy is lower. However, there is no information about the values for the solubility without taking into consideration the vibrational entropy. For the CDM potential the solubility at this temperature is already too low. Its vibrational entropy contribution is small and, therefore, the values for the solubility limits in a rigid lattice model will not be strongly modified. Although, the variation will persist and care should be taken if kinetic simulations on a rigid lattice are to be performed. This discrepancy between the relaxed models versus the rigid lattice approximations will result in the wrong thermodynamic forces as taken into account in the kinetic calculation. In the studies on precipitation kinetics published in Refs. Bonny et al., 2009b, c; Pareige et al., 2009, 2011 nucleation starts around 10%, in disagreement with experiments. It is worth noting that describing this concentration region accurately is important for industrial applications.
Our model avoids such a drawback which makes it more useful for kinetic calculations. In our model, the pair interactions depend on the temperature taking in this way into account the magnetic and vibrational contributions to the entropy. This approximation will not be able to reproduce the magnetic transitions either for the pure elements or the alloy. Even though the ferromagnetic-paramagnetic transition in Fe is not linear with the temperature and neither it is in Cr or the alloy, the simple model described is able to reproduce the experimental phase diagram by adding just one extra degree of freedom. This extra degree of freedom does not affect the computational performance and makes it suitable for large-scale calculations.
V Conclusion
We propose in this article a rigid lattice model based on concentration and temperature dependent pair interactions to describe the thermodynamics of Fe-Cr system in the whole concentration range. It is fitted to both ab initio calculations of the enthalpy of mixing at 0 K and to the experimental critical temperature. Only the cross terms of the atomic pair interactions depend on both the local concentration and the temperature, while the self interaction terms are fitted to the respective cohesive energies. In order to check the sensitivity of energetic values in FeCr alloys against DFT implementations with different approximations, and to choose the most accurate values of the enthalpy of mixing, we have performed a set of first principle calculations. We carried out the calculations from two different kind of approaches. The first one was the norm-conserving pseudopotential approach as implemented in the efficient SIESTA-NC code and the second the more robust projector-augmented wave as implemented in the PWSCF code. Both approaches give the same qualitative trend, but different quantitative mixing energies at 0 K. The resulting models are similar, although the SIESTA values overestimate slightly the Cr solubility in Fe.
Although its simplicity and even though it does not explicitly consider the magnetic degrees of freedom, this approach captures the main features of the Fe-Cr thermodynamics: thanks to the concentration dependence of the pair interactions, it reproduces the transition between the ordering and demixing tendency, and the trend in the short-range order parameter when the Cr content increases. The magnetic and non-configurational entropic contributions are taken into account by a linear temperature dependence of the pair interactions. The resulting phase diagram is in very good qualitative and quantitative agreement with the experimental results. Finally, the model remains simple enough to be used in Monte Carlo simulations of the solid solution decomposition kinetics (preliminary results can be found in Ref. Martinez et al., 2011).
Acknowledgements.
The authors gratefully acknowledge E. Clouet for useful discussions. This research has received partial funding from the European Atomic Energy Community’s 7th Framework Programme (FP7/2007-2011), under grant agreement number 212175 (GetMat project). Part of this work was performed using HPC ressources from GENCI-CINES (Grant 2011-x2011096020). E. Martinez wants to thank the Spanish Ministry of Science and Innovation, subprogram Juan de la Cierva and the Energy Frontier Research Center, Center for Materials at Irradiation and Mechanical Extremes at Los Alamos National Laboratory (DOE-BES) for partial funding.References
- Caro et al. (2005) A. Caro, D. Crowson, and M. Caro, Physical Review Letters 95, 075702 (2005).
- Malerba et al. (2008) L. Malerba, A. Caro, and J. Wallenius, Journal Nuclear Materials 382, 112 (2008).
- Yvon and Carré (2009) P. Yvon and F. Carré, Journal of Nuclear Materials 385, 217 (2009).
- Klueh and Nelson (2007) R. L. Klueh and A. T. Nelson, Journal of Nuclear Materials 371, 37 (2007).
- Saunders and Miodownik (1998) N. Saunders and A. P. Miodownik, CALPHAD Calculation of Phase Diagrams, A Comprehensive Guide (Pergamon, 1998).
- SGTE et al. (2004) SGTE, P. Franke, and D. Neuschuetz, in Physical Chemistry, IV/19B2 (Landolt-Boernstein, 2004).
- Kubaschewski (1982) O. Kubaschewski, Iron Binary Phase Diagrams (Springer-Verlag, 1982).
- Williams (1974) R. Williams, Metallurgical and Materials Transactions B 5, 967 (1974).
- Hertzman and Sundman (1982) S. Hertzman and B. Sundman, Calphad 6(1), 67 (1982).
- Andersson and Sundman (1987) J. O. Andersson and B. Sundman, Calphad 11(1), 83 (1987).
- Chuang et al. (1987) Y. Y. Chuang, J. C. Lin, and Y. A. Chang, Calphad 11, 57 (1987).
- Lin et al. (1987) J. C. Lin, Y. Y. Chuang, K. C. Hsieh, and Y. A. Chang, Calphad 11(1), 73 (1987).
- Hennion (1983) M. Hennion, Journal of Physics F: Metal Physics 13, 2351 (1983).
- Mirebeau et al. (1984) I. Mirebeau, M. Hennion, and G. Parette, Physical Review Letters 53, 687 (1984).
- Mirebeau and Parette (2010) I. Mirebeau and G. Parette, Physical Review B 82, 104203 (2010).
- Olsson et al. (2003) P. Olsson, I. A. Abrikosov, L. Vitos, and J. Wallenius, Journal of Nuclear Materials 321, 84 (2003).
- Olsson et al. (2006) P. Olsson, I. A. Abrikosov, and J. Wallenius, Physical Review B 73, 104416 (2006).
- Klaver et al. (2006) T. P. C. Klaver, R. Drautz, and M. W. Finnis, Physical Review B 74, 094435 (2006).
- Paxton and Finnis (2008) A. T. Paxton and M. W. Finnis, Physical Review B 77, 024428 (2008).
- Bonny et al. (2008) G. Bonny, D. Terentyev, and L. Malerba, Scripta Materialia 59, 1193 (2008).
- Xiong et al. (2010) W. Xiong, M. Selleby, Q. Chen, J. Odqvist, and Y. Du., Critical Reviews in Solid State and Materials Science 35, 125 (2010).
- Bonny et al. (2010) G. Bonny, D. Terentyev, and L. Malerba, Journal of Phase Equilibria and Diffusion 31, 439 (2010).
- Olsson et al. (2005) P. Olsson, J. Wallenius, C. Domain, K. Nordlung, and L. Malerba, Phys. Rev. B 72, 214119 (2005).
- Bonny et al. (2011) G. Bonny, R. Pasianot, D. Terentyev, and L. Malerba, Philosophical Magazine 91, 1724 (2011).
- Bonny et al. (2009a) G. Bonny, R. C. Pasianot, L. Malerba, A. Caro, P. Olsson, and M. Y. Lavrentiev, Journal of Nuclear Materials 385, 268 (2009a).
- Erhart et al. (2008a) P. Erhart, B. Sadigh, and A. Caro, Applied Physic Letters 92, 141904 (2008a).
- Erhart et al. (2008b) P. Erhart, A. Caro, M. S. de Caro, and B. Sadigh, Physical Review B 77, 134206 (2008b).
- Bonny et al. (2009b) G. Bonny, D. Terentyev, and L. Malerba, Journal of Nuclear Materials 385, 278 (2009b).
- Bocquet (2002) J.-L. Bocquet, Defect and Diffusion Forum 203 - 205, 81 (2002).
- Inden and Schon (2008) G. Inden and C. G. Schon, Calphad 32(4), 661 (2008).
- Lavrentiev et al. (2007) M. Y. Lavrentiev, R. Drautz, D. Nguyen-Mahn, T. P. C. Klaver, and S. L. Dudarev, Physical Review B 75, 014208 (2007).
- Nguyen-Manh et al. (2008) D. Nguyen-Manh, M. Lavrentiev, and S. Dudarev, C.R. Physique 9, 379 (2008).
- Ruban et al. (2008) A. V. Ruban, P. A. Korzhavyi, and B. Johansson, Phys. Rev. B 77, 094436 (2008).
- Swan-Wood et al. (2005) T. L. Swan-Wood, O. Delaire, and B. Fultz, Physical Review Letters 72 (2005).
- Lucas et al. (2008) M. S. Lucas, M. Kresh, R. Stevens, and B. Fultz, Physical Review B 77 (2008).
- Korzhavyi et al. (2009) P. A. Korzhavyi, A. V. Ruban, J. Odqvist, J. O. Nilsson, and B. Johansson, Physical Review B 79, 054202 (2009).
- Ackland (2006) G. J. Ackland, Physical Review Letters 97, 015502 (2006).
- Lavrentiev et al. (2010a) M. Y. Lavrentiev, D. Nguyen-Mahn, and S. L. Dudarev, Physical Review B 81, 184202 (2010a).
- Lavrentiev et al. (2010b) M. Y. Lavrentiev, D. Nguyen-Manh, and S. L. Dudarev, Computational Material Science 4, 199 (2010b).
- Nguyen-Manh and Dudarev (2009) D. Nguyen-Manh and S. Dudarev, Physical Review B 80, 104440 (2009).
- Soisson and Fu (2007) F. Soisson and C.-C. Fu, Phys. Rev. B 76, 214102 (2007).
- Fawcett et al. (1994a) E. Fawcett, H. Alberts, V. Galkin, D. Noakes, and J. Yakhmi, Review Modern Physics 66, 25 (1994a).
- et al. (2009) P. G. et al., J. Phys. Condens. Matter 21, 395502 (2009).
- Perdew et al. (1996) J. Perdew, K. Burke, and M. Ernzerhof, Phys. Rev. Lett. 77, 3865 (1996).
- Soler et al. (2002) J. M. Soler, E. Artacho, J. D. Gale, A. Garcia, J. Junquera, P. Ordejón, and D. Sanchez-Portal, J. Phys. Condens. Matter 14, 2745 (2002).
- Fu et al. (2004) C. C. Fu, F. Willaime, and P. Ordejón, Physical Review Letters 92, 175503 (2004).
- Fu et al. (2005) C. C. Fu, J. Dalla Torre, F. Willaime, J.-L. Bocquet, and A. Barbu, Nature Materials 4, 68 (2005).
- Fu and Willaime (2005) C. C. Fu and F. Willaime, Physical Review B 72, 064117 (2005).
- Soulairol et al. (2010) R. Soulairol, C.-C. Fu, and C. Barreteau, Journal of Physics: Condensed Matter 22, 295502 (2010).
- Zunger et al. (1990) A. Zunger, S. H. Wei, L. G. Ferreira, and J. E. Bernard, Physical Review Letters 65, 353 (1990).
- Olsson et al. (2007) P. Olsson, C. Domain, and J. Wallenius, Physical Review B 75, 014110 (2007).
- Pareige et al. (2009) C. Pareige, C. Domain, and P. Olsson, J. Appl. Phys. 106, 104906 (2009).
- Porter and Easterling (1992) D. Porter and K. E. Easterling, Phase transformations in metals and alloys (Chapman & Hall, 1992).
- Domb (1974) C. Domb, in Phase Transitions and Critical Phenomena, Vol. 3, edited by C. Domb and M. Green (Academic Press, 1974) Chap. 6, p. 357.
- Domb and Dalton (1966) C. Domb and N. C. Dalton, Procceding Physical Society 89, 859 (1966).
- Redlich and Kister (1948) O. Redlich and A. T. Kister, Industrial and Engineering Chemistry 40, 345 (1948).
- Frenkel and Smit (2001) D. Frenkel and B. Smit, Understanding Molecular Simulation (Academic Press, 2001).
- Fawcett et al. (1994b) E. Fawcett, H. L. Alberts, V. Y. Galkin, D. R. Noakes, and J. V. Yakhmi, Rev. Mod. Phys. 66, 25 (1994b).
- Binder (2001) K. Binder, “Spinodal decomposition,” (Weinheim : Chichester : Wiley-VCH, c2001, 2001) Chap. 6.
- Cowley (1950a) J. M. Cowley, Journal of Applied Physics 21, 24 (1950a).
- Cowley (1950b) J. M. Cowley, Physical Review 77, 5 (1950b).
- Bonny et al. (2009c) G. Bonny, D. Terentyev, L. Malerba, and D. V. Neck, Phys. Rev. B 79, 104207 (2009c).
- Pareige et al. (2011) C. Pareige, M. Roussel, S. Novy, V.Kuksenko, P. Olsson, C. Domain, and P. Pareige, Acta Materialia 59, 2404 (2011).
- Novy et al. (2009) S. Novy, P. Pareige, and C. Pareige, J. Nucl. Mater. 384, 96 (2009).
- Martinez et al. (2011) E. Martinez, C.-C. Fu, M. Levesque, M. Nastar, and F. Soisson, Solid State Phenomena 172-174, 1146 (2011).