Low-amplitude rotational modulation rather than pulsations in the CoRoT B-type supergiant HD 46769††thanks: Based on CoRoT space-based photometric data; the CoRoT space mission was developed and operated by the French space agency CNES, with the participation of ESA’s RSSD and Science Programmes, Austria, Belgium, Brazil, Germany, and Spain. Based on observations collected at La Silla Observatory, ESO (Chile) with the HARPS spectrograph at the 3.6 m telescope, under programme LP185.D-0056. Based on observations obtained with the HERMES spectrograph attached to the 1.2m Mercator telescope, which is supported by the Fund for Scientific Research of Flanders (FWO), Belgium, the Research Council of KU Leuven, Belgium, the Fonds National de la Recherche Scientific (FNRS), Belgium, the Royal Observatory of Belgium, the Observatoire de Genève, Switzerland, and the Thüringer Landessternwarte Tautenburg, Germany. Based on observations obtained with the Narval spectropolarimeter at the Observatoire du Pic du Midi (France), which is operated by the Institut National des Sciences de l’Univers (INSU).
Abstract
Aims. We aim to detect and interpret photometric and spectroscopic variability of the bright CoRoT B-type supergiant target HD 46769 (). We also attempt to detect a magnetic field in the target.
Methods. We analyse a 23-day oversampled CoRoT light curve after detrending and spectroscopic follow-up data using standard Fourier analysis and phase dispersion minimization methods. We determine the fundamental parameters of the star, as well as its abundances from the most prominent spectral lines. We perform a Monte Carlo analysis of spectropolarimetric data to obtain an upper limit of the polar magnetic field, assuming a dipole field.
Results. In the CoRoT data, we detect a dominant period of 4.84 d with an amplitude of 87 ppm and some of its (sub-)multiples. Given the shape of the phase-folded light curve and the absence of binary motion, we interpret the dominant variability in terms of rotational modulation, with a rotation period of 9.69 d. Subtraction of the rotational modulation signal does not reveal any sign of pulsations. Our results are consistent with the absence of variability in the Hipparcos light curve. The spectroscopy leads to a projected rotational velocity of 72 km s-1 and does not reveal periodic variability or the need to invoke macroturbulent line broadening. No signature of a magnetic field is detected in our data. A field stronger than G at the poles can be excluded, unless the possible non-detected field were more complex than dipolar.
Conclusions. The absence of pulsations and macroturbulence of this evolved B-type supergiant is placed into the context of instability computations and of observed variability of evolved B-type stars.
Key Words.:
Stars: individual: HD 46769 – Techniques: spectroscopic – Stars: fundamental parameters – Stars: rotation – Stars: supergiants1 Introduction
High-precision space asteroseismic data delivered by the MOST (Walker et al. 2003), CoRoT (Auvergne et al. 2009), and Kepler (Gilliland et al. 2010) missions have revolutionised our capacity to probe the interior physics and evolutionary status of various types of stars. For a few selected highlights concerning main-sequence stars with masses ranging from solar to 25 M⊙, as well as low-mass evolved stars in various nuclear burning stages, see, e.g. Michel et al. (2008), Huat et al. (2009), Degroote et al. (2010), Briquet et al. (2011), Bedding et al. (2011), Charpinet et al. (2011), Michel & Baglin (2012), Beck et al. (2012), Chaplin & Miglio (2013). Despite the immense and fast progress, the evolutionary models for some types of stars remain uncalibrated in terms of high-precision asteroseismic constraints. This is particularly the case for evolved massive stars, while models of such objects have a large impact on various research areas of astrophysics, such as the computation of models with time-variable mass loss for core-collapse supernovae progenitors or the estimation of the chemical enrichment of galaxies.
Only three massive supergiants have been studied in detail from uninterrupted, time-resolved high-precision space photometry so far. The first case concerns the B2Ib/II star HD 163899, for which Saio et al. (2006) reported the discovery of tens of pressure and gravity modes with frequencies below 2.8 d-1 (32.4 Hz), and amplitudes below a few mmag from a 37 d MOST light curve. Although hot supergiant models for masses between 20 and 24 M⊙ and their pulsation predictions showed qualitative agreement with the observations, the interior physics of those models could not be improved due to the lack of high-precision spectroscopy. Such spectroscopy is necessary for good fundamental parameter and abundance estimation as well as for mode identification of the detected pulsation frequencies. The second supergiant monitored from space is the B6Ia star HD 50064, which was observed by CoRoT for 137 d and followed up with high-resolution spectroscopy covering a time base of 169 d (Aerts et al. 2010b). This supergiant was found to have a variable-amplitude monoperiodic radial strange-mode pulsation with a period of 37 d, which is connected with the variable mass loss of the star. While its monoperiodic character did not allow asteroseismic tuning of its interior structure, the interpretation of the observations was recently confirmed by evolutionary model computations for He-core burning models re-entering a blue loop in the Hertzsprung-Russell (HR) diagram after having passed the red-supergiant phase (Saio et al. 2013). In the third case of HD 34085 (Rigel, B8Ia), the MOST light curve of 28 d was too short to uncover the oscillations found in long-term spectroscopy (Moravveji et al. 2012).
Clearly, there is a need to study supergiant pulsations in much more detail to fine-tune evolutionary models in the upper HR diagram. The Kepler mission cannot help in this respect as there are no hot massive supergiants in its fixed field of view. It is in this context that we studied the bright massive B8Ib supergiant HD 46769 as secondary asteroseismology target with CoRoT. The fundamental parameters of this star were previously derived by Lefever et al. (2007), based on high-precision spectroscopy containing H and He lines only. They obtained K, , km s-1, and . These authors also examined the Hipparcos data and did not find any significant variability. Zorec et al. (2009), on the other hand, applied the Barbier-Chalonge-Divan spectrophotometric classification method and found the effective temperature to be some 2 000 K higher. They assigned a spectral type of B7III/II to the star without providing an estimate for . In any case, irrespective of the precise effective temperature and luminosity class, the star is situated outside any known instability strip. This was also the case for HD 163899, which was originally measured by MOST as a standard star. Thus, in view of the lack of supergiant asteroseismology so far and because it was the only hot massive supergiant in the pointed fields of CoRoT, HD 46769 was selected as secondary target for the mission.
2 CoRoT light curve analysis
The supergiant HD 46769 was observed by CoRoT during a short run in the anticentre direction of the Milky Way (SRa03) in March 2010. The asteroseismology runs deliver data with a cadence of 32 s, and SRa03 lasted for 26.4 d, from HJD 2455258.426769 until HJD 2455284.802757. A strong discontinuity connected with instrumental effects (Auvergne et al. 2009) occurs in the light curve near day HJD 2455262, after which both the mean flux level and the nature of the trend in the flux changed. As such, we restricted our analysis to the last 22.7 d of the light curve, which contains 53927 data points of good quality and has a Rayleigh limit of d-1. The raw light curve shows an instrumental downward trend as present in most of the CoRoT light curves and interpreted as CCD ageing (Auvergne et al. 2009). Given that intrinsic variability occurs with a time scale similar to the duration of the data, which we do not want to affect, we only removed a linear trend before starting the frequency analysis. For the latter, we adopted the usual zero-point for the time stamps applied by the CoRoT consortium, i.e. 1 January 2000 at 12h UT, which corresponds with HJD0=2451545.0.
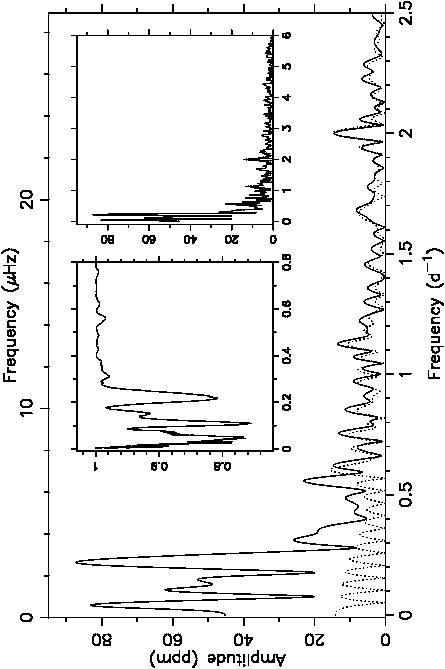
We computed both the Scargle periodogram (Scargle 1982) and the statistic in the framework of phase dispersion minimization (PDM, Stellingwerf 1978). Maximum power in the Scargle periodogram occurs at the frequency near 0.21 d-1, while reaches a minimum near 0.11 d-1 (Fig. 1). Both the Scargle and PDM periodograms also have a peak near 0.05 d-1, corresponding with a periodicity of 19.4 d. The Scargle frequency at maximum amplitude is equal to four times the one of the second highest amplitude, within the frequency resolution.
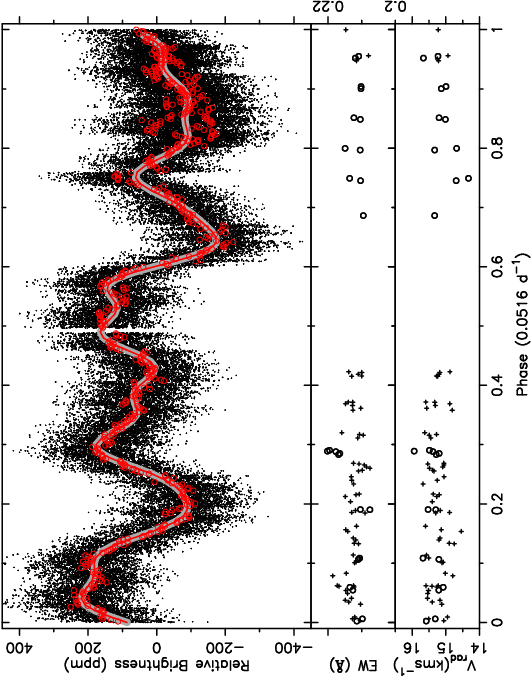
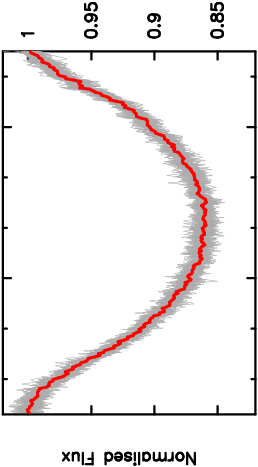
In the next section, we add the spectroscopic time series to the photometry to end up with the most likely frequency , with value d-1. We thus made a sinusoidal fit with to the light curve. Subsequent prewhitening leads, within the frequency resolution, to , , , , and respectively, reflecting the strongly non-sinusoidal shape of the light curve (Fig. 2). The frequencies in the data with a significance above 4 are listed in Table 1. After prewhitening with those frequencies, we find a residual frequency at 2 d-1. This frequency, which is well visible in Fig. 1, is a known artefact related to day-versus-night variations connected with CoRoT’s low-Earth orbit (Auvergne et al. 2009). The satellite orbital frequency itself is 13.97 d-1, and its harmonics also occur in CoRoT light curves. However, this regime in frequency is not relevant for our study of HD 46769.
| Frequency | Amplitude | Significance |
|---|---|---|
| (d-1) | (ppm) | ( noise level) |
| 67.3 | 14.0 | |
| 63.2 | 13.2 | |
| 42.9 | 8.9 | |
| 86.9 | 18.1 | |
| 44.9 | 9.4 | |
| 23.2 | 4.8 | |
| 21.4 | 4.5 | |
| 25.1 | 5.2 |
Given that the data is oversampled compared with the dominant periodicities, we repeated the frequency analysis after binning the light curve over 101, respectively 51, data points. For both cases, these binned light curves gave the same frequency results as those listed in Table 1 within the errors. The 101–binned phased light curve and its fit are shown in red in Fig. 2.
We subsequently re-analysed the Hipparcos data (Perryman 1997) of the star and did not find any significant variability. This is in agreement with the results by Lefever et al. (2007), who used HD 46769 as a constant comparison star in their study of 28 periodically variable B supergiants, whose variability they interpreted as being caused by gravity-mode pulsations. The highest peak in the Hipparcos Scargle periodogram for HD 46769 occurs near 9 d-1; however it reaches an amplitude of 4.6 mmag and is not significant in that data set. We explicitly checked that it does not occur in the CoRoT light curve. Given that the Hipparcos data can only reveal variability at a level of mmag (i.e. ppt) or higher, it is not surprising that we cannot detect the dominant frequency found in the CoRoT light curve in that data set.
We conclude that the CoRoT light curve of HD 46769 reveals it to be a monoperiodic variable with a period of 4.84 d having an amplitude of 87 ppm and that (sub-)multiples of this period also occur, representing non-sinusoidal variability undetectable by ground-based photometry. The shape of the light curve, with deep and less deep minima that re-occur, leads us to suggest that corresponds with the rotation frequency of the star. This translates into a rotation period of 9.69 d, although we cannot firmly exclude to be the rotation frequency. The stellar parameters and derived by Lefever et al. (2007) do exclude to be the rotation frequency.
3 Ground-based follow-up data
In order to reach a unique interpretation of the variability found in the CoRoT light curve, with rotation and binarity as most likely scenarios from the CoRoT photometry, we set up a follow-up spectroscopic campaign. We first made use of the HERMES spectrograph (Raskin et al. 2011) attached to the 1.2m Mercator telescope at La Palma and assembled 24 spectra spread over one year, in the period February 2010 until January 2011. The spectra have a high resolving power of and a typical average signal-to-noise ratio (S/N) between 100 and 200 in the wavelength range . At first sight, these data excluded binarity and did not reveal any long-term periodic spectroscopic variability. To enhance the detection capabilities and search for short-period variability as found in the CoRoT light curve, the star was subsequently included in the HARPS Large Programme for the ground-based preparatory and follow-up observations for the CoRoT space mission for more intensive monitoring of several spectra per night during a 25-day campaign. This led to an additional data set of 62 spectra taken in the HARPS HAM mode (resolving power of 115 000), assembled in December 2012 – January 2013. These spectra are of similar S/N as the HERMES spectra. For both campaigns, the exposure time was of the order of a few minutes and was adapted to the atmospheric conditions. We refer to Table 2 for a summary of the spectroscopic observations.
The pipeline-extracted spectral orders of the HARPS measurements were merged and treated together with the pipeline-reduced HERMES exposures. All spectra were normalised following the procedures developed and outlined in Pápics et al. (2011, 2012, 2013). The HERMES and HARPS spectra were found to be fully compatible with each other and could be merged into a single time series data set with a total time span of 1057 d, leading to a Rayleigh limit of 0.00095 d-1. From these data, we can exclude that HD 46769 is a binary with an orbital period below several thousands of days.
| Telescope | Instrument | Wavelength Range | HJD start | HJD end | N | S/N range | |
|---|---|---|---|---|---|---|---|
| 1.2m Mercator, La Palma | HERMES | Å | 5240.472 | 5581.636 | 24 | 85 000 | 100 – 200 |
| 3.6m ESO, La Silla | HARPS | Å | 6272.664 | 6297.825 | 62 | 115 000 | 120 – 250 |
3.1 Fundamental parameters and abundances

The average HERMES spectrum was used for spectral classification and for the determination of the fundamental parameters and abundances of the star in a comparison with the two spectroscopic standards: HD 184930 (B5 III, Lesh et al. 1968) and HD 191243 (B5 Ib, Morgan et al. 1955). For each of these standards we took one HERMES spectrum. Although Lesh (1968) classified HD 46769 as B8Ib star, our spectra lead us to suggest a spectral type of B5II. This is illustrated in Fig. 3, where we show one HERMES spectrum of HD 46769 downgraded to a resolution of 4000, which is often used for spectral classifications, along with the single HERMES spectrum that we obtained for each of the two spectroscopic standards. The wings of the Balmer lines, as well as the Si ii/He i and Mg ii/He i line ratios, lead to B5II, although the underabundance of Si and Mg compared to the solar value as discussed below is a caveat for a clear unique assignment of spectral type (hence the question mark in Fig. 3).
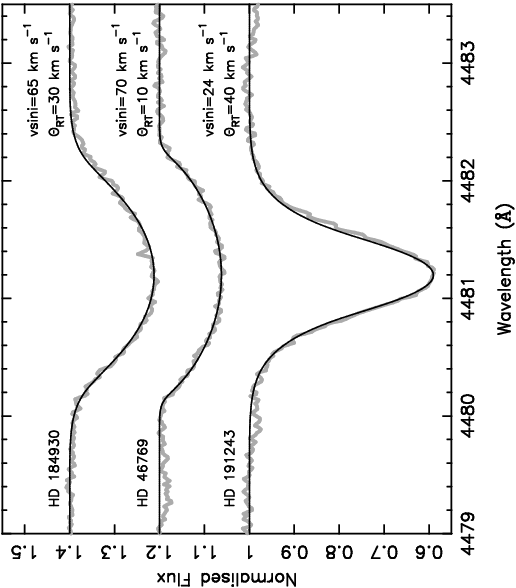
A zoom on the Mg ii line profile in a spectrum of these three stars (Fig. 4) reveals that the line profile of HD 46769 is very symmetric and mainly broadened by rotation, while the line profiles of HD 184930 and HD 191243 are slightly asymmetric and have broader wings. The latter phenomenon is often ascribed to the so-called macroturbulent broadening of hot stars (e.g. Howarth et al. 1997, Ryans et al. 2002, Lefever et al. 2007, Markova & Puls 2008, Simón-Díaz et al. 2010, Simón-Díaz 2011). We derived the rotational broadening, , and the macroturbulent broadening assuming an anisotropic radial-tangential model described by , following the definition by Gray (2005), as implemented by Simón-Díaz & Herrero (2007) and further developed by one of us (SSD). This most recent procedure is based on a combined Fourier transform and profile fitting analysis, which consider rotational and macroturbulent broadening in addition to the intrinsic line broadening and the instrumental broadening due to the characteristics of the spectrograph. The derived values are indicated in Fig. 4 for the three stars. Ignoring macroturbulent broadening for HD 46769 still gives a good fit to the Mg ii line if the is increased by 2 km s-1. However, it leads to far too narrow wings for the other two stars.
We used the stellar atmosphere code FASTWIND (Santolaya-Rey et al. 1997, Puls et al. 2005) to perform a quantitative spectroscopic analysis of HD 46769 and the two standards, as well as to determine their stellar parameters and abundances. The atomic models presently available for FASTWIND computations are Si , Mg , C , N , and O . The stellar parameter and abundance determinations were done in a two-step process, following an automatic spectroscopic synthesis strategy similar to the one described in Castro et al. (2012). We used a precomputed grid of FASTWIND synthetic spectra, which included lines of H , He i-ii, C ii-iii, N ii, O ii-iii, Si ii-iv, and Mg ii. More information about the grid characteristics, coverage, and model atoms incorporated in our FASTWIND computations can be found in Castro et al. (2012). Table 3 summarizes the main diagnostic lines considered here. The optical spectrum of HD 46769 includes two ionization stages for the element Si only, but the Si iii triplet near 4567Å is very weak. Hence, for the determination of the effective temperature we relied on the dependencies of the lines of the available ions of this stellar parameter. In particular, we have found the He i lines, in combination with H , to be the best diagnostics due to their strong dependence on and weak dependence on gravity for mid-B stars.
| Spectral lines (Å) | |
| H | H, H, H, H |
| He i | 4026, 4387, 4471, 4713, 4922, 5015, 5048, 5875, 6678 |
| Si ii | 3856/62, 4128/30, 5041/56, 6347/71 |
| Si iii | 4552, 4567, 4574 |
| C ii | 4267, 6578/82 |
| Mg ii | 4481 |
| O ii | 4414/16/52, 4317/19/66, 4641/50/61 |
| N ii | 3995 |
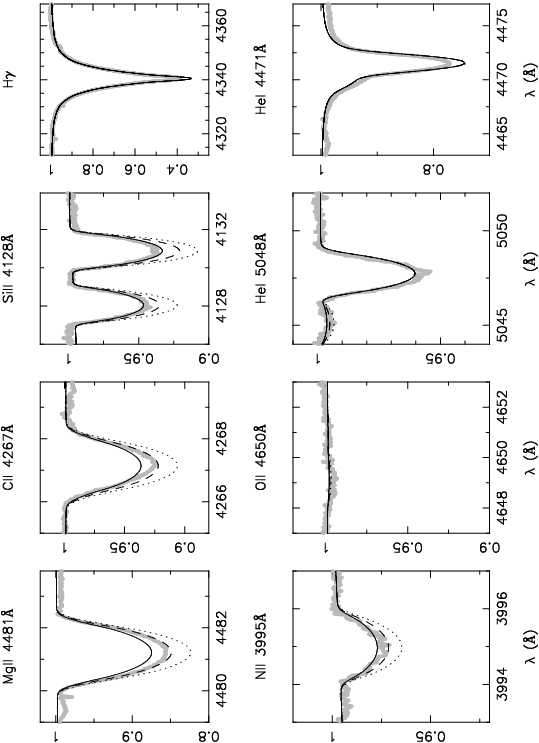
In a first step, we derived the stellar parameters of the star, giving more weight to the H and He i lines and scaling the abundances of the other elements to the metallicity of the models. The gravity was determined from the H line. In a second step, we performed the abundance analysis. The stellar parameters were fixed to the values derived in step 1, and the abundances of C , N , O , Si , and Mg were varied independently to create a set of synthetic spectra used for comparison with the observed spectra. In order to have consistency in the comparison for the three stars, we used only one HERMES spectrum for each of them. The results of this analysis are summarised in Table 4. The derived stellar parameters for HD 46769 are in very good agreement with those determined by Lefever et al. (2007). This is as expected, since we used the same stellar atmosphere code and spectroscopic analysis techniques but our work is based on more extended and higher quality spectra. Some line fits for our target star are shown in Fig. 5.
| Parameter | HD 46769 | HD 191243 | HD 184930 | Solar | B stars in solar neighbourhood |
|---|---|---|---|---|---|
| (K) | 13 0001 000 | 14 0001 000 | 13 0001 000 | — | — |
| 2.70.1 | 2.50.1 | 3.50.1 | — | — | |
| Si | -5.49 | -4.30 | -5.10 | -4.45 | -4.50 |
| Mg | -5.47 | -4.60 | -5.10 | -4.36 | -4.43 |
| C | -4.11 | -3.30 | -3.80 | -4.53 | -3.65 |
| N | -3.92 | -3.80 | — | -4.13 | -4.18 |
| O | — | -3.30 | — | -3.27 | -3.23 |
We find an underabundance of Mg and Si with 0.9 dex compared to the solar values (Asplund et al. 2009) with 0.2 dex compared to the Si and Mg abundances of B-type stars in the Orion nebula (Simón-Díaz 2010; Nieva & Simón-Díaz 2011) and, more generally, in the solar neighbourhood (Nieva & Przybilla 2012). While HD 191243 has essentially solar abundances, HD 184930 is also Mg and Si depleted, but less so than HD 46769. We also investigated the impact of the uncertainties in and on the derived abundances and found that a variation of 1000 K and 0.1 dex in both parameters leads to a maximium variation of 0.2 dex in the Si and Mg abundances. This is well below the variation needed to bring the measured Mg and Si abundances derived for HD 46769 in agreement with the solar values.
We come to the conclusion that HD 46769 is an evolved, moderately rotating ( km s-1) B5II star with a normal He abundance but with an underabundance of 0.9 dex in Mg and Si . On the main sequence, such Si and Mg deficiencies occur in the so-called HgMn stars (e.g. Smith 1993), which are slow rotators with accompanying strong overabundances in elements such as Hg , Mn , Cr , Ti , and Y . They are, however, underabundant in He . These properties are interpreted in terms of atomic diffusion processes, more particularly the competition between gravitational settling and radiative levitation. It remains unsure whether binarity and/or magnetic fields play a role in the creation and time-evolution of the chemical spots on the surface (e.g. Briquet et al. 2007, 2010; Kochukhov et al. 2011, Hubrig et al. 2012). We checked explicitly for Mn and Hg lines in the average spectrum of HD 46769, but could not detect any. Other than the HgMn stars, also Bp stars exhibit surface spots of elements such as He and Si , giving rise to periodic mmag-amplitude photometric variations and clear line-profile variability with periodicities of days (e.g. Briquet et al. 2004). Below, we investigate if HD 46769 is a line-profile variable.
3.2 Time series analysis
In order to search for short-term periodicity in the spectroscopy and compare it with the detected photometric variability, we first did a visual inspection of the line profiles of various chemical elements in the observed spectra for the lines listed in Table 3, as well as some additional metal lines. This did not reveal any obvious variability in the line profile shapes. In order to quantify the line-profile variations, we performed a line-profile analysis by means of line moments (e.g. Aerts et al. 1992 and Briquet & Aerts 2003) and the pixel-by-pixel method (Zima 2006). We refer to Aerts et al. (2010a, Chapter 6) for full details of such analyses. An important aspect of such applications is the selection criterion to identify the best spectral lines, particularly when line variability is not obvious by visual inspection. In practice, one looks for the least blended lines with considerable strength and least affected by pressure broadening and effective temperature variations; see De Ridder et al. (2002) and Aerts & De Cat (2003) for thorough discussions on these issues for line-profile studies of confirmed pulsating B stars. For the effective temperature of HD 46769 and from the gathered spectroscopy, we identified the Mg ii doublet near 4481Å as best suited in terms of S/N level, followed by the C ii doublet near 4267Å and the Si ii doublet near 4130Å. We show the results obtained for the Mg ii, which are completely confirmed by the other metal lines.
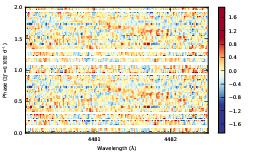
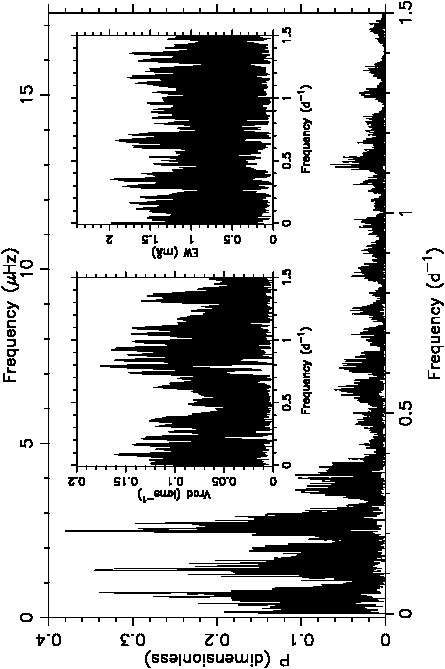
Fig. 6 shows the time series of the Mg ii line deduced from the HARPS spectra, along with the time-average profile of that line and the residuals after subtraction of the average represented in a colour-scale plot phased according to the most likely rotation period of the star. It can be seen that no line patterns stand out. This was also the conclusion from a 2D frequency analysis with the pixel-by-pixel method done with the software package FAMIAS (Zima 2008). Subsequently, we resorted to dedicated quantities to study line-profile variability, according to the definition by Aerts et al. (1992). The time series of the zeroth-order moment (which is the equivalent width of the line, further abbreviated as EW) and the first moment (indicated as since it is connected with the radial velocity) derived from the Mg ii line deduced for all 86 HERMES and HARPS spectra are shown in Fig. 2, where they were phased with the dominant frequency found in the CoRoT light curve. The outcome of the Scargle periodograms for the EW and are shown as insets in Fig. 7. Both these figures illustrate again that HD 46769 does not reveal obvious periodic spectroscopic variability over a total time base of 1057 d. Noteworthy is that the maximum frequency peak in corresponds with within the frequency resolution, having an amplitude of 0.150.05 km s-1 at 2.3. We cannot relate any of the highest peaks in the Scargle periodogram of the EW to the photometric frequencies. Enforcing a fit with one of the photometric frequencies leads to the highest amplitude for , but the least-squares fit gives an insignificant amplitude estimate at only 1.9.
Even though the frequency or its multiples is not significantly present in the spectroscopy alone, we can still check if its behaviour is consistent with the CoRoT data or is only connected with noise. We thus applied the same analysis as already done by Aerts et al. (2006) in their search for low-amplitude variability in the Cep star Ceti by combining MOST and Hipparcos space photometry with ground-based spectroscopy. Since we expect flux variations to occur in both the photometry and in the EW of specral lines, we multiplied the EW Scargle periodogram with the one of the CoRoT and of the Hipparcos data, after dividing each of those three Scargle periodograms by their maximum, i.e. we computed
In this way, we give equal weight to the CoRoT, Hipparcos, and HERMES+HARPS data in the search for consistent frequencies in those three completely independent data sets. The idea is that all the peaks due to noise will keep on producing a noisy periodogram after multiplication of the normalized periodograms. In contrast, peaks that are consistently present in the data, even though not significantly above the noise level in the individual Scargle periodograms, will still keep a value that is clearly above the noise level when full compatibility between the three Scargle periodograms occurs. Prior to normalization, the Scargle periodograms were computed with a frequency step according to the best Rayleigh limit, which occurs for the Hipparcos data set. The outcome of this product of the three normalized Scargle periodograms, which is a dimensionless quantity with a value between zero (bad frequency) and one (frequency dominant in all three independent data sets), is shown in the main panel of Fig. 7. It can be seen that three sets of peaks stand out, i.e. that the frequencies deduced from the CoRoT light curve “survive” this consistency test. These occur at 0.2063, 0.1083, and 0.0522 d-1, where the first one coincides with and all three are equal to the frequencies in the CoRoT data listed in Table 1 within the frequency resolution. Hence, the spectroscopy and Hipparcos data by themselves do not reveal significant frequencies but are consistent with the low-amplitude periodic variability detected in the CoRoT light curve.
3.3 Spectropolarimetric measurements
Given the photometric variability and the abundance pattern of HD 46769, as well as the debate about the role of magnetic fields in chemically anomalous rotationally variable main-sequence stars, we made use of the Narval spectropolarimeter installed at the 2 m TBL telescope at the Pic du Midi in France to search for the presence of a magnetic field in HD 46769. On December 2012 we obtained two Stokes V spectra computed by constructively combining four subexposures of 900 seconds, each taken in different configurations of the polarimeter wave plates. The data reduction was performed using libre-esprit (Échelle Spectra Reduction: an Interactive Tool; Donati et al. 1997).
For each of the two measurements, we applied the least-squares deconvolution (LSD) technique (Donati et al. 1997) to the photospheric spectral lines in the whole échelle spectrum (Å) in order to construct single averaged Stokes I and V profiles with an increased S/N ratio. To this end, we used a mask including photospheric He and metal lines of various chemical elements, which we created from the Kurucz atomic database and ATLAS 9 atmospheric models of solar abundance (Kurucz 1993) for Teff=13000 K and =3.0, with intrinsic line depths larger than 0.1. Two adjustments were applied to the original mask. First, we removed lines from the mask that are not suited for the LSD analysis, i.e. those that are blended with the Balmer lines or with atmospheric telluric lines and weak lines that are indistinguishable from the noise. Second, the relative depths of all spectral lines used in the mask were modified to correspond to those of the observed spectral lines. The final mask contains 311 lines, and the two resulting LSD Stokes V profiles have S/N values of 5864 and 5309 per 2.6 km s-1 pixels. A visual inspection of each of them shows no signature of a magnetic field.
We used the LSD Stokes I and V profiles to compute the line-of-sight component of the magnetic field integrated over the visible stellar surface, i.e. the longitudinal magnetic field in Gauss, given e.g. by Eq. (1) of Wade et al. (2000). In this equation we used a mean wavelength =500 nm and a mean Landé factor =1.13. For the integration limits, a range of 70 km s-1 around the line centre was adopted. We obtained longitudinal field values of =-9.421.0 G and =22.122.9 G at Mid-HJD1=2456271.657354 and Mid-HJD2=2456272.627450, respectively, i.e. the longitudinal field values are consistent with the absence of a magnetic field.
As we only have two measurements available, we cannot definitely exclude the presence of a field in the star. Indeed, it is possible that a magnetic field exists with a strength below our detection level. Therefore we performed a Monte Carlo analysis of the spectropolarimetric data to derive the upper limit of the polar magnetic field that could be present at the surface of HD 46769.
To perform our simulation we assumed a centred oblique dipole field model, for which the free parameters are the stellar inclination angle (in degrees), the magnetic obliquity angle (in degrees), the dipole magnetic intensity (in Gauss), and a phase shift compared to the adopted stellar ephemeris. In our model, we use Gaussian local intensity profiles with a width calculated using the resolving power of Narval and a line-broadening value of 20 km s-1, representing the overall effect of the intrinsic line widths as well as micro- and macroturbulence. The depth is determined by fitting the observed LSD Stokes I profiles. The local Stokes V profiles are calculated assuming the weak-field case and using the weighted mean Landé factor and wavelength of the lines derived from the LSD mask (see above). The synthetic Stokes V profiles are obtained by integrating over the visible stellar surface by using a linear limb-darkening law with a parameter equal to 0.386 (Claret & Bloemen 2011). The Stokes V profiles are normalised to the continuum intensity.
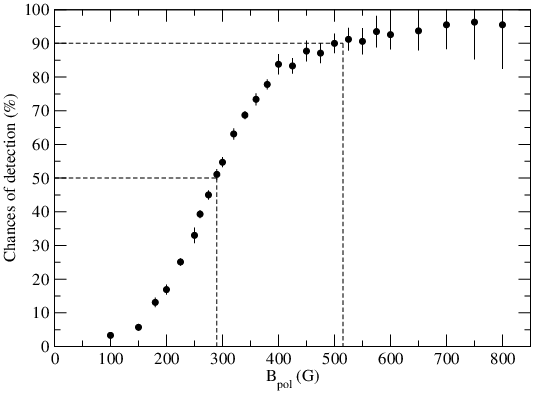
We considered the two possible values for the rotation period 4.84 or 9.69 d and various values for the polar field strength. We then simulated 1000 dipole models with random values of , , and for each value. We simulated the two Stokes V profiles simultaneously with a noise corresponding to the S/N ratio of the Narval data. We then computed among each set of 1000 models the chances of detecting the field in at least one of the two measurements. We find that there was a 50% (90%) chance of detection at 3 of a field with any oblique dipolar configuration and a polar strength above 290 G (515 G) for the case of 9.69 d. This is illustrated in Fig. 8, where we show the probability of detection of a field according to its strength in at least one of the two available measurements of HD 46769, assuming 9.69 d. Results are similar, whichever of the two possible rotation periods we consider.
We conclude that an oblique magnetic dipole field of a few hundred Gauss at the poles could be present while it remained undetected in the two Narval measurements. A stronger magnetic field can be excluded, unless the hypothetical field were more complex than dipolar. However, for massive non-Bp stars, detected fields are usually observed to be dipolar (e.g. Neiner et al. 2003) and also theoretically predicted to be dipolar (Duez & Mathis 2010). Non-dipolar examples (e.g. Kochukhov et al. 2011) remain very rare so far. Our results are consistent with the scarcity of magnetic fields in OBA supergiants, despite intensive efforts to detect them (e.g. Verdugo et al. 2003, Hubrig et al. 2013, Shultz et al. 2013).
4 Discussion
All the data taken together lead us to conclude that HD 46769 is a low-amplitude, rotationally modulated, photometrically variable B5II supergiant. The photometric variability of some 100 ppm level is interpreted in terms of low-contrast chemical and/or temperature inhomogeneities. This gives rise to rotational modulation in the light curve, which remains undetectable in high-precision spectroscopy alone.
The fundamental parameters of the star place it just outside pulsational instability regions in the diagram (e.g. Fig. 10 of Lefever et al. 2010), although the error bars cover the red edge of excited gravity modes computed by Saio et al. (2006). Despite the absence of pulsations with a detection threshold of some 10 ppm in photometric precision, the star is an interesting object for its underabundance in Mg and Si, and also in the context of the occurrence of macroturbulence in evolved massive stars whose physical cause remains unknown. Indeed, HD 46769 is a moderate rotator, and its spectral lines have very sharp wings in comparison with more luminous stars of similar temperature. We found an anisotropic radial-tangential macroturbulence of less than 10 km s-1, i.e. far lower than the projected rotational velocity broadening. A good fit to the line wings would also be achieved without considering macroturbulent broadening, increasing the by only a few km s-1. In contrast, to be able to explain their spectral line wings, the majority of the evolved variable B supergiants require large macroturbulent velocities, several of which are supersonic and above the rotational velocity. Aerts et al. (2009) suggested that the detected high level of macroturbulence needed to explain the line wings of massive supergiants in high-precision spectroscopy could be due to the collective effect of numerous low-amplitude gravity-mode pulsations, which are unresolved individually and give rise to a global line broadening in single-snapshot spectra. This idea is currently being investigated in more detail from a systematic long-term observational study of a large sample of OB-type stars from high-precision time-series spectroscopy (e.g. Simón-Díaz et al. 2010, 2012 and its follow-up work, in preparation). Our results for the case of HD 46769 are consistent with this interpretation in the sense that it concerns an evolved non-pulsating B-type supergiant with sharp line wings, for which macroturbulence does not need to be invoked to get a good fit of the spectral line wings.
Acknowledgements.
The authors thank the MiMeS collaboration for having provided Narval observations. The research leading to these results received funding from the ERC under the European Community’s 7th Framework Programme (FP7/2007–2013)/ERC grant agreement n∘227224 (PROSPERITY), as well as from the Belgian Federal Science Policy Office BELSPO (C90309: CoRoT Data Exploitation). SS-D thanks I. Negueruela for an interesting discussion about the spectral classification of HD 46769 and acknowledges financial support from the Spanish Ministry of Economy and Competitiveness (MINECO) under the grants AYA2010-21697-C05-04, Consolider-Ingenio 2010 CSD2006-00070, Severo Ochoa SEV-2011-0187, and by the Canary Islands Government under grant PID2010119. E.P. and M.S. acknowledge financial support from the Italian PRIN-INAF 2010 Asteroseismology: looking inside the stars with space- and ground-based observations. M.R. acknowledges financial support from the FP7 project SPACEINN: Exploitation of Space Data for Innovative Helio- and Asteroseismology.References
- (1)
- (2) [] Aerts, C., Christensen-Dalsgaard, J., Kurtz, D. W., 2010a, Asteroseismology, Springer-Verlag, Heidelberg, ISBN 978-1-4020-5178-4
- (3)
- (4) [] Aerts, C., De Cat, P. 2003, SSRv, 105, 453
- (5)
- (6) [] Aerts, C., De Pauw, M., Waelkens, C. 1992, A&A, 266, 294
- (7)
- (8) [] Aerts, C., Lefever, K., Baglin, A., et al. 2010b, A&A, 513, L11
- (9)
- (10) [] Aerts, C., Marchenko, S. V., Matthews, J., et al. 2006, ApJ, 642, 470
- (11)
- (12) [] Aerts, C., Puls, J., Godart, M., Dupret, M.-A. 2009, A&A, 508, 409
- (13)
- (14) [] Asplund, M., Grevesse, N., Sauval, A. J., Scott, P. 2009, ARA&A, 47, 481
- (15)
- (16) [] Auvergne, M., Bodin, P., Boisnard, L., et al. 2009, A&A, 506, 411
- (17)
- (18) [] Beck, P. G., Montalbán, J., Kallinger, Th., et al. 2012, Nat, 481, 55
- (19) [] Bedding, T. R., Mosser, B., Huber, D., et al. 2011, Nat, 471, 608
- (20)
- (21) [] Briquet, M., Aerts, C. 2003, A&A, 398, 687
- (22)
- (23) [] Briquet, M., Aerts, C., Baglin, A., et al. 2011, A&A, 527, A112
- (24)
- (25) [] Briquet, M., Aerts, C., Lüftinger, T., et al. 2004, A&A, 413, 273
- (26)
- (27) [] Briquet, M., Hubrig, S., De Cat, P., et al. 2007, A&A, 466, 269
- (28)
- (29) [] Briquet, M., Korhonen, H., González, J. F., et al. 2010, A&A, 511, A71
- (30)
- (31) [] Castro, N., Urbaneja, M. A., Herrero, A., et al. 2012, A&A, 542, A79
- (32)
- (33) [] Chaplin, W. J., Miglio, A., 2013, ARA&A, in press (arXiv:1303.1957)
- (34)
- (35) [] Charpinet, S., Van Grootel, V., Fontaine, G., et al. 2011, A&A, 530, A3
- (36)
- (37) [] Claret, A., Bloemen, S. 2011, A&A, 529, A75
- (38)
- (39) [] Degroote, P., Aerts, C., Baglin, A., et al. 2010, Nat, 464, 259
- (40)
- (41) [] De Ridder, J., Dupret, M.-A., Neuforge, C., Aerts, C. 2002, A&A, 385, 572
- (42)
- (43) [] Donati J.-F., Semel, M., Carter, B. D., et al. 1997, A&A, 291, 658
- (44)
- (45) [] Duez, V., Mathis, S. 2010, A&A, 517, A58
- (46)
- (47) [] Gilliland, R. L., Brown, T. M., Christensen-Dalsgaard, J., et al. 2010, PASP, 122, 131
- (48)
- (49) [] Gray, D. F. 2005, The Observation and Analysis of Stellar Photospheres, 3rd Edition, Cambridge University Press
- (50)
- (51) [] Howarth, I. D., Siebert, K. W., Hussain, G. A. J., Prinja, R. K. 1997, MNRAS, 284, 265
- (52)
- (53) [] Huat, A.-L., Hubert, A.-M., Baudin, F., et al. 2009, A&A, 506, 95
- (54)
- (55) [] Hubrig, S., González, J. F., Ilyin, I., et al. 2012, A&A, 547, A90
- (56)
- (57) [] Hubrig, S., Schöller, M., Ilyin, I., et al. 2013, A&A, 551, A33
- (58)
- (59) [] Kochukhov, O., Lundin, A., Romanyuk, I., Kudryavtsev, D. 2011, ApJ, 726, 24
- (60)
- (61) [] Kudritzki, R.-P., Puls, J. 2000, ARA&A, 38, 613
- (62)
- (63) [] Kurucz, R. L., 1993, ATLAS9 Stellar Atmosphere Programs and 2 km/s grid, CD-ROM No. 13, Cambridge, Mass., Smithsonian Astrophysical Observatory
- (64)
- (65) [] Lefever, K., Puls, J., Aerts, C. 2007, A&A, 463, 1097
- (66)
- (67) [] Lefever, K., Puls, J., Aerts, C., et al. 2010, A&A, 515, A74
- (68)
- (69) [] Lesh, J. R. 1968, ApJS, 17, 371
- (70)
- (71) [] Markova, N., & Puls, J. 2008, A&A, 478, 823
- (72)
- (73) [] Moravveji, E., Guinan, E., Shultz, M., et al. 2012, ApJ, 747, 108
- (74)
- (75) [] Michel, E., Baglin, A., 2012, Proceedings of the Second CoRoT Symposium, arXiv1202.1422
- (76)
- (77) [] Michel, E., Baglin, A., Auvergne, M., et al. 2008, Sci, 322, 558
- (78)
- (79) [] Morgan, W. W., Code, A. D., & Whitford, A. E. 1955, ApJS, 2, 41
- (80)
- (81) [] Neiner, C., Geers, V. C., Henrichs, H. F., et al. 2003, A&A, 406, 1019
- (82)
- (83) [] Nieva, M.-F., & Przybilla, N. 2012, A&A, 539, A143
- (84)
- (85) [] Nieva, M.-F., & Simón-Díaz, S. 2011, A&A, 532, A2
- (86)
- (87) [] Pápics, P. I., Briquet, M., Auvergne, M., et al. 2011, A&A, 528, A123
- (88)
- (89) [] Pápics, P. I., Briquet, M., Baglin, A., et al. 2012, A&A, 542, A55
- (90)
- (91) [] Pápics, P. I., Tkachenko, A., Aerts, C., et al. 2013, A&A, 553, A127
- (92)
- (93) [] Perryman, M. A. C., 1997, The HIPPARCOS and TYCHO catalogues. Astrometric and photometric star catalogues derived from the ESA HIPPARCOS Space Astrometry Mission, ESA SP Series, Volume 1200, ISBN 9290923997
- (94)
- (95) [] Puls, J., Urbaneja, M. A., Venero, R., et al. 2005, A&A, 435, 669
- (96)
- (97) [] Raskin, G., Van Winckel, H., Hensberge, H., et al. 2011, A&A, 526, A69
- (98)
- (99) [] Ryans, R. S., Dufton, P. L., Rolleston, W. R. J., et al. 2002, MNRAS, 336, 577
- (100)
- (101) [] Saio, H., Georgy, C., Meynet, G. 2013, MNRAS, 433, 1246
- (102)
- (103) [] Saio, H., Kuschnig, R., Gautschy, A., et al. 2006, ApJ, 650, 1111
- (104)
- (105) [] Santolaya-Rey, A. E., Puls, J., Herrero, A. 1997, A&A, 323, 488
- (106)
- (107) [] Scargle, J. D. 1982, ApJ, 263, 835
- (108)
- (109) [] Shultz, M., Wade, G. A., Petit, V., et al. 2013, MNRAS, submitted
- (110)
- (111) [] Simón-Díaz, S. 2010, A&A, 510, A22
- (112)
- (113) [] Simón-Díaz, S. 2011, Bulletin de la Société Royale des Sciences de Liège, 80, 86
- (114)
- (115) [] Simón-Díaz, S., Castro, N., Herrero, A., et al. 2012, ASPC, 465, 19
- (116)
- (117) [] Simón-Díaz, S., & Herrero, A. 2007, A&A, 468, 1063
- (118)
- (119) [] Simón-Díaz, S., Herrero, A., Uytterhoeven, K. et al. 2010, ApJ, 720, 174
- (120)
- (121) [] Smith, K. C. 1993, A&A, 276, 393
- (122)
- (123) [] Stellingwerf, R. F. 1978, ApJ, 224, 953
- (124)
- (125) [] Trundle, C., Dufton, P. L., Hunter, I., et al. 2007, A&A, 471, 625
- (126)
- (127) [] Verdugo, E., Talavera, A., Gómez de Castro, A. I., Henrichs, H. F. 2003, IAUS212, 255
- (128)
- (129) [] Wade, G. A., Donati, J.-F., Landstreet, J. D., Shorlin, S. L. S. 2000, MNRAS, 313, 851
- (130)
- (131) [] Walker, G., Matthews, J. Kuschnig, R., et al. 2003, PASP, 115, 1023
- (132)
- (133) [] Zima, W. 2006, A&A, 455, 227
- (134)
- (135) [] Zima, W. 2008, CoAst, 155, 17
- (136)
- (137) [] Zorec, J., Cidale, L., Arias, L., et al. 2009, A&A, 501, 297
- (138)